CECILIA: Direct O, N, S, and Ar Abundances in Q2343-D40, a Galaxy at 3
Abstract
Measurements of chemical abundances in high- star-forming (SF) galaxies place important constraints on the enrichment history of massive stars and the physical conditions in the early universe. JWST is beginning to enable direct chemical abundance measurements in galaxies at 2 via the detection of the faint Te-sensitive auroral line [O III]4363. However, direct abundances of other elements (e.g., S and Ar) in high- galaxies remain unconstrained due to a lack of Te data and wavelength coverage. Here, we present multiple direct abundances in D40, a galaxy at 3 observed with JWST/NIRSpec as part of the CECILIA program. We report the first simultaneous measurement of Te[O III] and Te[S III] in a high- galaxy, finding good agreement with the temperature trends in local SF systems and photoionization models. We measure a gas-phase metallicity of 12+log(O/H) dex, and an N/O abundance indicative of primary nucleosynthesis. The S/O abundance in D40 is slightly sub-solar but consistent with local H II regions. In contrast, the log(Ar/O) in D40 is 2.710.09 dex, sub-solar by 2. The [Ar III]7135 intensities of D40 and other CECILIA galaxies are similar to those of local SF systems with Ar-deficient interstellar media, suggesting that low gas-phase Ar abundance is common in high- galaxies. Recent nucleosynthesis models find that Ar is produced in Type Ia supernovae: if low Ar/O is consistently observed in high- SF galaxies, it would provide further observational evidence that early galaxies are enriched primarily by core-collapse supernovae, which produce enhanced O relative to Ar and Fe.
1 Introduction
The buildup of heavy elements is a direct consequence of galaxy evolution. Episodes of star formation produce massive stars that enrich the interstellar medium (ISM) with the products of stellar nucleosynthesis. These metals mix with the ISM and accreting gas, resulting in an increased gas-phase abundance that is imprinted in the next generation of stars. Therefore, the gas-phase metal abundance is sensitive to the past star formation, gas inflows and outflows, and ISM mixing mechanisms (e.g., Tosi, 1988; Roy & Kunth, 1995; Berg et al., 2019). Chemical abundance trends are of particular importance at high-, as they provide insight into the gas-phase conditions in the early universe that eventually result in the galaxy scaling relations observed today (such as the mass-metallicity relation, Lequeux et al., 1979; Tremonti et al., 2004; Erb et al., 2006).
The relative abundance of different elements provides insight into nucleosynthetic mechanisms that operate on different timescales and the star-formation history of a galaxy. For instance, O is produced in massive stars and released to the ISM on short timescales via core-collapse supernovae (CCSN), such that gas-phase O/H traces the enrichment from massive stars. Massive stars also synthesize elements like Ne, S, and Ar via the process. If this is the principal process by which these elements are produced, then the relative element abundances (e.g., Ne/O) will be independent of the gas-phase metallicity. While N is also synthesized in massive stars, N has a secondary, metallicity-sensitive enrichment mechanism from intermediate-mass stars (Henry et al., 2000). Consequently, the N/O relative abundance is dependent on the enrichment from stars of different masses and the overall metallicity of the ISM. Finally, Fe is produced in CCSN and Type Ia SNe, although the timescale required for Type Ia enrichment is much longer than CCSN. This combination makes Fe/H sensitive to the prior star-formation history, and the /Fe ratio is dependent on the relative enrichment of CCSN and Type Ia SNe.
Reliable chemical abundances can be measured from the collisionally-excited lines (CELs) of metal ions in the ISM. The relative intensity of two CELs originating from different energy levels in the same metal ion is sensitive to the gas-phase physical conditions such as the electron gas temperature Te and electron density ne. With these conditions, ionic abundances in the ISM can be directly calculated from the intensity and emissivity of metal CELs. While the intense “nebular” CELs can consistently be observed even in high- nebulae (e.g., Bunker et al., 2023; Nakajima et al., 2023; Williams et al., 2023), the “direct” abundance method (Dinerstein, 1990) relies on the simultaneous measurement of these CELs and faint, Te-sensitive auroral lines in the rest-frame optical. Despite observational challenges associated with this technique, the direct method has been applied in a variety of astrophysical systems and continues to be an important and successful tool for understanding the chemical enrichment of the local universe (e.g., Kennicutt et al., 2003; Esteban et al., 2004; Bresolin, 2011; Berg et al., 2015; Arellano-Córdova et al., 2020).
Until recently, the direct abundance method was difficult to apply in distant sources. At 1, the strong [O III] CELs redshift into the near-infrared (NIR) and the [O III] auroral line becomes exceedingly faint in low surface brightness sources. The same is true for the rest-frame NIR lines of [S III] and [Ar III]: the highest redshift measurements of S2+/H+ and Ar2+/H+ using these emission lines are in ionized regions at 0.3 (e.g., Izotov et al., 2021) and 0.1 (Dors et al., 2023), respectively. Transmission windows in the NIR have permitted the measurement of Te[O III] and O/H in galaxies at 1 (see samples in Sanders et al., 2020; Clarke et al., 2023), but statistically significant samples of direct O/H abundances (let alone abundances from other elements such as N and S) are challenging to acquire using ground-based facilities.
However, with the NIR capabilities of the James Webb Space Telescope (JWST), direct Te measurements and abundances are now readily accessible in high- galaxies (e.g., Arellano-Córdova et al., 2022a; Schaerer et al., 2022; Trump et al., 2023; Sanders et al., 2023a; Laseter et al., 2023). While these studies have started to uncover the chemical abundance patterns in the early universe, the current scope of high- chemical abundances is still fairly limited. First, it is often the case that only a single auroral line, [O III]4363, is available in the spectra of high- star-forming galaxies. The Te[O III] measurement obtained with [O III]4363 primarily reflects the gas containing high-ionization ions such as O2+ and Ne2+, and a lack of Te in other ionization zones can significantly bias direct abundance measurements (Arellano-Córdova & Rodríguez, 2020; Rogers et al., 2022). [O II] auroral lines have been detected in 2 galaxies by Sanders et al. (2023c), but a direct measure of Te[S III] characterizing the gas containing ions such as Ar2+ and S2+ has not been made in a galaxy at 0.2. Second, these prior surveys have mostly focused on the gas-phase O/H abundance and the relative Ne/O abundance if [Ne III]3868 is detected. Measuring the abundance of other elements (e.g., N, S, and Ar) in high- galaxies requires both deep spectroscopy and broad NIR wavelength coverage.
The CECILIA program (Strom et al., 2023) is poised to contribute detailed measurements of high- Te and ionic abundances from numerous ions. CECILIA uses the G235M and G395M gratings of NIRSpec and targets star-forming galaxies at 2 for ultra-deep NIR spectroscopy, enabling the detection of the [S III]6312 and [O II]7320,7330 auroral lines and strong NIR lines of [N II], [S II], [S III], and [Ar III]. Within this sample, the galaxy Q2343-D40 (hereafter D40) is of particular interest. Owing to D40’s spectroscopic redshift of 3, simultaneous measurements of Te[O III], Te[S III], and robust ionic abundances are possible from the NIRSpec data. Here, we report the physical conditions (Te[O III], Te[S III], and ne[S II]) and chemical abundances of O, N, S, and Ar in D40, a star-forming galaxy 2 Gyr after the Big Bang. This manuscript is organized as follows: in §2 we briefly summarize the data reduction, emission line fitting, and reddening corrections applied to the D40 spectrum; the Te, ne, ionic abundance, ionization correction factors (ICFs), and total abundance calculations are described in §3; we compare D40’s direct abundance trends to local star-forming systems and discuss these findings in §4; we summarize our conclusions in §5. In this work, we assume a CDM cosmology with 70 km s-1 Mpc-1, 0.3, and 0.7.
2 Observations and Reduction
D40 was observed as part of the CECILIA program, which targeted UV-selected star-forming galaxies in the Keck Baryonic Structure Survey (KBSS, Steidel et al., 2010; Rudie et al., 2012; Trainor et al., 2015; Strom et al., 2017). We briefly highlight the most important aspects of the observations here and refer the reader to Strom et al. (2023) for the details concerning sample selection, exposure time requirements, and data reduction. Two NIRSpec grating combinations were used: G235M (1000, 1.663.07m) data were acquired with a 29.5 hour exposure time to reliably detect the [S III]6312 and [O II]7320,7330 auroral lines; G395M (1000, 2.875.10m) data, necessary to detect [S III]9069,9532 for targets at 2.4, were taken with an exposure time of 1.1 hours. The G235M data reduction, described in Strom et al. (2023), was performed with calwebb version 1.10.0 (crds_context jwst_1100.pmap, Bushouse et al., 2023), msaexp version 0.6.11 (Brammer, 2022), grizli version 1.8.9 (Brammer, 2023), and NSClean (Rauscher, 2023). The G395M data were reduced using the same procedures as the G235M data. The background subtraction was completed using a global background of all available MSA slits (masking pixels illuminated by the science targets) for both G235M and G395M. The 1D science spectra were extracted using a model that accounts for the continuum and wider spatial extent of the emission lines.
The continuum level of the reduced G235M and G395M spectra agree well, but relative flux calibration uncertainties persist in the NIRSpec data. To account for these, we rescale the NIRSpec spectra to match the best-fit model spectral energy distribution (SED) of D40. The SED fit is based on existing optical (U, G, and R bands), NIR (J and Ks bands), and Spitzer/IRAC Channel 1-4 photometry (for details, see Strom et al., 2017). We calculate the ratio of the SED and NIRSpec spectrum, then fit this ratio with a quadratic polynomial as a function of wavelength while excluding emission lines. This flux rescaling function, , is multiplied to the G235M and G395M spectra to rescale the spectrum to the SED continuum (similar to the approach taken by Arrabal Haro et al., 2023). The redshift of D40 was uncertain prior to the NIRSpec observations, but we determine the spectroscopic redshift of D40 to be 2.96280.0001 using the intensity of 11 strong emission lines.
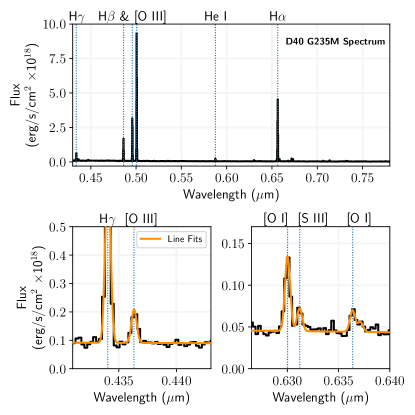
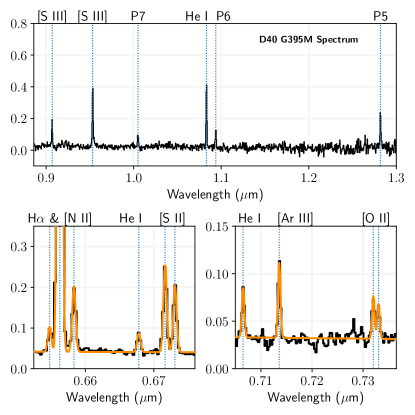
The final reduced rest-frame spectrum of D40 is plotted in Figure 1, where the strong nebular lines are highlighted by vertical dotted lines in each panel. Emission lines are fit using a linear continuum and Gaussian profile: the G235M (G395M) spectrum is split into 9 (5) windows, where a constant full-width at half maximum and velocity offset are used for all lines in a given window. This procedure allows for a fit to emission lines that are blended at NIRSpec’s resolution (e.g., [Ar IV]4711 and He I4713). To account for stellar absorption, the Balmer lines are fit with Gaussian profiles and the best-fit SED continuum, which shows relatively low Balmer absorption equivalent width (3.5 Å). We repeated the analysis using the SED continuum for all emission line fits and find that the results are consistent with the linear continuum+Gaussian emission line approach. Therefore, we adopt the linear continuum+Gaussian line model for all other emission lines to allow for a more flexible fit to the local continuum. We measure the RMS noise in continuum windows on either side of the emission line, then calculate the line flux uncertainty as , where is the number of pixels spanning the Gaussian profile (similar to the approach of Berg et al., 2013). This does not account for the uncertainty in the absolute flux calibration, but the analysis presented here focuses on the ratios of line fluxes.
To estimate the relative flux uncertainties, we utilize the functions for the 23 CECILIA galaxies reported in Strom et al. (2023). We normalize each galaxy’s function at the wavelength of H measured in D40, or 1.93m. For the full sample, we calculate the standard deviation in /m as a function of wavelength. We find that the standard deviation measured from the ensemble of /m is relatively constant and 6% at a given wavelength. As such, we assume that a constant 6% uncertainty on all flux ratios relative to H provides a reasonable approximation on the relative flux calibration uncertainty. This uncertainty is added in quadrature to the uncertainty on all emission line flux ratios before calculating physical conditions. An emission line is considered detected if /H has a signal-to-noise (S/N) 3.
The composite spectrum is corrected for dust attenuation using the Cardelli et al. (1989) reddening law with 3.1. The best-fit E(BV) is calculated as a weighted average from the E(BV) predicted by the H/H and H/H ratios. Both Balmer line ratios are compared to their predicted intensity ratios from Storey & Hummer (1995) assuming Case B recombination at Te=104 K and ne102 cm-3. For each ratio, uncertainty is estimated by recalculating E(BV) for a distribution of 500 ratios with center and standard deviation equal to the measured line ratio and its uncertainty, respectively. H/H indicates E(BV)0.050.05, while H/H predicts a larger reddening of E(BV)0.250.12. The resulting weighted average is E(BV)0.070.05. All reddening estimates are in good agreement with the values measured in the full KBSS sample (0.06-0.47, Strom et al., 2017), E(BV)neb measured for the KBSS subsample of low-metallicity, high-ionization Lyman emitters at 2.5 (Trainor et al., 2016), and the low dust attenuation reported in star-forming galaxies at 1 (Hayes et al., 2011; Reddy et al., 2023). Given D40’s high redshift and relatively low metallicity (see §4), the weighted average E(BV) is adopted. We have repeated the following chemical abundance analysis with the larger E(BV) inferred from H/H, and we find that the relative abundance results (e.g., N/O, S/O, and Ar/O) are robust to larger reddening. We use the Python PyNeb (Luridiana et al., 2012, 2015) package’s getCorrHb and getErrCorr functions to perform the reddening correction relative to H and to account for E(BV) uncertainties in the line intensity ratios, respectively. We report the reddening-corrected line intensities relative to H in Table 1.
| Emission Line | I()/I(H) |
|---|---|
| H 4340 | 0.409 0.025 |
| [O III] 4363 | 0.078 0.006 |
| He I 4471 | 0.036 0.004 |
| He II 4686 | 0.015 0.003 |
| [Ar IV] 4711 | 0.002 0.003 |
| He I 4713 | 0.008 0.003 |
| H 4861 | 1.000 0.060 |
| [O III] 4959 | 2.076 0.125 |
| [O III] 5007 | 6.012 0.361 |
| He I 5015 | 0.028 0.004 |
| He I 5876 | 0.116 0.007 |
| [O I] 6300 | 0.060 0.004 |
| [S III] 6312 | 0.018 0.002 |
| [O I] 6363 | 0.017 0.002 |
| Si II 6371 | 0.008 0.002 |
| [N II] 6548 | 0.040 0.003 |
| H 6563 | 2.832 0.170 |
| [N II] 6584 | 0.105 0.007 |
| He I 6678 | 0.031 0.003 |
| [S II] 6717 | 0.140 0.009 |
| [S II] 6731 | 0.108 0.007 |
| He I 7065 | 0.033 0.003 |
| [Ar III] 7135 | 0.051 0.004 |
| [O II] 7320 | 0.029 0.003 |
| [O II] 7330 | 0.023 0.002 |
| [Ar III] 7750 | 0.008 0.001 |
| [S III] 9069 | 0.159 0.011 |
| [S III] 9532 | 0.449 0.028 |
| P8 9545 | 0.056 0.006 |
| P7 10049 | 0.096 0.008 |
| He I 10830 | 0.446 0.028 |
| P6 10938 | 0.127 0.009 |
| P5 12818 | 0.228 0.015 |
| F(H) (erg/s/cm2) | (9.11 0.03)10-18 |
| E(BV) | 0.07 0.05 |
Note. — Line intensities measured from the NIRSpec rest optical and NIR data of D40. The left column provides the emission line name, the right reports the reddening-corrected intensities relative to H. The flux of H and adopted E(BV) are provided in the last two rows.
3 Physical Conditions, Ionic and Total Abundances
3.1 Electron Temperature and Density
To directly calculate the gas-phase chemical abundances in D40, we assume a three-zone ionization model. The low-ionization zone contains O+, N+, and S+, with ionization potentials (IPs) 13.6 eV, 14.5 eV, and 10.4 eV, respectively; the intermediate-ionization zone contains S2+ (IP23.3 eV) and Ar2+ (IP27.6 eV); the high-ionization zone contains O2+ (IP35.1 eV) and Ar3+ (IP40.7 eV). For Te, ne, and abundance calculations, we employ the same atomic data as Berg et al. (2019). We detect the Te-sensitive [O III]4363 and [S III]6312 emission lines as well as their strong-line counterparts at high-S/N, which characterize the gas in the high- and intermediate-ionization zones, respectively. To calculate Te from these ions, we use the [O III]4363/[O III]5007 and [S III]6312/[S III]9532 line ratios in the PyNeb getTemDen function assuming a constant ne of 102 cm-3. We use the same function and the [S II]6717,6731 doublet to calculate ne at the measured Te[S III]. The electron density, ne[S II]10978 cm-3, is less than the average ne measured in high- star-forming galaxies (250 cm-3, Sanders et al., 2016; Strom et al., 2017) and is in the low-density limit where abundances derived from most optical CELs are relatively insensitive to ne. To determine uncertainties on Te and ne, we generate a distribution of 500 line ratios centered on the measured ratio and with standard deviation equal to the uncertainty on the emission line ratio. We then calculate the resulting Te or ne distribution and take the standard deviation as the uncertainty.
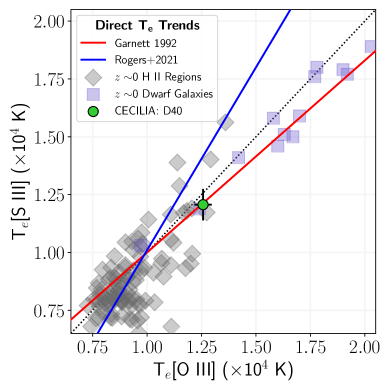
Table 2 reports the physical conditions measured in D40. The direct Te in D40, Te[O III]12600400 K and Te[S III]12100700 K, are plotted in Figure 2 as well as Te measurements in extragalactic H II regions (from Berg et al., 2020; Rogers et al., 2021, 2022) and low-metallicity dwarf galaxies (Berg et al., 2021; Izotov et al., 2021; Thuan et al., 2022; Arellano-Córdova et al., 2022b). The empirical Te-Te scaling relation of Rogers et al. (2021) and photoionization model relation of Garnett (1992) are provided as solid blue and red lines, respectively. The Te[O III] and Te[S III] measurements in D40 are in good agreement with the Te measured in local systems and with the Garnett (1992) photoionization model Te-Te relation. While this relation appears to characterize the Te in D40, we emphasize that large sample sizes are required to assess the scatter about a given Te-Te relation (e.g., Arellano-Córdova & Rodríguez, 2020; Yates et al., 2020; Rogers et al., 2021) and whether these relations describe the bulk Te trends at high-.
While we detect intense [O II]7320,7330 auroral line emission in D40, we lack the nebular lines to estimate the low-ionization zone Te directly from the NIRSpec data. Future work will utilize ground-based [O II]3726,3729 detections to directly measure Te[O II] in the CECILIA galaxies. Given the good agreement with the photoionization model Te[O III]-Te[S III] relation, we apply the Garnett (1992) Te[O II]-Te[O III] relation to estimate the low-ionization zone Te. We add 610 K in quadrature to the propagation of errors uncertainty to account for the intrinsic scatter in Te measured from empirical low- and high-ionization zone Te (Rogers et al., 2021). The inferred low-ionization zone Te is also reported in Table 2.
3.2 Abundances and Ionization Correction Factors
We calculate ionic abundances relative to H+ using the PyNeb getIonAbundance function, the strong-line intensities, the ionization zone Te, and ne[S II]. Uncertainty on the line intensity and emissivity ratios (the latter of which is dependent on the Te uncertainty) are added in quadrature to calculate the ionic abundance uncertainty. Table 2 reports the ionic abundances measured in D40. The O+/H+ abundance is calculated from the [O II] auroral lines, which are sensitive to Te and ne and have the potential to bias O+/H+ abundances upwards by 0.1 dex in the presence of ne fluctuations (Méndez-Delgado et al., 2023). While such fluctuations are not accounted for, the relatively large O+/H+ uncertainty reflects the Te-sensitivity of [O II]7320,7330 auroral lines when used for ionic abundances. O+ and O2+ are the two relevant ionic states of O in the ISM for systems ionized by O and B stars (Berg et al., 2021). While we detect intense [O I]6300 emission, this emission could be reflective of the photodissociation region rather than the ionized gas. As such, we assume the total O abundance is described by O/H (O+ + O2+)/H+. The resulting direct O/H abundance of D40 is 12+log(O/H) dex, 30% of the solar abundance (see §4). We do not correct for dust grain depletion of O, which is most significant in high-metallicity environments (Peimbert & Peimbert, 2010; Peña-Guerrero et al., 2012). Given the similar IP of N+ and O+, we adopt the usual approximation that N/O N+/O+, which is good to within 10% of the true gas-phase N/O (see Nava et al., 2006; Amayo et al., 2021).
| Property | Measurement |
|---|---|
| Te[O III] (K) | 12600 400 |
| Te[S III] (K) | 12100 700 |
| Te,Low (inferred) (K) | 11800 700 |
| ne[S II] (cm-3) | 109 78 |
| O+/H+ (105) | 4.1 1.3 |
| O2+/H+ (105) | 10.4 1.1 |
| 12+log(O/H) (dex) | 8.16 0.05 |
| N+/H+ (106) | 1.4 0.2 |
| log(N/O) | 1.46 0.15 |
| S+/H+ (107) | 4.2 0.6 |
| S2+/H+ (107) | 19.8 2.4 |
| S ICF | 1.19 0.12 |
| 12+log(S/H) (dex) | 6.46 0.06 |
| log(S/O) (dex) | 1.71 0.08 |
| Ar2+/H+ (107) | 2.7 0.4 |
| Ar ICF | 1.06 0.11 |
| 12+log(Ar/H) (dex) | 5.46 0.07 |
| log(Ar/O) (dex) | 2.71 0.09 |
| Ar3+/H+ (107)u | 1.2 0.5 |
| Ar ICFu | 1.01 0.10 |
| log(Ar/O)u (dex) | 2.57 |
Note. — Te, ne, ionic abundances, ICFs, and total abundances measured in D40. We also report (Ar3+/H+)u, the upper limit on Ar3+ abundance assuming the combined [Ar IV]4711 and He I4713 emission is entirely [Ar IV]. The resulting change to the ICF, Ar ICFu, and relative abundance, log(Ar/O)u, are reported in the last two rows.
For other elements, ionization correction factors (ICFs) are required to account for the abundance of unobserved ionic species. Given an ionic abundance Xi+/H+, the total elemental abundance X/H is then calculated as X/H = ICF(X)Xi+/H+ where ICF(X) depends on the ionization state of the gas. No [S IV] emission lines are observable in the optical or NIR, but the missing S3+ must be incorporated when calculating total S abundances. Similarly, correction for Ar+ is required for total Ar abundance, as is an additional correction for Ar3+ in very high-ionization systems if the optical [Ar IV]4711,4740 lines are not detected (see the discussion at the end of this section).
Owing to the challenges associated with measuring empirical total abundances, ICFs are calibrated via two methods: similarities in IP (like N and Ne, Peimbert & Costero, 1969), and photoionization models (Thuan et al., 1995; Izotov et al., 2006; Amayo et al., 2021). The latter are required for S and Ar abundances, but these photoionization models necessarily make assumptions about the ionizing spectrum. For example, Amayo et al. (2021) developed ICFs from the Bayesian Oxygen and Nitrogen Determinations (Vale Asari et al., 2016) grid of models, which utilize PopStar single-star SEDs (Mollá et al., 2009) with varying gas-phase O/H and N/O. To calibrate these ICFs, Amayo et al. (2021) weighted each model based on its ability to reproduce the emission line trends of local blue compact galaxies and H II regions on the classic Baldwin-Philips-Terlevich (BPT) diagram (Baldwin et al., 1981), or log([O III]5007/H) vs. log([N II]6584/H). It is well-established that high- star-forming galaxies are offset from the 0 BPT star-forming locus (Masters et al., 2014; Steidel et al., 2014; Shapley et al., 2015; Strom et al., 2017; Sanders et al., 2023b), and it follows that these ICFs are not suitable for high- galaxies or other sources with harder ionizing spectra. While some studies have considered harder ionizing sources when calibrating ICFs (e.g., Berg et al., 2021), it is unclear if these can reproduce the general emission line trends of high- galaxies.
For the present study, we use the S and Ar ICFs of Izotov et al. (2006) for abundances in D40. These ICFs are dependent on O+/O and have different functional forms depending on 12+log(O/H); as recommended by Izotov et al. (2006), we use a linear interpolation of intermediate- and high-metallicity ICFs for D40. However, we emphasize that the lack of available ICFs that are calibrated either on the strong-line trends in high- galaxies or model grids which consider other ionizing sources (e.g., binary stars, Eldridge et al., 2017; Stanway & Eldridge, 2018) presents one of the largest uncertainties when attempting to measure the total abundance of elements like S and Ar. To partially account for this, we assume a 10% uncertainty in applying the Izotov et al. (2006) S and Ar ICFs. In future works, we will leverage the CECILIA sample and new grids of photoionization models to derive physically-motivated ICFs for reliable total abundances in high- environments.
Finally, we note that the blend of [Ar IV]4711 and He I4713 is detected in D40. In high-ionization sources, the ionic fraction of Ar3+ becomes comparable to that of Ar2+ (e.g., Berg et al., 2021); as such, [Ar IV] emission permits a direct measurement of Ar3+/H+ and a total Ar/H that is less susceptible to the uncertainties of the adopted ICF (i.e., the ICF is only accounting for the missing Ar+/H+ abundance). However, the Gaussian fit to [Ar IV]4711 indicates that this line is only weakly detected (S/N 1). To provide an upper limit on Ar/H, we assume the [Ar IV]4711 and He I4713 blend is entirely related to [Ar IV], calculate the resulting Ar3+/H+ abundance using Te[O III], and calculate Ar/H using (Ar2+ + Ar3+)/H+ and the alternative Ar ICF proposed by Izotov et al. (2006). The resulting upper limit on Ar/O is reported as log(Ar/O)u in Table 2.
4 Discussion
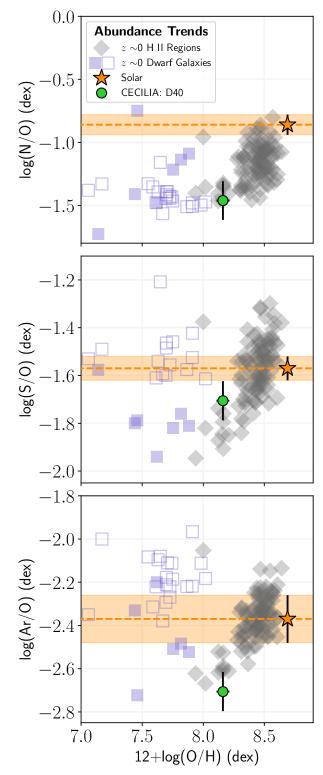
We now compare the direct abundance trends measured in D40 to local star-forming systems, illustrated in Figure 3. The relative abundances of N/O, S/O, or Ar/O are plotted against the gas-phase O/H abundance. The local H II regions and dwarf galaxies from Figure 2 (i.e., those with simultaneous Te[O III] and Te[S III]) are represented as gray diamonds and blue squares, respectively. We denote abundances from the 0 dwarf galaxies from Skillman et al. (2013); Berg et al. (2019); Aver et al. (2022) that have measurements of Te[O III] but are missing Te[S III] as open blue squares. We also represent solar abundances reported in Asplund et al. (2021) as an orange star and dotted orange lines (fixed solar O/H), with the shaded regions indicating the uncertainty. The solar abundance values are: 12+log(O/H) dex, log(N/O) dex, log(S/O) dex, and log(Ar/O) dex.
The O/H abundance measured in D40, 12+log(O/H) dex, is indicative of a relatively metal-poor ISM. While this is lower than the average model-inferred metallicity of the KBSS galaxies reported in Strom et al. (2018), D40’s O/H is consistent with its relatively high Te[O III] and Te[S III] and is in general agreement with emerging O/H trends at high- (e.g., Sanders et al., 2023a). In the top panel, the log(N/O) abundance in D40 (green circle, 1.460.15 dex) is in good agreement with the primary N/O plateau established by low-metallicity dwarf galaxies and H II regions. The metallicity of D40 is close to the 12+log(O/H) value where secondary N production from intermediate-mass stars is expected to become significant (e.g., Henry et al., 2000), but given that we do not observe enhanced N/O, the N enrichment in D40 likely arises from primary nucleosynthesis from massive stars. We note that the large uncertainties on the log(N/O) relative abundance are related to N+ and O+ dependence on the inferred low-ionization zone Te and the use of the [O II] auroral lines for O+ abundance.
O, S, and Ar are all primarily produced by the process in massive stars and are released to the ISM on relatively short timescales via CCSN. In this scenario, the relative abundances of S/O and Ar/O are independent of metallicity and related to the CCSN yields. Therefore, it is of interest to assess any potential metallicity or redshift evolution of relative abundances, which would suggest alternative enrichment mechanisms for the different elements. The gas-phase S/O abundance measured in D40, log(S/O) dex, is slightly less than the solar abundance ratio, but is consistent with the average S/O observed in local ionized regions, log(S/O) dex. The local star-forming systems show a relatively large spread in S/O abundance, which might be related to the challenges associated with observing the [S III]9069,9532 lines from ground-based observatories. For example, contamination from telluric absorption features (Noll et al., 2012) can bias the NIR [S III] emission line intensities low and the derived Te[S III] high, resulting in large dispersion in S/H and S/O. Telluric contamination, however, does not affect our JWST/NIRSpec observations of D40’s [S III] lines or S/O abundance, the latter of which is consistent with the S/O of H II regions with similarly low 12+log(O/H). Taken together with the S/O abundances in dwarf galaxies with measured Te[S III], there is evidence for a metallicity-dependent mechanism for S enrichment. log(S/O) has been observed to evolve with 12+log(O/H) in individual local galaxies, although such results are dependent on the Te structure and ICF assumed (see Esteban et al., 2020). Large samples of high- galaxies with a broad range of metallicity are required to assess any S/O vs. O/H trends in the early universe and potential deviations from the abundance patterns expected from process enrichment.
The bottom panel of Figure 3 reveals that the relative Ar/O abundance in D40, log(Ar/O) dex, is significantly sub-solar. The same conclusion is reached when considering the upper limit of Ar/O from the [Ar IV]He I intensity, log(Ar/O) dex, or when using the Amayo et al. (2021) ICFs for Ar abundance measurement. Furthermore, adopting larger reddening (i.e., E(BV)0.250.12 from H/H) increases the inferred Te[O III] and Te[S III] while decreasing the [Ar III]7135 intensity relative to H, which would produce both lower gas-phase O/H and Ar/O than shown in Figure 3. Finally, accounting for the depletion of metals onto dust grains would increase the O abundance and only further decrease Ar/O. We calculate an average log(Ar/O) for the distribution of 0 systems of log(Ar/O) dex, in agreement with the Asplund et al. (2021) solar ratio. log(Ar/O) and the solar Ar/O are larger than the gas-phase log(Ar/O) in D40 by 2.
To illustrate this point further, we investigate the relative Ar/S abundance. The log(Ar/S) abundance measured when using the total S/H and Ar/H abundances reported in Table 2 is log(Ar/S) dex. This is 2 lower than the solar Ar/S ratio, log(Ar/S) dex. Given the similar IPs of S+ (23.3 eV) and Ar+ (27.6 eV), log(Ar2+/S2+) has been proposed as an alternative, ICF-independent measure of log(Ar/S) (Kennicutt et al., 2003; Croxall et al., 2016). For D40, we measure log(Ar2+/S2+) dex, corroborating the low gas-phase Ar/S abundance. Taken together with the abundance trends from Figure 3, the ISM in D40 at 3 is Ar deficient relative to O and S when compared to the gas-phase abundances in the local universe.
4.1 Ar/O and Implications for Enhancement
While it is often assumed that the relative element abundance ratios are independent of 12+log(O/H) or ionization, recent nucleosynthesis models have revealed that Type Ia SNe can produce certain elements. For example, the models of Kobayashi et al. (2020a, b) indicate that a significant fraction of Ar (up to 34% to match the abundance trends in the solar neighborhood) originates from Type Ia SNe enrichment. This suggests that Ar/O and Ar/H can trace enrichment by both CCSN and Type Ia SNe in a manner similar to Fe/O and Fe/H. Indeed, galactic chemical evolution models can match the Ar/O and Ar/H abundances of stars and planetary nebulae in M31 using various star-formation histories to account for the different mechanisms of Ar production (Arnaboldi et al., 2022; Kobayashi et al., 2023). In this scenario, rapid enrichment from CCSN results in enhanced O relative to Ar, producing low Ar/O at low 12+log(Ar/H). Type Ia SNe enrich the ISM with additional Ar and increase Ar/O, but this enrichment mechanism has a large time delay (from 0.1 to 10 Gyr, Kobayashi & Nomoto, 2009; Kobayashi et al., 2020b). The lifetime of the massive stars ionizing the ISM is much shorter than this time delay, such that the chemical composition of the H II regions is reflective of the stars that were born in this environment. Considering the time delay of Type Ia SNe and the age of universe at D40’s redshift (2 Gyr for 2.9628), the direct Ar and O abundances in D40 suggest that this galaxy has been predominantly enriched by CCSN.
The S and Ar abundance trends presented here are the first to be directly calculated from a measured Te[S III] and strong lines of [S III] and [Ar III] in a galaxy at 0.2. Currently, no prior observations have constrained Te[S III] in high- galaxies, which is necessary for reliable S/O and Ar/O abundances. Additionally, the [S III] and [Ar III] strong lines require both broad wavelength coverage and fairly deep integration times to detect. For example, Isobe et al. (2023) only detect [Ar III]7135 in two galaxies at 4, but Te[O III] and Te[S III] are unconstrained in both galaxies and all other Ar abundances are upper limits. Furthermore, the S/O abundances from Isobe et al. (2023) are determined using the [S II] emission lines alone, which accounts for only a small fraction of the total S abundance in high-ionization galaxies. For example, the S2+/H+ abundance in D40 is 4 times that of S+/H+ (see Table 2), implying that a measure of only S+/H+ is reliant on the validity of the S ICF applied.
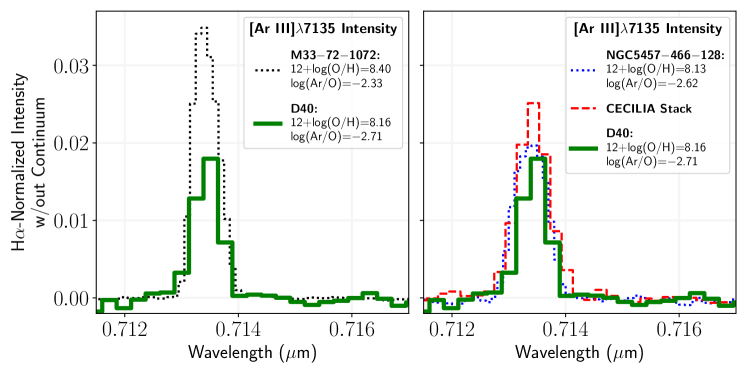
There are currently no high- Ar/O abundances to compare with that of D40, but other galaxies in the CECILIA sample suggest that Ar-deficient ISMs are more common at high- than in the local universe. In Figure 4, we plot the reddening-corrected line intensities of [Ar III]7135 for systems at low- and high-. In each case, the continuum has been removed and the line intensities are scaled relative to the peak H intensity. The left panel compares the [Ar III] line intensity of D40 with M33711072, a 0 H II region in M33 with solar log(Ar/O) from Rogers et al. (2022). The right panel compares the D40 [Ar III] line intensity to the stack of CECILIA spectra from Strom et al. (2023) and the spectrum of NGC5457466128, an extragalactic H II region selected to have similar O/H and Ar/O as D40 (from Croxall et al., 2016). We note that local star-forming regions with Ar/O comparable to that of D40 are quite rare (see Figure 3). In contrast, the CECILIA stacked spectrum characterizes the general emission line trends of the star-forming galaxies at 23. The stacked spectrum is not reddening corrected, but we note that this would only decrease the [Ar III] line intensity plotted in Figure 4. The [Ar III]/H line intensities of D40 and the CECILIA stack show good agreement with NGC5457466128 and are distinct from the [Ar III] intensities of ionized regions with solar Ar/O. These emission line trends are consistent with a lack of Ar in the high- ISM to produce strong [Ar III]7135 emission.
The first direct Ar/O abundance at high- adds to the growing observational evidence of a disconnect between the nucleosynthesis products of Type II and Ia SNe in the early universe. For example, the emission line ratios of high- star-forming galaxies are offset in the BPT diagram, a trend that can be explained with a harder ionizing spectrum (Steidel et al., 2014; Strom et al., 2017; Sanders et al., 2020; Topping et al., 2020; Runco et al., 2021). By decoupling the stellar and nebular metallicities in photoionizaiton models, Strom et al. (2018) demonstrated that the bulk emission line trends of 2 galaxies can be reproduced with lower stellar metallicity (to reduce the line-blanketing by Fe lines) relative to the nebular metallicity (which influences the strong optical emission lines such as [O III]5007). Stacks of rest-UV spectra of high- star-forming galaxies arrive at similar conclusions: spectral synthesis of low-metallicity stellar populations is required to match the UV features which are dominated by Fe, but larger gas-phase O abundance is needed to produce the observed strong line ratios (e.g., Steidel et al., 2016; Cullen et al., 2019; Topping et al., 2020). A pattern of low Ar/O and S/O at high- would suggest that the differences in enrichment timescales play a crucial role in the gas-phase conditions observed in early star-forming galaxies. Utilizing Ar/O and O/H as tracers of Type Ia and CCSN enrichment, respectively, has the additional benefit that the required CELs are entirely observable in the rest-frame optical/NIR. Therefore, the [Ar III]7135 emission line may act as an accessible tracer of these different enrichment mechanisms, providing further insight into chemical enrichment histories of high- galaxies.
5 Conclusions
We report the chemical abundance trends in Q2343-D40, a 3 galaxy observed with JWST/NIRSpec as part of the CECILIA program. For the first time in a galaxy at 0.2, we calculate Te[S III] from the [S III]6312 auroral line and [S III]9532 strong line. We utilize the high-S/N detections of [O III]4363 and 5007 to directly calculate the high-ionization zone Te. The Te trends in D40, Te[O III]12600400 K and Te[S III]12100700 K, are in good agreement with the Garnett (1992) Te-Te relation (see Figure 2), but we note that other surveys have found large scatter in Te[S III] at fixed Te[O III]. While Te[S III] is challenging to measure, owing to the broad wavelength coverage required to measure [S III]9069,9532 and the low intensity of the [S III] auroral line, simultaneous measurements of Te[S III] and Te[O III] are required to assess whether Te-Te scaling relations calibrated on local ionized nebulae or photoionization models are appropriate to apply at high-.
We use these direct Te[O III] and Te[S III] to measure the gas-phase ionic abundances in D40, representing the first direct abundances of S2+/H+ and Ar2+/H+ in a high- galaxy. Using an inferred low-ionization zone Te and the necessary ICFs, we calculate the total O/H abundance and the relative abundances N/O, S/O, and Ar/O (plotted in Figure 3). The O/H abundance in D40, 12+log(O/H) , is 30% solar, and the N/O abundance agrees with the primary N/O plateau observed in similarly metal-poor galaxies in the local universe. The relative S/O abundance is lower than the solar abundance ratio but is in agreement with the abundances of local star-forming regions. The scatter in S/O in the local ionized regions is possibly related to the observational challenges associated with measuring the NIR [S III] lines from the ground; JWST’s NIR capabilities have the potential to assess the dispersion in S/O in the local universe and the S enrichment at high-. Additional direct abundance data is required to address whether S has an additional enrichment mechanism that produces a S/O-O/H trend (similar to N/O).
The Ar/O abundance in D40, log(Ar/O) dex, is 2 below the solar abundance ratio and the average log(Ar/O) observed in 0 star-forming systems. This result is robust to the inclusion of Ar3+ from the maximum possible [Ar IV]4711 intensity, reddening correction uncertainties, and the effects of dust depletion. Furthermore, the [Ar III]7135 emission line intensities in the CECILIA galaxies appear to be distinct from those of local star-forming regions with solar log(Ar/O) (Figure 4), indicating low Ar abundance is a potentially common feature of the ISM at 2. Modern nucleosynthesis models find that Ar is produced both via the process in massive stars and in Type Ia SNe (Kobayashi et al., 2020a, b), indicating that Ar/O is sensitive to the timescale of enrichment from Type II and Ia SNe. As such, the low Ar/O measured from the ionized gas in D40 at 3 could be the result of primarily CCSN enrichment with small contributions from Type Ia SNe, an indirect probe of the relative enrichment of O with respect to Fe.
The low Ar/O abundance at 3 corroborates the growing evidence of enhanced O relative to the nucleosynthesis products of Type Ia SNe, including the hard ionizing spectra required to reproduce the BPT offset and the inferred stellar abundances measured from stacked rest-frame UV spectra of high- galaxies. Large samples of abundances like N/O, S/O, and Ar/O provide another route to exploring these relative enrichment pathways and the physical conditions within these systems. With deep rest-frame UV, optical, and NIR spectra of many 2 star-forming galaxies, the CECILIA sample is poised to address these relative abundance trends in the early universe where the timescales of Type II and Ia SNe enrichment play an important role.
References
- Amayo et al. (2021) Amayo, A., Delgado-Inglada, G., & Stasińska, G. 2021, MNRAS, 505, 2361, doi: 10.1093/mnras/stab1467
- Arellano-Córdova et al. (2020) Arellano-Córdova, K. Z., Esteban, C., García-Rojas, J., & Méndez-Delgado, J. E. 2020, MNRAS, 496, 1051, doi: 10.1093/mnras/staa1523
- Arellano-Córdova & Rodríguez (2020) Arellano-Córdova, K. Z., & Rodríguez, M. 2020, MNRAS, 497, 672, doi: 10.1093/mnras/staa1759
- Arellano-Córdova et al. (2022a) Arellano-Córdova, K. Z., Berg, D. A., Chisholm, J., et al. 2022a, ApJ, 940, L23, doi: 10.3847/2041-8213/ac9ab2
- Arellano-Córdova et al. (2022b) Arellano-Córdova, K. Z., Mingozzi, M., Berg, D. A., et al. 2022b, ApJ, 935, 74, doi: 10.3847/1538-4357/ac7854
- Arnaboldi et al. (2022) Arnaboldi, M., Bhattacharya, S., Gerhard, O., et al. 2022, A&A, 666, A109, doi: 10.1051/0004-6361/202244258
- Arrabal Haro et al. (2023) Arrabal Haro, P., Dickinson, M., Finkelstein, S. L., et al. 2023, ApJ, 951, L22, doi: 10.3847/2041-8213/acdd54
- Asplund et al. (2021) Asplund, M., Amarsi, A. M., & Grevesse, N. 2021, A&A, 653, A141, doi: 10.1051/0004-6361/202140445
- Aver et al. (2022) Aver, E., Berg, D. A., Hirschauer, A. S., et al. 2022, MNRAS, 510, 373, doi: 10.1093/mnras/stab3226
- Baldwin et al. (1981) Baldwin, J. A., Phillips, M. M., & Terlevich, R. 1981, PASP, 93, 5, doi: 10.1086/130766
- Berg et al. (2021) Berg, D. A., Chisholm, J., Erb, D. K., et al. 2021, ApJ, 922, 170, doi: 10.3847/1538-4357/ac141b
- Berg et al. (2019) Berg, D. A., Erb, D. K., Henry, R. B. C., Skillman, E. D., & McQuinn, K. B. W. 2019, ApJ, 874, 93, doi: 10.3847/1538-4357/ab020a
- Berg et al. (2020) Berg, D. A., Pogge, R. W., Skillman, E. D., et al. 2020, ApJ, 893, 96, doi: 10.3847/1538-4357/ab7eab
- Berg et al. (2015) Berg, D. A., Skillman, E. D., Croxall, K. V., et al. 2015, ApJ, 806, 16, doi: 10.1088/0004-637X/806/1/16
- Berg et al. (2013) Berg, D. A., Skillman, E. D., Garnett, D. R., et al. 2013, ApJ, 775, 128, doi: 10.1088/0004-637X/775/2/128
- Brammer (2022) Brammer, G. 2022, msaexp: NIRSpec analyis tools, 0.3.4, Zenodo, Zenodo, doi: 10.5281/zenodo.7313329
- Brammer (2023) —. 2023, grizli, 1.9.11, Zenodo, Zenodo, doi: 10.5281/zenodo.1146904
- Bresolin (2011) Bresolin, F. 2011, ApJ, 730, 129, doi: 10.1088/0004-637X/730/2/129
- Bunker et al. (2023) Bunker, A. J., Saxena, A., Cameron, A. J., et al. 2023, A&A, 677, A88, doi: 10.1051/0004-6361/202346159
- Bushouse et al. (2023) Bushouse, H., Eisenhamer, J., Dencheva, N., et al. 2023, JWST Calibration Pipeline, 1.10.0, Zenodo, Zenodo, doi: 10.5281/zenodo.7795697
- Cardelli et al. (1989) Cardelli, J. A., Clayton, G. C., & Mathis, J. S. 1989, ApJ, 345, 245, doi: 10.1086/167900
- Clarke et al. (2023) Clarke, L., Shapley, A., Sanders, R. L., et al. 2023, ApJ, 957, 81, doi: 10.3847/1538-4357/acfedb
- Croxall et al. (2016) Croxall, K. V., Pogge, R. W., Berg, D. A., Skillman, E. D., & Moustakas, J. 2016, ApJ, 830, 4, doi: 10.3847/0004-637X/830/1/4
- Cullen et al. (2019) Cullen, F., McLure, R. J., Dunlop, J. S., et al. 2019, MNRAS, 487, 2038, doi: 10.1093/mnras/stz1402
- Dinerstein (1990) Dinerstein, H. L. 1990, in Astrophysics and Space Science Library, Vol. 161, The Interstellar Medium in Galaxies, ed. J. Thronson, Harley A. & J. M. Shull, 257–285, doi: 10.1007/978-94-009-0595-5_10
- Dors et al. (2023) Dors, O. L., Valerdi, M., Riffel, R. A., et al. 2023, MNRAS, 521, 1969, doi: 10.1093/mnras/stad635
- Eldridge et al. (2017) Eldridge, J. J., Stanway, E. R., Xiao, L., et al. 2017, PASA, 34, e058, doi: 10.1017/pasa.2017.51
- Erb et al. (2006) Erb, D. K., Shapley, A. E., Pettini, M., et al. 2006, ApJ, 644, 813, doi: 10.1086/503623
- Esteban et al. (2020) Esteban, C., Bresolin, F., García-Rojas, J., & Toribio San Cipriano, L. 2020, MNRAS, 491, 2137, doi: 10.1093/mnras/stz3134
- Esteban et al. (2004) Esteban, C., Peimbert, M., García-Rojas, J., et al. 2004, MNRAS, 355, 229, doi: 10.1111/j.1365-2966.2004.08313.x
- Garnett (1992) Garnett, D. R. 1992, AJ, 103, 1330, doi: 10.1086/116146
- Harris et al. (2020) Harris, C. R., Millman, K. J., van der Walt, S. J., et al. 2020, Nature, 585, 357, doi: 10.1038/s41586-020-2649-2
- Hayes et al. (2011) Hayes, M., Schaerer, D., Östlin, G., et al. 2011, ApJ, 730, 8, doi: 10.1088/0004-637X/730/1/8
- Henry et al. (2000) Henry, R. B. C., Edmunds, M. G., & Köppen, J. 2000, ApJ, 541, 660, doi: 10.1086/309471
- Hunter (2007) Hunter, J. D. 2007, Computing in Science and Engineering, 9, 90, doi: 10.1109/MCSE.2007.55
- Isobe et al. (2023) Isobe, Y., Ouchi, M., Tominaga, N., et al. 2023, arXiv e-prints, arXiv:2307.00710, doi: 10.48550/arXiv.2307.00710
- Izotov et al. (2006) Izotov, Y. I., Stasi’nska, G., Meynet, G., Guseva, N. G., & Thuan, T. X. 2006, A&A, 448, 955, doi: 10.1051/0004-6361:20053763
- Izotov et al. (2021) Izotov, Y. I., Thuan, T. X., & Guseva, N. G. 2021, MNRAS, 508, 2556, doi: 10.1093/mnras/stab2798
- Kennicutt et al. (2003) Kennicutt, Robert C., J., Bresolin, F., & Garnett, D. R. 2003, ApJ, 591, 801, doi: 10.1086/375398
- Kobayashi et al. (2023) Kobayashi, C., Bhattacharya, S., Arnaboldi, M., & Gerhard, O. 2023, ApJ, 956, L14, doi: 10.3847/2041-8213/acf7c7
- Kobayashi et al. (2020a) Kobayashi, C., Karakas, A. I., & Lugaro, M. 2020a, ApJ, 900, 179, doi: 10.3847/1538-4357/abae65
- Kobayashi et al. (2020b) Kobayashi, C., Leung, S.-C., & Nomoto, K. 2020b, ApJ, 895, 138, doi: 10.3847/1538-4357/ab8e44
- Kobayashi & Nomoto (2009) Kobayashi, C., & Nomoto, K. 2009, ApJ, 707, 1466, doi: 10.1088/0004-637X/707/2/1466
- Laseter et al. (2023) Laseter, I. H., Maseda, M. V., Curti, M., et al. 2023, arXiv e-prints, arXiv:2306.03120, doi: 10.48550/arXiv.2306.03120
- Lequeux et al. (1979) Lequeux, J., Peimbert, M., Rayo, J. F., Serrano, A., & Torres-Peimbert, S. 1979, A&A, 500, 145
- Luridiana et al. (2012) Luridiana, V., Morisset, C., & Shaw, R. A. 2012, IAU Symposium, 283, 422, doi: 10.1017/S1743921312011738
- Luridiana et al. (2015) —. 2015, A&A, 573, A42, doi: 10.1051/0004-6361/201323152
- Masters et al. (2014) Masters, D., McCarthy, P., Siana, B., et al. 2014, ApJ, 785, 153, doi: 10.1088/0004-637X/785/2/153
- Méndez-Delgado et al. (2023) Méndez-Delgado, J. E., Esteban, C., García-Rojas, J., et al. 2023, MNRAS, 523, 2952, doi: 10.1093/mnras/stad1569
- Mollá et al. (2009) Mollá, M., García-Vargas, M. L., & Bressan, A. 2009, MNRAS, 398, 451, doi: 10.1111/j.1365-2966.2009.15160.x
- Nakajima et al. (2023) Nakajima, K., Ouchi, M., Isobe, Y., et al. 2023, arXiv e-prints, arXiv:2301.12825, doi: 10.48550/arXiv.2301.12825
- Nava et al. (2006) Nava, A., Casebeer, D., Henry, R. B. C., & Jevremovic, D. 2006, ApJ, 645, 1076, doi: 10.1086/504416
- Noll et al. (2012) Noll, S., Kausch, W., Barden, M., et al. 2012, A&A, 543, A92, doi: 10.1051/0004-6361/201219040
- Peña-Guerrero et al. (2012) Peña-Guerrero, M. A., Peimbert, A., & Peimbert, M. 2012, ApJ, 756, L14, doi: 10.1088/2041-8205/756/1/L14
- Peimbert & Peimbert (2010) Peimbert, A., & Peimbert, M. 2010, ApJ, 724, 791, doi: 10.1088/0004-637X/724/1/791
- Peimbert & Costero (1969) Peimbert, M., & Costero, R. 1969, Boletin de los Observatorios Tonantzintla y Tacubaya, 5, 3
- Rauscher (2023) Rauscher, B. J. 2023, arXiv e-prints, arXiv:2306.03250, doi: 10.48550/arXiv.2306.03250
- Reddy et al. (2023) Reddy, N. A., Topping, M. W., Sanders, R. L., Shapley, A. E., & Brammer, G. 2023, ApJ, 948, 83, doi: 10.3847/1538-4357/acc869
- Rogers et al. (2022) Rogers, N. S. J., Skillman, E. D., Pogge, R. W., et al. 2022, ApJ, 939, 44, doi: 10.3847/1538-4357/ac947d
- Rogers et al. (2021) —. 2021, ApJ, 915, 21, doi: 10.3847/1538-4357/abf8b9
- Roy & Kunth (1995) Roy, J. R., & Kunth, D. 1995, A&A, 294, 432. https://arxiv.org/abs/astro-ph/9410023
- Rudie et al. (2012) Rudie, G. C., Steidel, C. C., Trainor, R. F., et al. 2012, ApJ, 750, 67, doi: 10.1088/0004-637X/750/1/67
- Runco et al. (2021) Runco, J. N., Shapley, A. E., Sanders, R. L., et al. 2021, MNRAS, 502, 2600, doi: 10.1093/mnras/stab119
- Sanders et al. (2023a) Sanders, R. L., Shapley, A. E., Topping, M. W., Reddy, N. A., & Brammer, G. B. 2023a, arXiv e-prints, arXiv:2303.08149, doi: 10.48550/arXiv.2303.08149
- Sanders et al. (2023b) —. 2023b, ApJ, 955, 54, doi: 10.3847/1538-4357/acedad
- Sanders et al. (2016) Sanders, R. L., Shapley, A. E., Kriek, M., et al. 2016, ApJ, 816, 23, doi: 10.3847/0004-637X/816/1/23
- Sanders et al. (2020) Sanders, R. L., Shapley, A. E., Reddy, N. A., et al. 2020, MNRAS, 491, 1427, doi: 10.1093/mnras/stz3032
- Sanders et al. (2023c) Sanders, R. L., Shapley, A. E., Clarke, L., et al. 2023c, ApJ, 943, 75, doi: 10.3847/1538-4357/aca9cc
- Schaerer et al. (2022) Schaerer, D., Marques-Chaves, R., Barrufet, L., et al. 2022, A&A, 665, L4, doi: 10.1051/0004-6361/202244556
- Shapley et al. (2015) Shapley, A. E., Reddy, N. A., Kriek, M., et al. 2015, ApJ, 801, 88, doi: 10.1088/0004-637X/801/2/88
- Skillman et al. (2013) Skillman, E. D., Salzer, J. J., Berg, D. A., et al. 2013, AJ, 146, 3, doi: 10.1088/0004-6256/146/1/3
- Stanway & Eldridge (2018) Stanway, E. R., & Eldridge, J. J. 2018, MNRAS, 479, 75, doi: 10.1093/mnras/sty1353
- Steidel et al. (2010) Steidel, C. C., Erb, D. K., Shapley, A. E., et al. 2010, ApJ, 717, 289, doi: 10.1088/0004-637X/717/1/289
- Steidel et al. (2016) Steidel, C. C., Strom, A. L., Pettini, M., et al. 2016, ApJ, 826, 159, doi: 10.3847/0004-637X/826/2/159
- Steidel et al. (2014) Steidel, C. C., Rudie, G. C., Strom, A. L., et al. 2014, ApJ, 795, 165, doi: 10.1088/0004-637X/795/2/165
- Storey & Hummer (1995) Storey, P. J., & Hummer, D. G. 1995, MNRAS, 272, 41, doi: 10.1093/mnras/272.1.41
- Strom et al. (2018) Strom, A. L., Steidel, C. C., Rudie, G. C., Trainor, R. F., & Pettini, M. 2018, ApJ, 868, 117, doi: 10.3847/1538-4357/aae1a5
- Strom et al. (2017) Strom, A. L., Steidel, C. C., Rudie, G. C., et al. 2017, ApJ, 836, 164, doi: 10.3847/1538-4357/836/2/164
- Strom et al. (2023) Strom, A. L., Rudie, G. C., Trainor, R. F., et al. 2023, ApJ, 958, L11, doi: 10.3847/2041-8213/ad07dc
- Thuan et al. (2022) Thuan, T. X., Guseva, N. G., & Izotov, Y. I. 2022, MNRAS, 516, L81, doi: 10.1093/mnrasl/slac095
- Thuan et al. (1995) Thuan, T. X., Izotov, Y. I., & Lipovetsky, V. A. 1995, ApJ, 445, 108, doi: 10.1086/175676
- Topping et al. (2020) Topping, M. W., Shapley, A. E., Reddy, N. A., et al. 2020, MNRAS, 499, 1652, doi: 10.1093/mnras/staa2941
- Tosi (1988) Tosi, M. 1988, A&A, 197, 47
- Trainor et al. (2015) Trainor, R. F., Steidel, C. C., Strom, A. L., & Rudie, G. C. 2015, ApJ, 809, 89, doi: 10.1088/0004-637X/809/1/89
- Trainor et al. (2016) Trainor, R. F., Strom, A. L., Steidel, C. C., & Rudie, G. C. 2016, ApJ, 832, 171, doi: 10.3847/0004-637X/832/2/171
- Tremonti et al. (2004) Tremonti, C. A., Heckman, T. M., Kauffmann, G., et al. 2004, ApJ, 613, 898, doi: 10.1086/423264
- Trump et al. (2023) Trump, J. R., Arrabal Haro, P., Simons, R. C., et al. 2023, ApJ, 945, 35, doi: 10.3847/1538-4357/acba8a
- Vale Asari et al. (2016) Vale Asari, N., Stasińska, G., Morisset, C., & Cid Fernandes, R. 2016, MNRAS, 460, 1739, doi: 10.1093/mnras/stw971
- Virtanen et al. (2020) Virtanen, P., Gommers, R., Oliphant, T. E., et al. 2020, Nature Methods, 17, 261, doi: 10.1038/s41592-019-0686-2
- Williams et al. (2023) Williams, H., Kelly, P. L., Chen, W., et al. 2023, Science, 380, 416, doi: 10.1126/science.adf5307
- Yates et al. (2020) Yates, R. M., Schady, P., Chen, T. W., Schweyer, T., & Wiseman, P. 2020, A&A, 634, A107, doi: 10.1051/0004-6361/201936506