Sustained super-Eddington accretion in high-redshift quasars
Observations of quasars provide information on the early phases of the most massive black holes (MBHs) and galaxies. Current observations, able to trace both gas and stellar properties, show that most MBHs at high redshift seem overmassive compared to the local population, in line with the elliptical galaxy population, or even above, thus implying a very rapid growth of these objects. To assess the physical conditions for such a rapid growth and explain the existence of a population of already mature MBHs when the Universe was less than 1 Gyr old, we here explore whether episodes of accretion above the Eddington limit can occur across cosmic epochs. By employing state-of-the-art high-resolution cosmological zoom-in simulations of a quasar, where different accretion regimes are consistently included, together with their associated radiative and kinetic feedback, we show that super-Eddington phases can be sustained for relatively long time-scales (tens of Myr) and discuss how they affect the growth of MBHs. We also show, by means of a semi-analytic evolution, that the MBH spin remains relatively low during super-Eddington phases, and this would result in a lower feedback efficiency, hence a potentially faster growth that might then explain the overmassiveness of high-redshift MBHs.
Key Words.:
black holes: evolution – galaxies: formation – galaxies: evolution – galaxies: high redshift1 Introduction
Massive black holes (MBHs) are ubiquitous in the Universe and inhabit the centre of massive galaxies up to redshift (Fan et al., 2006; Mortlock et al., 2011; Bañados et al., 2018; Fan et al., 2023; Maiolino et al., 2023, e.g.), with masses up to . Observationally, they are commonly identified via gas accretion, thanks to the conversion of gravitational energy into radiation, which makes them shine as active galactic nuclei (AGN), sometimes producing also powerful collimated jets.
According to Soltan’s argument (Soltan, 1982) and to the evolution of the AGN luminosity function, MBHs gained most of their mass via radiatively efficient accretion, hence they should have formed from lower-mass ‘seeds’. In this respect, observations of high-redshift MBHs pose tight constraints on the minimum initial seed MBH mass, which has to be of the order of , if we assume the growth to occur via radiatively efficient accretion with , at the Eddington limit. In order to explain these results, several groups have focussed on the initial mass of heavy seed MBHs, which has to be particularly high to be able to explain the most massive objects observed (Fan et al., 2023), hence requiring very peculiar conditions (e.g. Latif et al., 2015; Schauer et al., 2017; Lupi et al., 2021; Latif et al., 2022). In order to explain these results, several groups have focussed on studying “heavy” seed MBHs, with high initial mass to ease explaining the most massive objects observed (Fan et al., 2023). The formation of the most massive seeds requires however peculiar conditions (e.g. Latif et al., 2015; Schauer et al., 2017; Lupi et al., 2021; Latif et al., 2022). An alternative possibility, which is also suggested by recent results (e.g. Davies et al., 2019; Yang et al., 2023), is that these MBHs grew rapidly because of intermittent phases of super-Eddington accretion (Madau et al., 2014; Volonteri et al., 2015; Lupi et al., 2016; Pezzulli et al., 2016).
The plausibility of super-Eddington accretion has been demonstrated in the local Universe in tidal disruption events (Lin et al., 2017) and ultra-luminous X-ray sources (Bachetti et al., 2014), and was initially proposed in the context of non-spherical accretion flows within the ‘slim-disc’ model (Abramowicz et al., 1988). Recent simulations of accretion discs show that the slim-disc solution, in which the radiation is trapped in the innermost regions of the accretion disc and advected within the fluid, making the disc moderately luminous, is instead characterised by powerful radiatively driven outflows and jets escaping through a central funnel perpendicular to the disc itself (S\kadowski & Narayan, 2016; S\kadowski et al., 2016; Jiang et al., 2019). To date, the impact of these jets on the interstellar medium of a galaxy host and on the MBH growth itself has only been considered in idealised setups as isolated galaxies (Massonneau et al., 2023b), circum-nuclear discs (Sassano et al., 2023), and atomic cooling haloes just after the formation of a heavy seed MBH (Regan et al., 2019).
In this work, we move forward and study the MBH evolution in the quasar host originally studied in Lupi et al. (2019, 2022) properly accounting for super-Eddington accretion phases in a full cosmological context. The simulation adopts the same initial conditions of the high-redshift quasar originally studied in Lupi et al. (2019, 2022, hereafter Paper I and II). This is the IV of a series of papers addressing properties of high-redshift quasar hosts and their MBHs. In Paper I, we presented and discussed the main evolution of the target galaxy and its central MBH, focussing on the stellar and gas tracers (total gas and [CII] emission), and found that super-Eddington phases were measured in the simulation, even though accretion was capped at the Eddington limit. In paper II, we extended the analysis focussing on the dynamics and morphology of the main galaxy as a function of redshift. In Paper III (Lupi et al. in prep.) we will discuss the evolution of the entire MBH population forming during the simulation, and in Paper V (Quadri et al. in prep.) we will focus in detail on the impact of the super-Eddington regime on the galaxy host and on the properties of quasar outflows.
2 Numerical setup
The simulation follows the evolution of a massive halo ( at ) expected to represent a quasar host (Di Matteo et al., 2017). The initial conditions were accurately created to match the expected halo mass (Di Matteo et al., 2017; Tenneti et al., 2018) and the galaxy overdensity significance (Uchiyama et al., 2018; Mignoli et al., 2020) via music (Hahn & Abel, 2013), adopting the Planck Collaboration et al. (2016) cosmological parameters, with , , , , , and , with no contribution from radiation and curvature. From a parent dark-matter-only simulation, we recursively zoomed-in on a Lagrangian volume extending up to 2.5 virial radii of the target halo following the approach by Fiacconi et al. (2017) to exclude any contamination by low-resolution dark matter particles within the virial radius.
The simulation has been run with gizmo (Hopkins, 2015), descendant of Gadget3 (Springel et al., 2008) and Gadget2 (Springel, 2005) in its meshless-finite-mass mode. The spatial resolution of the simulation was set to 40, 10, and 2.5 pc h-1 for dark matter, stars, and MBHs, respectively, whereas fully adaptive softening was assumed for the gas component, down to a minimum of pc. The mass resolution was for baryons and for dark matter.
Our simulation was performed with state-of-the-art sub-grid prescriptions that allowed us to follow in detail non-equilibrium chemistry of primordial species, star formation and stellar feedback, as well as MBH seeding, accretion, and feedback. Compared to the previous works of the series, here we have slightly revised and improved many of the sub-resolution prescriptions, which we describe as follows:
-
•
Gas thermodynamics and chemistry: we further extended our chemical network to include high-ionization states of several important species that are commonly observed in quasar hosts, namely C[I-IV], O[I-VI], N[I-V], and Fe[I-II], also accounting for their contribution to the gas low-temperature cooling. Since MBHs are commonly surrounded by a hot corona emitting in X-rays, we also incorporated detailed X-ray chemistry calculations in our network, accounting for the impact of Compton heating by the AGN (assuming K and K for soft and hard X-rays respectively),that will be extendedly discussed in Lupi et al. in preparation.
-
•
Star formation: we have slightly revised our estimate for the turbulent support of the gas as in Hopkins et al. (2013), accounting for the particle distribution inside the kernel, which gives . Relative to Lupi et al. (2019, L19 hereon), we have updated our star formation efficiency employing the Padoan et al. (2012) model, as in Lupi & Bovino (2020).
-
•
Stellar mechanical feedback: we redetermined the scalings in Martizzi et al. (2015) to improve the agreement with their results, i.e. we properly account for the initial fraction of kinetic and thermal energy during the Sedov-Taylor phase .
-
•
Stellar radiative feedback: instead of the cost-effective approximated radiation transport of L19, we include here on-the-fly radiation transport as in Lupi et al. (2020), with the reduced speed of light set to , which is large enough compared to the gas motions to ensure consistent results. Since, in addition, we follow X-ray chemistry, we now follow radiation in 11 photobins ranging from 0.7 eV up to 10 keV, where two bins are used to cover soft (0.2-2 keV) and hard (2-10 keV) X-rays.
2.1 MBH accretion/feedback and dynamics
In addition to the changes above, for this work we have devised a novel set of prescriptions for MBH growth and dynamics, that we discuss in detail in the following. MBH seeding, instead, is identical to that in L19, and occurs in galaxies with a stellar mass not yet hosting a MBH, galaxies that are identified through an on-the-fly Friends-of-Friends algorithm (see L19 for details).
2.1.1 MBH dynamics
In most cosmological simulations, the mass and spatial resolution of seed MBHs is not sufficient to accurately resolve the dynamical friction bringing MBHs to the centre of galaxies, and often also the interaction with other particles, leading to spurious scattering of the MBHs. For this reason, most simulations include an ad-hoc MBH pinning procedure (Di Matteo et al., 2005; Schaye et al., 2015; Barai et al., 2018) which moves the MBH to the potential minimum inside its kernel at every time-step. Although effective, this procedure can produce unphysical behaviours like superluminal motions or artificial suppression of the MBH wandering. A more physically motivated prescription artificially corrects the dynamics accounting for the unresolved dynamical friction effect (Dubois et al., 2013; Tremmel et al., 2015), which however requires a sufficiently large mass ratio between the MBH and the other tracers (gas, stars, and dark matter) (Tremmel et al., 2015; Pfister et al., 2019). In Lupi et al. (2019), we ensured a reasonable dynamical evolution by seeding the MBH with an already large mass of . In this work, instead, we opted for decoupling the MBH mass in a physical mass (used for accretion) and a dynamical mass (for the dynamics) (Anglés-Alcázar et al., 2017), which evolve together as soon as the first reaches the second. The physical mass was set to , and the dynamical mass to a value ten times larger, that ensured a better dynamical evolution. From a physical point of view, this initially higher dynamical MBH mass can be considered as an unresolved stellar envelope (a nuclear stellar cluster) surrounding the MBH, which is commonly found in many galaxies in the local Universe (see Neumayer et al., 2020, for a review). From a numerical point of view, however, it is simply used to avoid the spurious scattering by other particles, which despite the very high resolution adopted in this simulation are still more massive than individual stars.
Unlike Tremmel et al. (2017) and Ma et al. (2021), in this work the unresolved dynamical friction is implemented following the more accurate model by Pfister et al. (2019), where the dark matter and stellar distributions are accounted for separately (thus allowing for different distribution functions), and also the high-velocity part of the distribution function is considered. Moreover, we also included gas-driven dynamical friction as described in Tanaka & Haiman (2009), following the prescription in Escala et al. (2004).
2.1.2 MBH accretion and feedback
One of the main novelties of this work is the inclusion of three accretion regimes covering the entire range of accretion rates. We classify them in terms of the Eddington ratio , where is the accretion rate, (Madau et al., 2014), is the Eddington luminosity, and is the speed of light. In principle, the radiative efficiency depends on the MBH spin which in the current simulation is not evolved over time. We set the spin magnitude to a constant value of , which gives the commonly adopted radiative efficiency in the standard sub-Eddington radiatively efficient accretion regime (), and we further assume that the spin is parallel to the angular momentum of the gas within the MBH kernel . While accretion is still modelled using the Bondi-Hoyle-Lyttleton prescription, the resulting MBH feedback has been implemented in radiative and kinetic forms.
Radiative feedback is injected as in Lupi et al. (2020), assuming a composite black body plus X-ray corona spectrum for the MBH, with a bolometric luminosity defined as , with depending on the accretion regime (see below). The fraction of associated to the X-ray corona is determined according to Duras et al. (2020) as:
| (1) |
From this expression, we determine the soft X-ray fraction assuming a power-law spectrum with slope -1.7 for the corona (Regan et al., 2019), and finally obtain the residual black body component as
| (2) |
Kinetic feedback, instead, is implemented for the different regimes as111The final normalizations of the equations in this section correspond to the spin magnitude assumed in our simulation .
-
•
(ADAF regime, Yuan & Narayan, 2014): in this regime, the disc is optically thin and geometrically thick, due to inefficient cooling. Ions and electrons decouple, resulting in a two-temperature accretion flow where the radiative efficiency decays roughly as (Xie & Yuan, 2012). In this regime, a jet is launched along and it forms a cylinder with the base defined by the MBH kernel with an efficiency determined as (Blandford & Znajek, 1977; Tchekhovskoy & Giannios, 2015):
(3) where is the maximum magnetic flux in the disc, is a critical value corresponding to a magnetically-arrested disc (MAD, Narayan et al., 2003), and . The mass loading of the jet in our simulation is determined assuming energy conservation and a jet velocity , which gives
(4) -
•
(sub-Eddington radiatively efficient accretion): this is the regime occurring in typical AGN, where the disc is geometrically thin and optically thick, and can be understood in terms of the Shakura and Sunyaev solution (Shakura & Sunyaev, 1973). In this case, we assume the MBH feedback to be in the form of radiation (again assuming a composite black-body + corona spectrum) and bipolar line-driven winds whose mass loading is given by momentum conservation during the matter-radiation interaction (Choi et al., 2012; Anglés-Alcázar et al., 2017), i.e.
(5) where is the accretion luminosity. The resulting energy coupling efficiency for the wind, which is launched assuming a semi-aperture of 45 (Sala et al., 2021), can be estimated in
(6) -
•
(super-Eddington accretion): in this regime, we assume radiative+kinetic MBH feedback, where the radiative component is determined according to the slim-disc solution, with the radiative efficiency obtained by Lupi et al. (2016):
(7) where , , and are spin-dependent coefficients that in our case assume values , , and respectively. Although radiation is expected to be trapped in the innermost regions of the slim disc, in this work we neglect any change in the spectral shape of the radiation spectrum, leaving this exploration for a future study. The kinetic efficiency in this case is computed according to Tchekhovskoy & Giannios (2015) and Sa̧dowski et al. (2016) for a magnetically-driven jet, i.e.
(8) corresponding to a mass loading .
A crucial parameter affecting the jet efficiency is the limiting magnetic field relative to the MAD limit. In this work, we consider two cases, one at the MAD limit () and one at half the limit (; HMAD hereon) (see Sa̧dowski et al., 2016, for a discussion). At every accretion event, we estimate the accretion rate on the MBH from its 96 nearest gas neighbours, we compare it with the Eddington limit, and then determine and for the corresponding regime. An important aspect that must be considered is that, for very high accretion rates, the large mass-loading factor might yield a total gas mass affected by the MBH accretion/feedback process over a time-step which exceeds the available mass in the MBH kernel. In these cases, we follow Regan et al. (2019) and assume that the estimated accretion only occurs for a fraction of time
| (9) |
where . At this point, we randomly flag enough gas particles around the MBH to guarantee , where part of the mass is accreted and part is kicked away in a kinetic wind/jet. In the case of , we simply select particles to be kicked away in an outflow, in order to ensure mass conservation. In order to prevent the outflowing gas particles to propagate over large distances without interacting (over a single timestep they might be end up well outside the galaxy), we update the timestep of the kicked particles to , where is the effective gas cell size (Hopkins, 2015) and is the Courant factor.
3 Results
With the model just described, we have run the same initial conditions of Lupi et al. (2019) down to , when the MBH has already formed near the centre of its host, but the galaxy has still a low enough mass for supernovae to stunt the MBH growth completely. At this point, we split the simulation in two equivalent runs, MAD and HMAD, which only differ by the magnetic flux parameter . The simulations have been run down to , in order to follow the early growth of the MBH seeds in the galaxy host, whose evolution we are going to discuss in this section.
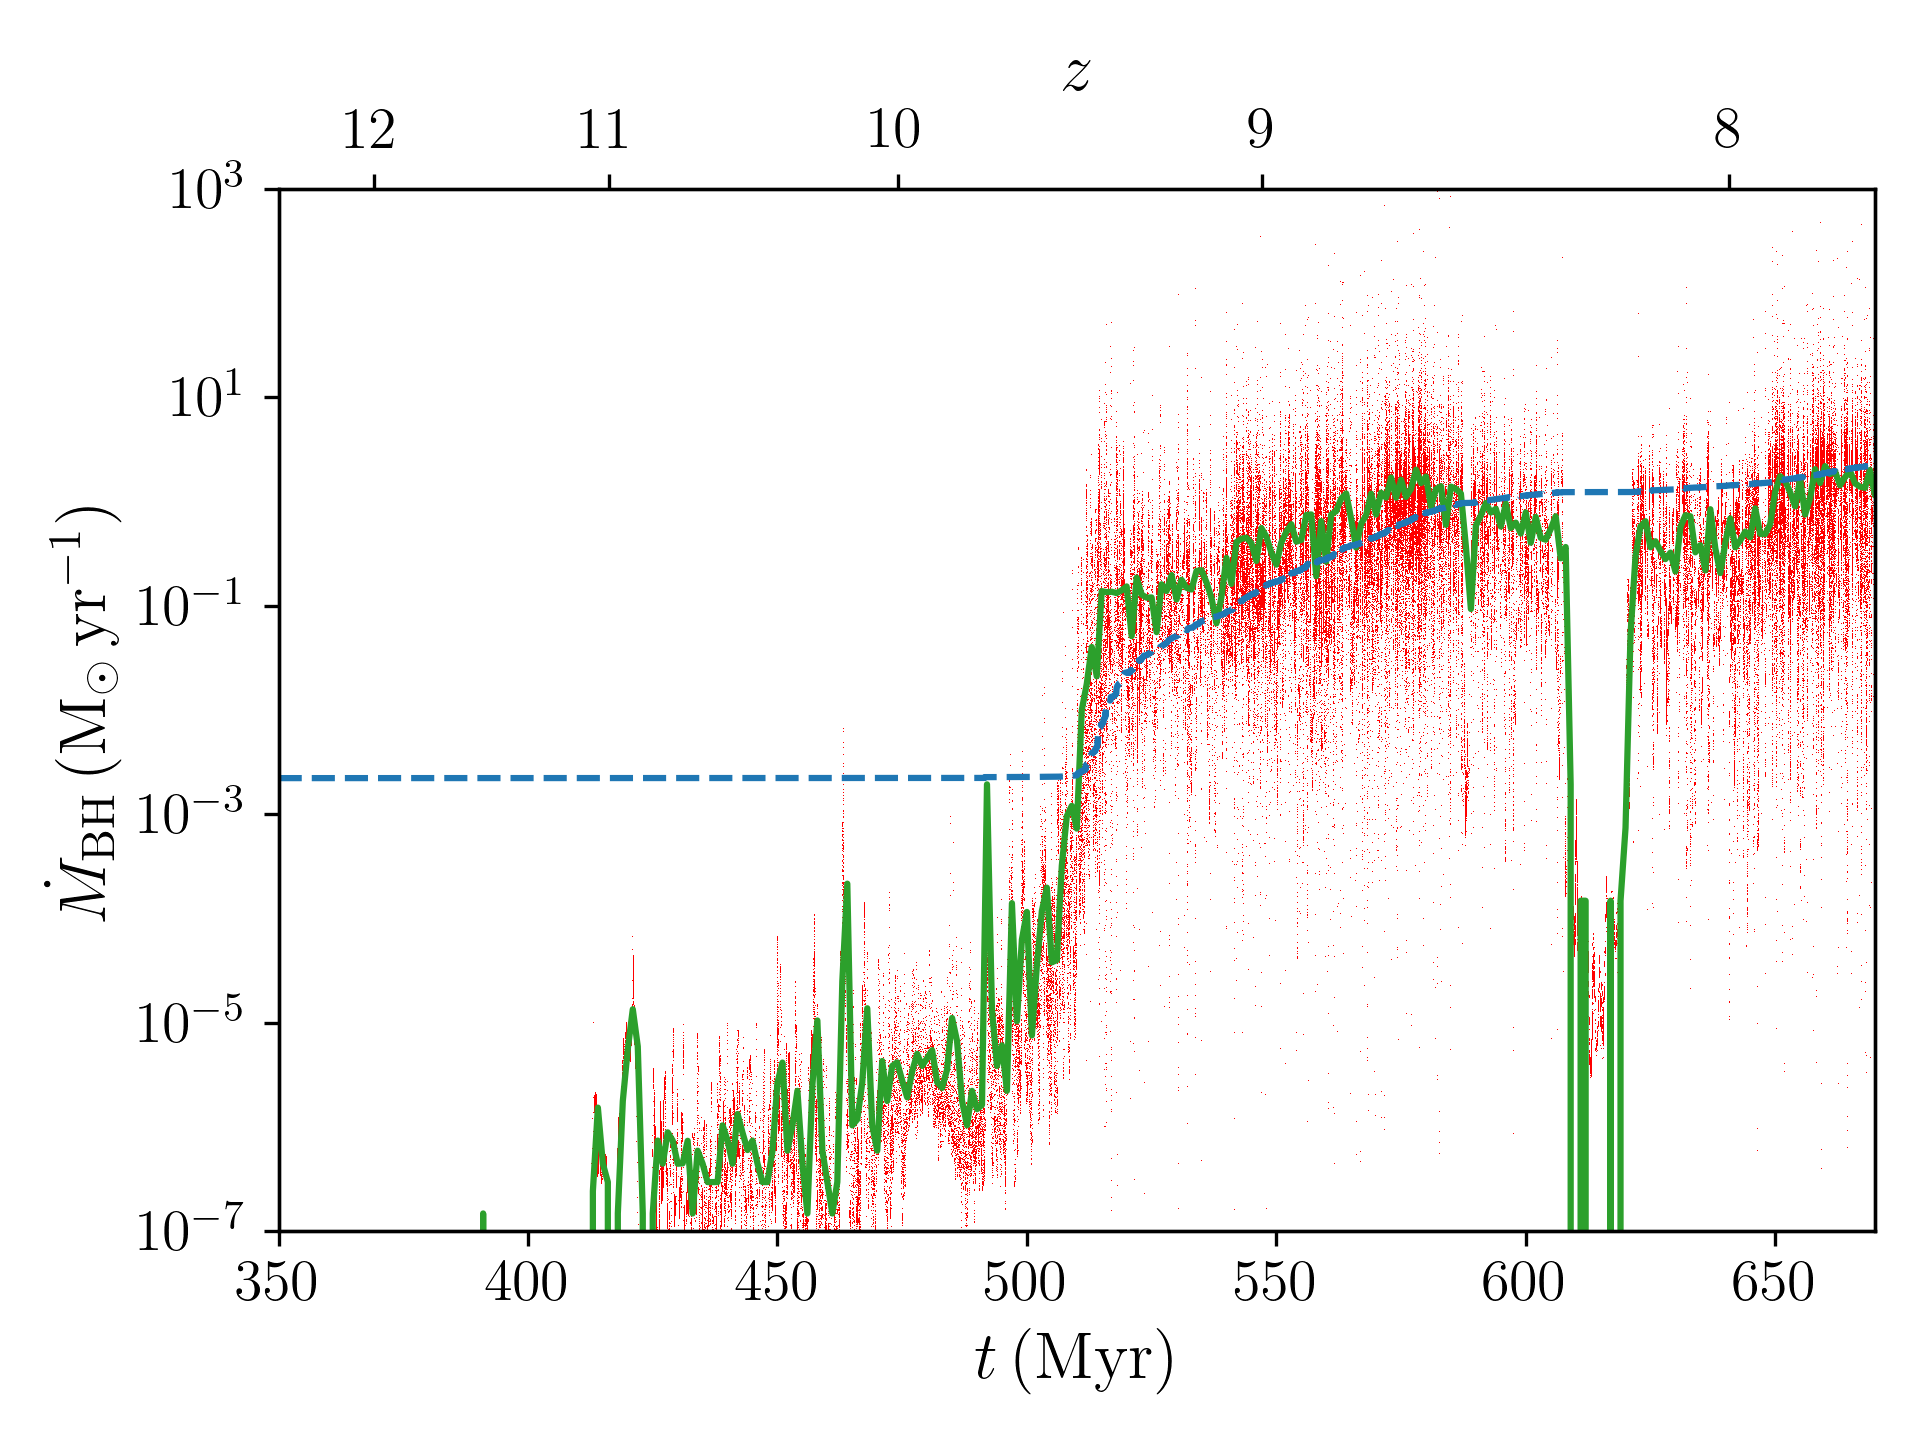
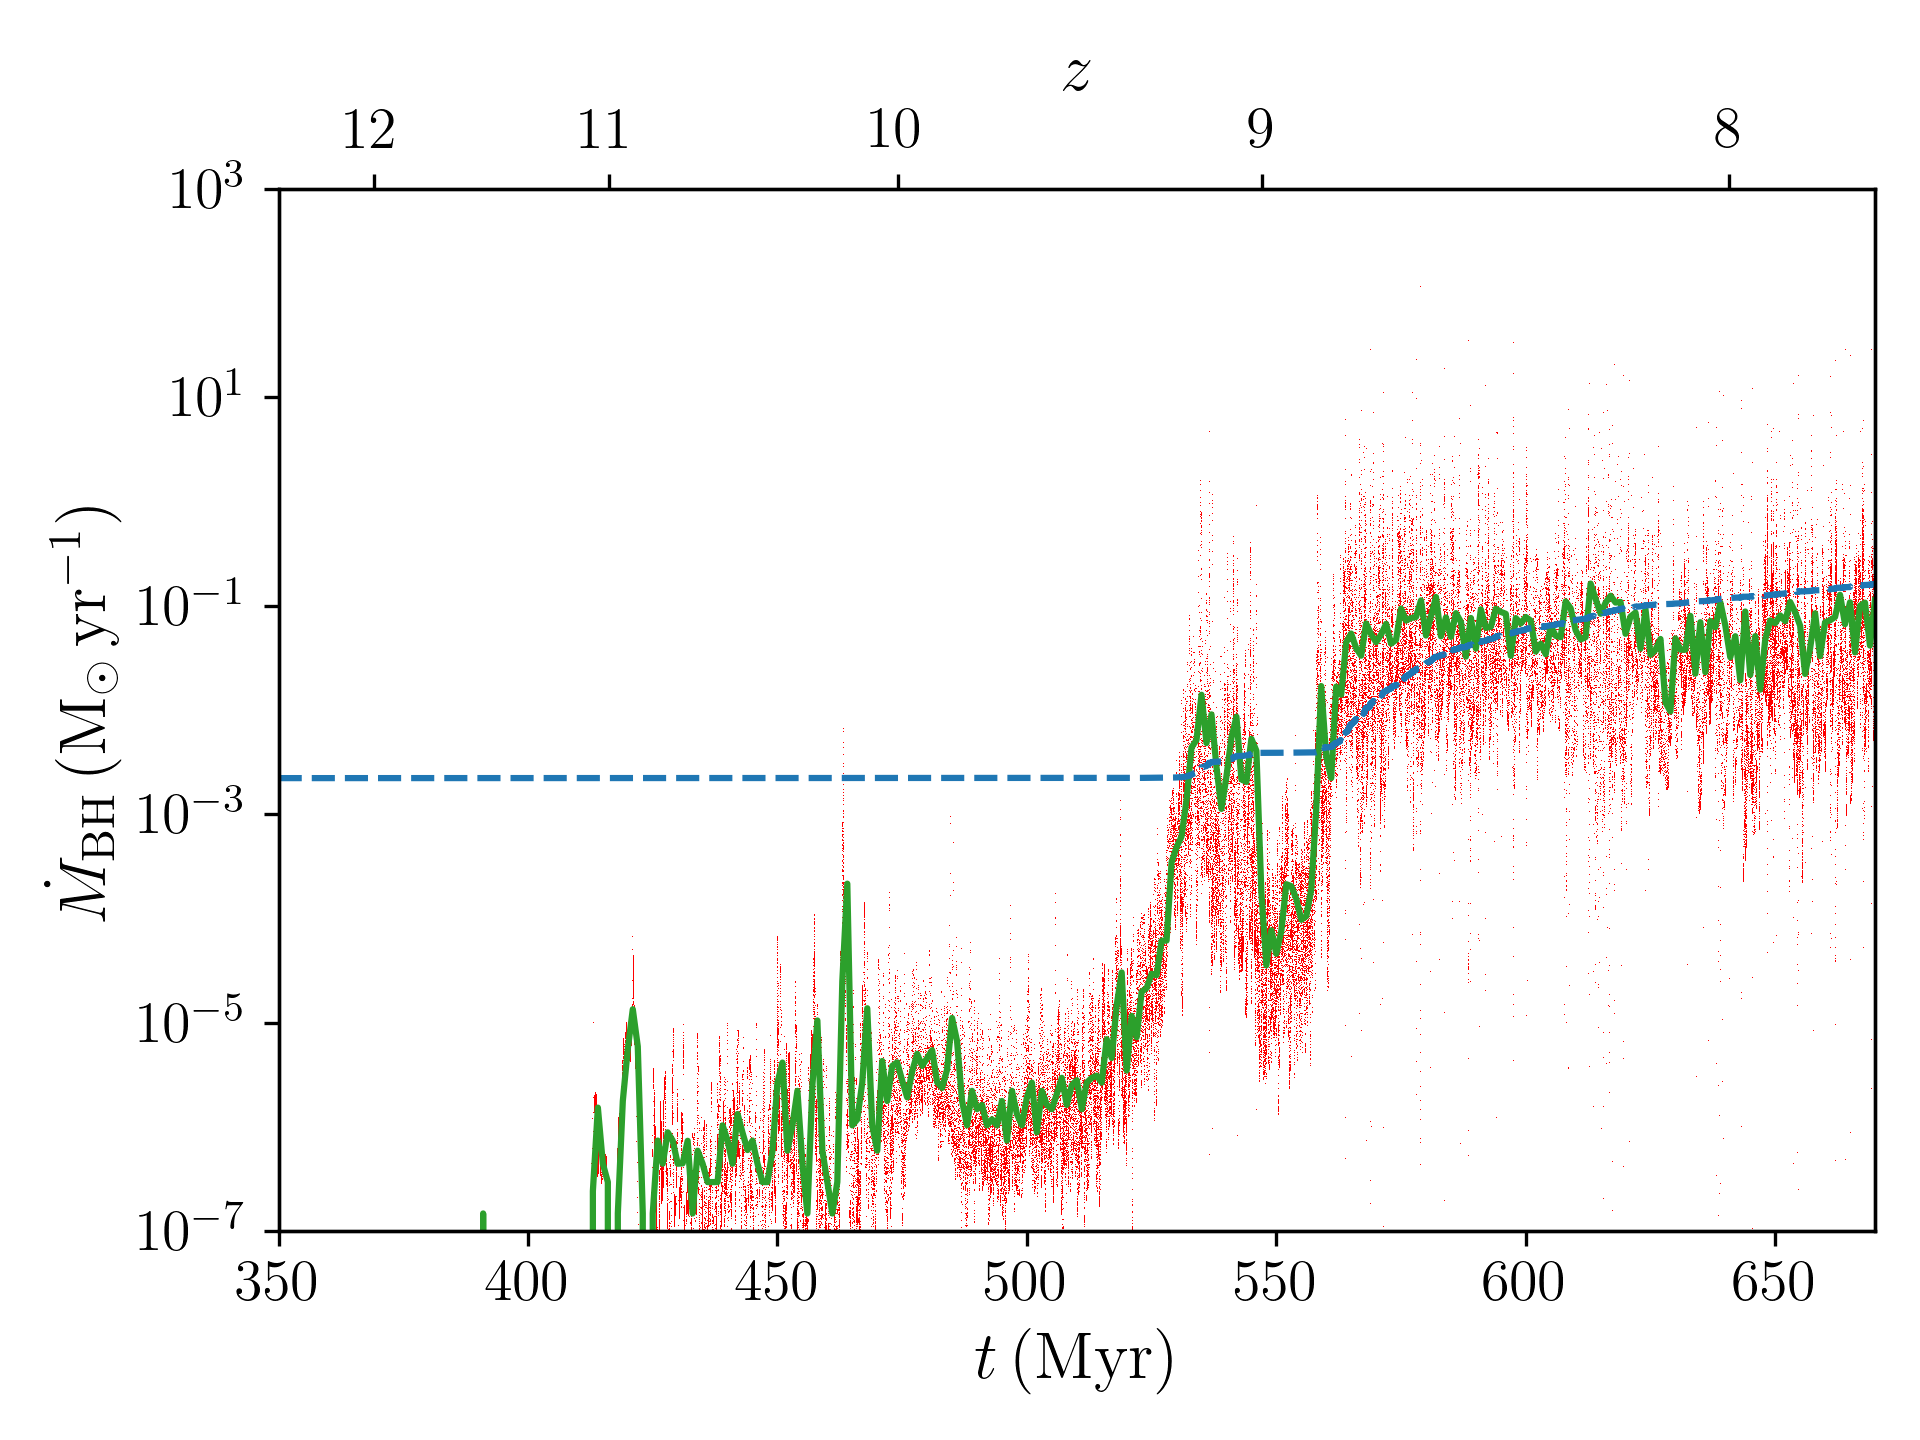
In Fig. 1, we report the accretion rate on the MBH in the two cases, as directly obtained from the simulation (red dots), and averaged over a 1 Myr timescale (green solid line). As a comparison, we also report as a blue dashed line the Eddington accretion rate at every step of the evolution. The instantaneous exhibits very large excursions, which are associated to the intermittency between large inflows and the MBH feedback self-regulation.
On average, however, we can divide the evolution in three main stages (see also Lupi et al., 2019). (i) In the early stages after MBH seeding ( Myr), supernova feedback strongly perturbs the gas in the galaxy, preventing the MBH (which is also offset from the galaxy centre) from efficiently accreting. (ii) When the MBH settles in the centre of the galaxy and the potential well becomes deep enough to sustain ingent gas inflows to the centre (), rapidly grows, easily exceeding Eddington by a factor of a few (MAD) or a few tens (HMAD). At this stage, the HMAD simulation shows an almost unimpeded super-Eddington growth for about 60 Myr, followed by (iii) a decrease of the accretion rate to values between a fraction and 100% Eddington, corresponding to the self-regulation stage. In both cases, there are sudden drops in the accretion rates, around and for the HMAD and MAD cases respectively. These rapid variations are associated to the potential misalignment of the gas in the galaxy nuclear region and the galactic disc plane, which reflects in winds/jets directly hitting the disc instead of escaping perpendicular to it. In these phases, the gas is expelled from the galaxy centre, and falls back on a timescale comparable with the free-fall time of the gas, i.e. Myr for a typical gas density between 1 and 100 .
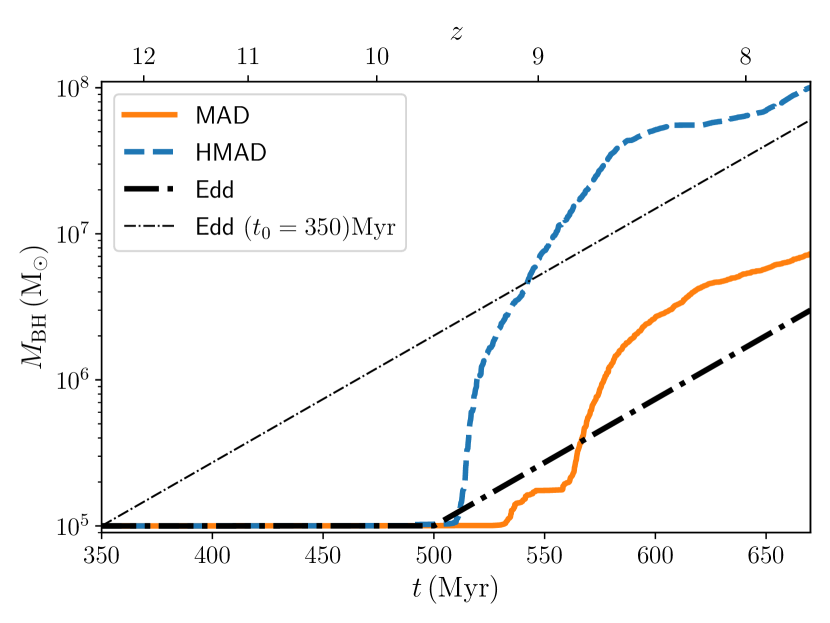
The evolution just discussed reflects in the mass growth reported in Fig. 2 for both simulations, where the MAD case is reported as an orange solid line and the HMAD one as a blue dashed line. We also report for comparison the growth assuming accretion at constant Eddington rate as black dot-dashed lines. The thick curve starts rising at Myr, when the MBH effectively starts growing in the simulation, whereas the thin curve starts at Myr, immediately after seeding. The three stages just discussed can be noticed also here in this Figure. The time at which the MBH starts growing is slightly different between the two simulations, because of the small differences appeared when the simulations have been restarted from the parent one, that built up over time changing the MBH history. Apart from this, and the plateaus in the growth history when the accretion rate drops, the growth exhibits a similar behaviour, i.e. an initial rapid growth well above the Eddington limit, which lasts longer in the HMAD case due to the lower MBH feedback efficiency, followed by a self-regulation phase when the MBH settles at the Eddington limit or at a fraction of it.
Despite the quite large efficiency of the jet feedback during super-Eddington phases, the HMAD MBH is able to grow by almost three orders of magnitude in less than 100 Myr, whereas the MAD one stays one order of magnitude below over the same time interval. Another important aspect to keep in mind when looking at this evolution is that, when the MBH in the HMAD case starts to self-regulate its growth, the MBH mass is so large that super-Eddington phases begin to require extremely large inflow rates in the galaxy nucleus, which are less and less likely as the galaxy evolves and the gas fraction diminishes. In the Eddington-limited case, an initially more massive MBH or an earlier start of accretion are needed to ensure a growth in mass comparable to the two cases we simulated here.
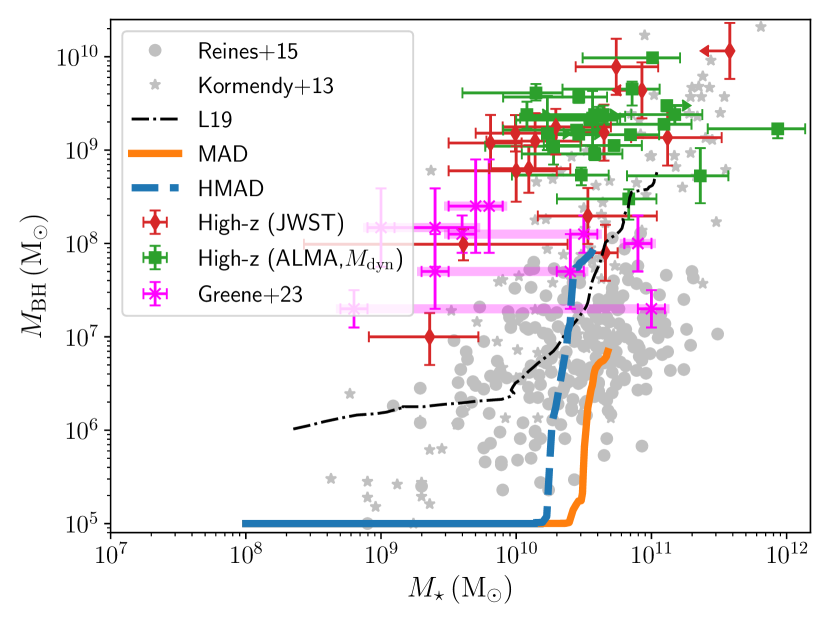
Since this rapid growth may have important implications for the MBH-galaxy correlations, we report in Fig. 3 the evolution of the MBH together with the galaxy host stellar mass for the two cases, using the same colour scheme of Fig. 2. We also show for comparison the observations of low-redshift AGN by Reines & Volonteri (2015) as grey dots, elliptical galaxies by Kormendy & Ho (2013) as grey stars, and high-redshift observations by ALMA as green squares (Neeleman et al., 2021) and JWST as red diamonds (Yue et al., 2023; Stone et al., 2023a, b; Harikane et al., 2023; Maiolino et al., 2023). We also report as magenta crosses the ‘little red dots’ observed by Greene et al. (2023), with the stellar masses estimated according to JWST photometry only and including ALMA photometry by Labbe et al. (2023), where the magenta shaded area connects the two mass estimates for each source.222Note that the emission in this case is dominated by the AGN and dust, hence the stellar mass estimates are only indicative, but likely smaller than 10 because the Little Red Dots are selected to be point sources. We see that, in both cases, the MBH starts at the lower end of the distribution and rapidly grows, but only the HMAD case is able to reach the upper limit of the distribution, thanks to a less effective MBH feedback. Then, when the MBH starts to self-regulate, even the growth of the HMAD MBH slows down, moving toward the region occupied by giant ellipticals (see L19 for a discussion).
Finally, note that the super-Eddington phase was able to start only after the weakening of the impact of supernova feedback on the galaxy, in agreement with other simulations (Dubois et al., 2014; Anglés-Alcázar et al., 2017; Lupi et al., 2019), hence preventing the simulated MBHs to actually reach the region occupied by high-redshift overmassive MBHs, especially those observed in low-mass galaxies (e.g. Maiolino et al., 2023). This might be a potential issue in explaining the overmassive MBHs, unless an even weaker super-Eddington feedback or more favourable inflow conditions occur around these MBHs.
4 Discussion and Conclusions
In this work, we have performed high resolution cosmological zoom-in simulations of a massive halo at high redshift, expected to be a quasar host. The simulations include for the first time in a cosmological simulation a sub-resolution model for the three main accretion regimes, from ADAF up to super-Eddington. The model accounts for MBH accretion-powered feedback in the form of radiation and kinetic winds/jets, with an efficiency determined consistently for the different cases. The results we have found here, that will be complemented by a more thorough analysis of the MBH-galaxy interplay and the properties of the MBH outflows in a forthcoming paper (Quadri et al. in prep.), show that super-Eddington phases might be sustained over time-scales of a few tens of Myr in massive systems where large gas inflows are frequent, systems that are quite different from those investigated in Regan et al. (2019) and Massonneau et al. (2023b). However, some important caveats need to be mentioned:
-
•
The resolution of the simulation is not high enough to properly resolve the Bondi-Hoyle-Lyttleton radius of the MBH, hence potentially affecting the estimated accretion rate. Note, nonetheless, that a higher accretion rate reflects in a stronger feedback, which has the potential to clear out the central region of the galaxy (as sometimes occurred in our simulations), hindering accretion for a few tens of Myr.
-
•
The launch direction of the feedback is instantaneously aligned with the gas within the MBH kernel, without taking into account the actual direction of an unresolved accretion disc. This means that, if the gas in the galaxy has settled in a disc-like configuration, most of the time the kinetic feedback escapes without interacting significantly with the galaxy, hence without suppressing accretion for a long time. In a more realistic case, the alignment of the accretion disc might occur on much longer time-scales, hence affecting the impact of the feedback.
-
•
The results of this simulation provide a more optimistic outlook on the role of super-Eddington accretion in growing high-redshift black holes compared to previous numerical investigations in a galactic/cosmological context (Regan et al., 2019; Massonneau et al., 2023b). To assess the reasons for this difference, we measured the gas density and temperature around the MBH, finding that every super-Eddington burst was followed by an increase of the gas temperature up to (above the peak of the cooling curve), due to the jet shocking with the gas, consistent with the results in Regan et al. (2019) and Massonneau et al. (2023b). Despite this strong heating, the density around the MBH did not change dramatically, always remaining on average in the range , a value significantly larger than that in Massonneau et al. 2023b. This suggests that the combination of a deep potential well, the pressure of the inflowing gas from larger scales, and a short free-frall time (see Regan et al. 2019 for a discussion) prevented the gas from escaping the galaxy nucleus. As a consequence, after each jet event, the accretion rate suppression we observed is short-lived and is followed by a rapid rise as soon as the gas cooled down. Note, however, that the limited resolution of our simulation might still underestimate the effect of the jet feedback, by not properly resolving the early expansion of the shocked gas, and further investigations are needed.
-
•
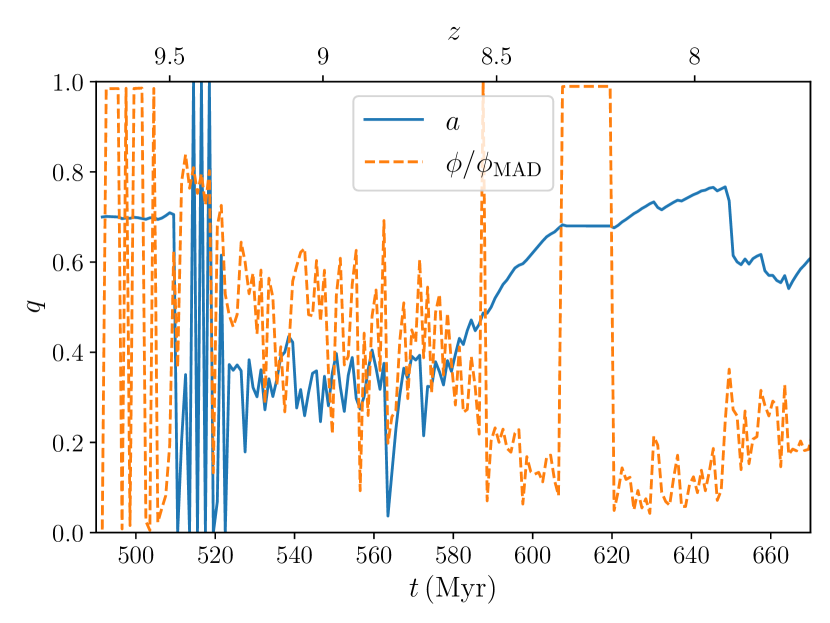
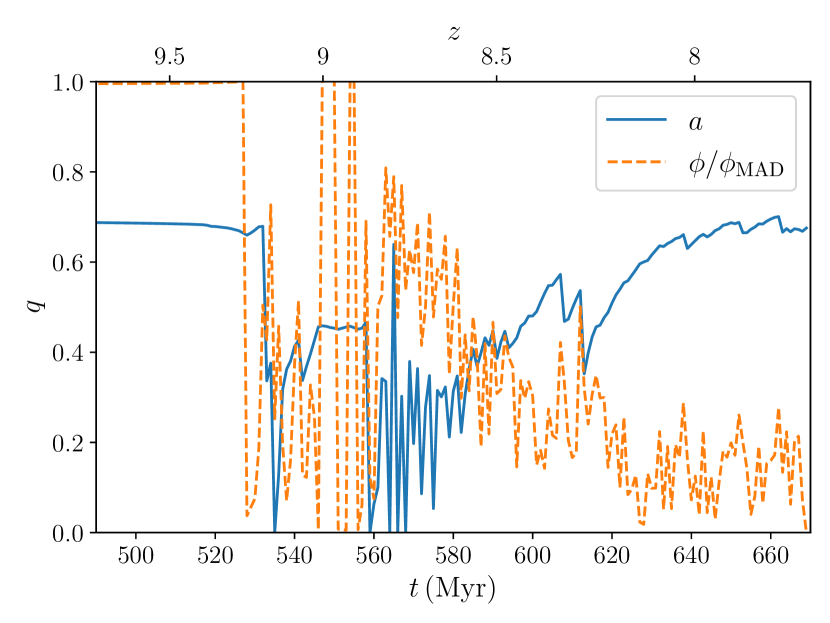
The magnitude of the spin in the simulations has been kept fixed. This has profound implications for the evolution. First, since the jet launched during super-Eddington accretion phases extracts rotational energy from the MBH (Blandford & Znajek, 1977), the spin should decrease rapidly, thus overcoming the spin-up due to coherent accretion. This would likely result in a lower spin during the first accretion phases, hence a lower kinetic efficiency for the jet, even in the MAD case, which would enable the MBH to grow almost unimpeded until the MBH spin and mass become large enough for feedback to start playing a role (Massonneau et al., 2023a). In order to test this idea, we have computed the spin evolution semi-analytically, by means of the model in Ricarte et al. (2023), employing the accretion rates and the MBH masses from our simulations. In particular, we employed the 1 Myr average quantities instead of the full data sample, in order to limit the effect of strong fluctuations on our conclusions. The results are reported in Fig. 4, where the blue lines correspond to the spin evolution as a function of time, and the orange dashed line to the disc MAD-ness as defined in Ricarte et al. (2023) for (at lower Eddington ratios a MAD disc is assumed):
(10) where and .
We clearly observe that, during the super-Eddington phases, the MBH spin rapidly decreases to values around 0.3, which correspond to jet efficiencies about 4 times lower than those employed in the simulations, and only during the later phases when the accretion rate settles at sub-Eddington values the spin is able to grow up to the initial values. During the evolution, the MAD-ness of the disc also exhibits strong variations, with average values during the super-Eddington phases around 0.5, hence more consistent with our HMAD simulation than the MAD one.
Concluding, in this work we have shown that, despite the unfavourable conditions associated to assuming a relatively high spin and a consequently strong jet feedback, MBHs in gas-rich environments at high redshift can support long-lasting super-Eddington accretion phases, rapidly growing in mass within their host galaxies. Moreover, because of this rapid growth, these MBHs can easily move above the local correlations before starting regulating themselves, potentially explaining the formation of overmassive systems.
Acknowledgements.
References
- Abramowicz et al. (1988) Abramowicz, M. A., Czerny, B., Lasota, J. P., & Szuszkiewicz, E. 1988, ApJ, 332, 646
- Anglés-Alcázar et al. (2017) Anglés-Alcázar, D., Faucher-Giguère, C.-A., Quataert, E., et al. 2017, MNRAS, 472, L109
- Bañados et al. (2018) Bañados, E., Venemans, B. P., Mazzucchelli, C., et al. 2018, Nature, 553, 473
- Bachetti et al. (2014) Bachetti, M., Harrison, F. A., Walton, D. J., et al. 2014, Nature, 514, 202
- Barai et al. (2018) Barai, P., Gallerani, S., Pallottini, A., et al. 2018, MNRAS, 473, 4003
- Blandford & Znajek (1977) Blandford, R. D. & Znajek, R. L. 1977, MNRAS, 179, 433
- Choi et al. (2012) Choi, E., Ostriker, J. P., Naab, T., & Johansson, P. H. 2012, ApJ, 754, 125
- Davies et al. (2019) Davies, F. B., Hennawi, J. F., & Eilers, A.-C. 2019, ApJ, 884, L19
- Di Matteo et al. (2017) Di Matteo, T., Croft, R. A. C., Feng, Y., Waters, D., & Wilkins, S. 2017, MNRAS, 467, 4243
- Di Matteo et al. (2005) Di Matteo, T., Springel, V., & Hernquist, L. 2005, Nature, 433, 604
- Dubois et al. (2013) Dubois, Y., Gavazzi, R., Peirani, S., & Silk, J. 2013, MNRAS, 433, 3297
- Dubois et al. (2014) Dubois, Y., Pichon, C., Welker, C., et al. 2014, MNRAS, 444, 1453
- Duras et al. (2020) Duras, F., Bongiorno, A., Ricci, F., et al. 2020, A&A, 636, A73
- Escala et al. (2004) Escala, A., Larson, R. B., Coppi, P. S., & Mardones, D. 2004, ApJ, 607, 765
- Fan et al. (2023) Fan, X., Bañados, E., & Simcoe, R. A. 2023, ARA&A, 61, 373
- Fan et al. (2006) Fan, X., Strauss, M. A., Richards, G. T., et al. 2006, AJ, 131, 1203
- Fiacconi et al. (2017) Fiacconi, D., Mayer, L., Madau, P., et al. 2017, MNRAS, 467, 4080
- Greene et al. (2023) Greene, J. E., Labbe, I., Goulding, A. D., et al. 2023, arXiv e-prints, arXiv:2309.05714
- Hahn & Abel (2013) Hahn, O. & Abel, T. 2013, MUSIC: MUlti-Scale Initial Conditions, Astrophysics Source Code Library
- Harikane et al. (2023) Harikane, Y., Zhang, Y., Nakajima, K., et al. 2023, arXiv e-prints, arXiv:2303.11946
- Hopkins (2015) Hopkins, P. F. 2015, MNRAS, 450, 53
- Hopkins et al. (2013) Hopkins, P. F., Cox, T. J., Hernquist, L., et al. 2013, MNRAS, 430, 1901
- Jiang et al. (2019) Jiang, Y.-F., Blaes, O., Stone, J. M., & Davis, S. W. 2019, ApJ, 885, 144
- Kormendy & Ho (2013) Kormendy, J. & Ho, L. C. 2013, ARA&A, 51, 511
- Labbe et al. (2023) Labbe, I., Greene, J. E., Bezanson, R., et al. 2023, arXiv e-prints, arXiv:2306.07320
- Latif et al. (2015) Latif, M. A., Bovino, S., Grassi, T., Schleicher, D. R. G., & Spaans, M. 2015, MNRAS, 446, 3163
- Latif et al. (2022) Latif, M. A., Whalen, D. J., Khochfar, S., Herrington, N. P., & Woods, T. E. 2022, Nature, 607, 48
- Lin et al. (2017) Lin, D., Guillochon, J., Komossa, S., et al. 2017, Nature Astronomy, 1, 0033
- Lupi & Bovino (2020) Lupi, A. & Bovino, S. 2020, MNRAS, 492, 2818
- Lupi et al. (2016) Lupi, A., Haardt, F., Dotti, M., et al. 2016, MNRAS, 456, 2993
- Lupi et al. (2021) Lupi, A., Haiman, Z., & Volonteri, M. 2021, MNRAS, 503, 5046
- Lupi et al. (2020) Lupi, A., Pallottini, A., Ferrara, A., et al. 2020, MNRAS, 496, 5160
- Lupi et al. (2022) Lupi, A., Volonteri, M., Decarli, R., Bovino, S., & Silk, J. 2022, MNRAS, 510, 5760
- Lupi et al. (2019) Lupi, A., Volonteri, M., Decarli, R., et al. 2019, MNRAS, 488, 4004
- Ma et al. (2021) Ma, L., Hopkins, P. F., Ma, X., et al. 2021, MNRAS, 508, 1973
- Madau et al. (2014) Madau, P., Haardt, F., & Dotti, M. 2014, ApJ, 784, L38
- Maiolino et al. (2023) Maiolino, R., Scholtz, J., Curtis-Lake, E., et al. 2023, arXiv e-prints, arXiv:2308.01230
- Martizzi et al. (2015) Martizzi, D., Faucher-Giguère, C.-A., & Quataert, E. 2015, MNRAS, 450, 504
- Massonneau et al. (2023a) Massonneau, W., Dubois, Y., Volonteri, M., & Beckmann, R. S. 2023a, A&A, 669, A143
- Massonneau et al. (2023b) Massonneau, W., Volonteri, M., Dubois, Y., & Beckmann, R. S. 2023b, A&A, 670, A180
- Mignoli et al. (2020) Mignoli, M., Gilli, R., Decarli, R., et al. 2020, A&A, 642, L1
- Mortlock et al. (2011) Mortlock, D. J., Warren, S. J., Venemans, B. P., et al. 2011, Nature, 474, 616
- Narayan et al. (2003) Narayan, R., Igumenshchev, I. V., & Abramowicz, M. A. 2003, PASJ, 55, L69
- Neeleman et al. (2021) Neeleman, M., Novak, M., Venemans, B. P., et al. 2021, ApJ, 911, 141
- Neumayer et al. (2020) Neumayer, N., Seth, A., & Böker, T. 2020, A&A Rev., 28, 4
- Padoan et al. (2012) Padoan, P., Haugbølle, T., & Nordlund, Å. 2012, ApJ, 759, L27
- Pezzulli et al. (2016) Pezzulli, E., Valiante, R., & Schneider, R. 2016, MNRAS, 458, 3047
- Pfister et al. (2019) Pfister, H., Volonteri, M., Dubois, Y., Dotti, M., & Colpi, M. 2019, arXiv e-prints [arXiv:1902.01297]
- Planck Collaboration et al. (2016) Planck Collaboration, Ade, P. A. R., Aghanim, N., et al. 2016, A&A, 594, A13
- Regan et al. (2019) Regan, J. A., Downes, T. P., Volonteri, M., et al. 2019 [arXiv:1811.04953]
- Reines & Volonteri (2015) Reines, A. E. & Volonteri, M. 2015, ApJ, 813, 82
- Ricarte et al. (2023) Ricarte, A., Narayan, R., & Curd, B. 2023, ApJ, 954, L22
- Sala et al. (2021) Sala, L., Cenci, E., Capelo, P. R., Lupi, A., & Dotti, M. 2021, MNRAS, 500, 4788
- Sassano et al. (2023) Sassano, F., Capelo, P. R., Mayer, L., Schneider, R., & Valiante, R. 2023, MNRAS, 519, 1837
- Sa̧dowski et al. (2016) Sa̧dowski, A., Lasota, J.-P., Abramowicz, M. A., & Narayan, R. 2016, MNRAS, 456, 3915
- Schauer et al. (2017) Schauer, A. T. P., Regan, J., Glover, S. C. O., & Klessen, R. S. 2017, MNRAS, 471, 4878
- Schaye et al. (2015) Schaye, J., Crain, R. A., Bower, R. G., et al. 2015, MNRAS, 446, 521
- Shakura & Sunyaev (1973) Shakura, N. I. & Sunyaev, R. A. 1973, A&A, 24, 337
- S\kadowski et al. (2016) S\kadowski, A., Lasota, J.-P., Abramowicz, M. A., & Narayan, R. 2016, MNRAS, 456, 3915
- S\kadowski & Narayan (2016) S\kadowski, A. & Narayan, R. 2016, MNRAS, 456, 3929
- Soltan (1982) Soltan, A. 1982, MNRAS, 200, 115
- Springel (2005) Springel, V. 2005, MNRAS, 364, 1105
- Springel et al. (2008) Springel, V., Wang, J., Vogelsberger, M., et al. 2008, MNRAS, 391, 1685
- Stone et al. (2023a) Stone, M. A., Lyu, J., Rieke, G. H., & Alberts, S. 2023a, ApJ, 953, 180
- Stone et al. (2023b) Stone, M. A., Lyu, J., Rieke, G. H., Alberts, S., & Hainline, K. N. 2023b, arXiv e-prints, arXiv:2310.18395
- Tanaka & Haiman (2009) Tanaka, T. & Haiman, Z. 2009, ApJ, 696, 1798
- Tchekhovskoy & Giannios (2015) Tchekhovskoy, A. & Giannios, D. 2015, MNRAS, 447, 327
- Tenneti et al. (2018) Tenneti, A., Di Matteo, T., Croft, R., Garcia, T., & Feng, Y. 2018, MNRAS, 474, 597
- Tremmel et al. (2015) Tremmel, M., Governato, F., Volonteri, M., & Quinn, T. R. 2015, MNRAS, 451, 1868
- Tremmel et al. (2017) Tremmel, M., Karcher, M., Governato, F., et al. 2017, MNRAS, 470, 1121
- Uchiyama et al. (2018) Uchiyama, H., Toshikawa, J., Kashikawa, N., et al. 2018, PASJ, 70, S32
- Volonteri et al. (2015) Volonteri, M., Silk, J., & Dubus, G. 2015, ApJ, 804, 148
- Xie & Yuan (2012) Xie, F.-G. & Yuan, F. 2012, MNRAS, 427, 1580
- Yang et al. (2023) Yang, J., Wang, F., Fan, X., et al. 2023, ApJ, 951, L5
- Yuan & Narayan (2014) Yuan, F. & Narayan, R. 2014, ARA&A, 52, 529
- Yue et al. (2023) Yue, M., Eilers, A.-C., Simcoe, R. A., et al. 2023, arXiv e-prints, arXiv:2309.04614