20XX Vol. X No. XX, 000–000
22institutetext: School of Astronomy and Space Science, University of Chinese Academy of Sciences, No. 19A Yuquan Road, Beijing, 100049, China
accepted 2023 November 2nd
Low Surface Brightness Galaxies selected by different model fitting
Abstract
We present a study of low surface brightness galaxies (LSBGs) selected by fitting the images for all the galaxies in .40 SDSS DR7 sample with two kinds of single-component models and two kinds of two-component models (disk+bulge): single exponential, single sérsic, exponential+deVaucular (exp+deV), and exponential+sérsic (exp+ser). Under the criteria of the B band disk central surface brightness and the axis ratio , we selected four none-edge-on LSBG samples from each of the models which contain 1105, 1038, 207, and 75 galaxies, respectively. There are 756 galaxies in common between LSBGs selected by exponential and sérsic models, corresponding to 68.42% of LSBGs selected by the exponential model and 72.83% of LSBGs selected by the sérsic model, the rest of the discrepancy is due to the difference in obtaining between the exponential and sérsic models. Based on the fitting, in the range of , the relation of from two models can be written as . The LSBGs selected by disk+bulge models (LSBG_2comps) are more massive than LSBGs selected by single-component models (LSBG_1comp), and also show a larger disk component. Though the bulges in the majority of our LSBG_2comps are not prominent, more than 60% of our LSBG_2comps will not be selected if we adopt a single-component model only. We also identified 31 giant low surface brightness galaxies (gLSBGs) from LSBG_2comps. They are located at the same region in the color-magnitude diagram as other gLSBGs. After we compared different criteria of gLSBGs selection, we find that for gas-rich LSBGs, is the best to distinguish between gLSBGs and normal LSBGs with bulge.
keywords:
catalogs — galaxies: spiral — galaxies: bulges — methods: data analysis — methods: statistical1 Introduction
Low surface brightness galaxies (LSBGs) are galaxies whose central surface brightness of the disk component is at least one magnitude fainter than the sky brightness (Impey & Bothun, 1997). Studies show that the LSBGs are under-evolved because they generally have sparse H emission (Pickering et al., 1997; Huang et al., 2014), low star formation rate (SFR), low SFR surface density (van der Hulst et al., 1993; Galaz et al., 2011; Lei et al., 2018, 2019), and low metallicity (McGaugh & Bothun, 1994; Liang et al., 2010). They are rich in neutral hydrogen () gas (de Blok et al., 1996; Burkholder et al., 2001; O’Neil, 2004; Du et al., 2015), but have little CO molecules (O’Neil et al., 2003; Honey et al., 2018), indicating they have low efficiency in converting H\@slowromancapi@ gas to molecules (Cao et al., 2017).
LSBGs are mostly late-type disk-dominated galaxies (McGaugh & Bothun, 1994; de Blok et al., 1995). O’Neil et al. (1997) show around 80% of the galaxies in their LSBGs sample are well-fitted by an exponential profile. So it is appropriate to fit the LSBGs with a single disk model, many authors have done so (O’Neil et al., 1997; Du et al., 2015). However, McGaugh et al. (1995b) claim that a small but significant subset of LSBGs has (bulge-to-disk ratio), Pahwa & Saha (2018) show that about 40% of the galaxies in their LSBGs sample are with bulges. This kind of LSBGs that have bulges at their center will be lost if only a single disk model is adopted. Then two approaches arose, one is to process a bulge+disk decomposition to get the central surface brightness of disk component (Pizzella et al., 2008; Pahwa & Saha, 2018), another is to use the average surface brightness within effective radius () instead of central surface brightness () to reduce the effect of luminosity concentration in the galaxy center (Greco et al., 2018; Martin et al., 2019; Tanoglidis et al., 2021). The second approach cannot get detailed information of the disk component, motivating us to search for LSBGs with bulges by using the bulge+disk decomposition method.
In another aspect, the observation technology improved and the wide-field surveys developed a lot in the last two decades, e.g., the Sloan Digital Sky Survey (SDSS; York et al. 2000), the Dark Energy Camera Legacy Survey (DECaLS; Dey et al. 2019), the Arecibo Legacy Fast ALFA survey (ALFALFA; Giovanelli et al. 2005). People can dig deeper and wider in the sky, also bringing more opportunities for us to search for LSBGs. For example, 12282 LSBGs were selected from SDSS data release 4 (DR4) to study their stellar population (Zhong et al., 2008) and metallicities (Liang et al., 2010); Galaz et al. (2011) also selected 9421 LSBGs from SDSS DR4 to investigate their spatial distribution. The combination of optical images and H\@slowromancapi@ spectra provides us with one of the best laboratories for studying gas-rich LSBGs. Haynes et al. (2011) provide a cross-reference catalog, which contains 12468 galaxies, of .40 (40% sky area of the full ALFALFA) and SDSS Data Release 7 (DR7; Abazajian et al. 2009), and Du et al. (2015) (hereafter Du15) developed a pipeline to reestimate the sky background for 12423 galaxies belonging to the PhotoPrimary catalog in the .40 SDSS DR7 sample to avoid the sky background overestimation by the photometric pipeline of the SDSS. Based on the background resubtracted images, Du15 selected a none-edge-on LSBG sample of 1129 galaxies by using a single exponential model fitting, this paper focuses on selecting LSBGs from different models and searching for LSBGs with bulges by applying disk+bulge model.
The rest of the paper is arranged as follows. In Section 2, we describe our parent sample, model fitting, and the method of central surface brightness () calculation. Section 3 shows our LSBGs samples and their statistical properties. In Section 4, we discuss the gLSBGs selection. Finally, we summarize this paper in Section 5.
2 Sample and fitting
2.1 Parent sample
Many researchers, including the ones in the SDSS team, noticed that the sky background in the SDSS imaging pipeline is overestimated (Adelman-McCarthy et al., 2006, 2008; Lauer et al., 2007; Liu et al., 2008; Hyde & Bernardi, 2009; He et al., 2013), leading to the galaxy brightness being underestimated. Because the central surface brightness of LSBGs is fainter than the sky background, the outer parts of LSBGs are even fainter. The inaccurate background will influence the photometry, model fitting, and LSBG selection. Du15 carefully estimated the sky background of SDSS images in both g and r bands for 12,423 galaxies in the .40 SDSS DR7 sample (Haynes et al., 2011). After their background subtraction, the count distributions for the whole image and the local vicinity, which defined as the region between the two square boxes sized 250 250 pixels and 500 500 pixels from the galaxy center, are both well fitted by a Gaussian profile with mean values very close to 0 ADU (see Figure 3 in Du15). We take the 12,423 galaxies as our parent sample in selecting LSBGs, taking advantage of their better analysis on the sky subtraction.
We took photometry for all galaxies in our parent sample by using SExtractor software (Bertin & Arnouts, 1996). A flexible elliptical aperture, the Kron aperture defined by Kron (1980), was used to get magnitude (MAG_AUTO). The apertures of g and r bands are the same which were defined by the r band image. The parameters from SExtractor, including magnitude, effective radius, axis ratio, and position angle, are used as initial guess for model fitting.
2.2 Model fitting
Galfit is a two-dimensional fitting algorithm to extract structural components of galaxies (Peng et al., 2002, 2010). It provides some of the most commonly used radial profiles in astronomy literature, e.g., the exponential, sérsic, deVaucular, gaussian, moffat, and psf profiles. The exponential and deVaucular profiles are special cases of the sérsic function when and , respectively. Users can adopt a single profile or a combination of a number of profiles, and set initial values for input parameters of each profile. During the fitting, the reduced is minimized, and the minimization engine is based on the Levenberg-Marquardt downhill gradient algorithm.
We carried out two kinds of single-component fitting and two kinds of two-component (disk+bulge) fitting: the single exponential profile, the single sérsic profile, combination of the exponential and deVaucular profile (hereafter, exp+deV), and combination of the exponential and sérsic profile (hereafter, exp+ser). Since most galaxies in our parent sample can be fully shown in 501 501 pixels, all the fittings are performed in this region with the target located at the center to improve Galfit fitting efficiency. During fitting, psf image and mask image were used to get better results. The psf images were derived from SDSS website (http://das.sdss.org/imaging) to describe the local psf profile surrounding the target, and the mask images were produced on the basis of the segmentation image from SExtractor. We masked out other objects, only the background and target regions are fitted.
We also set limitations on variable range of parameters to avoid unphysical fittings. For all the models and subcomponents, the variable range of the galaxy center is pixels in both horizontal and vertical directions. Based on the assumption that half of the diagonal size of our images( 354 pixel) being exactly three times the of the galaxy, we set the variable range of the effective radius () as pixels, that is for sérsic and deVaucular profile and for the exponential profile, where is scale length. Here we use instead of for exponential profile is because the exponential profile provided by Galfit (Equation 1) uses , and there is a relation between and for exponential profile, (Peng et al., 2010, Eq. (7)). For the sérsic model, the variable range of index is , which is the same range as Simard et al. (2011). When , the luminosity density of the sérsic profile has a depression in its center, which is often unphysical (see Trujillo et al., 2001, Fig. 6). For the exp+ser model, the variable range of the index of the sérsic component is , here we force the bulge component (sérsic) to be more concentrated than the disk component (exponential) by applying a larger value of the sérsic profile than that of the exponential profile.
Note that all the galaxies have been fitted with the exponential and the sérsic profile, then 5233 galaxies (42.12% of parent sample) were selected to run the disk+bulge model fitting by eliminating 7190 galaxies whose sérsic index for both g and r bands. This is because, for disk-dominated galaxies, the application of a disk+bulge model by force would lead Galfit to converge to no results.
After fitting, we took the following steps to filter the fitting results:
-
1.
Eliminate numerical unreasonable fittings. When numerical convergence issues happen during fitting, the entire solution is not reliable, we will remove the galaxy from further analysis. The galaxy will also be removed if the output parameters reach the boundaries we set. In this step, for sérsic and exp+ser models, most of the removed galaxies are because their fitted index are at the boundary values.
-
2.
Eliminate fitting results whose structure parameters, such as the axis ratio (b/a) and position angle (PA), are not consistent between the g and r bands. For b/a and PA, we calculate the difference for all the galaxies and execute a 3 clipping.
-
3.
For disk+bulge fitting, galaxies will be removed if their fitted effective radius of the disk component is smaller than those of the bulge component.
After these steps, we constructed four “well-fitted” samples which contain 11697, 10582, 1981, and 1066 galaxies for exponential, sérsic, exp+deV, and exp+ser model fitting, respectively. The galaxies in the “well-fitted” samples have good fitting results in both g and r bands, and will be used in the following analysis. The numbers of galaxy after each step are listed in Table 1.
| exponential | sérsic | exp+deV | exp+ser | |||||
| g | r | g | r | g | r | g | r | |
| feed in Galfit1 | 12423 | 12423 | 12423 | 12423 | 5233 | 5233 | 5233 | 5233 |
| have Galfit output | 12218 | 12218 | 12217 | 12217 | 4560 | 4665 | 4461 | 4680 |
| numerical reasonable2 | 12058 | 12088 | 11096 | 11353 | 3592 | 3800 | 2045 | 2379 |
| good structure parameters3 | 11697 | 10582 | 3031 | 1495 | ||||
| — | — | 1981 | 1066 | |||||
| well-fitted sample | 11697 | 10582 | 1981 | 1066 | ||||
| LSBG sample (initial) | 1151 | 1081 | 286 | 175 | ||||
| LSBG sample (after visual inspection) | 1105 | 1038 | 207 | 132 | ||||
| LSBG sample ()4 | — | — | — | 75 | ||||
-
1
The number of galaxies that we feed in Galfit for exp+deV and exp+ser fitting excludes the galaxies that satisfy for both g and r bands in sérsic fitting.
-
2
The numerical reasonable fittings are fittings whose , , and index do not reach the boundaries.
-
3
The structure parameters mean the axis ratio (b/a) and position angle (PA). We calculate the difference between g and r bands and execute a 3 clipping, for b/a and PA one by one. The fittings with good structure parameters mean their b/a and PA are consistent between the g and r bands.
-
4
The represents the index of bulge component.
2.3 The central surface brightness
In the following we will illustrate the procedures how we calculate for the exponential profile and the sérsic profile step by step.
The expression of the exponential profile is:
| (1) |
The flux integrated out to is:
| (2) |
where q is the axis ratio.
So the central surface brightness can be expressed as:
| (3) |
Then, apply cosmological dimming correction, also convert the unit of to , the central surface brightness is:
| (4) |
where is the model magnitude, is the disk scale length, and is from .40 catalog.
For sérsic model, the function is:
| (5) |
The flux integrated out to is:
| (6) |
So the surface brightness at the effective radius() and galaxy center() is:
| (7) | ||||
| (8) |
where is the effective radius, is the sérsic index, is related to index (Capaccioli, 1989), function is .
Then, apply cosmological dimming correction, also convert the unit of to , the central surface brightness is:
| (9) |
Finally, the B band central surface brightness can be transferred by an empirical equation (Smith et al., 2002):
| (10) |
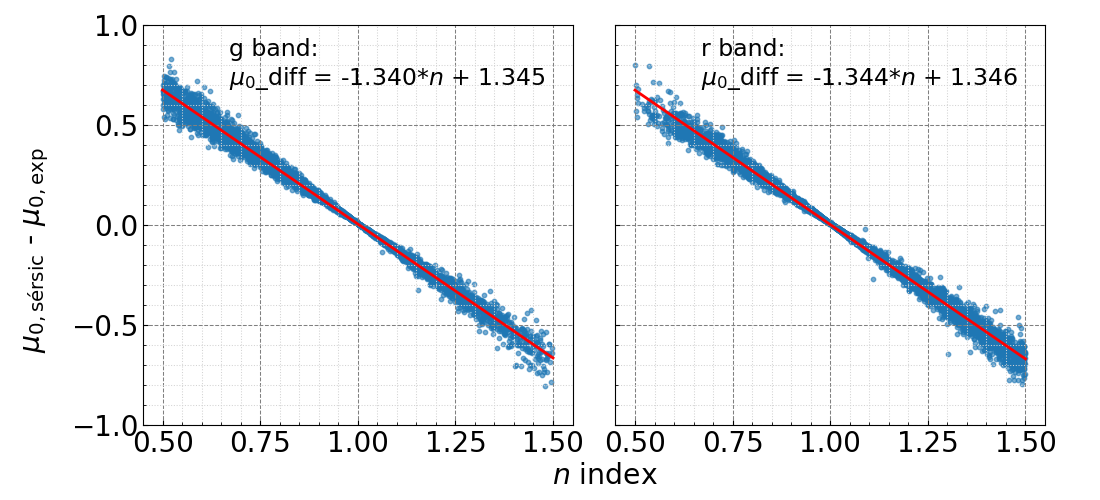
Figure 1 shows the difference of between exponential and sérsic fitting varies with sérsic index for galaxies which have in both g and r bands. The red solid lines are the linear fitting of the points, which can be described as follows:
| (11) | ||||
| (12) |
which also be written on the top of each panel. The expression can be simplified to
| (13) |
The relationship between difference and index distributes along a biconical shape, which is best when , and becomes worse with the increase or decrease of index. When , the obtained from the sérsic model is brighter than that from the exponential model, and when , the obtained from the sérsic model is dimmer than that from the exponential model. The two models yield a difference of up to approximately 0.7 .
3 LSBG samples
3.1 LSBG selection
There has been no consensus in the threshold values of to define LSBGs, people apply different cut in literature ( (McGaugh et al., 1995a), (McGaugh 1996; Rosenbaum et al. 2009; Du15), (Impey & Bothun, 1997); (Brown et al., 2001); (Courteau, 1996; Brown et al., 2001); (Pahwa & Saha, 2018)). In this paper, we adopt a threshold of and apply to avoid internal extinction effect (He et al., 2020).
With this selection criterion, and the visual inspection afterwards, we selected four LSBG samples from the “well-fitted sample” of each model: LSBG_exp, LSBG_sérsic, LSBG_exp+deV, and LSBG_exp+ser, which contain 1105 galaxies (9.45% of “exponential” well-fitted sample), 1038 galaxies (9.81% of “sérsic” well-fitted sample), 207 galaxies (10.45% of “exp+deV” well-fitted sample), and 132 galaxies (12.38% of “exp+ser” well-fitted sample). During the visual inspection, fittings were deleted if the model was influenced obviously by the neighbors or the galaxy is peculiar in morphology. Considering that our original intention was to look for LSBGs with bulge, we set a limitation on the index of bulge component of “exp+ser” model to exclude some “disk+disk” fitting results, and there are 75 LSBGs satisfy this criterion in both g and r bands. The galaxy numbers of initial LSBG samples and final LSBG samples are listed in Table 1. The table containing all the parameters of our LSBGs (DOI: https://doi.org/10.57760/sciencedb.13130) is available in its entirety in a machine-readable form in the Science Data Bank database, the column descriptions are listed in Table 2.
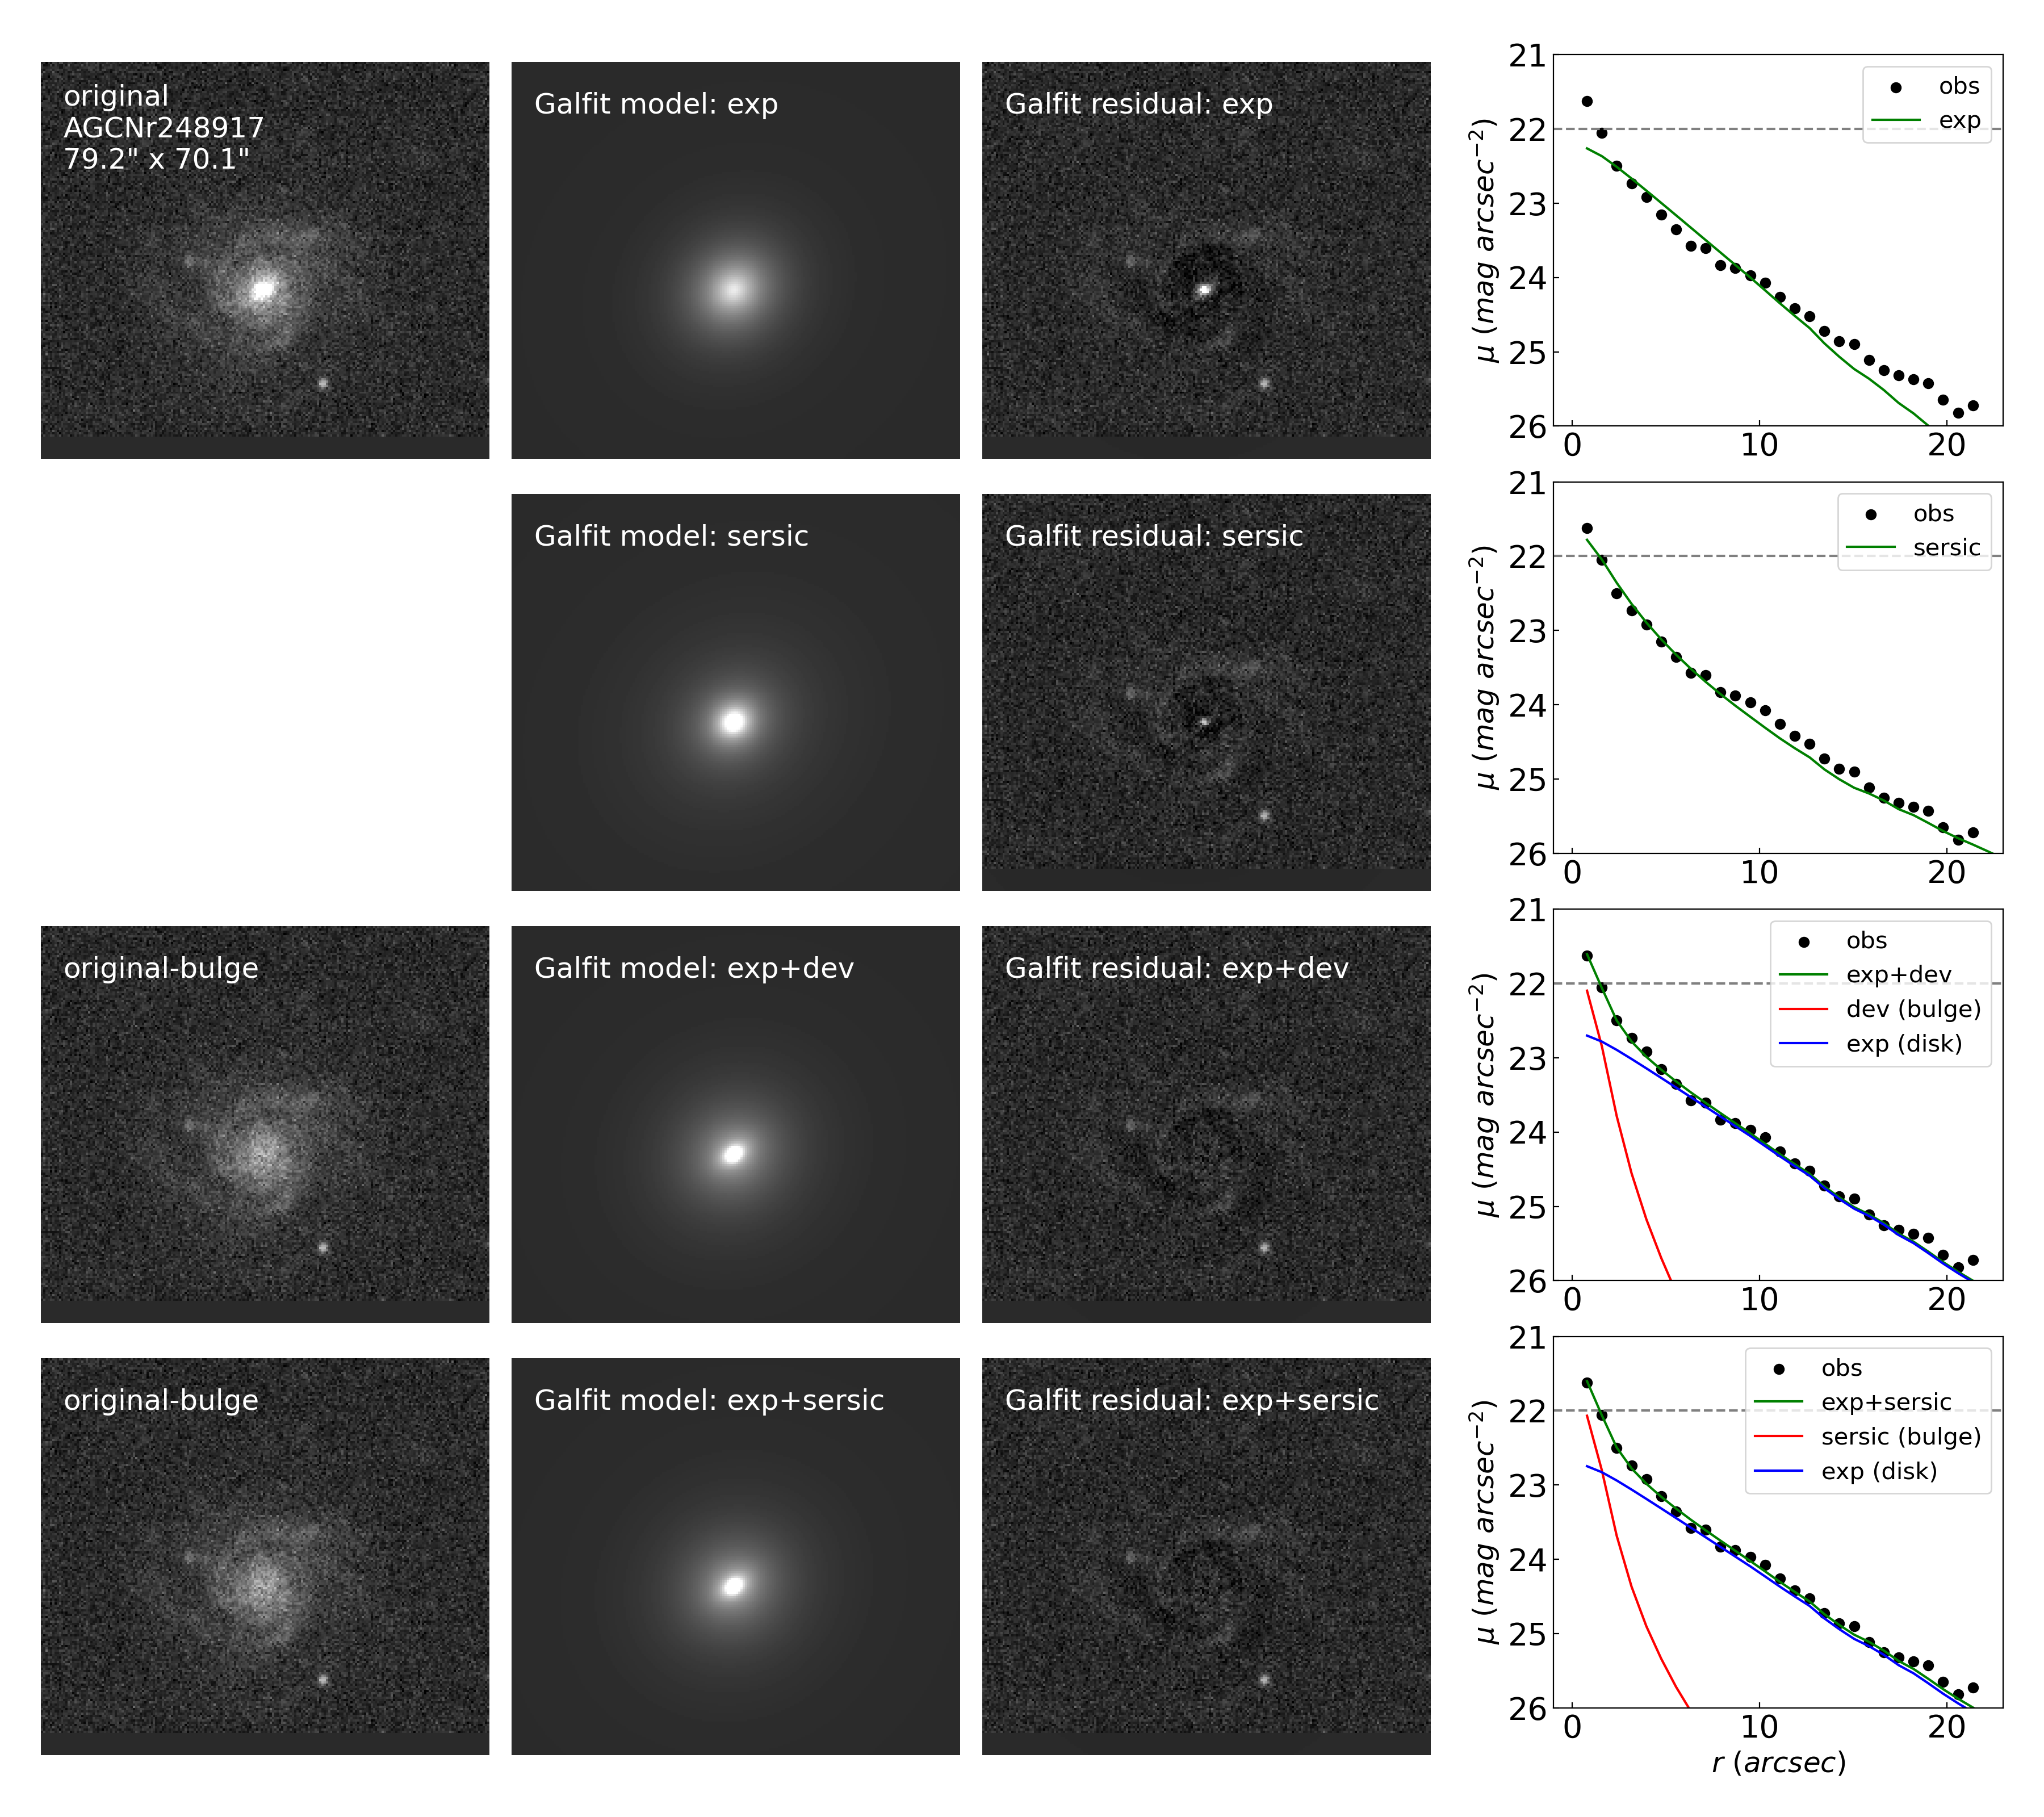
For the LSBGs selected from two-component fitting, the two-component fitting is usually better than the one-component fitting. Figure 2 shows an example of Galfit fitting results (AGCNr 248917) of our four models, exponential, sérsic, exp+deV, and exp+ser, from top to bottom. This galaxy is selected as LSBG by “exp+deV” and “exp+ser” models. The first image in the upper left panel shows the observed image, the second column shows the model images, the third column shows the residual images (observed image minus model image), and the fourth column is the radial distribution of surface brightness obtained from a series of elliptical annulus on the observed image and models, with a step of 2 pixels. The pure disk image is also displayed in the bottom two rows of the first column by using the observed image minus the bulge component. From the residual image of exponential and sérsic fitting, it is obvious that there is a small bright spot in the galaxy center, and this small bright spot can be fitted well by exp+deV and exp+ser models.
| Column name | Description | Unit |
|---|---|---|
| note | Model adopt | |
| AGCNr | ID in .40 catalog | |
| ra | Right ascension (J2000.0) | degree |
| dec | decl. (J2000.0) | degree |
| Vhelio | Heliocentric velocity of the HI profile midpoint from .40 catalog | km/s |
| Dist | Distance from .40 catalog | Mpc |
| logMHI | HI mass from .40 catalog | logarithmic solar mass |
| W50 | Observed velocity width at 50% of peak on either side from .40 catalog | km/s |
| kpc_per_arcsec | image scale factor | kpc/arcsec |
| kpc_per_pix | image scale factor | kpc/pixel |
| magauto_all_band | Magnitude for the whole galaxy from SExtractor | mag |
| magautoerr_all_band | Error of magnitude for the whole galaxy from SExtractor | mag |
| MAG_obs_band | Absolute magnitude for the whole galaxy | mag |
| M_star_obs_band | Stellar mass for the whole galaxy | logarithmic solar mass |
| mag_disk_band | Magnitude of disk component from model fitting | mag |
| mag_disk_err_band | Error of magnitude of disk component from model fitting | mag |
| rs_disk_band | Disk-scale length of disk component from model fitting | pixel |
| rs_disk_err_band | Error of disk-scale length of disk component from model fitting | pixel |
| re_disk_band | Effective radius of disk component from model fitting | pixel |
| re_disk_err_band | Error of effective radius of disk component from model fitting | pixel |
| n_disk_band | sérsic index of disk component from model fitting | |
| n_disk_err_band | Error of sérsic index of disk component from model fitting | |
| ar_disk_band | Axis ratio of disk component from model fitting | |
| ar_disk_err_band | Error of axis ratio of disk component from model fitting | |
| pa_disk_band | Position angle of disk component from model fitting | degree: Up=0 Left=90 |
| pa_disk_err_band | Error of position angle of disk component from model fitting | degree: Up=0 Left=90 |
| mag_bulge_band | Magnitude of bulge component from model fitting | mag |
| mag_bulge_err_band | Error of magnitude of bulge component from model fitting | mag |
| re_bulge_band | Effective radius of bulge component from model fitting | pixel |
| re_bulge_err_band | Error of effective radius of bulge component from model fitting | pixel |
| n_bulge_band | sérsic index of bulge component from model fitting | |
| n_bulge_err_band | Error of sérsic index of bulge component from model fitting | |
| ar_bulge_band | Axis ratio of bulge component from model fitting | |
| ar_bulge_err_band | Error of axis ratio of bulge component from model fitting | degree: Up=0 Left=90 |
| pa_bulge_band | Position angle of bulge component from model fitting | degree: Up=0 Left=90 |
| pa_bulge_err_band | Error of position angle of bulge component from model fitting | |
| mu0_disk_band | Central surface brightness of disk component | |
| mu0_disk_err_band | Error of central surface brightness of disk component | |
| B/T_band | Bulge-to-total ratio from model fitting |
-
•
This is column descriptions of our LSBG table. The related table (DOI: https://doi.org/10.57760/sciencedb.13130) is available in its entirety in a machine-readable form in the Science Data Bank database.
3.2 Statistical properties of LSBG samples
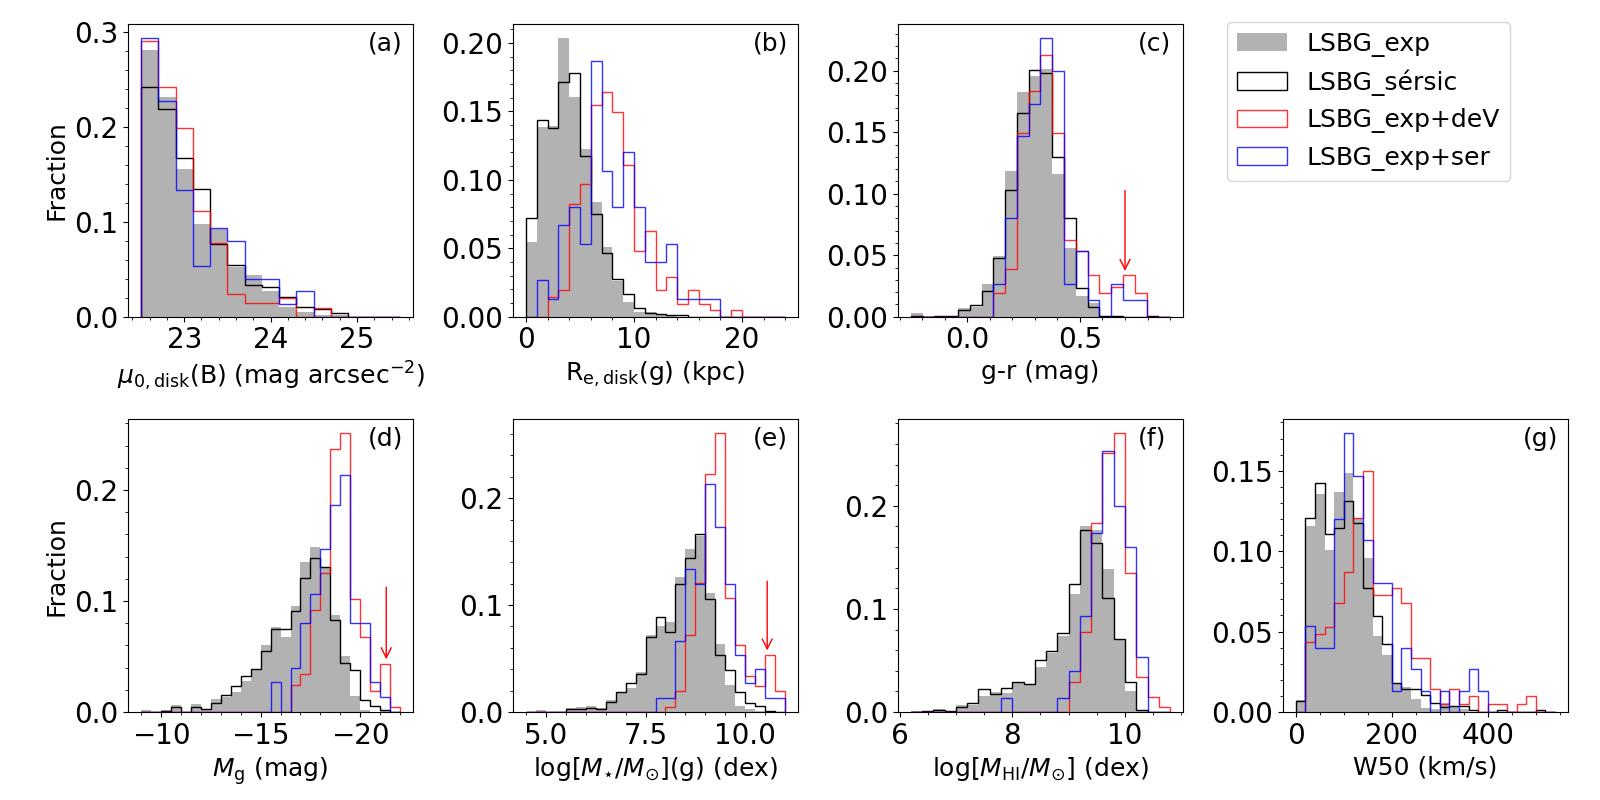
Figure 3 shows the statistical properties of our four LSBG samples: panels (a) and (b) show the distribution of the B band central surface brightness () and g band effective radius () of the disk component; panels (c)(g) show the distribution of g-r color, g band absolute magnitude (), g band stellar mass (log(g)), H\@slowromancapi@ gas mass (log), and H\@slowromancapi@ line width (W50) for the whole galaxy. The H\@slowromancapi@ gas mass and W50 are from the .40 catalog (Haynes et al., 2011). The stellar mass was calculated by using the prescription in Du et al. (2020). In that, we compute mass-to-light ratio by using the g-r color: , where , , , and . The absolute magnitude was calculated by using the distance from the .40 catalog by adopting (Haynes et al., 2011), and the absolute magnitude of the sun is and (Willmer, 2018). We list the median values of these parameters of our four LSBG samples in Table 3. Table 4 lists the number statistics of the overlapping galaxies that are both selected as LSBGs in any of the two LSBG samples.
| g-r | log(g) | log | W50 | ||||
|---|---|---|---|---|---|---|---|
| () | (kpc) | (mag) | (mag) | () | () | (km/s) | |
| LSBG_exp | 22.888 | 3.843 | 0.298 | 8.539 | 9.28 | 100.0 | |
| LSBG_sérsic | 22.936 | 3.840 | 0.311 | 8.561 | 9.25 | 100.0 | |
| LSBG_exp+deV | 22.882 | 7.902 | 0.354 | 9.305 | 9.76 | 149.0 | |
| LSBG_exp+ser | 22.897 | 7.665 | 0.343 | 9.195 | 9.72 | 127.0 |
| LSBG_exp | LSBG_sérsic | LSBG_exp+deV | LSBG_exp+ser | LSBG_exp+ser () | |
|---|---|---|---|---|---|
| LSBG_exp | 1105 | 756 | 76 | 28 | 13 |
| LSBG_sérsic | 756 | 1038 | 15 | 4 | 0 |
| LSBG_exp+deV | 76 | 15 | 207 | 35 | 22 |
| LSBG_exp+ser | 28 | 4 | 35 | 75 | 37 |
| LSBG_exp+ser () | 13 | 0 | 22 | 37 | 37 |
3.2.1 Comparison of LSBG_exp and LSBG_sérsic
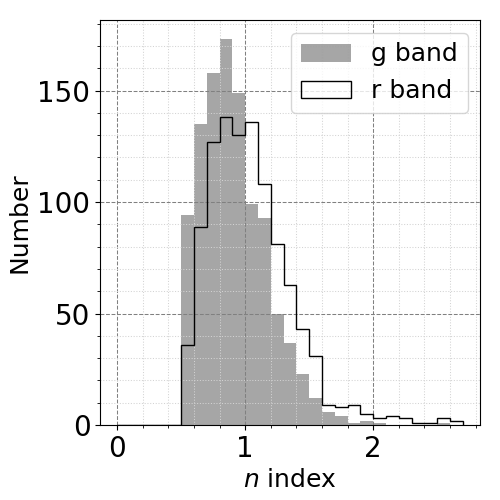
It is obvious to see that all the parameters of LSBG_exp (the gray filled histograms) and LSBG_sérsic (the black steps) have very similar distributions, and the median values of these parameters are close. Figure 4 shows the distribution of index of galaxies in LSBG_sérsic, 97.40% (1011/1038) of the galaxies have for g band and 91.62% (951/1038) for r band, indicating our LSBGs selected by sérsic fitting are in principle the same type of galaxies as those selected by exponential fitting. These two samples have 756 galaxies (68.42% of LSBG_exp and 72.83% of LSBG_sérsic) in common, the rest of the discrepancy is due to the difference in obtaining between the two models as we mentioned in Section 2.3. That is, the remaining galaxies have brighter than 22.5 in one fitting result and dimmer than 22.5 in the other fitting result.
3.2.2 Comparison of LSBG_exp+deV and LSBG_exp+ser
The distributions of all the parameters of the galaxies in LSBG_exp+deV (the red steps) and LSBG_exp+ser (the blue steps) are also similar, but the median values of these parameters of LSBG_exp+deV are slightly larger than those of LSBG_exp+ser.
Fisher & Drory (2008) found that the sérsic index of bulge can be used to distinguish between classical and pseudo bulges: classical bulges have and pseudo bulges have in the V band with almost no overlap. Considering that the g band has more similar wavelength coverage to the V band than the r band, we divide the bulges in the LSBG_exp+ser sample into classical and pseudo bulges according to their index of bulge component () in g band. Of these 75 galaxies, 50 galaxies are classified as galaxies with classical bulges.
Among the 50 LSBGs that hold classical bulges, 24 of them are selected as LSBGs by “exp+deV” fitting. In the rest 26 galaxies in LSBG_exp+ser, 25 of them are not in the “exp+deV” well-fitted sample, only one galaxy (AGCNr 102234) is in but not selected as LSBG because it does not satisfy the criterion. The reason why one model can get the fitting result but the other model cannot is beyond the scope of this paper. Only consider the galaxies that both models can get good fitting results, almost all the LSBGs with classical bulges selected by the “exp+ser” model can be selected by the “exp+deV” model.
3.2.3 Comparison of LSBGs selected by one-component and two-component fitting
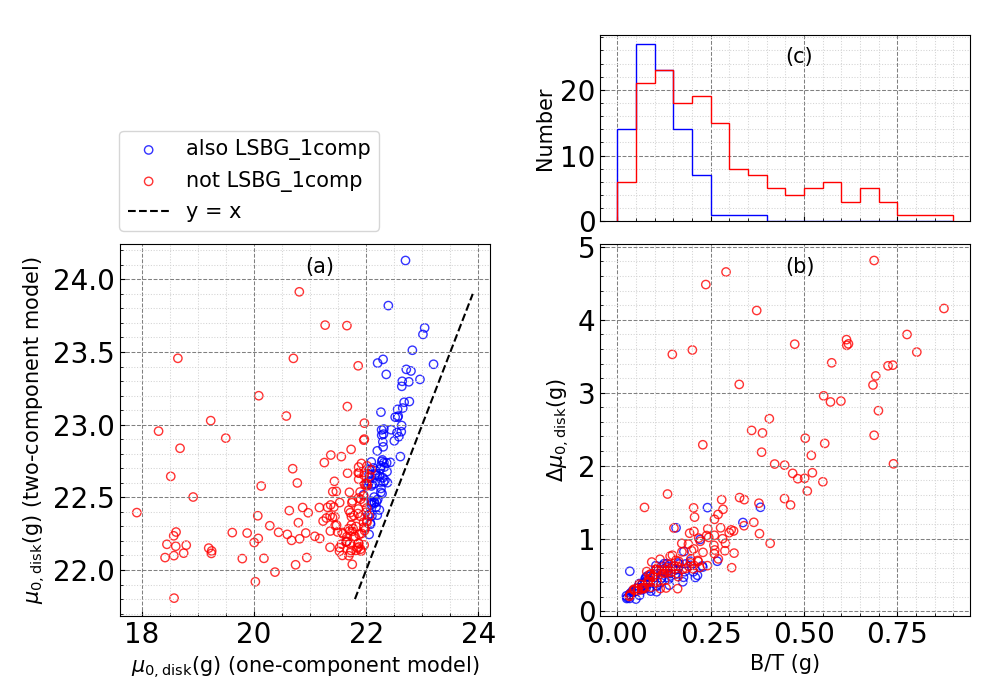
For convenience, we will call the galaxies in LSBG_exp and LSBG_sérsic “LSBG_1comp” (in total 1387 galaxies), and the galaxies in LSBG_exp+deV and LSBG_exp+ser “LSBG_2comps” (in total 247 galaxies). There are in total 1546 LSBGs with 88 duplicating in LSBG_1comp and LSBG_2comps, suggesting 15.98% (247/1546) of our LSBGs hold bulge. It should be noted that this fraction might be smaller than it actually is, since we perform two-component fitting only for galaxies with in the single sérsic fitting, as a result, some galaxies with small bulges will be missed. Among the 88 overlapped galaxies of LSBG_1comp and LSBG_2comps, 96.59% (85/88) of them have bulge-to-total ratio , as blue histogram in Figure 7(c) shown, suggesting that the 88 overlapped LSBGs have small bulges, they can be fitted well by a single component model. The remaining 1299 galaxies in LSBG_1comp can be considered as a single disk without bulges. Even if they do contain a bulge, the B/T would be smaller than that of the overlaps.
The median values of , g band stellar mass, H\@slowromancapi@ mass, and W50 of LSBG_2comps are 3.8 4.1 kpc, 0.63 0.76 dex, 0.44 0.52 dex, and 30 50 km/s larger than those of LSBG_1comp, the median value of g band absolute magnitude of LSBG_2comps is about 1.5 1.7 mag brighter than that of LSBG_1comp. Compared to LSBG_1comp, the distributions of LSBG_exp+deV and LSBG_exp+ser have another peak at the red and massive (or bright) end, we point out the peaks in panels (c), (d), and (e) in Figure 3 by red arrows, the giant low surface brightness galaxies (gLSBGs) contribute a lot to this peak. However, the median value of g-r color distribution of LSBG_2comps is only 0.03 0.05 mag redder than that of LSBG_1comp, and this is because the bulges are not prominent in the majority of our LSBG_2comps. The distribution of B/T shown in Figure 5 shows 82.61% (171/207) of the galaxies in LSBG_exp+deV and 77.33% (58/75) the galaxies in LSBG_exp+ser have .
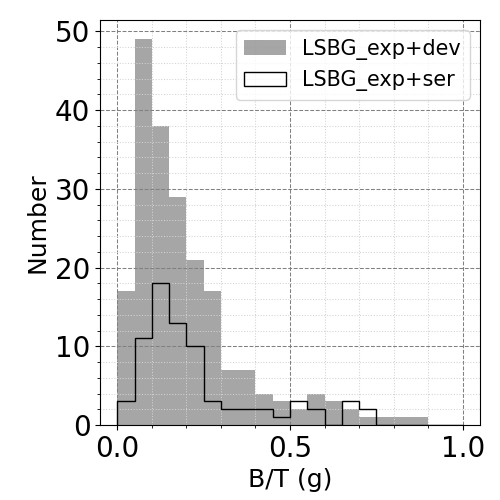
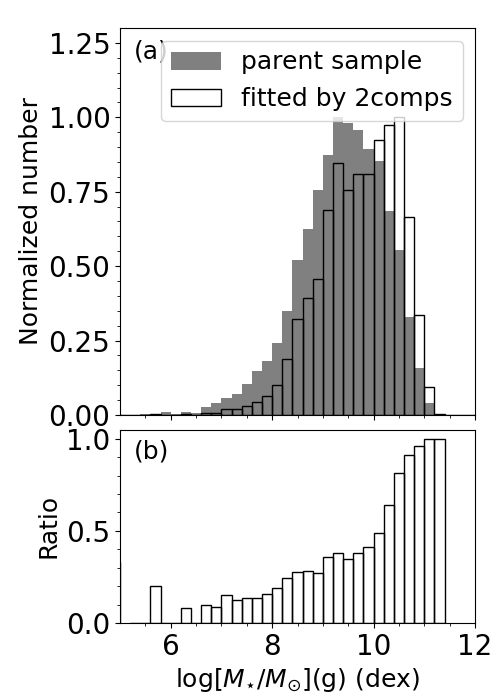
Figure 6 shows the stellar mass distribution of our parent sample and galaxies that fitted by two-component models. The histogram is normalized by its peak value. We can see that the galaxies selected for two-component fitting are indeed the more massive galaxies in the parent sample, and the fraction of selected galaxies in each mass bin increases with the increase in stellar mass. This suggests that the result we obtained that the g-band stellar mass of the LSBG_2comps is 0.63 0.76 dex larger than that of the LSBG_1comp is partly due to the selection effect. However, we think part of the result reflects the true differences of LSBG_2comps and LSBG_1comp: the disk component in LSBG_2comps is larger than that in LSBG_1comp (Figure 3(b)), larger size often corresponds to larger mass. Moreover, the presence of bulge also contributes to the stellar mass observed in the LSBG_2comps.
3.2.4 Loss fraction of LSBGs with bulges
Among our LSBG_2comps, about 35.63% (88/247) of them were also identified as LSBGs by single-component fitting (blue circles in Figure 7, denoted as “also LSBG_1comp”), 61.13% (151/247) were not identified as LSBGs by single-component fitting (red circles in Figure 7, denoted as “not LSBG_1comp”), and 3.24% (8/247) do not have good single-component fitting results because they were deleted in the second step of fitting results filtering (see Section 2.2). That is, more than 60% of the LSBG_2comps will not be selected if we adopt a single disk model only. The of two-component fitting is dimmer than that of single-component fitting, and the difference is related to the B/T of the galaxy. 72.47% (179/247) of our LSBG_2comps have , and in this range the single-component fitting will result in an overestimation of the by approximately 0.8 .
4 Giant low surface brightness galaxies
Giant low surface brightness galaxies (gLSBGs) are a subset of LSBGs, they could have comparable or larger mass comparing with the Milky Way, but several times the size of the Milky Way. One of the most well-known gLSBG, Malin 1, was discovered by Bothun et al. (1987). Subsequent studies show Malin 1 has H\@slowromancapi@ mass (Bothun et al., 1987), disk central surface brightness (for = 0.7; Moore & Parker 2006), and its optical diameter can reach 160 kpc (Galaz et al., 2015). UGC 1382 is also a very large gLSBG whose effective radius is 38 kpc (Hagen et al., 2016). But gLSBGs whose size comparable with Malin 1 and UGC 1382 are rare, most of the gLSBGs have scale length from a few kpc to dozens of kpc (McGaugh & Bothun 1994; Sprayberry et al. 1995; H18; S23).
In Table 5, we list different criteria used to select gLSBGs in previous works. In general, there are roughly three kinds of selection criteria. The first is the “diffuseness index” criterion proposed by Sprayberry et al. (1995): where the scale length is in unit of kpc. The second is the mass criterion: Honey et al. (2018) (hereafter H18) selected 41 gLSBGs from their spiral LSBGs with the criteria and ; O’Neil et al. (2023) adopted to identify massive LSBGs. The third is the size criterion: Impey & Bothun (1997) claimed that gLSBGs have scale lengths in excess of 10 kpc; Saburova et al. (2023) (hereafter S23) detected 42 gLSBGs with or four times scale-length .
| Criterion | Reference |
|---|---|
| Sprayberry et al. (1995) | |
| and | Honey et al. (2018) |
| O’Neil et al. (2023) | |
| Impey & Bothun (1997) | |
| or | Saburova et al. (2023) |
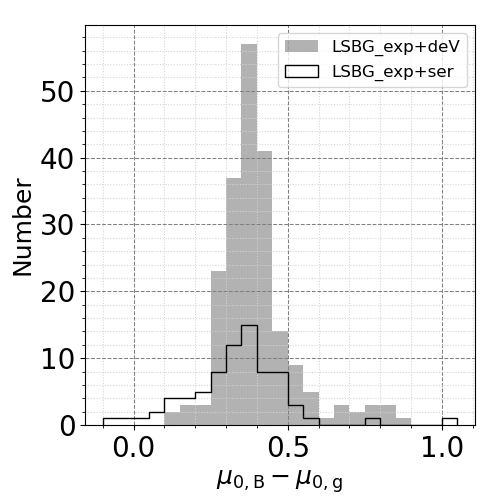
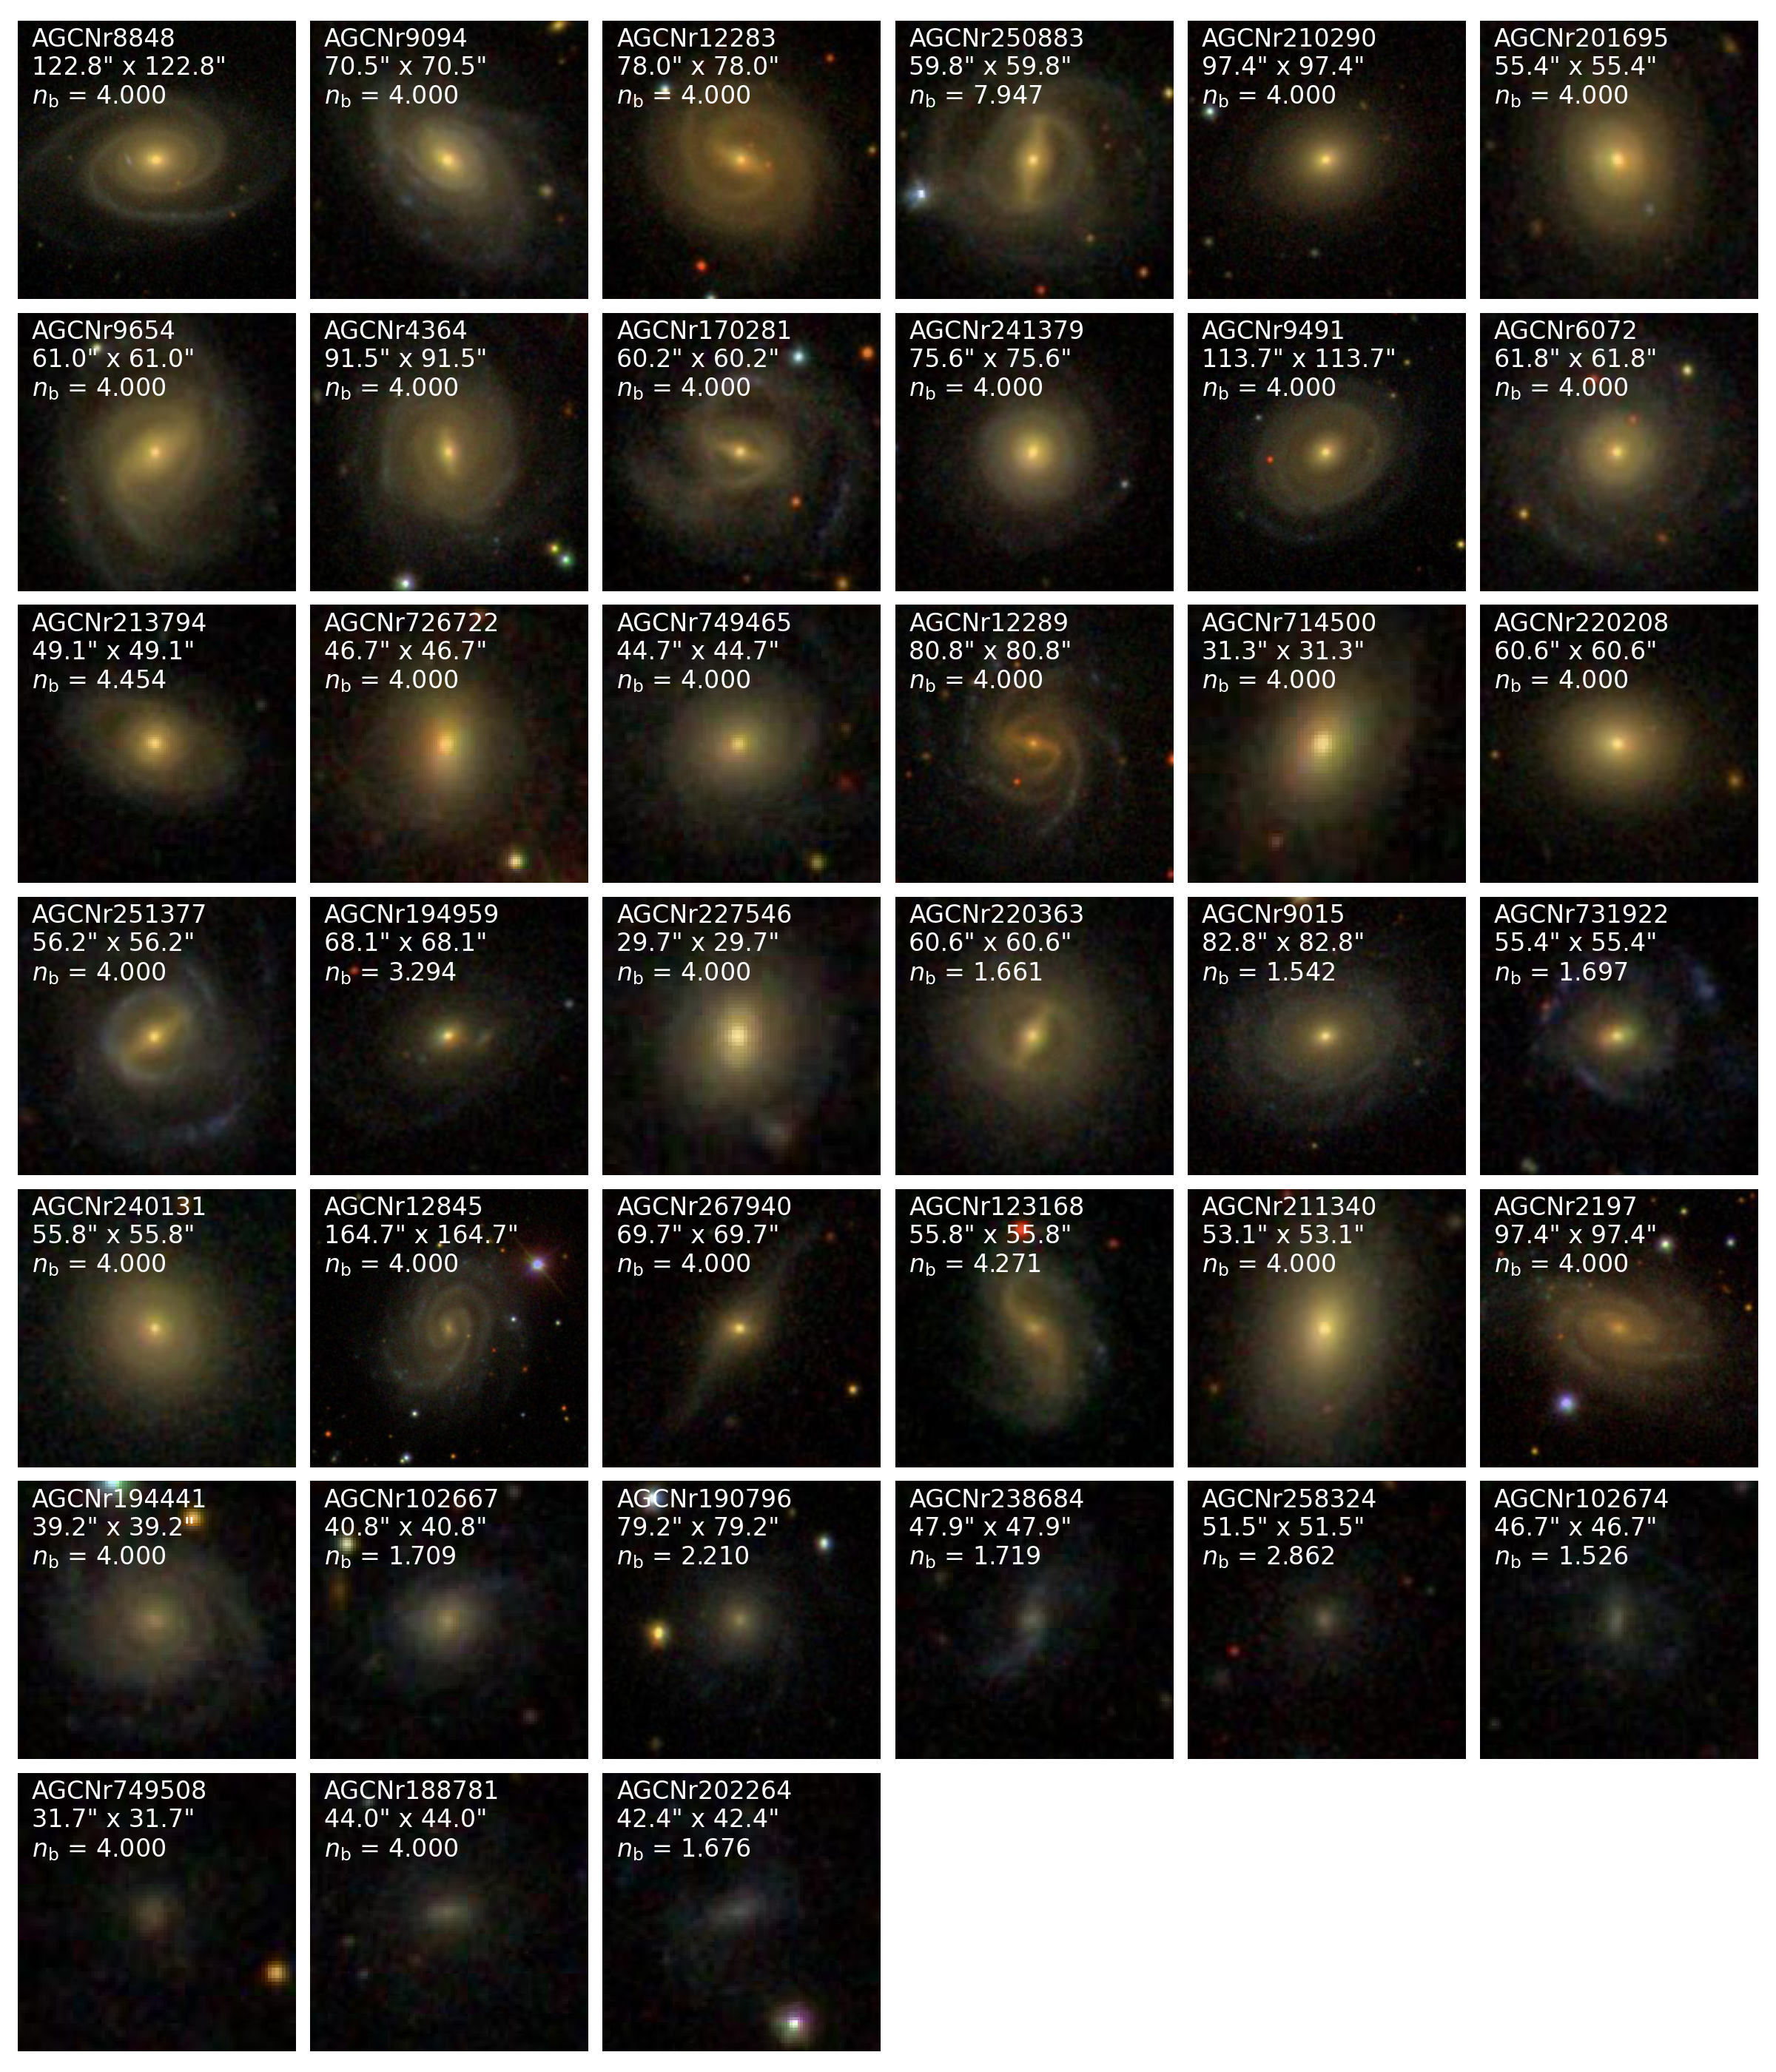
This work will use these three kinds of criteria to select gLSBGs from our LSBG_2comps. Figure 8 shows that the difference between B and g bands in our sample is , so we adopt “diffuseness index” and select a sample named “gLSBG_diffuse” which contains 7 gLSBGs from LSBG_exp+deV and 8 gLSBGs from LSBG_exp+ser with 2 galaxies replicated. Following the mass criterion in H18, we select a sample named “gLSBG_mass” which contains 27 gLSBGs from LSBG_exp+deV and 7 gLSBGs from LSBG_exp+ser with 3 galaxies replicated. We also select a sample named “gLSBG_size” under the criterion which contains 3 galaxies from LSBG_exp+deV and 2 gLSBGs from LSBG_exp+ser with no galaxy replicated. There are totally 39 non-repetitive gLSBGs, the detailed information is listed in Table 6, and the SDSS color images of them are shown in Figure 9.
| AGCNr | RA | DEC | g-r | log(HI) | log() | criterion | ||||
| (J2000) | (J2000) | (mag) | (mag) | () | () | (kpc) | () | |||
| 8848 | 209.014 | 13.506 | 0.743 | -21.421 | 10.130 | 10.912 | 10.088 | 22.235 | 4.000 | mass, size; exp+deV |
| 9094 | 213.121 | 24.636 | 0.650 | -21.628 | 10.640 | 10.851 | 9.486 | 22.114 | 4.000 | mass; exp+deV |
| 12283 | 344.832 | 24.107 | 0.700 | -21.426 | 9.810 | 10.847 | 8.643 | 22.086 | 4.000 | mass; exp+deV |
| 250883 | 232.229 | 7.745 | 0.698 | -21.397 | 9.950 | 10.833 | 9.352 | 22.189 | 7.947 | mass; exp+ser |
| 210290 | 170.720 | 27.584 | 0.761 | -21.085 | 10.000 | 10.807 | 11.609 | 23.457 | 4.000 | diffuse, mass, size; exp+deV |
| 201695 | 164.286 | 14.925 | 0.781 | -20.837 | 10.150 | 10.738 | 6.611 | 22.131 | 4.000 | mass; exp+deV |
| 9654 | 225.236 | 11.517 | 0.720 | -21.032 | 9.980 | 10.721 | 6.841 | 21.919 | 4.000 | mass; exp+deV |
| 4364 | 125.603 | 25.509 | 0.656 | -21.252 | 9.990 | 10.709 | 9.041 | 22.078 | 4.000 | mass; exp+deV |
| 170281 | 119.332 | 11.206 | 0.627 | -21.261 | 10.090 | 10.669 | 9.840 | 22.087 | 4.000 | mass; exp+deV |
| 241379 | 211.430 | 25.231 | 0.727 | -20.866 | 9.940 | 10.665 | 4.777 | 22.171 | 4.000 | mass; exp+deV |
| 9491 | 221.061 | 4.219 | 0.656 | -21.053 | 10.030 | 10.630 | 10.374 | 22.395 | 4.000 | diffuse, mass, size; exp+deV |
| 6072 | 164.935 | 10.071 | 0.610 | -21.200 | 10.420 | 10.618 | 7.825 | 22.373 | 4.000 | mass; exp+deV |
| 213794 | 168.103 | 7.495 | 0.744 | -20.579 | 10.280 | 10.578 | 8.209 | 22.151 | 4.454 | mass; exp+ser |
| 726722 | 218.947 | 24.753 | 0.780 | -20.435 | 10.350 | 10.577 | 5.667 | 23.028 | 4.000 | mass; exp+deV |
| 749465 | 207.177 | 25.757 | 0.618 | -20.958 | 10.440 | 10.533 | 8.160 | 22.305 | 4.000 | mass; exp+deV |
| 12289 | 344.923 | 24.075 | 0.572 | -21.127 | 10.300 | 10.528 | 9.133 | 22.709 | 4.000 | diffuse, mass; exp+deV |
| 714500 | 225.195 | 8.144 | 0.739 | -20.420 | 10.070 | 10.507 | 5.231 | 22.177 | 4.000 | mass; exp+deV |
| 220208 | 183.279 | 16.086 | 0.767 | -20.267 | 9.640 | 10.488 | 3.396 | 22.163 | 4.000 | mass; exp+deV |
| 251377 | 239.508 | 14.964 | 0.559 | -20.926 | 10.400 | 10.428 | 7.391 | 22.036 | 4.000 | mass; exp+deV |
| 194959 | 141.762 | 27.845 | 0.652 | -20.340 | 10.190 | 10.339 | 10.657 | 22.956 | 3.294 | diffuse, mass, size; exp+ser |
| 227546 | 192.794 | 26.795 | 0.668 | -20.260 | 10.310 | 10.332 | 4.788 | 22.261 | 4.000 | mass; exp+deV |
| 220363 | 184.851 | 12.301 | 0.642 | -20.337 | 9.680 | 10.321 | 6.062 | 22.145 | 4.000 | mass; exp+deV |
| — | — | — | — | — | — | — | 5.762 | 21.986 | 1.661 | mass; exp+ser |
| 9015 | 211.485 | 9.026 | 0.582 | -20.421 | 10.020 | 10.261 | 7.884 | 22.442 | 4.000 | mass; exp+deV |
| — | — | — | — | — | — | — | 6.913 | 22.099 | 1.542 | mass; exp+ser |
| 731922 | 181.449 | 24.116 | 0.496 | -20.674 | 10.370 | 10.230 | 10.026 | 22.502 | 1.697 | diffuse, mass, size; exp+ser |
| 240131 | 212.341 | 8.907 | 0.631 | -20.099 | 9.760 | 10.210 | 4.699 | 22.260 | 4.000 | mass; exp+deV |
| 12845 | 358.924 | 31.900 | 0.562 | -20.355 | 10.180 | 10.205 | 9.202 | 22.433 | 4.000 | mass; exp+deV |
| 267940 | 240.576 | 12.274 | 0.710 | -19.749 | 10.180 | 10.193 | 8.557 | 22.644 | 4.000 | mass; exp+deV |
| 123168 | 40.333 | 29.147 | 0.524 | -20.368 | 9.920 | 10.151 | 6.708 | 22.093 | 4.000 | mass; exp+deV |
| — | — | — | — | — | — | — | 6.720 | 22.098 | 4.271 | mass; exp+ser |
| 211340 | 177.467 | 6.668 | 0.703 | -19.664 | 9.350 | 10.147 | 3.238 | 22.838 | 4.000 | mass; exp+deV |
| 2197 | 40.858 | 31.471 | 0.525 | -20.342 | 9.920 | 10.141 | 5.520 | 22.039 | 4.000 | mass; exp+deV |
| 194441 | 137.940 | 27.659 | 0.487 | -20.249 | 9.870 | 10.044 | 6.336 | 22.134 | 4.000 | mass; exp+deV |
| 102667 | 11.070 | 25.766 | 0.403 | -19.598 | 9.970 | 9.655 | 6.255 | 23.685 | 1.709 | diffuse; exp+ser |
| 190796 | 137.776 | 13.122 | 0.340 | -19.836 | 10.140 | 9.651 | 8.407 | 23.199 | 2.210 | diffuse; exp+ser |
| 238684 | 195.473 | 5.387 | 0.304 | -19.316 | 9.990 | 9.387 | 8.255 | 23.086 | 1.719 | diffuse; exp+ser |
| 258324 | 234.036 | 5.793 | 0.343 | -18.765 | 9.720 | 9.227 | 7.103 | 23.718 | 4.000 | diffuse; exp+deV |
| — | — | — | — | — | — | — | 7.166 | 23.381 | 2.862 | diffuse; exp+ser |
| 102674 | 12.310 | 25.294 | 0.219 | -19.168 | 10.020 | 9.195 | 7.633 | 23.566 | 4.000 | diffuse; exp+deV |
| — | — | — | — | — | — | — | 7.316 | 23.264 | 1.526 | diffuse; exp+ser |
| 749508 | 244.915 | 25.563 | 0.346 | -18.541 | 9.820 | 9.143 | 8.117 | 24.429 | 4.000 | diffuse; exp+deV |
| 188781 | 132.116 | 16.192 | 0.397 | -17.625 | 9.460 | 8.855 | 4.724 | 24.130 | 4.000 | diffuse; exp+deV |
| 202264 | 152.444 | 12.082 | 0.268 | -17.802 | 9.650 | 8.726 | 6.468 | 23.819 | 1.676 | diffuse; exp+ser |
-
•
The table is sorted by the g band stellar mass (log()). The last 8 galaxies have stellar mass smaller than , and all of them are selected by the “diffuseness index” criterion. They seem different from the gLSBGs that most people know, more like normal LSBGs with bulge. We will eliminate these 8 galaxies from our gLSBGs sample.
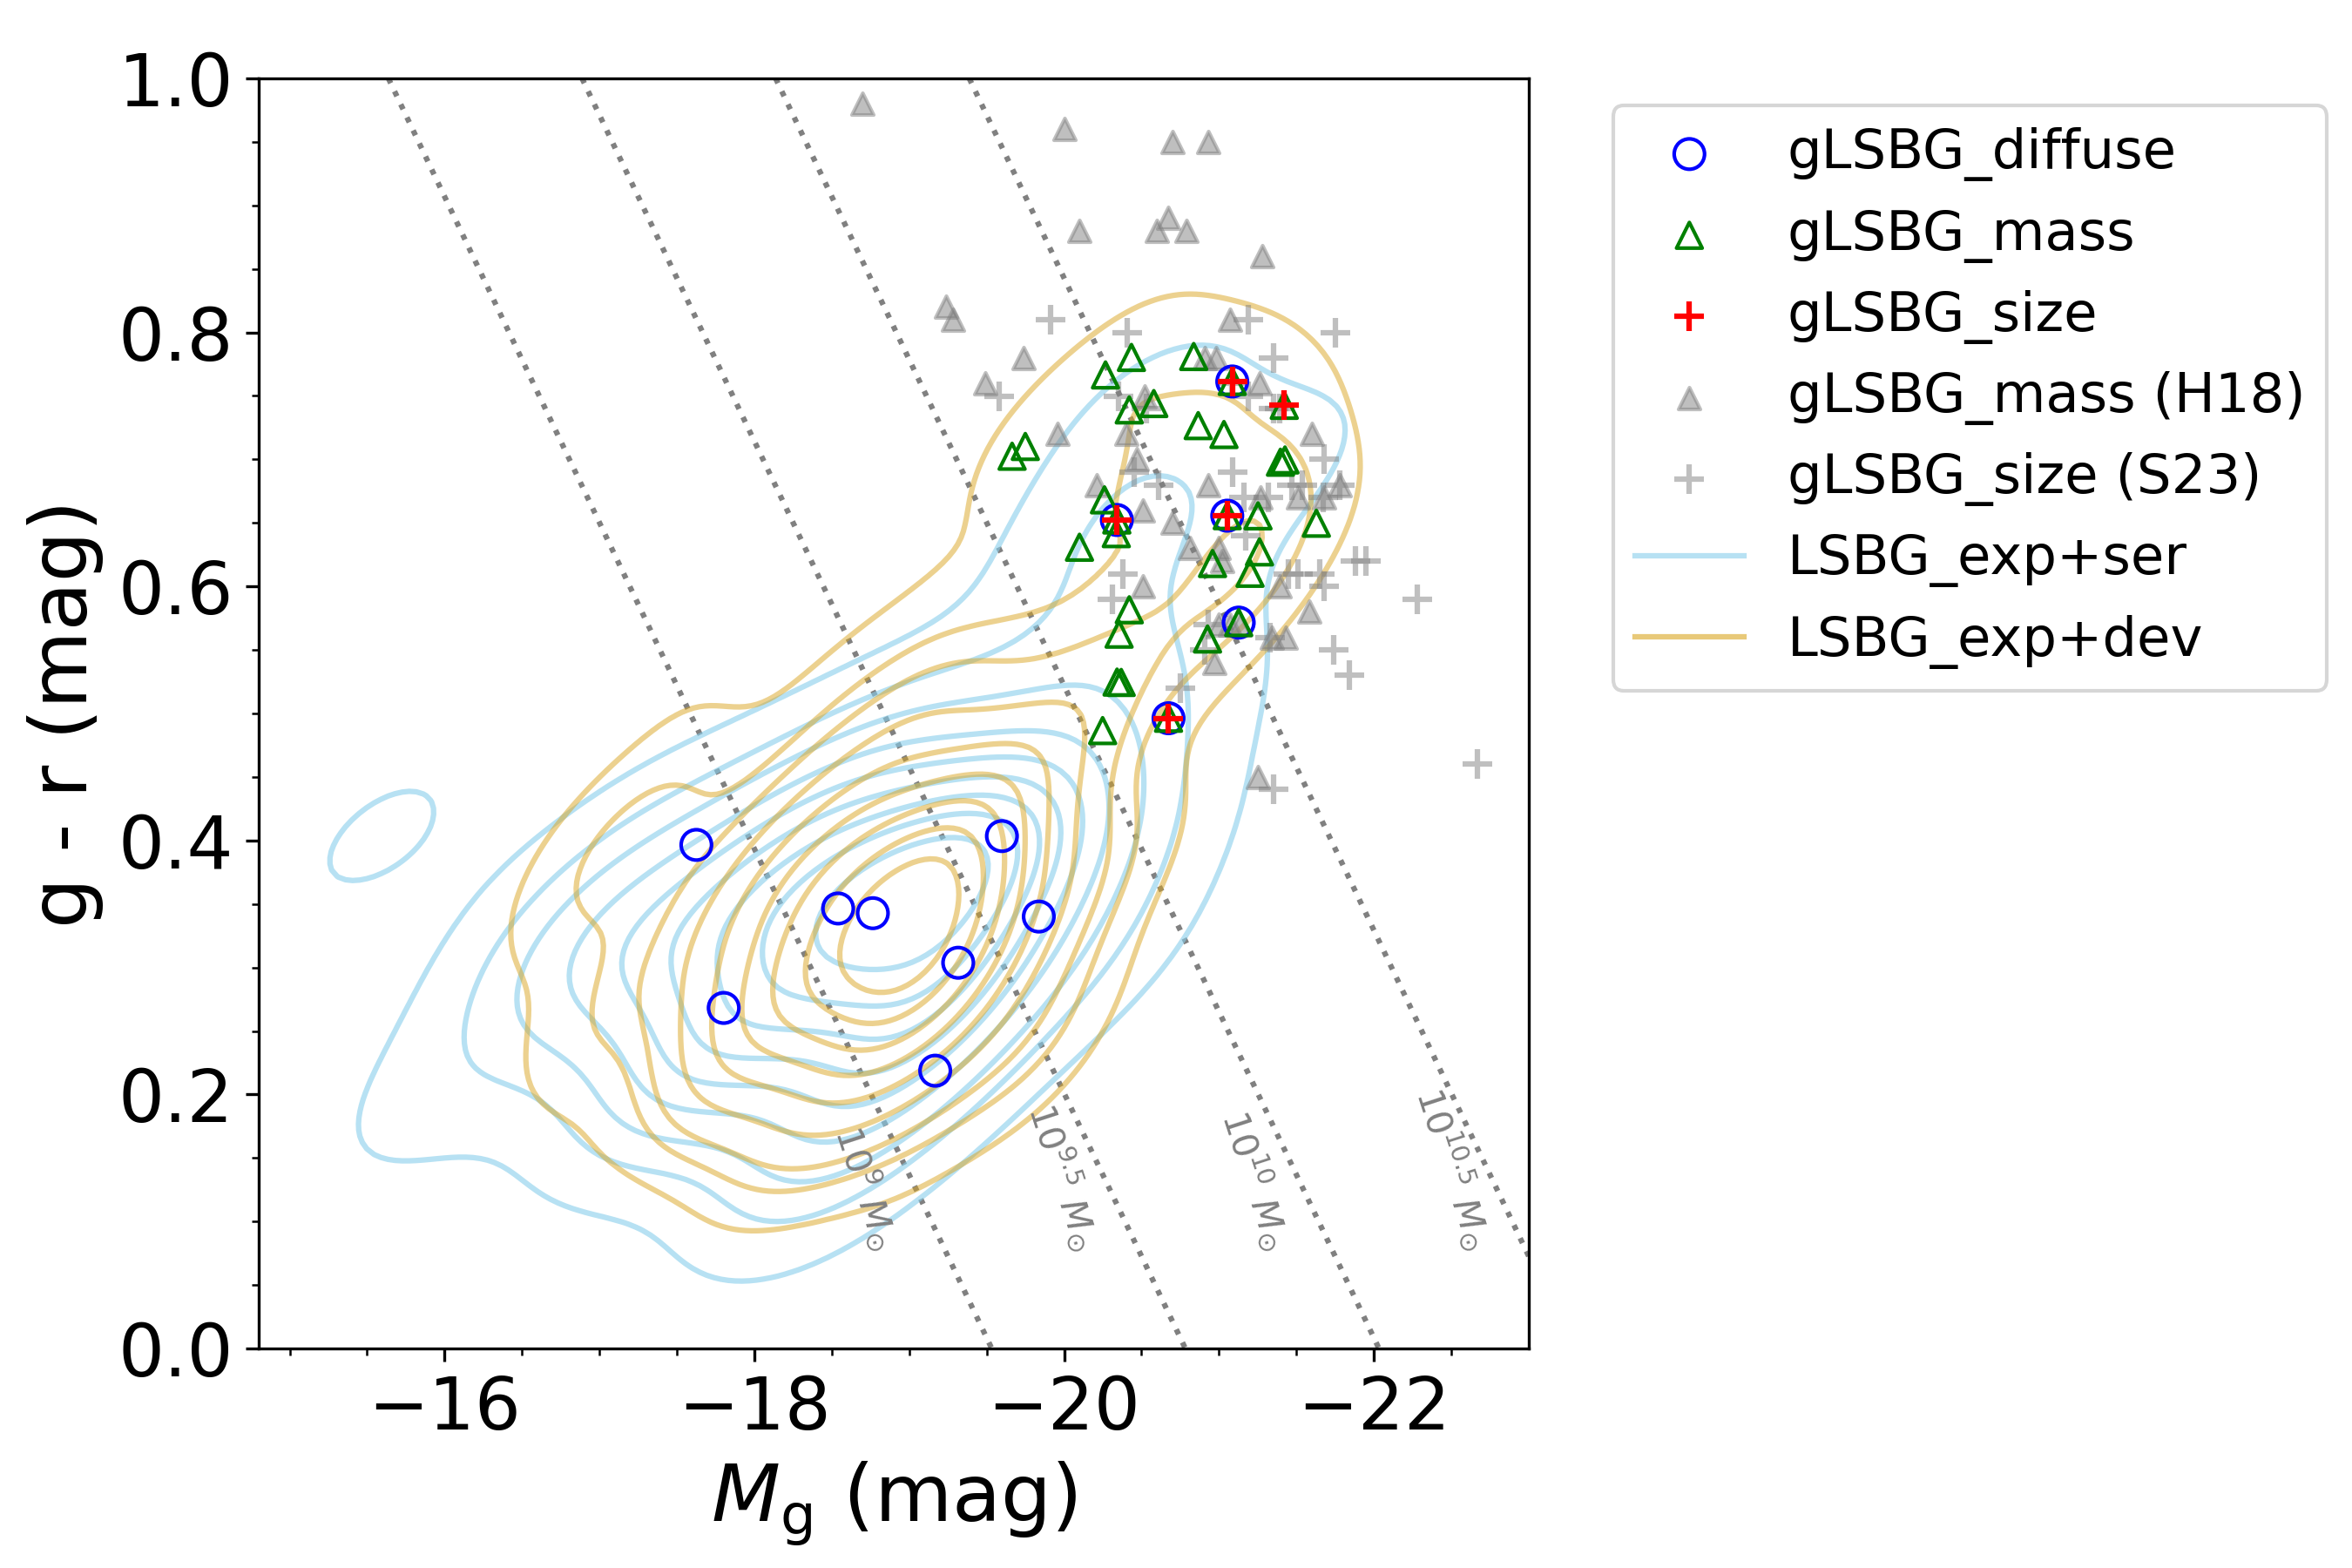
Figure 10 shows the color-magnitude diagram of gLSBGs superimposed on kernel density estimation (KDE) of LSBG_exp+deV (light yellow) and LSBG_exp+ser (light blue). The grey triangles and gray crosses represent gLSBGs from H18 and S23, respectively. The gray dotted lines represent stellar mass of , , , and . Different shapes of marker represent the gLSBGs selected from different criteria. Among our 39 non-repetitive gLSBGs, 31 of them lie on the right side of the stellar mass line. 90.32% (28/31) out of the 31 gLSBGs have the sérsic index of the bulge component , indicating most of our gLSBGs hold a classical bulge. These 31 gLSBGs locate at the same region as gLSBGs in H18 and S23, they also seem similar to the gLSBGs that most people recognized which are red in color and giant in luminosity, mass, and size. There are 8 galaxies on the left side of the stellar mass line, and all these gLSBGs are selected by the “diffuseness index” criterion. They seem different from the gLSBGs that most people know, more like normal LSBGs with bulge. This is because the dim contributes a lot to the “diffuseness index”. The median value of of these 8 gLSBGs is dimmer than that of the 31 gLSBGs whose stellar mass is larger than . This is the drawback of the “diffuseness index” criterion. We will eliminate these 8 galaxies from our gLSBGs sample. Our result suggests that for gas-rich LSBGs, is a good criterion to distinguish between gLSBGs and normal LSBGs with bulge.
5 Summary
In this work, we carried out fitting of four models, exponential, sérsic, exp+deV, and exp+ser, to check the systematic effect in selecting LSBGs. Our parent sample is all the galaxies in .40 SDSS DR7 sample, and the images we used are the SDSS images after background reestimation (Du15). We took photometry and two-dimensional fitting for these images.
According to the criteria that the B band central surface brightness of the disk component and the axis-ratio of the disk component , we selected 1105, 1038, 207, and 75 none-edge-on LSBGs from each of the models. Because our parent sample is rich in H\@slowromancapi@ gas, most of our LSBGs are blue. The LSBGs selected by sérsic fitting are in principle the same type of galaxies as exponential fitting. LSBG_exp and LSBG_sérsic have 756 galaxies (68.42% of LSBG_exp and 72.83% of LSBG_sérsic) in common, the rest of the discrepancy is due to the difference between the exponential and sérsic models in obtaining . When , the relation of obtained from sérsic and exponential models can be written as . There are 1546 non-repetitive LSBGs, at least 15.89% of them hold a bulge. The galaxies in LSBG_2comps have larger disk, luminosity, and mass than galaxies in LSBG_1comp. But the bulges is not prominent in the majority of our LSBGs. More than 60% of the galaxies in LSBG_2comps will not be selected if we adopt a single disk model only. We also identified 31 non-repetitive gLSBGs, with 90.32% of them hold a classical bulge. They are located at the same region in the color-magnitude diagram as normal gLSBGs in literature. Based on our gas-rich LSBGs, we find is a good criterion to distinguish between gLSBGs and normal LSBGs with bulge after we compared three kinds of criteria.
Acknowledgements.
This work is supported by the National Key R&D Program of China (grant No.2022YFA1602901). We acknowledge the support of the National Natural Science Foundation of China (NSFC) grant Nos.12090040, 12090041, and 12003043. D.W. is supported by the Youth Innovation Promotion Association, CAS (No.2020057) and the science research grants of CSST from the China Manned Space Project. We acknowledge the support of the National Natural Science Foundation of China (NSFC) grant Nos.11733006 and U1931109. This work is supported by the Strategic Priority Research Program of the Chinese Academy of Sciences, Grant No. XDB0550100. We acknowledge useful discussions with Mr. Zehao Zhong and Mr. Yu Zhang. This work was partially supported by the Open Project Program of the Key Laboratory of Optical Astronomy, National Astronomical Observatories, Chinese Academy of Sciences.References
- Abazajian et al. (2009) Abazajian, K. N., Adelman-McCarthy, J. K., Agüeros, M. A., et al. 2009, ApJS, 182, 543
- Adelman-McCarthy et al. (2006) Adelman-McCarthy, J. K., Agüeros, M. A., Allam, S. S., et al. 2006, ApJS, 162, 38
- Adelman-McCarthy et al. (2008) Adelman-McCarthy, J. K., Agüeros, M. A., Allam, S. S., et al. 2008, ApJS, 175, 297
- Bertin & Arnouts (1996) Bertin, E., & Arnouts, S. 1996, A&AS, 117, 393
- Bothun et al. (1987) Bothun, G. D., Impey, C. D., Malin, D. F., & Mould, J. R. 1987, AJ, 94, 23
- Brown et al. (2001) Brown, W. R., Geller, M. J., Fabricant, D. G., & Kurtz, M. J. 2001, AJ, 122, 714
- Burkholder et al. (2001) Burkholder, V., Impey, C., & Sprayberry, D. 2001, AJ, 122, 2318
- Cao et al. (2017) Cao, T.-W., Wu, H., Du, W., et al. 2017, AJ, 154, 116
- Capaccioli (1989) Capaccioli, M. 1989, in World of Galaxies (Le Monde des Galaxies), ed. J. Corwin, Harold G. & L. Bottinelli (Springer New York, NY), 208
- Courteau (1996) Courteau, S. 1996, ApJS, 103, 363
- de Blok et al. (1996) de Blok, W. J. G., McGaugh, S. S., & van der Hulst, J. M. 1996, MNRAS, 283, 18
- de Blok et al. (1995) de Blok, W. J. G., van der Hulst, J. M., & Bothun, G. D. 1995, MNRAS, 274, 235
- Dey et al. (2019) Dey, A., Schlegel, D. J., Lang, D., et al. 2019, AJ, 157, 168
- Du et al. (2020) Du, W., Cheng, C., Zheng, Z., & Wu, H. 2020, AJ, 159, 138
- Du et al. (2015) Du, W., Wu, H., Lam, M. I., et al. 2015, AJ, 149, 199
- Fisher & Drory (2008) Fisher, D. B., & Drory, N. 2008, AJ, 136, 773
- Galaz et al. (2011) Galaz, G., Herrera-Camus, R., Garcia-Lambas, D., & Padilla, N. 2011, ApJ, 728, 74
- Galaz et al. (2015) Galaz, G., Milovic, C., Suc, V., et al. 2015, ApJ, 815, L29
- Giovanelli et al. (2005) Giovanelli, R., Haynes, M. P., Kent, B. R., et al. 2005, AJ, 130, 2598
- Greco et al. (2018) Greco, J. P., Greene, J. E., Strauss, M. A., et al. 2018, ApJ, 857, 104
- Hagen et al. (2016) Hagen, L. M. Z., Seibert, M., Hagen, A., et al. 2016, ApJ, 826, 210
- Haynes et al. (2011) Haynes, M. P., Giovanelli, R., Martin, A. M., et al. 2011, AJ, 142, 170
- He et al. (2020) He, M., Wu, H., Du, W., et al. 2020, ApJS, 248, 33
- He et al. (2013) He, Y. Q., Xia, X. Y., Hao, C. N., et al. 2013, ApJ, 773, 37
- Honey et al. (2018) Honey, M., van Driel, W., Das, M., & Martin, J. M. 2018, MNRAS, 476, 4488
- Huang et al. (2014) Huang, S., Haynes, M. P., Giovanelli, R., et al. 2014, ApJ, 793, 40
- Hyde & Bernardi (2009) Hyde, J. B., & Bernardi, M. 2009, MNRAS, 394, 1978
- Impey & Bothun (1997) Impey, C., & Bothun, G. 1997, ARA&A, 35, 267
- Kron (1980) Kron, R. G. 1980, ApJS, 43, 305
- Lauer et al. (2007) Lauer, T. R., Faber, S. M., Richstone, D., et al. 2007, ApJ, 662, 808
- Lei et al. (2019) Lei, F.-J., Wu, H., Zhu, Y.-N., et al. 2019, ApJS, 242, 11
- Lei et al. (2018) Lei, F.-J., Wu, H., Du, W., et al. 2018, ApJS, 235, 18
- Liang et al. (2010) Liang, Y. C., Zhong, G. H., Hammer, F., et al. 2010, MNRAS, 409, 213
- Liu et al. (2008) Liu, F. S., Xia, X. Y., Mao, S., Wu, H., & Deng, Z. G. 2008, MNRAS, 385, 23
- Martin et al. (2019) Martin, G., Kaviraj, S., Laigle, C., et al. 2019, MNRAS, 485, 796
- McGaugh (1996) McGaugh, S. 1996, in New Light on Galaxy Evolution, ed. R. Bender & R. L. Davies, Vol. 171 (Springer Dordrecht), 97
- McGaugh & Bothun (1994) McGaugh, S. S., & Bothun, G. D. 1994, AJ, 107, 530
- McGaugh et al. (1995a) McGaugh, S. S., Bothun, G. D., & Schombert, J. M. 1995a, AJ, 110, 573
- McGaugh et al. (1995b) McGaugh, S. S., Schombert, J. M., & Bothun, G. D. 1995b, AJ, 109, 2019
- Moore & Parker (2006) Moore, L., & Parker, Q. A. 2006, PASA, 23, 165
- O’Neil (2004) O’Neil, K. 2004, AJ, 128, 2080
- O’Neil et al. (1997) O’Neil, K., Bothun, G. D., & Cornell, M. E. 1997, AJ, 113, 1212
- O’Neil et al. (2003) O’Neil, K., Schinnerer, E., & Hofner, P. 2003, ApJ, 588, 230
- O’Neil et al. (2023) O’Neil, K., Schneider, S. E., van Driel, W., et al. 2023, AJ, 165, 263
- Pahwa & Saha (2018) Pahwa, I., & Saha, K. 2018, MNRAS, 478, 4657
- Peng et al. (2002) Peng, C. Y., Ho, L. C., Impey, C. D., & Rix, H.-W. 2002, AJ, 124, 266
- Peng et al. (2010) Peng, C. Y., Ho, L. C., Impey, C. D., & Rix, H.-W. 2010, AJ, 139, 2097
- Pickering et al. (1997) Pickering, T. E., Impey, C. D., van Gorkom, J. H., & Bothun, G. D. 1997, AJ, 114, 1858
- Pizzella et al. (2008) Pizzella, A., Corsini, E. M., Sarzi, M., et al. 2008, MNRAS, 387, 1099
- Rosenbaum et al. (2009) Rosenbaum, S. D., Krusch, E., Bomans, D. J., & Dettmar, R. J. 2009, A&A, 504, 807
- Saburova et al. (2023) Saburova, A. S., Chilingarian, I. V., Kulier, A., et al. 2023, MNRAS, 520, L85
- Simard et al. (2011) Simard, L., Mendel, J. T., Patton, D. R., Ellison, S. L., & McConnachie, A. W. 2011, ApJS, 196, 11
- Smith et al. (2002) Smith, J. A., Tucker, D. L., Kent, S., et al. 2002, AJ, 123, 2121
- Sprayberry et al. (1995) Sprayberry, D., Impey, C. D., Bothun, G. D., & Irwin, M. J. 1995, AJ, 109, 558
- Tanoglidis et al. (2021) Tanoglidis, D., Drlica-Wagner, A., Wei, K., et al. 2021, ApJS, 252, 18
- Trujillo et al. (2001) Trujillo, I., Aguerri, J. A. L., Cepa, J., & Gutiérrez, C. M. 2001, MNRAS, 321, 269
- van der Hulst et al. (1993) van der Hulst, J. M., Skillman, E. D., Smith, T. R., et al. 1993, AJ, 106, 548
- Willmer (2018) Willmer, C. N. A. 2018, ApJS, 236, 47
- York et al. (2000) York, D. G., Adelman, J., Anderson, John E., J., et al. 2000, AJ, 120, 1579
- Zhong et al. (2008) Zhong, G. H., Liang, Y. C., Liu, F. S., et al. 2008, MNRAS, 391, 986