Aliasing from Galactic Plane Setting in Widefield Radio Interferometry
Abstract
Measurements with widefield radio interferometers often include the near-infinite gradient between the sky and the horizon. This causes aliasing inherent to the measurement itself, and is purely a consequence of the Fourier basis. For this reason, the horizon is often attenuated by the instrumental beam down to levels deemed inconsequential. However, this effect is enhanced via our own Galactic plane as it sets over the course of a night. We show all-sky simulations of the Galactic plane setting in a radio interferometer in detail for the first time. We then apply these simulations to the Murchison Widefield Array to show that a beam attenuation of 0.1% is not sufficient in some precision science cases. We determine that the noise statistics of the residual data image are drastically more Gaussian with aliasing removal, and explore consequences in simulation for cataloging of extragalactic sources and 21 cm Epoch of Reionization detection via the power spectrum.
1 Introduction
Survey science and all-sky statistics benefit from widefield observations, increasing the sky coverage and reducing signal-to-noise. In radio interferometry, many instruments now see a significant portion of the sky to reap these advantages. Some of the widest Field-of-View instruments include the Murchison Widefield Array (MWA11119.4 deg at 200 MHz; Tingay et al. 2013), the Hydrogen Epoch of Reionization Array (HERA2229 deg at 150 MHz; DeBoer et al. 2017), the New Extension in Nançay Upgrading LOFAR (Nenufar3337.1 deg at 85 MHz; Zarka et al. 2020), the Low Frequency Array (LOFAR4446.38 deg at 200 MHz; van Haarlem et al. 2013), and the Hydrogen Intensity and Real-time Analysis Experiment (HIRAX5555–10 deg at 400–800 MHz; Crichton et al. 2022), to name a few.
However, by increasing the amount of sky seen per observation, many assumptions that built the field of radio interferometry are no longer satisfactory. More recently, the sharpness of the opaque horizon has been seen to affect widefield observations. Interferometers natively measure in a basis akin to Fourier space, and thus can experience aliasing at infinite gradients. The horizon represents an infinite gradient between sky emission and opaque ground, and bright emission at the horizon can exacerbate the amount of aliasing produced.
Foregrounds at the horizon have been seen in Fourier space, creating a ”pitchfork” effect in the Fourier transform along element–element separations known as delay space (Thyagarajan et al., 2015). Calibration accuracy can be improved by filtering the measurements themselves in time as foregrounds move across the night for drift-scan instruments (Charles et al., 2023). Non-interferometric radio observations of the full sky, like in global-signal experiments, see the horizon to a significant degree and thus must account for horizon emission in their models (Bassett et al., 2021). In both delay-space corrections and global-signal models, statistical methods were used to indirectly suppress or observe horizon effects.
We present the most detailed image-space observations and simulations of the setting of the Galactic plane to definitively show the effect of horizon-based aliasing along with its progenitor. Our own Galaxy is an extremely bright source of synchrotron emission, i.e. over 2,000 Jy at 159 MHz at the Galactic Centre (Kriele et al., 2022), and subtends an arc over the whole sky. We show that as it sets over the opaque horizon, even at extremely low levels of beam sensitivity, it creates aliasing that is inherent to the observations themselves and is present throughout the entirety of the image. This has consequences in calibration, image-generation, and noise characterisation for precision science cases in widefield radio interferometry.
We explore the effects of aliasing of the Galactic plane for two separate science cases: extragalactic catalogs and the Epoch of Reionization (EoR) detection.
- Extragalactic catalogs
-
: Creation of extragalactic catalogs requires deep images to determine flux density and shape of compact and diffuse sources. Even with advanced deconvolution strategies and a range of LST measurements, the aliasing of the Galactic plane will not fully decorrelate in image-space and will affect the completeness of catalogs in certain regions of sky.
- EoR
-
: The redshifted 21-cm line from Hydrogen during the EoR is expected to be extremely faint in comparison to the extragalactic and Galactic foregrounds, however they naturally separate in Fourier space due to their differing spectral signatures. Thus, measurements of this time period are pursued in the power spectrum or similar. Noise-like additions to the power spectrum that do not decorrelate with time will preclude the faint EoR measurement.
In Section 3, we simulate the effects of the setting of the Galactic plane in image space at 180 MHz for interferometric observations, and then narrow our focus to simulated MWA Phase I observations of the one of the coldest patches in the Southern hemisphere. In Section 4, we show how our simulations can mitigate the setting of the Galactic plane in real data and improve the overall noise statistics of the image. We propagate these effects into 1) the cataloging metric of catalog completeness and 2) the power spectrum metric of the 21-cm detection of the EoR in Section 5. Appendix 2 outlines our methodologies and Section 6 summarizes our results.
2 Analysis and Data
To show the effects of the setting of the Galactic plane in radio interferometry, we employ precise simulations of Galactic maps, horizon-to-horizon imaging software, and example data from the MWA. We highlight the key procedures and aspects of these highly complex frameworks.
2.1 Catalogs and MWA Data
The MWA is a radio interferometer that is composed of simple cross-dipoles arranged in square stations of 16. For the Phase I of the MWA (2013–2016; Tingay et al. 2013), there were 128 of these stations in a pseudo-random configuration. The maximum distance between stations (baseline) was 3 km with a nearly filled aperture in Fourier space to about 50 wavelengths.
Our example data from the MWA was observed on July 1st, 2014 at frequencies 167–198 MHz. The target field was EoR0, centered on RA 0 h, Dec -27 deg. Data is integrated over 2 sec intervals for a total time of 2 min per observation. Over the course of the night, the EoR0 field is observed in a drift-and-shift mode, where the pointing center is updated every 30 min to keep the field in view, and thus a small range of Local Sidereal Times (LSTs) is covered every night.
We use three catalogs for simulation and calibration purposes of these MWA data.
- Extragalactic
-
: We use the bespoke LoBES catalog which was built specifically for the precise requirements of EoR science with the MWA (Lynch et al., 2021). It uses a combination of point-source, Gaussian, and shapelet components to model 80,824 sources in 3,069 deg2 .
- Cas A
-
: Near the horizon, we also observe Casseiopia A (Cas A), an extremely bright and extended source with flux density of at 18,500 Jy at 74 MHz (Perley & Butler, 2017). We use the SNR-modelling framework built by Cook et al. (2022) to build a Gaussian component model using high-resolution data from the Very Large Array (VLA).
- Galactic Plane
-
: We use the catalog from Kriele et al. (2022), natively measured at 159 MHz using the Engineering Development Array 2 (EDA2; Wayth et al. 2021) since it most accurately represents the data. Due to a high gradient in beam sensitivity near the horizon, we transform the spherical harmonics to a high-resolution (1.7’) series of point sources. We only include components within Galactic longitudes of 15 deg to simulate the plane only.
2.2 Simulation and Image Framework
In total, we need to simulate over 6.7 million components for each of the 56 time steps and 384 frequency channels per observation with near-perfect representation at the horizon. We use a CUDA-enabled simulator, WODEN666https://github.com/JLBLine/WODEN (Line, 2022), to simulate visibilities directly from the measurement equation:
| (1) |
where are directional cosines, and their Fourier-dual is baseline separation in wavelengths, . The flux density of the model components, , are taken from the catalog. The beam sensitivity at any given point on the sky, , is calculated for each component’s location using hyperbeam777https://github.com/MWATelescope/mwa_hyperbeam.
To generate images from both simulated visibilities and observed visibilities, we use Fast Holographic Deconvolution888https://github.com/EoRImaging/FHD (FHD; Sullivan et al. 2012; Barry et al. 2019a). FHD’s resource requirement scales effectively, allowing efficient generation of horizon-to-horizon images. There are three algorithms in FHD which are important in the context of this work:
- Calibration
-
: We must remove instrumental effects through calibration for observed visibilities. To capture per-frequency structure, we use the measured auto-correlations, which are very stable in time for the MWA. Coherent noise is mitigated via an overall scaling to cross-correlations. For a more detailed description of calibration, please see Barry et al. (2019a); Li et al. (2019). Calibration is only required for observed data (Section 4).
- Beam Estimation
-
: The beam sensitivity as a function of sky location is used for both gridding and image contouring. We use a Gaussian decomposition of the MWA beam as described by Barry & Chokshi (2022), which is fully analytic in the image and Fourier plane, mitigating discrete FFT effects.
- Image Generation
-
: We grid each visibility onto a Fourier plane using the Gaussian decomposition estimation as a kernel. We also separately grid the contribution of the beam estimation to generate weights in the Fourier plane. The FFT of these discrete planes then generates the orthogonal projection of the image in uniform weighting. Mask contours are generated at the 1% level of the beam. No image-based cuts or padding is performed in order to keep propagated weights for the power spectrum (Section 5).
3 Interferometric Galactic Plane Simulations
Aliasing in the image space is dependent not only on the location/brightness of the setting source, but also the properties of the measuring interferometer. Therefore, we will first simulate how this aliasing occurs using a simple instrument, one that is both unpolarized and unattenuated by a beam response. We will then simulate how the aliasing is affected by a more realistic instrumental response via the MWA polarized beams.
3.1 Unpolarized, unattenuated interferometer
We show the Galactic plane catalog in the top row of Figure 1 for three different LSTs. These LSTs represent the observations for before, during, and after the Galactic plane setting. We purposely choose to simulate only 15 deg away from Galactic plane itself (white contours) to capture the vast majority of its brightness whilst leaving as much as the sky unaltered by simulation as possible.
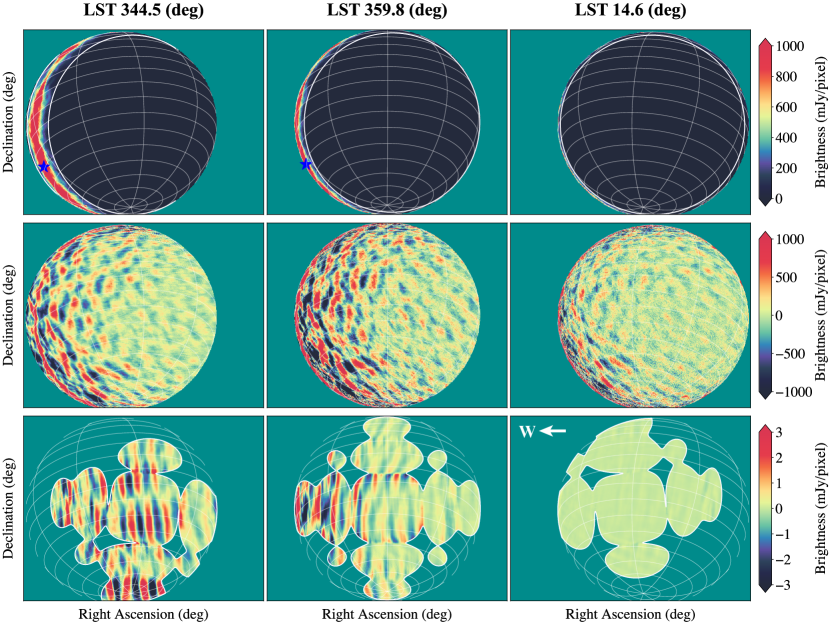
Mathematically, an unpolarized, unattenuated interferometer beam can be simply described as having in Equation 1. While this is unphysical, it helps to show the base level of contamination prior to instrumental complications. The middle row of Figure 1 shows the simulation of the Galactic plane for this simple case (specifically with a MWA layout). While the Galactic plane is obviously present at similar levels compared to the catalog, visible aliasing is also present throughout the entirety of the image. This additional, unwanted signal is caused by a finite sampling in Fourier space of an infinite gradient due to sudden opaqueness of the horizon, further emphasized by the extremely bright and extended Galactic plane.
The level of aliasing depends on the location of the Galactic plane. The aliasing is brightest as the full Galactic plane transitions across the horizon (Figure 1, middle). The Galactic plane aliasing is still significant prior to full set (left), but less in comparison. After the full set (right), the aliasing diminishes significantly. As the Galactic plane sets, the associated aliasing moves, albeit slightly. There can be some decoherence from averaging the LSTs together, and it is in this way that some of the aliasing can be mitigated.
The spatial scales affected by the Galactic plane aliasing translates to a few Mpc to tens of Mpc at a redshift of 6.8. Estimates for EoR bubble sizes at that redshift are in the range of 10 cMpc (Wyithe & Loeb, 2004) up to 100 cMpc (Lin et al., 2016), which could pose extraction issues for EoR tomography if no spectral or time mitigation is in place to disentangle Galactic plane aliasing from the EoR signal.
3.2 Realistic interferometer
Beam attenuation and polarization will affect the perceived level of Galactic plane aliasing. We show the MWA as an example, which has a large FoV. For an observation at an LST of 359.6 deg (Figure 1, middle), the horizon that the Galactic plane sets over is attenuated to 0.2% by the beam response.
The Galactic plane is so bright, however, that this extreme attenuation does not remove the aliasing, apparent in the bottom row of Figure 1. The aliasing is present at the level of a few mJy/pixel at resolutions of 3.36’ per pixel. As investigated in Section 4, this poses a problem in real data.
The polarization of the instrument also changes the perceived shape of the aliasing given the location of the Galactic plane as it sets. In the example of Figure 1, the N–S aligned dipole beam was chosen, which is most sensitive E–W due to the toroidal electromagnetic response of a dipole. This polarization is most sensitive to the vertically aligned Galactic plane towards the E–W, creating vertical structures in the aliasing. The E–W aligned dipole beam, in contrast, will be most sensitive N–S, and thus will be less affected (see Figure 2 for an example).
4 Real Data Mitigation
The Galactic plane and its aliasing can be seen in 2 min of data with the MWA given a highly precise data analysis described in Section 2.2.
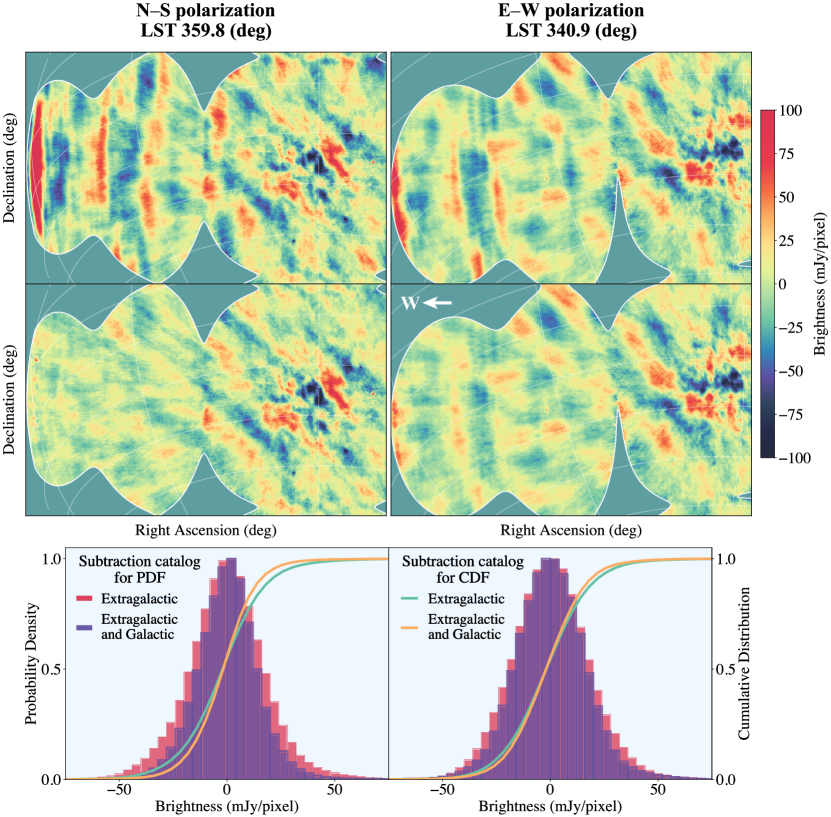
The residual image after removing extragalactic sources is shown in Figure 2 (top row) in Briggs 0 weighting. The Galactic plane is over-saturated in the N–S polarization for a zenith-pointed observation (left), and just barely present in the E–W polarization for an observation two pointings before zenith (right). The aliasing, observed as vertical streaking, is apparent in both polarizations and can easily be seen in the primary lobe for the N–S polarization. Much of the remaining flux density in the image is due to off-plane Galactic diffuse emission, which has not been subtracted in order to avoid contaminating the aliasing contribution.
In contrast, our simulation of the Galactic plane through the MWA is also subtracted from the data in the second row. A drastic reduction in brightness can be seen not only at the location of the Galactic plane, but throughout the entirety of the image due to a successful reconstruction of the aliasing. The aliasing structure is similar in size and shape to the remaining off-planar Galactic diffuse emission, suggesting that mapping the diffuse structure would be exceedingly difficult without aliasing removal.
We show the change in noise statistics when the Galactic plane and its horizon aliasing are removed from the data in the bottom row of Figure 2. The probability distribution function (PDF) and cumulative distribution function (CDF) of the residual brightness should follow Gaussian noise if all sources of sky brightness are removed from the image. The PDF and CDF of the extragalactic-subtracted image do appear Gaussian-like (red histogram and cyan line, respectively). However, when the Galactic plane is also subtracted from the image, the PDF and CDF are more Gaussian (purple histogram and yellow line, respectively) and have far less variance. This indicates that the Galactic plane and its associated horizon aliasing contributes excess variance to the image.
| Subtraction | Standard | |||
|---|---|---|---|---|
| catalog | deviation | Skewness | Kurtosis | |
| E | 20.8 | 1.67 | 14.3 | |
| N–S | E & GP | 14.7 | -0.01 | 5.84 |
| E | 18.4 | 0.24 | 1.52 | |
| E–W | E & GP | 16.4 | 0.05 | 1.45 |
Table 1 summarizes the statistics of the residual images. The standard deviation decreases by as much as 30% in the N–S polarization when the Galactic plane and its aliasing are removed. Almost all skewness, or asymmetry, is gone. The resulting N–S image is also less tailed by almost 60%, indicating that the distribution has fewer extremes and is closer to a Gaussian. The residual E–W image also experiences reductions in non-Gaussian behavior, albeit to a lesser degree.
5 Consequences in Precision Science
We show how the setting of the Galactic plane affects two precision science cases: cataloging of faint, extragalactic radio sources and the 21-cm EoR power spectrum. To generate a base level of understanding, we do not include the effects of calibration.
5.1 Extragalactic Catalogs
The process of making catalogs of extragalactic sources for population studies results in a well-calibrated, mosiac image with all known corrections applied. This image is then used to perform source finding — algorithms which estimate a background RMS to then pull out peaks which are over a supplied threshold, fitting Gaussians, wavelets, or points to build a model of the structure on the sky. Fainter sources are harder to capture in sources-finding algorithms, and can be subject to Eddington bias, resolution bias, and sensitivity bias.
However, the contribution of Galactic plane aliasing in a multi-observation mosiac over a range of LST introduces its own form of bias. Large-scale structure on the sky is artificially subsumed into the background RMS calculated via source-finding algorithms. This can bias both the total number and integrated flux of recovered sources.
These bias can be quantified via a completeness metric (i.e. Williams et al. 2016; Hale et al. 2019; Franzen et al. 2019). False sources are injected into the final image which represent a theoretical population of complex sources that follow flux, shape, and positional distributions of known sources. The false sources are then recovered by the source-finding algorithms to quantify the level of flux density that is required to be statistically significant in the image.
We closely follow the methods of Lynch et al. (2021) in calculating the completeness metric, with one exception. We inject the theoretical sources into our simulated images and compare the resulting completeness metrics between image simulations which include the Galactic plane and those which do not. The change in the completeness metric is representative of the effect that the Galactic plane aliasing has on faint-source detection.
We observe a bias in the number of recovered sources of less than , with changes in integrated flux of only a 0 – 200 mJy for a typical range of LST per pointing with the MWA. Biases are more prevalent in algorithms which use complicated RMS-calculation procedures; for example, cutouts around bright sources (used in Lynch et al. (2021) with pyBDSF) introduces higher bias due to accidental inclusion of aliasing. In general, our calculated bias is low enough to not cause much concern for extragalactic catalog science, and is a good example of how integration helps to reduce the Galactic plane aliasing component.
5.2 21-cm EoR Power Spectrum
The EoR power spectrum (PS) measurement relies on the natural separation of foregrounds from the 21-cm signal in Fourier space. Noise-like signals which do not decorrelate with time could potentially preclude the measurement.
PS analysis typically generates either a measured PS (i.e. delay or gridded delay, Parsons et al. 2012) or a reconstructed PS (i.e. {, }, Morales & Hewitt 2004). Thyagarajan et al. (2015) first measured the implications of widefield foregrounds, including the Galactic plane, on measured PS analyses. In this work, we demonstrate the effects of the Galactic plane setting with simulations in a reconstructed PS analysis.
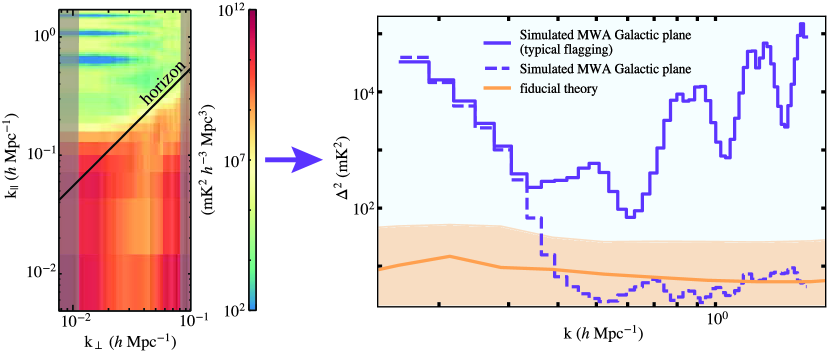
Figure 3 shows the 2D PS of simulations of the Galactic plane through the MWA for a 2-hr data set centered on field EoR0 (left). Foregrounds are generally confined to the region below the solid black line, as is characteristic with the expected chromaticity of the instrument (Datta et al., 2010; Morales et al., 2012; Parsons et al., 2012; Trott et al., 2012; Vedantham et al., 2012; Hazelton et al., 2013; Pober et al., 2013; Thyagarajan et al., 2013; Liu et al., 2014). The location of the foregrounds on the sky will affect the associated location of power in the PS space. As the foregrounds move away from the main Field-of-View towards the horizon, they will move as a line, where the intercept increases with distance from phase center (i.e. Morales et al. 2012; Pober et al. 2016). This line is shown in Figure 3 (left) as a solid black line for foregrounds at the horizon.
Our simulations model the data from the MWA. As such, we include regular flagging in frequency due to aliased channels from the polyphase filter bank, which are then averaged in frequency. The foregrounds are coupled to the channels with incomplete, missing data. This manifests as contaminated lines in , three of which can be seen in Figure 3. The original locations of foregrounds are reflected in the contaminated modes, creating a double-pronged feature with the Galactic plane which is reminiscent of the ”pitchfork” effect (see Thyagarajan et al. 2015).
When cylindrically averaged to a 1D PS (right, solid purple line), these double-pronged features contaminate enough modes to preclude the EoR measurement (right, orange line). However, the effects of missing or incomplete channels can be mitigated by employing extensive removal techniques or full covariance weighting (i.e. Offringa et al. 2019). We also show a 1D PS of unflagged Galactic plane simulations (right, dashed purple line), which show that measurements of the 21.
Regardless of flagged channels, the Galactic plane still poses an issue to measuring the EoR PS. Modes higher than Mpc-1 in Figure 3 have excess power due to the aliasing of the horizon (similiar to the effect seen in Barry & Chokshi 2022). In this particular case, the horizon is highlighted by the Galactic plane.
We also investigate the effects on the EoR PS in real data. Using the same 2-hr data set as an example, we generate limits on the 21-cm signal using the same data selection and binning techniques as Barry et al. (2019b). When the Galactic plane is removed in addition, there is a reduction in the upper limit by 0.4% in the N–S polarization at 0.2 h Mpc-1, which was the lowest -mode in Barry et al. (2019b). This reduction is over 20x larger than the 21-cm signal itself.
6 Conclusion
Widefield radio interferometry can be affected by aliasing inherent to the measurement itself from the bright, Galactic plane setting over the opaque horizon. We show simulations of this effect in great detail for the first time using the diffuse catalog from Kriele et al. (2022) as input into WODEN, a GPU-enabled analytic simulator (Line, 2022), to create visibilities that are imaged with FHD (Sullivan et al., 2012; Barry et al., 2019a). These simulations, when subtracted from data, show improved image quality in just 2 min of observation.
The aliasing of the Galactic plane setting is heavily attenuated by the beam. For the MWA, the aliasing structure can be upwards of tens of mJy per pixel in the primary lobe using Briggs 0 weighting. This structure moves slowly with LST, and thus will decorrelate slightly when integrated over a range of LST.
The noise statistics of a real data image are improved with the removal of the Galactic plane and its aliasing. The resulting MWA image has less variance, skewness, and kurtosis. For future measurements of higher-order moments of the EoR (Watkinson & Pritchard, 2015; Kittiwisit et al., 2022), like the skew spectrum (Ma & Peng, 2023; Cook et al., in review), this could have a huge potential impact if done in image space.
We demonstrate the potential for impact on two current science goals: extragalactic cataloging and 21 cm EoR power spectra detection.
-
1.
For extragalactic cataloging, a small bias is introduced in the RMS maps of the mosaic image, which in turn propagates to the number of sources recovered and their integrated flux. This is, in general, small enough to not be of concern when a range of LST are used to create the mosaic image.
-
2.
For 21 cm EoR power spectra detection, there is quite a substantial effect near the horizon line in as expected. If there is regular flagging in frequency space, as is the case for the MWA, this shape will be reflected, creating mirrors of the horizon line that occupy a large number of -modes. Reconstructed PS analyses which take an avoidance strategy will not be able to measure the EoR if this effect is not mitigated.
Our simulations and real data analysis show that the setting of the Galactic plane can introduce aliasing into both Fourier-space and image-space statistical metrics. Given the brightness of the Galactic plane, beam attenuation of 0.1% is not enough to remove this effect from precision science goals.
References
- Barry et al. (2019a) Barry, N., Beardsley, A. P., Byrne, R., et al. 2019a, Publications of the Astronomical Society of Australia, 36, e026, doi: 10.1017/pasa.2019.21
- Barry & Chokshi (2022) Barry, N., & Chokshi, A. 2022, The Astrophysical Journal, 929, 64, doi: 10.3847/1538-4357/ac5903
- Barry et al. (2019b) Barry, N., Wilensky, M., Trott, C. M., et al. 2019b, The Astrophysical Journal, 884, 1, doi: 10.3847/1538-4357/ab40a8
- Bassett et al. (2021) Bassett, N., Rapetti, D., Tauscher, K., et al. 2021, The Astrophysical Journal, 923, 33, doi: 10.3847/1538-4357/ac1cde
- Charles et al. (2023) Charles, N., Kern, N., Bernardi, G., et al. 2023, Monthly Notices of the Royal Astronomical Society, 522, 1009, doi: 10.1093/mnras/stad1046
- Cook et al. (in review) Cook, J. H., Balu, S., Grieg, B., et al. in review, Monthly Notices of the Royal Astronomical Society
- Cook et al. (2022) Cook, J. H., Trott, C. M., & Line, J. L. B. 2022, Monthly Notices of the Royal Astronomical Society, 514, 790, doi: 10.1093/mnras/stac1330
- Crichton et al. (2022) Crichton, D., Aich, M., Amara, A., et al. 2022, Journal of Astronomical Telescopes, Instruments, and Systems, 8, 011019, doi: 10.1117/1.JATIS.8.1.011019
- Datta et al. (2010) Datta, A., Bowman, J. D., & Carilli, C. L. 2010, The Astrophysical Journal, 724, 526, doi: 10.1088/0004-637X/724/1/526
- DeBoer et al. (2017) DeBoer, D. R., Parsons, A. R., Aguirre, J. E., et al. 2017, Publications of the Astronomical Society of the Pacific, 129, 045001, doi: 10.1088/1538-3873/129/974/045001
- Franzen et al. (2019) Franzen, T. M. O., Vernstrom, T., Jackson, C. A., et al. 2019, Publications of the Astronomical Society of Australia, 36, e004, doi: 10.1017/pasa.2018.52
- van Haarlem et al. (2013) van Haarlem, M. P., Wise, M. W., Gunst, A. W., et al. 2013, Astronomy & Astrophysics, 556, A2, doi: 10.1051/0004-6361/201220873
- Hale et al. (2019) Hale, C. L., Robotham, A. S. G., Davies, L. J. M., et al. 2019, Monthly Notices of the Royal Astronomical Society, 487, 3971, doi: 10.1093/mnras/stz1462
- Hazelton et al. (2013) Hazelton, B. J., Morales, M. F., & Sullivan, I. S. 2013, Astrophysical Journal, 770, 156, doi: 10.1088/0004-637X/770/2/156
- Kittiwisit et al. (2022) Kittiwisit, P., Bowman, J. D., Murray, S. G., et al. 2022, Monthly Notices of the Royal Astronomical Society, 517, 2138, doi: 10.1093/mnras/stac2826
- Kriele et al. (2022) Kriele, M. A., Wayth, R. B., Bentum, M. J., Juswardy, B., & Trott, C. M. 2022, Publications of the Astronomical Society of Australia, 39, e017, doi: 10.1017/pasa.2022.2
- Li et al. (2019) Li, W., Pober, J. C., Barry, N., et al. 2019, The Astrophysical Journal, 887, 141, doi: 10.3847/1538-4357/ab55e4
- Lin et al. (2016) Lin, Y., Oh, S. P., Furlanetto, S. R., & Sutter, P. M. 2016, Monthly Notices of the Royal Astronomical Society, 461, 3361, doi: 10.1093/mnras/stw1542
- Line (2022) Line, J. L. b. 2022, Journal of Open Source Software, 7, 3676, doi: 10.21105/joss.03676
- Liu et al. (2014) Liu, A., Parsons, A. R., & Trott, C. M. 2014, Physical Review D, 90, 023018, doi: 10.1103/PhysRevD.90.023018
- Lynch et al. (2021) Lynch, C. R., Galvin, T. J., Line, J. L. B., et al. 2021, Publications of the Astronomical Society of Australia, 38, e057, doi: 10.1017/pasa.2021.50
- Ma & Peng (2023) Ma, Q.-B., & Peng, L. 2023, Monthly Notices of the Royal Astronomical Society, 523, 640, doi: 10.1093/mnras/stad1447
- Morales et al. (2012) Morales, M. F., Hazelton, B., Sullivan, I., & Beardsley, A. 2012, The Astrophysical Journal, 752, 137, doi: 10.1088/0004-637X/752/2/137
- Morales & Hewitt (2004) Morales, M. F., & Hewitt, J. 2004, The Astrophysical Journal, 615, 7, doi: 10.1086/424437
- Offringa et al. (2019) Offringa, A. R., Mertens, F., & Koopmans, L. V. E. 2019, Monthly Notices of the Royal Astronomical Society, 484, 2866, doi: 10.1093/mnras/stz175
- Parsons et al. (2012) Parsons, A. R., Pober, J. C., Aguirre, J. E., et al. 2012, The Astrophysical Journal, 756, 165, doi: 10.1088/0004-637X/756/2/165
- Perley & Butler (2017) Perley, R. A., & Butler, B. J. 2017, The Astrophysical Journal Supplement Series, 230, 7, doi: 10.3847/1538-4365/aa6df9
- Pober et al. (2013) Pober, J. C., Parsons, A. R., Aguirre, J. E., et al. 2013, The Astrophysical Journal Letters, 768, L36, doi: 10.1088/2041-8205/768/2/L36
- Pober et al. (2016) Pober, J. C., Hazelton, B. J., Beardsley, A. P., et al. 2016, The Astrophysical Journal, 819, 8, doi: 10.3847/0004-637X/819/1/8
- Sullivan et al. (2012) Sullivan, I. S., Morales, M. F., Hazelton, B. J., et al. 2012, The Astrophysical Journal, 759, 17, doi: 10.1088/0004-637X/759/1/17
- Thyagarajan et al. (2013) Thyagarajan, N., Shankar, N. U., Subrahmanyan, R., et al. 2013, The Astrophysical Journal, 776, 6, doi: 10.1088/0004-637X/776/1/6
- Thyagarajan et al. (2015) Thyagarajan, N., Jacobs, D. C., Bowman, J. D., et al. 2015, The Astrophysical Journal, 807, L28, doi: 10.1088/2041-8205/807/2/L28
- Tingay et al. (2013) Tingay, S. J., Goeke, R., Bowman, J. D., et al. 2013, Publications of the Astronomical Society of Australia, 30, e007, doi: 10.1017/pasa.2012.007
- Trott et al. (2012) Trott, C. M., Wayth, R. B., & Tingay, S. J. 2012, The Astrophysical Journal, 757, 101, doi: 10.1088/0004-637X/757/1/101
- Vedantham et al. (2012) Vedantham, H., Shankar, N. U., & Subrahmanyan, R. 2012, The Astrophysical Journal, 745, 176, doi: 10.1088/0004-637X/745/2/176
- Watkinson & Pritchard (2015) Watkinson, C. A., & Pritchard, J. R. 2015, Monthly Notices of the Royal Astronomical Society, 454, 1416, doi: 10.1093/mnras/stv2010
- Wayth et al. (2021) Wayth, R., Sokolowski, M., Broderick, J., et al. 2021, Journal of Astronomical Telescopes, Instruments, and Systems, 8, 011010, doi: 10.1117/1.JATIS.8.1.011010
- Williams et al. (2016) Williams, W. L., van Weeren, R. J., Röttgering, H. J. A., et al. 2016, Monthly Notices of the Royal Astronomical Society, 460, 2385, doi: 10.1093/mnras/stw1056
- Wyithe & Loeb (2004) Wyithe, J. S. B., & Loeb, A. 2004, Nature, 432, 194, doi: 10.1038/nature03033
- Zarka et al. (2020) Zarka, P., Denis, L., Tagger, M., et al. 2020, in 2020 URSI General Assembly and Scientific Symposium