CompdVision: Combining Near-Field 3D Visual and Tactile Sensing
Using a Compact Compound-Eye Imaging System
Abstract
As automation technologies advance, the need for compact and multi-modal sensors in robotic applications is growing. To address this demand, we introduce CompdVision, a novel sensor that combines near-field 3D visual and tactile sensing. This sensor, with dimensions of 221414 mm, leverages the compound eye imaging system to achieve a compact form factor without compromising its dual modalities. CompdVision utilizes two types of vision units to meet diverse sensing requirements. Stereo units with far-focus lenses can see through the transparent elastomer, facilitating depth estimation beyond the contact surface, while tactile units with near-focus lenses track the movement of markers embedded in the elastomer to obtain contact deformation. Experimental results validate the sensor’s superior performance in 3D visual and tactile sensing. The sensor demonstrates effective depth estimation within a 70mm range from its surface. Additionally, it registers high accuracy in tangential and normal force measurements. The dual modalities and compact design make the sensor a versatile tool for complex robotic tasks. Videos are available at https://hkust-orisys.github.io/CompdVision.
I Introduction
3D visual and tactile sensing are critical components in robotic manipulation. Traditional approaches often employ tactile sensors in conjunction with external cameras, which are either placed within the local environment [1][2] or mounted on the robotic arm’s wrist [3][4]. However, these setups have limitations. For instance, most depth cameras are relatively bulky and optimized for detecting objects at a distance, which is not ideal for close-up interactions. This distance-centric design often leads to occlusion problems, where the camera’s view is blocked, hindering accurate object localization when the gripper moves near the target.
Vision-based tactile sensors such as GelSight [5] and Digit [6] have been increasingly utilized due to their capacity to capture detailed tactile information, proving beneficial in diverse applications [7][8]. These sensors typically use internal cameras to capture deformations in soft skin, thereby providing tactile data. Despite their advantages, many of these sensors are still quite large, limiting their applicability in compact systems. To address this problem, researchers have begun to explore the use of compound-eye imaging systems [9]. Inspired by the eyes of certain insects, these systems consist of vision units, each capturing a partial view of the visual field [10]. This design allows for a wide field of view and large area tactile perception while maintaining a compact form factor.
In this paper, we introduce CompdVision, a multi-modal sensor that leverages a compact compound-eye imaging system, combining 3D visual and tactile sensing into a single unit. The sensor’s micro-scale vision units facilitate near-field 3D visual sensing within a 70mm range from the sensor surface, ensuring precise object localization throughout the grasping process. Post-contact, the sensor also provides a detailed contact deformation field, offering a comprehensive sensing solution for complex robotic tasks.
The CompdVision sensor is equipped with a 35 grid of vision units, as shown in Fig. 1. This design strategy not only expands the field of view but also offers the flexibility to assign each vision unit to different modalities. The vision units at the top-left and bottom-left corners constitute the left stereo pair, while the units at the top-right and bottom-right corners form the right stereo pair. Two pairs are dedicated to stereo depth estimation. Equipped with far-focus lenses, they are specialized in seeing through the transparent elastomer and capturing visual data, thereby facilitating robust depth estimation beyond the contact surface. Simultaneously, the remaining nine vision units, centrally located on the grid, are specifically designed to track the displacement of markers on the elastomer for tactile sensing. High-resolution images are derived by stitching together the partial views captured by these tactile units. These units are equipped with near-focus lenses, which minimize noise interference from external scenes, thus enhancing their tactile sensing capabilities. The placement of stereo vision units ensures that depth estimation effectively covers the central area where tactile sensing occurs. This configuration allows for a seamless combination of 3D visual and tactile sensing, enhancing the sensor’s performance in complex robotic tasks.
The contributions of this paper are as follows:
-
•
A compound-eye imaging system combines 3D visual and tactile sensing into a single sensor unit.
-
•
Achievement of near-field 3D visual sensing, facilitated by micro-scale vision units, effective within a 70mm range from the sensor surface.
-
•
A compact sensor that is easily integrated into robotic systems.
The rest of the paper is organized as follows: Section II provides an overview of related work; Section III details the sensor design and fabrication; Section IV presents the sensing principles of both the stereo and tactile units; Section V presents the experimental setup and corresponding results; and Section VI provides a conclusion and future work.
II Related work
II-A Vision-Based Tactile Sensor
In 2009, Johnson et al. [11] employed photometric stereo techniques to capture tactile information. Utilizing a single camera and a tri-color lighting setup, this sensor was able to reconstruct surface deformations with high accuracy and resolution. Building on this, Yuan et al. [5] further refined the sensor by incorporating dot markers to estimate contact forces precisely. The TacTip family of sensors [12] leveraged internal pins to track and record surface deformations, offering another innovative approach to tactile sensing. Lambeta et al. [6] showcased the Digit sensors, which were mounted on a multi-fingered robotic hand and demonstrated capabilities in manipulating glass marbles.
However, a common limitation across these pioneering efforts has been the relatively large form factor of the sensors. To tackle this challenge, the GelSlim sensor [13] was redesigned with an optical path that utilized light guides and mirror reflections to optimize finger thickness and tactile sensing area. To further reduce size while retaining functionality, some researchers have begun to incorporate multiple cameras into their designs. For instance, the OmniTact sensor [14] achieved finger-sized dimensions and captured multi-directional, high-resolution tactile information using an array of micro-cameras. Trueeb et al. [15] introduced another sensor, utilizing a multi-camera setup, featuring a large contact surface and a slim profile. Zhang et al. [10] presented a sensor that employed a novel compound eye imaging system comprised of an array of pinholes on a single complementary metal oxide semiconductor (CMOS) sensor, reducing the thickness to just 5 mm. Chen et al. [16] optimized the sensor by utilizing a microlens array-based vision system, maintaining the same slim profile while capturing clearer images.
II-B Sensor Combining Visual and Tactile Sensing
Recent advancements in robotic manipulation have underscored the importance of combining vision-based tactile sensors with external cameras, inspiring researchers to integrate visual and tactile sensing capabilities into multi-modal sensors. Yamaguchi et al. [17] introduced the FingerVision sensor, featuring a transparent skin marked with dot patterns, and an internal RGB camera. The sensor captures tactile data by tracking dot marker displacements and visual data through the transparent elastomer. Hogan et al. [18] designed a semi-transparent skin sensor capable of functioning as a tactile sensor for high-resolution surface deformation or as a visual sensor, depending on the internal lighting conditions. This sensor was further developed to estimate object proximity [19]. The SpecTac sensor [20] employs UV LEDs and UV fluorescent markers on a transparent elastomer, enabling it to switch between modes for capturing high-quality visual and tactile data. Similarly, the TIRgel sensor [21] adjusts focus to alternate between visual and tactile modalities. Despite these innovations, these sensors are constrained by their use of single cameras, limiting their ability to accurately measure the distance to external objects. To address this, Shimonomura et al. [22] developed a sensor using an infrared camera for tactile sensing and dual cameras for stereo depth estimation. Despite these advancements, the sensor cannot provide contact details due to its rigid surface. Roberge et al. [23] further introduced the StereoTac sensor, incorporating a semi-transparent skin that can switch between tactile and visual sensing modes based on internal lighting conditions. However, the sensor faces limitations regarding image clarity due to the semi-transparent skin and the inability to operate both sensing modes simultaneously. Furthermore, the size of these multi-modal sensors remains challenging for compact integration, necessitating future research to address these concerns. In our work, we aim to address these limitations and enhance the capabilities of multi-modal sensors, particularly focusing on the simultaneous operation of sensing modalities and compact integration.
III Sensor Design and Fabrication
The sensor comprises two subsystems: the touching subsystem and the imaging subsystem. An exploded view of the sensor is depicted in Fig. 2(a), with the prototype and dimensions shown in Fig. 2(b).
The touching subsystem serves a dual purpose: providing the sensor’s structural foundation and enabling its tactile functionality. This subsystem features transparent elastomer layers and embedded dot markers. The transparency of these elastomer layers enables the stereo units of the imaging subsystem to capture external visual data. Meanwhile, the opaque black dot markers allow the tactile units to perceive the movement of these dots, which correlates with the deformation of the sensor surface. The touching subsystem houses the imaging subsystem and protects the entire assembly. The imaging subsystem interprets the visual and tactile data. Its compound-eye design accommodates the distinct requirements of the stereo and tactile units. The imaging subsystem’s design and functionality are crucial to the comprehensive performance of the sensor, contributing significantly to its ability to accurately detect and interpret sensing signals.
The touching subsystem’s fabrication begins by adhering an acrylic plate to the 3D-printed sensor shell using UV glue. Subsequently, Solaris (Smooth-On, Inc.), a transparent soft silicone, is poured into the structure, forming the base elastomer layer. Following the curing of Solaris, the sensing pattern is created by stamping silicon-based ink onto the base elastomer layer using a pillar array. The ink is composed of Psycho Paint, Smooth-On Silc-Pigment 9 black color paste, and silicon thinner mixed in a weight ratio of 4:12:3. A second layer of Solaris elastomer is then poured onto the mold and covered by the previous component, resulting in a protective elastomer layer that shields the dot markers.
| Stereo Units | Left | Right |
|---|---|---|
| Focal Length (pixels) | 443.50 | 387.96 |
| Baseline (pixels) | 2.02 | 2.02 |
| Reprojection Error (pixels) | 0.54 | 0.24 |
The imaging subsystem comprises a CMOS and a vision unit array which is constructed by aligning a microlens array (MLA) with a pinhole array. The pinhole array is fabricated from a 525m-thick silicon wafer, etched to form 100m diameter circular holes at a 10m depth and square holes of dimensions 500467 m at a 515m depth. Fabricated using a lithographic process on a silicon wafer followed by heat treatment and molding [16], the MLA possesses two distinct sizes, specifically designed to meet the unique requirements of the stereo and tactile units. The stereo units demand far-focus lenses for external visual capture, while the tactile units use near-focus lenses for dot marker tracking and noise reduction. The final MLA features a sag height of 120m, with lens diameters of 600m for tactile units and 700m for stereo units. The imaging subsystem is completed by affixing the vision unit array, formed by aligning the MLA with the pinhole array, onto the CMOS sensor.
Finally, the touching subsystem and the imaging subsystem are jointly secured using screws, ensuring the stability and integrity of the assembled sensor.
IV Sensing Principle
This section elaborates on the sensing principles of stereo and tactile units. These units form the core of our data acquisition system, with the stereo units providing 3D vision perception and the tactile units offering sensor surface interactions.
IV-A Stereo Units
Stereo vision is a technique that mimics human vision by extracting 3D information from a scene captured from two different viewpoints. This method leverages the disparity between corresponding points in the two images to calculate the depth of each point in the scene [24].
CompdVision sensor initiates the process by cropping the regions of interest from the raw image according to specified stereo units. Contrary to traditional designs, these units’ vertical alignment necessitates a preprocessing step to transpose the images, thereby producing left and right images compatible with conventional stereo image processing algorithms.
Before undertaking depth estimation, calibration is a crucial preparatory step to ensure precision. This phase is facilitated using a chessboard pattern, depicted in Fig. 3(a), in conjunction with the Stereo Camera Calibrator app in MATLAB [25]. This assists in acquiring crucial parameters such as the intrinsic parameters (including the focal length and optical centers), extrinsic parameters (representing the geometric relationship between the cameras), lens distortion coefficients, and a transformation matrix vital for aligning the two images. The visualization of the calibration results for both stereo units is illustrated in Fig. 3(b) and (c). The specific values for the rectified focal length, baseline, and the reprojection error are detailed in Table I.
The depth estimation process, as illustrated in Fig. 4, commences by extracting the image tiles from the specified stereo units. The tiles are then transposed to align horizontally, followed by distortion correction to rectify any irregularities. The tiles are then converted to grayscale to prepare for the application of the Semi-Global Block Matching (SGBM) algorithm [26][27]. The SGBM algorithm is chosen for its balance of accuracy and computational efficiency. Subsequently, a right disparity map is generated, which is crucial for the application of Weighted Least Squares (WLS) filtering. WLS filtering refines the disparity map, reducing noise and improving image quality. Finally, the refined disparity map is obtained. Any values below the minimum disparity are set to NaN, which helps handle ambiguous regions, such as repetitive or texture-less areas, where block-matching algorithms struggle to identify unique matches. This measure ensures more accurate and reliable depth estimation. Moreover, any values in the marker area of the disparity map are removed, as the depth of markers does not contribute to our study.
IV-B Tactile Units
The tactile sensing process comprises three steps:
IV-B1 Image Stitching
The process begins with identifying Regions of Interest (ROIs) within the initial image, selected for its distinct white background that simplifies blob detection and facilitates accurate determination of the centers of common markers. These centers provide a reference for defining the ROIs. The ROIs are chosen to exclude overlaps between units and to remove black and unutilized regions, as shown in Fig. 5(a), ensuring that each unit’s data is distinct and effectively utilized. After the identification of the ROIs, they are cropped from the initial image. Because of the inversion of the image projected onto the CMOS sensor, each cropped tile is flipped along both the X and Y axes. These adjusted ROIs are then stitched together, producing a high-resolution pre-contact image. When force is applied, a similar process is adopted using the same cropping regions to produce a stitched post-contact image, as depicted in Fig. 5(b). This approach guarantees consistency and accuracy, thereby enabling reliable comparisons between the pre-contact and post-contact states.
IV-B2 Blob Detection
Our sensor utilizes the HSV (Hue, Saturation, Value) color space adjustment technique to enhance the isolation of markers. The HSV color model is proficient in representing an image’s dominant wavelength of light, saturation, and brightness. By fine-tuning the HSV values, we can effectively mitigate specific components that could potentially impede accurate marker detection. Subsequently, the SimpleBlobDetector from OpenCV [27] is employed for the detection process within the masked regions, as shown in Fig. 5(c). This method allows for the accurate identification of markers and the extraction of their centroid coordinates.
IV-B3 Marker Displacement Extraction
After the initial image capture, all markers are precisely detected for tracking. For each frame that follows, the detected blob points are compared and matched with those from the initial image, establishing correspondences based on nearest neighbors. These displacements represent contact deformation, thereby generating a 2D flow. The result of this processing is illustrated in Fig. 5(d). The 2D flow is transformed into a 66 regular grid by interpolating the 2D displacements of the sparse points, a process facilitated by a function from the SciPy package [28]. This step enables the creation of a continuous field from markers, regardless of their sparse distribution or irregular spacing.
V Experiments
In this section, we detail three experiments. The first experiment was dedicated to the training and evaluation of the stereo units in our sensor. The second experiment involved the training and evaluation of contact force measurement, which pertains to the tactile units of our sensor. These two experiments rigorously trained and evaluated the performance of our sensor’s fundamental units. In the third experiment, we tracked the evolution of 3D visual and tactile signals throughout a grasping task, providing an in-depth illustration of the operational combination between our sensor’s stereo and tactile units.
V-A Evaluation of Stereo Depth Estimation
We trained and evaluated the performance of our stereo vision units in depth estimation. We employed a series of performance metrics—fill rate, Z-accuracy, RMSE (Root Mean Square Error), and temporal noise—to evaluate the system’s efficacy [29]. A thorough evaluation of the performance of both the left and right stereo units was carried out.
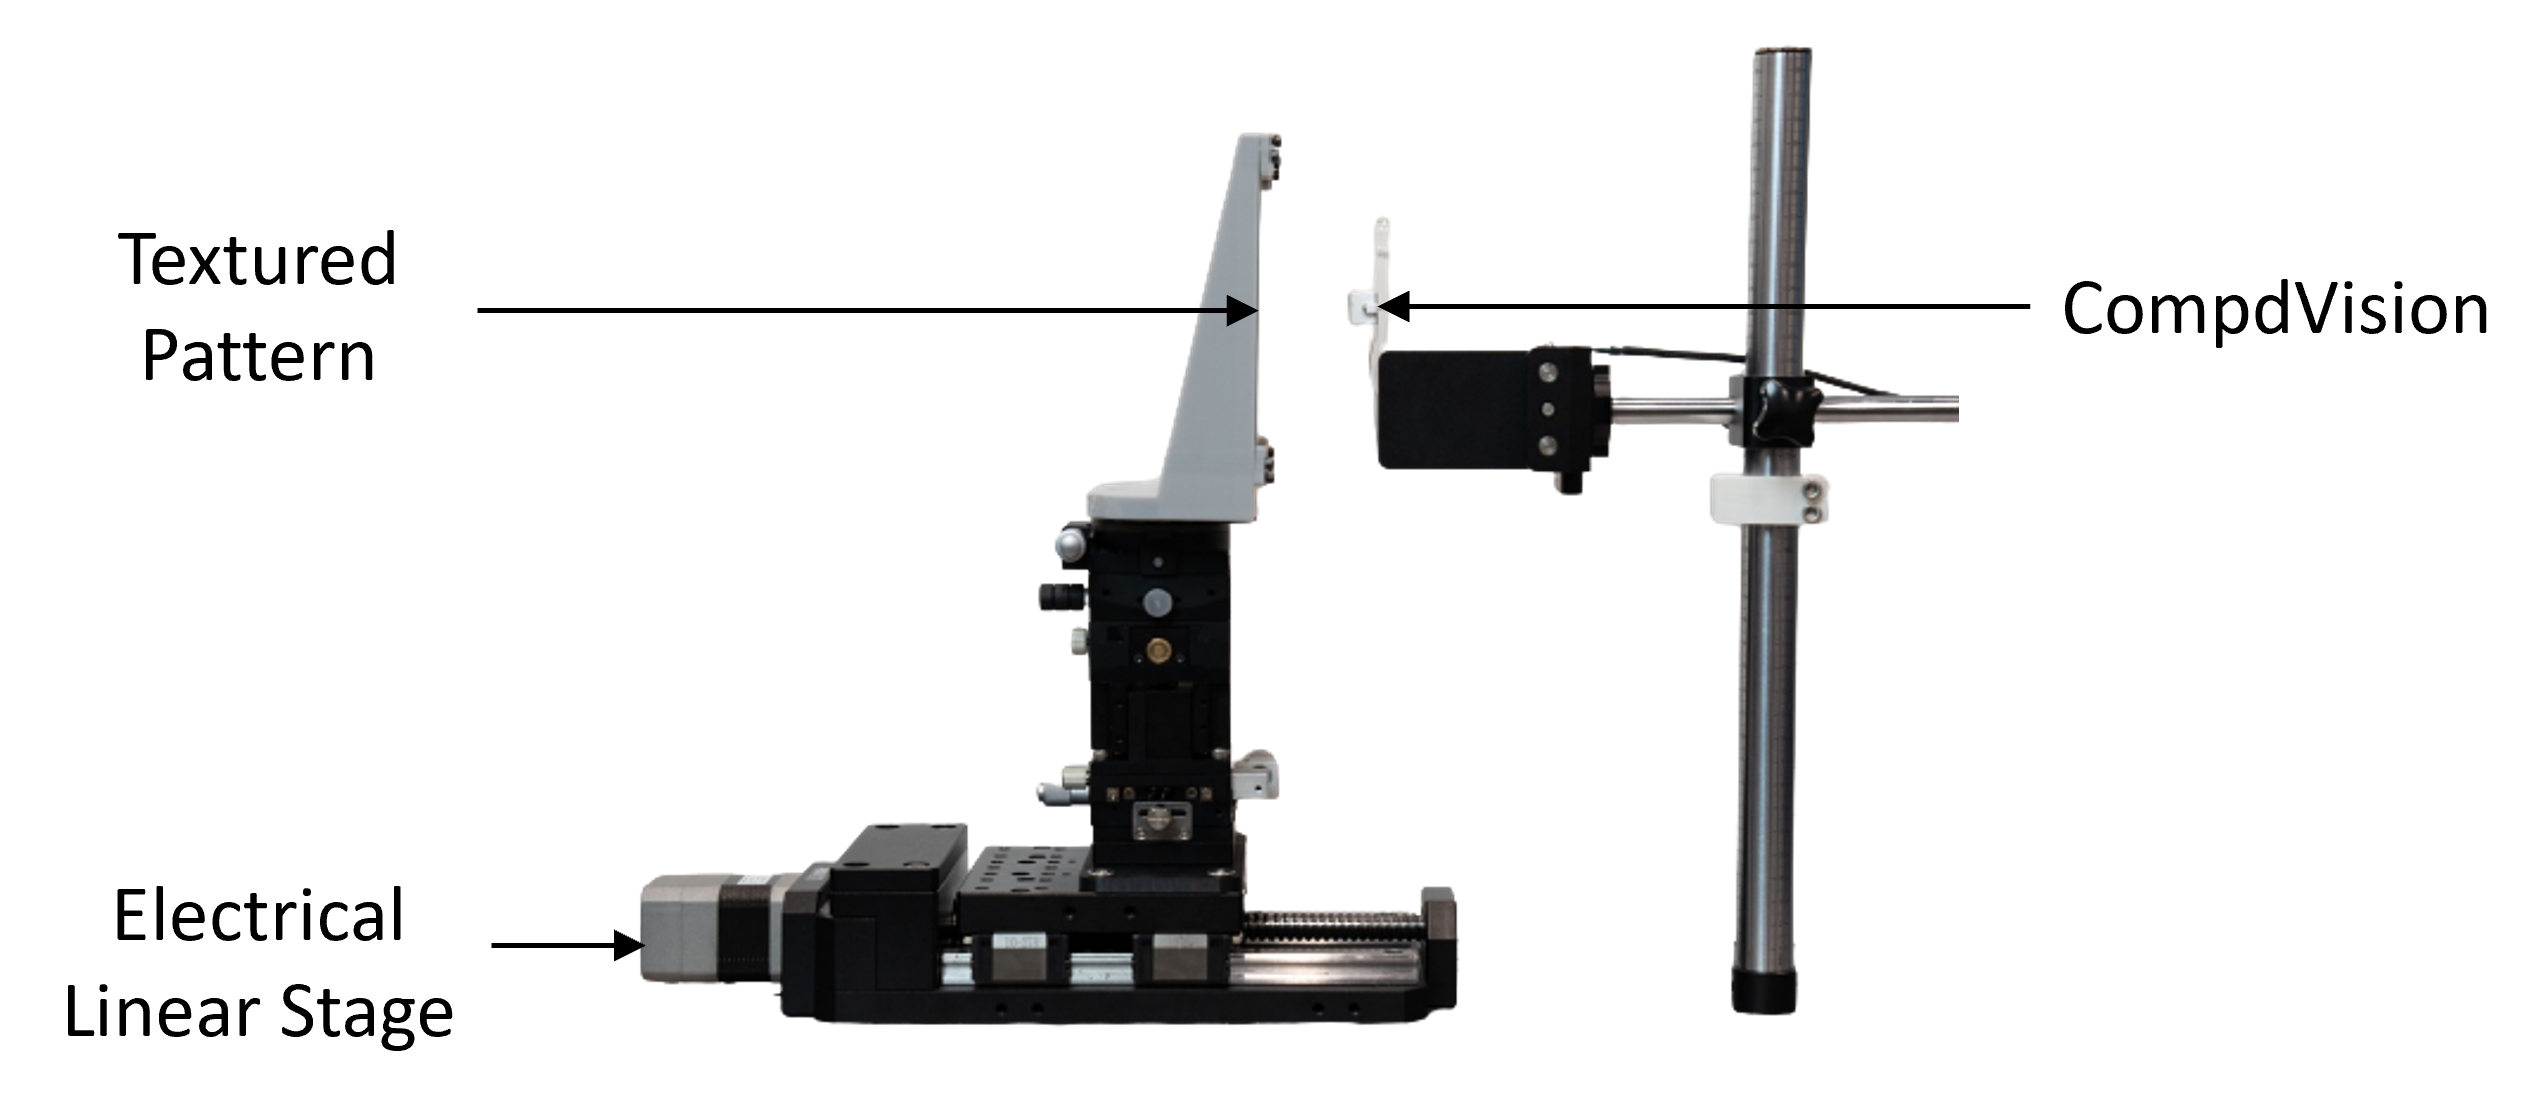
We used a setup featuring a textured target and an electrical linear stage to generate a comprehensive dataset, as illustrated in Fig. 6. The textured target served as the object for depth mapping. The ground truth for depth was established by moving the electrical linear stage, which operated within a 0 to 70 mm range from the sensor surface. For each 1 mm interval within this range, we collected 20 images. The collected dataset was divided into two subsets: 60% for training and 40% for evaluation.
For the training process, we employed the dual annealing algorithm, using the training set to train the model. This global optimization method [30] was well-suited to our complex, multi-modal cost function, which involves multiple parameters for the SGBM algorithm and the WLS filter. The algorithm’s robustness in initializing conditions and its ability to escape local minima make it an excellent choice for high-dimensional optimization problems like ours.
The cost function was designed to optimize for two key factors: RMSE, where a lower value indicates higher depth map quality, and a constraint on the fill rate, which must exceed 90% to ensure a reliable depth map. Mathematically, the cost function is expressed as
| (1) |
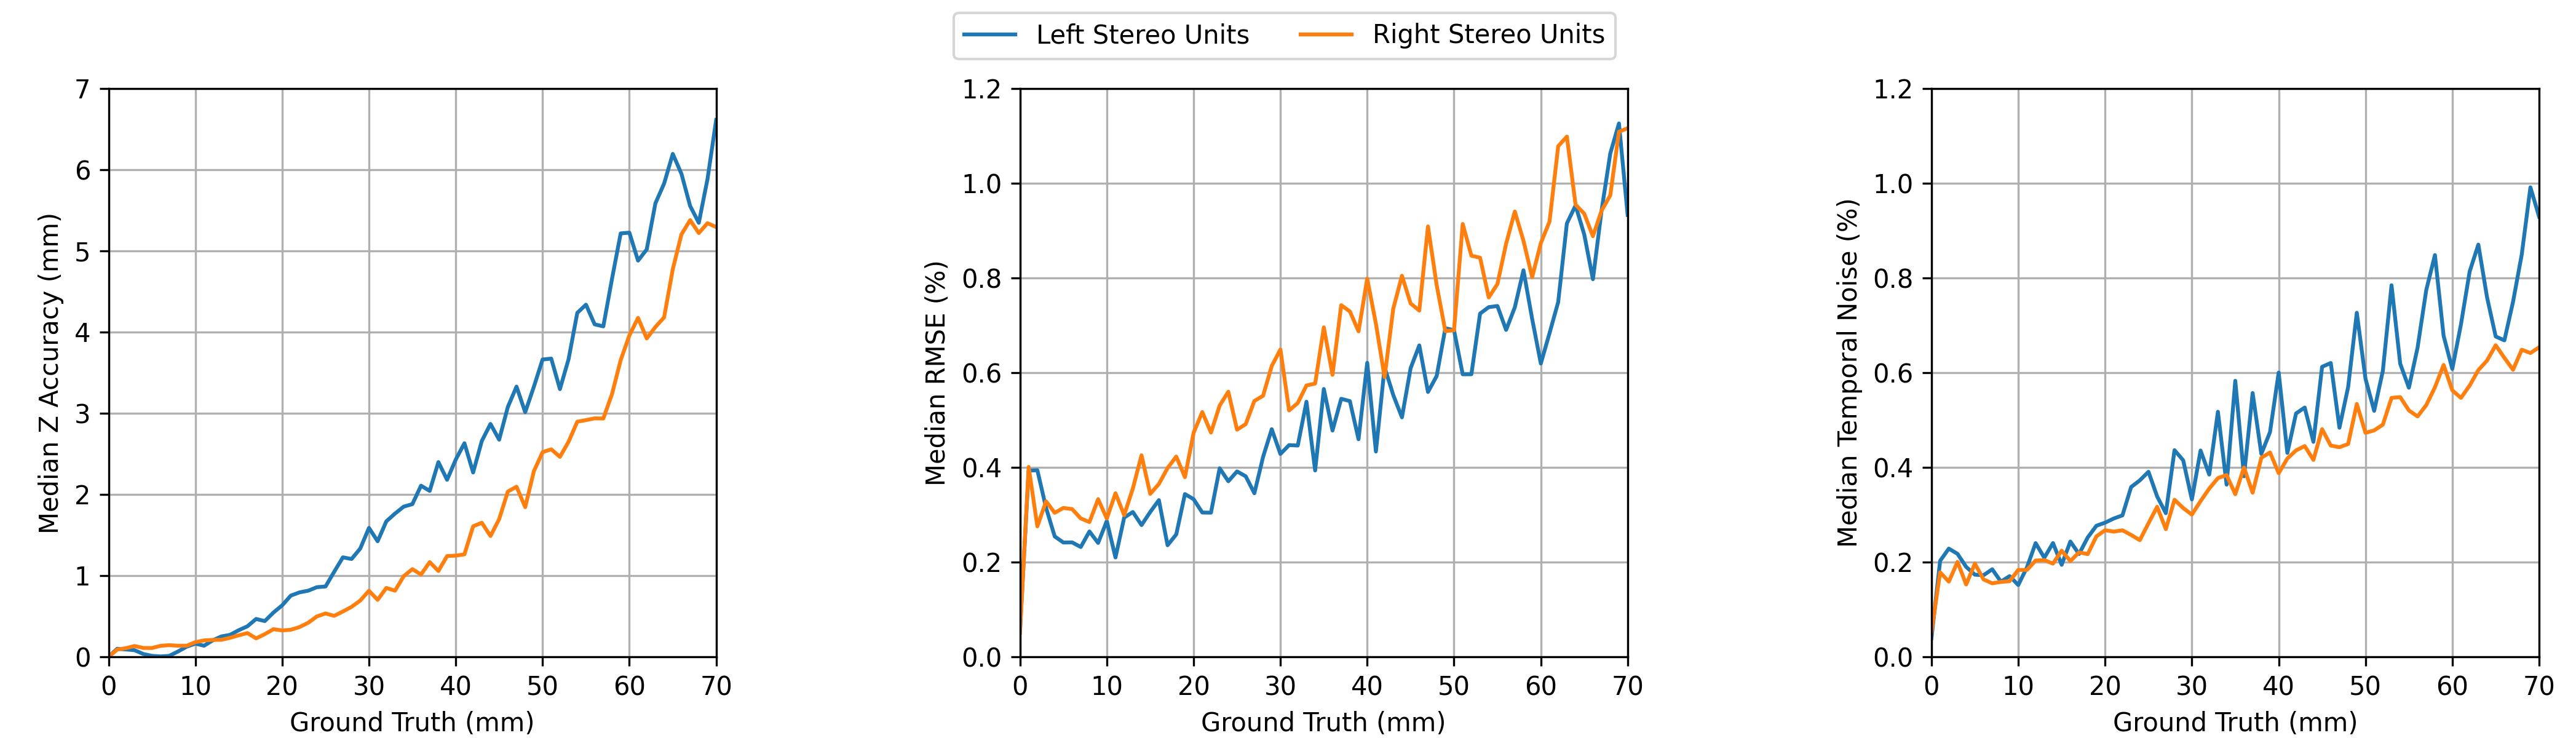
We proceeded to evaluate the system’s performance using the evaluation set, applying the four specific performance metrics for the final evaluation. The corresponding results are depicted in Fig. 7.
V-A1 Fill Rate
The fill rate metric quantifies the percentage of pixels in the depth map for which successful depth calculation was made. This was determined by defining an ROI that excludes the marker area and the boundary regions where disparity calculations are inherently limited due to the lack of corresponding pixels in the adjacent image. The fill rate was then calculated as the ratio of pixels with valid depth values to the total number of pixels within the ROI. It is noteworthy that the median fill rate for both the left and right stereo units attained a value of 100%.
V-A2 Z-Accuracy
The Z-Accuracy metric assesses the accuracy of per-pixel depth estimation relative to the ground truth (GT). In this context, the GT is defined as the sum of the flange focal distance (distance from the image plane to the sensor surface) and the distance from the textured target to the sensor surface. The absolute difference between the GT and the collected depth map from the evaluation set was calculated. This computation was made relative to the best fitted plane to minimize the impact of potential errors in camera positioning, thereby generating a depth error map. Mathematically, the Z-Accuracy is expressed as the median value of these differences:
| (2) |
The evaluation results demonstrated a consistent Z-Accuracy for both left and right stereo units, with higher accuracy observed at closer distances from the textured target.
V-A3 RMSE
The RMSE metric assesses depth spatial noise in relation to the best fitted plane. Lower RMSE values indicate superior performance and heightened accuracy in depth estimation. The evaluation results demonstrated that the median RMSE for both left and right stereo units remained below 1.2% within a 70mm range from the sensor surface, signifying an effective depth estimation performance.
V-A4 Temporal Noise
This metric assesses the consistency of depth measurements over time. It was calculated by taking multiple depth measurements of a static scene and then computing the standard deviation of the depth values at each pixel. Lower temporal noise indicates that the system is stable and reliable in its depth estimations over time.
V-B Evaluation of Force Measurement
We used a learning-based method to train and evaluate the estimation of tangential and normal forces. This was achieved by analyzing the displacement field of the markers on the elastomer, a method that has proven to be robust [5][20].
Fig. 8 illustrates our experimental setup, which incorporates a 3-axis linear stage to control the sensor movement. We affixed a spherical 3D-printed indenter to the ATI Gamma Force and Torque (F/T) sensor. This setup allowed us to accurately record and measure the ground truth force as the sensor was pushed against the indenter with varying force amounts, directions, and locations on the sensor surface. The sensor’s interaction with the indenter was controlled meticulously. We pushed the sensor against the center and four surrounding points on the sensor surface. At each location, we moved down, left, and right with a consistent step size. This procedural variation introduced tangential and normal force, with the tangential force ranging from -1.16N to 1.27N, and the normal force ranging from 0N to 1.92N. We thus created a dataset containing 3500 measurements.
After data collection, we divided the dataset randomly, allocating 70% for training and the remaining 30% for testing. A Convolutional Neural Network (CNN) was utilized to train our data. The structured grid of the displacement field of the markers on the elastomer was inputted to the CNN model, which comprised two convolutional layers, three fully connected layers, and an output layer. Our CNN model was trained to predict the three forces where and represent the tangential forces, and represents the normal force. The results, as shown in Table II, indicate the RMSE for the force measurement on all three axes. The experiments and the results attest to our sensor’s robust capacity for contact force measurement.
| Force | |||
|---|---|---|---|
| RMSE (N) | 0.15 | 0.15 | 0.19 |
V-C Sensing in Grasping Tasks
The grasping task, depicted in Fig. 9(a-d), followed a sequential process. During the entire process, our algorithm ensured the simultaneous capture of 3D visual and tactile signals, as demonstrated in Fig. 9(e). The algorithm was capable of maintaining an online computation frequency of approximately 15 Hz, facilitated by a computer powered by an i9-10900 CPU.
The task began with the gripper’s approach towards the objects (Fig. 9(a)). This phase was dominated by visual signals, serving as the primary feedback for tracking the gripper’s progressive approach. Subsequently, the sensor established tactile contact with the objects (Fig. 9(b)). Here, visual signals receded, and tactile information became predominant, marked by the force exerted by the gripper. This was followed by the object’s elevation (Fig. 9(c)), where the gripper ensured a secure yet cautious hold to lift the object. Finally, the object was released (Fig. 9(d)). This phase was characterized by fading tactile signals and the re-emergence of visual signals, indicating the gripper’s expansion.
These signals offered rich insights into the interactions, recording the experiment comprehensively from start to finish.
VI Conclusion and Future Work
CompdVision represents a significant advancement in robotic sensing, providing a compact solution that combines near-field 3D visual and tactile modalities. The sensor offers the potential to tackle challenges in robotic applications, such as object recognition, navigation, and complex manipulation tasks. Its unique configuration allows for a seamless combination of 3D visual and tactile modalities, setting a new standard for multi-modal sensing in robotics.
Future research will focus on enhancing the sensor’s adaptability and performance in dynamic environments. We aim to use advanced methodologies and algorithms to improve the sensor’s responsiveness, precision, and durability. Additionally, the application of this sensor in robotic manipulation tasks will be explored. The objective is to understand how our sensor can improve the efficiency and autonomy of robotic manipulation, expanding its use beyond current applications.
Acknowledgement
The authors acknowledge the Nanosystem Fabrication Facility (NFF) of the Hong Kong University of Science and Technology and appreciate Mr. Mark Ellwood for proofreading and English editing.
References
- [1] A. Handa, K. Van Wyk, W. Yang, J. Liang, Y.-W. Chao, Q. Wan, S. Birchfield, N. Ratliff, and D. Fox, “Dexpilot: Vision-based teleoperation of dexterous robotic hand-arm system,” in 2020 IEEE International Conference on Robotics and Automation (ICRA). IEEE, 2020, pp. 9164–9170.
- [2] S. Dikhale, K. Patel, D. Dhingra, I. Naramura, A. Hayashi, S. Iba, and N. Jamali, “Visuotactile 6d pose estimation of an in-hand object using vision and tactile sensor data,” IEEE Robotics and Automation Letters, vol. 7, no. 2, pp. 2148–2155, 2022.
- [3] T. Anzai and K. Takahashi, “Deep gated multi-modal learning: In-hand object pose changes estimation using tactile and image data,” in 2020 IEEE/RSJ International Conference on Intelligent Robots and Systems (IROS). IEEE, 2020, pp. 9361–9368.
- [4] A. N. Chaudhury, T. Man, W. Yuan, and C. G. Atkeson, “Using collocated vision and tactile sensors for visual servoing and localization,” IEEE Robotics and Automation Letters, vol. 7, no. 2, pp. 3427–3434, 2022.
- [5] W. Yuan, S. Dong, and E. H. Adelson, “Gelsight: High-resolution robot tactile sensors for estimating geometry and force,” Sensors, vol. 17, no. 12, p. 2762, 2017.
- [6] M. Lambeta, P.-W. Chou, S. Tian, B. Yang, B. Maloon, V. R. Most, D. Stroud, R. Santos, A. Byagowi, G. Kammerer et al., “Digit: A novel design for a low-cost compact high-resolution tactile sensor with application to in-hand manipulation,” IEEE Robotics and Automation Letters, vol. 5, no. 3, pp. 3838–3845, 2020.
- [7] Y. She, S. Wang, S. Dong, N. Sunil, A. Rodriguez, and E. Adelson, “Cable manipulation with a tactile-reactive gripper,” The International Journal of Robotics Research, vol. 40, no. 12-14, pp. 1385–1401, 2021.
- [8] C. Wang, S. Wang, B. Romero, F. Veiga, and E. Adelson, “Swingbot: Learning physical features from in-hand tactile exploration for dynamic swing-up manipulation,” in 2020 IEEE/RSJ International Conference on Intelligent Robots and Systems (IROS). IEEE, 2020, pp. 5633–5640.
- [9] D. Floreano, R. Pericet-Camara, S. Viollet, F. Ruffier, A. Brückner, R. Leitel, W. Buss, M. Menouni, F. Expert, R. Juston et al., “Miniature curved artificial compound eyes,” Proceedings of the National Academy of Sciences, vol. 110, no. 23, pp. 9267–9272, 2013.
- [10] Y. Zhang, X. Chen, M. Y. Wang, and H. Yu, “Multidimensional tactile sensor with a thin compound eye-inspired imaging system,” Soft Robotics, vol. 9, no. 5, pp. 861–870, 2022.
- [11] M. K. Johnson and E. H. Adelson, “Retrographic sensing for the measurement of surface texture and shape,” in 2009 IEEE Conference on Computer Vision and Pattern Recognition. IEEE, 2009, pp. 1070–1077.
- [12] B. Ward-Cherrier, N. Pestell, L. Cramphorn, B. Winstone, M. E. Giannaccini, J. Rossiter, and N. F. Lepora, “The tactip family: Soft optical tactile sensors with 3d-printed biomimetic morphologies,” Soft robotics, vol. 5, no. 2, pp. 216–227, 2018.
- [13] E. Donlon, S. Dong, M. Liu, J. Li, E. Adelson, and A. Rodriguez, “Gelslim: A high-resolution, compact, robust, and calibrated tactile-sensing finger,” in 2018 IEEE/RSJ International Conference on Intelligent Robots and Systems (IROS). IEEE, 2018, pp. 1927–1934.
- [14] A. Padmanabha, F. Ebert, S. Tian, R. Calandra, C. Finn, and S. Levine, “Omnitact: A multi-directional high-resolution touch sensor,” in 2020 IEEE International Conference on Robotics and Automation (ICRA). IEEE, 2020, pp. 618–624.
- [15] C. Trueeb, C. Sferrazza, and R. D’Andrea, “Towards vision-based robotic skins: a data-driven, multi-camera tactile sensor,” in 2020 3rd IEEE International Conference on Soft Robotics (RoboSoft). IEEE, 2020, pp. 333–338.
- [16] X. Chen, G. Zhang, M. Y. Wang, and H. Yu, “A thin format vision-based tactile sensor with a microlens array (mla),” IEEE Sensors Journal, vol. 22, no. 22, pp. 22 069–22 076, 2022.
- [17] A. Yamaguchi and C. G. Atkeson, “Implementing tactile behaviors using fingervision,” in 2017 IEEE-RAS 17th International Conference on Humanoid Robotics (Humanoids). IEEE, 2017, pp. 241–248.
- [18] F. R. Hogan, M. Jenkin, S. Rezaei-Shoshtari, Y. Girdhar, D. Meger, and G. Dudek, “Seeing through your skin: Recognizing objects with a novel visuotactile sensor,” in Proceedings of the IEEE/CVF Winter Conference on Applications of Computer Vision, 2021, pp. 1218–1227.
- [19] F. R. Hogan, J.-F. Tremblay, B. H. Baghi, M. Jenkin, K. Siddiqi, and G. Dudek, “Finger-sts: Combined proximity and tactile sensing for robotic manipulation,” IEEE Robotics and Automation Letters, vol. 7, no. 4, pp. 10 865–10 872, 2022.
- [20] Q. Wang, Y. Du, and M. Y. Wang, “Spectac: A visual-tactile dual-modality sensor using uv illumination,” in 2022 International Conference on Robotics and Automation (ICRA). IEEE, 2022, pp. 10 844–10 850.
- [21] S. Zhang, Y. Sun, J. Shan, Z. Chen, F. Sun, Y. Yang, and B. Fang, “Tirgel: A visuo-tactile sensor with total internal reflection mechanism for external observation and contact detection,” IEEE Robotics and Automation Letters, 2023.
- [22] K. Shimonomura, H. Nakashima, and K. Nozu, “Robotic grasp control with high-resolution combined tactile and proximity sensing,” in 2016 IEEE International Conference on Robotics and automation (ICRA). IEEE, 2016, pp. 138–143.
- [23] E. Roberge, G. Fornes, and J.-P. Roberge, “Stereotac: a novel visuotactile sensor that combines tactile sensing with 3d vision,” arXiv preprint arXiv:2303.06542, 2023.
- [24] G.-S. Hong and B.-G. Kim, “A local stereo matching algorithm based on weighted guided image filtering for improving the generation of depth range images,” Displays, vol. 49, pp. 80–87, 2017.
- [25] “Matlab,” accessed: 2023-Oct-27. [Online]. Available: https://www.mathworks.com/products/matlab.html
- [26] H. Hirschmuller, “Accurate and efficient stereo processing by semi-global matching and mutual information,” in 2005 IEEE Computer Society Conference on Computer Vision and Pattern Recognition (CVPR’05), vol. 2. IEEE, 2005, pp. 807–814.
- [27] “Opencv - open computer vision library,” accessed: 2023-Oct-27. [Online]. Available: https://opencv.org/
- [28] “Scipy,” accessed: 2023-Oct-27. [Online]. Available: https://scipy.org/
- [29] “Intel® realsensetm developer documentation,” accessed: 2023-Oct-27. [Online]. Available: https://dev.intelrealsense.com/docs
- [30] C. Tsallis and D. A. Stariolo, “Generalized simulated annealing,” Physica A: Statistical Mechanics and its Applications, vol. 233, no. 1-2, pp. 395–406, 1996.