Fast as Potoroo: Radio Continuum Detection of a Bow-Shock Pulsar Wind Nebula Powered by Pulsar J16384713
Abstract
We report the discovery of a bow-shock pulsar wind nebula (PWN), named Potoroo, and the detection of a young pulsar J16384713 that powers the nebula. We present a radio continuum study of the PWN based on 20-cm observations obtained from the Australian Square Kilometre Array Pathfinder (ASKAP) and MeerKAT. PSR J16384713 was identified using Parkes radio telescope observations at frequencies above 3 GHz. The pulsar has the second-highest dispersion measure of all known radio pulsars (1553 pc cm-3), a spin period of 65.74 ms and a spin-down luminosity of erg s-1. The PWN has a cometary morphology and one of the greatest projected lengths among all the observed pulsar radio tails, measuring over 21 pc for an assumed distance of 10 kpc. The remarkably long tail and atypically steep radio spectral index are attributed to the interplay of a supernova reverse shock and the PWN. The originating supernova remnant is not known so far. We estimated the pulsar kick velocity to be in the range of for ages between 23 and 10 kyr. The X-ray counterpart found in Chandra data, CXOU J163802.6471358, shows the same tail morphology as the radio source but is shorter by a factor of 10. The peak of the X-ray emission is offset from the peak of the radio total intensity (Stokes ) emission by approximately 4.7′′, but coincides well with circularly polarised (Stokes ) emission. No infrared counterpart was found.
keywords:
ISM: individual (Potoroo) - pulsars: individual (PSR J16384713) - radio continuum: ISM - X-rays: individual (CXOU J163802.6471358) - stars: winds, outflows - radiation mechanism: non-thermal- ACIS-I
- Advanced CCD Imaging Spectrometer using the wide field chip
- ASKAP
- Australian Square Kilometre Array Pathfinder
- ARC
- Australian Research Council
- ATNF
- Australia Telescope National Facility
- CALDB
- Chandra Calibration Database
- CARTA
- Cube Analysis and Rendering Tool for Astronomy
- CASDA
- CSIRO Australian Square Kilometre Array Pathfinder (ASKAP) Science Data Archive
- CIAO
- Chandra Interactive Analysis of Observations software
- CDA
- Chandra Data Archive
- DSPSR
- Digital Signal Processing Software for Pulsar Astronomy
- DM
- dispersion measure
- EMU
- Evolutionary Map of the Universe
- FoV
- field of view
- H.E.S.S.
- High Energy Spectroscopic System
- IR
- infrared
- ISM
- interstellar medium
- MGPS
- MeerKAT Galactic Plane Survey
- MGPS-2
- Molonglo Galactic Plane Survey epoch-2
- NASA
- National Aeronautics and Space Administration
- NS
- neutron star
- ObsID
- observation identification
- PA
- position angle
- PAF
- phased array feed
- PRESTO
- Pulsar Exploration and Search Toolkit
- PWN
- pulsar wind nebula
- RFI
- radio-frequency interference
- rms
- root-mean-square
- SB
- Scheduling block
- SN
- supernova
- SNR
- supernova remnant
- UWL
- Ultra-Wideband Low
- WISE
- Wide-Field Infrared Survey Explorer
CSIRO Space and Astronomy, Australia Telescope National Facility, PO Box 76, Epping, NSW 1710, Australia \alsoaffiliationAstronomical Observatory, Volgina 7, 11060 Belgrade, Serbia S. Lazarević]s.lazarevic@westernsydney.edu.au \alsoaffiliationSouth African Radio Astronomy Observatory, 2 Fir Street, Black River Park, Observatory, Cape Town 7925, South Africa \alsoaffiliationWestern Sydney University, Locked Bag 1797, Penrith South DC, NSW 2751, Australia
1 Introduction
The death of a massive star via a core-collapse supernova (SN) explosion is a dramatic event that leaves behind a supernova remnant (SNR) and, in some instances, a rapidly rotating neutron star (NS) known as a pulsar. A large fraction of the pulsar rotational energy is carried away by a constant wind of ultra-relativistic particles. When the pulsar wind interacts with the ambient medium it abruptly slows down at the termination shock, beyond which the shocked wind material inflates a bubble referred to as a pulsar wind nebula (PWN) (for reviews, see Gaensler & Slane, 2006; Reynolds et al., 2017). Within the PWN, the ultra-relativistic particles travel through the magnetic field and generate non-thermal emission that can be observed across a wide range of frequencies, from radio to -rays (Filipović & Tothill, 2021).
PWNe produce strong radio emission through the synchrotron process. This radiation has a flat spectrum and is often highly linearly polarised due to the ordered magnetic field configuration of the PWN (see Kothes, 2017). The synchrotron spectrum can extend to the X-ray band where it typically becomes steeper than in the radio because of the synchrotron cooling effect (see Kargaltsev & Pavlov, 2008). The X-ray luminosity is generated by young and high-energy electrons, mainly depending on the current energy input from the pulsar. The radio luminosity, however, is created from the older electrons, reflecting the integrated history of PWNe. Gamma-ray emission in the GeV and TeV ranges has also been detected from PWNe (H. E. S. S. Collaboration et al., 2018), attributed to inverse-Compton scattering. In addition to non-thermal radiation, PWNe produce optical H emission when they ionise the neutral ambient medium (Bucciantini & Bandiera, 2001; Bucciantini, 2002).
Studying PWNe provides valuable insights into pulsars, the power sources of nebulae, radiative efficiency, properties of the surrounding medium, and the physics of the wind-medium interaction. It also contributes to understanding the distribution of the natal kick velocities that NSs acquire during the SN implosions.
The general appearance of the PWNe depends on a balance between a pulsar spin-down energy loss rate and the pressure of the ambient medium. For the pulsars that are propelled through the ambient medium at supersonic velocities, the resulting ram pressure transforms the PWN into a bow-shock. This process confines the pulsar wind in the opposite direction to that of the pulsar motion, forming a cometary-like shaped tail (Kargaltsev et al., 2017).
The evolution of PWNe can be divided into several phases which determine the overall observational properties of these objects (Blondin et al., 2001; van der Swaluw et al., 2004). Initially, a pulsar is located near the centre of the freely expanding SNR and is typically born with a kick velocity significantly higher than the sound speed. Thus, the PWN expands and the pulsar drives a shock supersonically into the cool ejecta. In the next phase, the SNR shockwave sends a reverse shock back into the interior (Truelove & McKee, 1999). The interaction between the inward moving shock and the PWN is complex and causes the PWN to oscillate and reverberate, possibly leading the pulsar to leave its own PWN. The SNR reverse shock compresses the PWN by a large factor accompanied by a sudden increase in the magnetic field, which serves to burn off the highest energy electrons (Kennel & Coroniti, 1984; Bucciantini et al., 2003; Reynolds, 2009). The pulsar continues to travel toward the edge of the SNR, through hot ejecta now, and will eventually break out of its parent SNR bubble, driving a shock into the interstellar medium (ISM).
Before the launch of the Chandra X-ray Observatory (Weisskopf et al., 2000) only a handful of PWNe had been detected, mainly because of the low angular resolution of available instruments. With improved capabilities, around 30 pulsars showing indications of supersonic motion have been identified. With the exception of the Small Magellanic Cloud DEM S5 PWN (Alsaberi et al., 2019), all of PWNe with a bow-shock reside in our galaxy and exhibit a large variety of morphologies (e.g., Pavan et al., 2014b; Ng et al., 2012; Kothes et al., 2020).
In this paper, we report our radio continuum discovery of a bow-shock PWN (hereafter referred to as Potoroo111Potoroo is a small marsupial native to Australia. The species is considered a living fossil due to its minimal changes over the past 10 million years.) and the detection of a pulsar J16384713 that powers the PWN. The source field has been covered during the Chandra survey of the Norma Galactic spiral arm region (Fornasini et al., 2014), and we found an X-ray counterpart with galactic coordinates and , catalogued as CXOU J163802.6471358 (Jakobsen et al., 2014).
The X-ray emission of CXOU J163802.6471358 is characterised by a cometary shape, with a point source and an elongated tail extending approximately 40′′ (Jakobsen et al., 2014). A diffuse, jet-like feature was detected perpendicular to the cometary tail that spans 19.5′′ (see their Figure 1), but its significance is close to the detection limit.
To estimate the distance to CXOU J163802.6471358, Jakobsen et al. (2014) measured the hydrogen column density (N1023cm-2) using joint Chandra and XMM-Newton (Jansen et al., 2001) observations. Comparison to another source in the same area, PWN HESS J1640465 (Lemiere et al., 2009), with a slightly lower column density and distance of 10 kpc, led the authors to adopt the same distance to the Potoroo X-ray counterpart as a lower limit. They also reported the photon index of the X-ray source as =1.1.
Jakobsen et al. (2014) found no flux variation between the Chandra and XMM-Newton observations, conducted five years apart. They calculated the luminosity of the entire source to be approximately erg s-1, with the source distance kpc. Although a pulsar search was attempted, the high background noise and poor statistics prevented the pulsation detection.
The Molonglo Galactic Plane Survey epoch-2 (MGPS-2) radio observations (Murphy et al., 2007) revealed the counterpart to the X-ray source, showing an extended tail that is aligned with the X-ray emission. Jakobsen et al. (2014) reported an offset between the X-ray and radio peaks of about 40′′, and no infrared counterpart.
Although Jakobsen et al. (2014) discussed other potential source types, they suggested that the detected X-ray point source was most likely a previously unknown pulsar and the extended emission was a bow-shock tail created by ram pressure.
Our study takes advantage of large-scale radio continuum surveys obtained by new-generation telescopes such as ASKAP and MeerKAT. These advanced instruments significantly enhance our ability to detect and investigate low surface brightness objects with detail greater than ever before. We also used the new Parkes Ultra-Wideband Low (UWL) frequency receiver system (Hobbs et al., 2020) to search for radio pulsations. The wide frequency coverage, especially up to 4 GHz, enables us to avoid scattering and smearing due to Potoroo’s large distance.
We organised the paper as follows: Section 2 details the instruments and data used in our study; Section 3 presents our observational results which are divided into five subsections: Potoroo morphology (Subsection 3.1), radio spectrum (Subsection 3.2), polarisation analysis (Subsection 3.3), pulsar detection along with its properties (Subsection 3.4) and the origin of Potoroo (Subsection 3.5); in Section 4, we discuss the results; and finally, in Section 5, we present our concluding remarks. Throughout the paper, we use J2000 coordinates.
2 Observations and Data Processing
Potoroo was detected in radio-continuum surveys obtained from ASKAP (Figure 1) and MeerKAT, as well as in the X-ray data from the Chandra Observatory. High time-resolution, pulsar search-mode observations were carried out using the Parkes UWL receiver system. A summary of observations is given in Table 1. The source field has also been covered by the infrared survey from the Wide-Field Infrared Survey Explorer (WISE). We make use of this survey to better understand the surrounding ISM and probe the origin of Potoroo.
| Telescope | Date | Frequency [MHz] | Band [MHz] | Resolution [′′′′] |
| ASKAP | 2021 Sep 11 | 944 | 800 1088 | 16.3 13.3 |
| ASKAP | 2022 Mar 5 | 1368 | 1224 1512 | 8.8 7.4 |
| MeerKAT | 2018 Aug 26 | 1284 | 900 1670 | 8 8 |
| Parkes | 2019 Sep 10 | 3000 | 704 4032 | 468 468 |
| Parkes | 2022 Jul 12 | 3000 | 704 4032 | 468 468 |
| Parkes | 2022 Oct 12 | 3000 | 704 4032 | 468 468 |
| Chandra | 2011 Jun 13 | 2 8111Chandra energy band is in units of keV. | 2.4 2.4 |
2.1 The Australian Square Kilometre Array Pathfinder
ASKAP (Johnston et al., 2008; McConnell et al., 2016; Hotan et al., 2021) observed Potoroo at two central frequencies: 944 MHz and 1368 MHz, both with the full instantaneous bandwidth of 288 MHz in continuum mode divided into 1 MHz wide frequency channels (288 channels across the whole band). Scheduling block (SB) identifications are 32043 and 37909, respectively. SB 32043 was obtained on 11 September 2021, as part of a pilot program for the Evolutionary Map of the Universe (EMU) survey (Norris et al., 2019, 2021), using 34 out of 36 available ASKAP antennas. The second block SB 37909 was obtained on 5 March 2022, as a technical test designed to demonstrate the capability of the telescope (Hotan et al., 2020). During that observation, 35 antennas were operating. SB 37909 has full polarisation data, while for SB 32043, only Stokes and maps are available.
Each ASKAP antenna is 12 m in diameter and is equipped with a phased array feed (PAF) beam (Schinckel et al., 2012) mounted at the primary focus, yielding about 30 deg2 field of view (FoV). The 36 beams formed from the PAF elements had a hexagonal arrangement, known as “closepack36”, with a footprint rotation of 45∘. The pitch angle, the spacing between beams, was set to 0.90∘ providing an approximately uniform sensitivity over the FoV without interleaving (Norris et al., 2021).
The final 944 MHz mosaic image has a synthesised beam of 16.3′′13.3′′ at a position angle (PA) of 84.5∘ with a local root-mean-square (rms) noise level of 131 Jy beam-1. The 1368 MHz mosaic image has a beam of 8.8′′7.4′′ at a PA of 84.5∘ with rms noise 68 Jy beam-1. Both observations were performed with 10 hours of exposure time. Data calibration and imaging were carried out using the ASKAPsoft data processing pipeline (Guzman et al., 2019), running at the Pawsey Supercomputing Research Centre.
2.2 MeerKAT
The MeerKAT array telescope is part of South Africa’s radio observatory (Jonas, 2009; Jonas & MeerKAT Team, 2016). The array consists of 64 antennas, each having a 13.5 m diameter.
We used data taken on 26 August 2018 at a central frequency of 1284 MHz and bandwidth of 770 MHz (L-band receiver). The observation is part of the MeerKAT Galactic Plane Survey (MGPS) that surveys the entire southern Galactic Plane within the latitude range 1.5∘(Goedhart et al., 2023, in prep.) Observations were made in a hexagonal pattern with an offset between centres of 29.6′ for relatively uniform sensitivity. Each 810 hour session observed 7 or 8 pointings, cycling among them for improved coverage giving roughly one hour on source for each pointing. Sixty-one antennas were used for the observations contributing to the mosaic used in this work.
Calibration and imaging of the pointing centres were as described in Mauch et al. (2020). A linear mosaic of the pointing images was made as described in Brunthaler et al. (2021). The resulting mosaic image has a synthesised beam of 8′′8′′ and the rms noise is 56 Jy beam-1. We utilized only a total-intensity image throughout the paper.
2.3 Parkes Observatory
Parkes radio telescope, also known as Murriyang, is a 64-m paraboloid single-dish antenna. On 10 September 2019, as part of project P1019 (van Jaarsveld et al., 2019), Potoroo was observed using the UWL receiver in conjunction with the Medusa backend in the pulsar search mode. The data were recorded with 2-bit sampling every 64 s in each of the 0.125 MHz wide frequency channels, resulting in a total of 26,624 channels covering from 704 to 4032 MHz. The observations were carried out for a total integration time of 4 hours and only the total intensity was recorded. We performed a periodicity search using the pulsar software package PRESTO222https://github.com/scottransom/presto (Ransom, 2001) for every 512 MHz of bandwidth and for a dispersion measure (DM) range from 0 to 2000 pc cm-3. At frequencies above 3 GHz, we identified a pulsar candidate.
Follow-up observations were conducted on 12 July and 12 October 2022, using the coherently de-dispersed search mode. In this mode, data were recorded with 2-bit sampling every 64 s in each of the 1 MHz wide frequency channels (3328 channels across the entire band with Medusa). We recorded full Stokes information for both follow-up observations. To calibrate these observations, we observed a pulsed noise signal injected into the signal path before the first-stage low-noise amplifiers before each observation.
The pulsar candidate, PSR J16384713, was detected and confirmed in both observations with high significance. We determined the apparent spin period and DM for each observing epoch and folded the data using the DSPSR (van Straten & Bailes, 2011) software package with a sub-integration length of 30 s. Data affected by narrow-band and impulsive radio-frequency interference (RFI) were manually excised using the PSRCHIVE (Hotan et al., 2004) software package. Polarisation and absolute flux calibrations of these search mode observations were carried out following steps described in Dai et al. (2019). Each observation was then averaged in time to create sub-integrations with a length of a few tens of minutes, and the pulse time of arrivals was measured for each integration using PSRCHIVE. The spin period of PSR J16384713 at each observing epoch was then measured using the Tempo2 software package (Hobbs et al., 2006).
2.4 Chandra X-Ray Observatory
The extended X-ray source of Potoroo was serendipitously discovered during the Chandra survey of the Norma region of the Galactic spiral arms. The source was observed on 13 June 2011 with two exposures, 19.31 ks and 19.01 ks, with observation identifications 12519 and 12520, respectively. The data were taken with the Advanced CCD Imaging Spectrometer using the wide field chip (ACIS-I) operating in Very Faint (VFAINT) timed exposure mode. The ACIS-I covers a 16.9′16.9′ FoV and has the on-axis spatial resolution less than 0.5′′, which increases off-axis. Both observations had Potoroo positioned off-axis, less so in the ObsID 12519, with Potoroo located 3.8′ away from the optical axis, compared to 8.4′ for the ObsID 12520.
The energy scale of the CCD chip is calibrated over the range of approximately keV. The ACIS-I has front-side-illuminated CCDs where the instrumental background dominates the spectrum for energies below 0.5 keV and above keV (Baganoff et al., 2003). The time resolution of the CCD chip, determined by the readout time, was 3.2 s.
We downloaded the observations from the Chandra Data Archive (CDA) and reduced the data using the Chandra Interactive Analysis of Observations software (CIAO)333https://cxc.cfa.harvard.edu/ciao version 4.15 (Fruscione et al., 2006) with the most recently available Chandra Calibration Database (CALDB) version 4.10.2. The standard chandra_repro tool was performed to reprocess both sets of observations and mdcopy to filter the event files from background noise. Since Potoroo has an extended structure, reducing the background noise makes fine structures more prominent. To increase the signal-to-noise ratio, utilizing the merge_obs tool, the observations were reprojected and combined to create a merged event file and exposure-corrected images. For the object’s offset from the optical axis, we calculated the resolution of the merged image to be 2.4′′2.4′′ using the default psfmerge setting, based on the 90% point-spread function. Since no source events below 2 keV were detected, the final image covers the energy range of keV.
We present the archival Chandra data only for the purpose of comparing the X-ray imaging results to the new radio observations of Potoroo. The exposure-corrected and merged image is additionally smoothed with a two-dimensional Gaussian kernel and variance of = 2.5′′ to reduce the effect of statistical fluctuation (Figure 2).
2.5 Wide-Field Infrared Survey Explorer
The WISE satellite (Wright et al., 2010) performed all-sky mid-infrared surveys in four photometric bands centered on 3.4 m, 4.6 m, 12 m and 22 m with an angular resolution of 6.1′′, 6.4′′, 6.5′′ and 12.0′′, respectively. The higher two bands are sensitive to stars, while 12 m and 22 m maps contain a wealth of gas and dust information. With high sensitivity, the satellite was able to detect over 8000 HII regions in the Galactic plane.
We used the WISE emission maps at 12 m and 22 m and the HII regions catalogue (Anderson et al., 2014) to search for the Potoroo parent SNR. Synchrotron non-thermal emission, such as from shell SNRs, should not correlate with the mid-infrared thermal emission, which makes a powerful tool for distinguishing SNRs from HII regions. However, in complex parts of the ISM, such as the Potoroo’s surrounding environment, other emissions may be present in the line of sight that could lead to the misclassification of objects.
3 Results of Potoroo Study
Combining ASKAP radio-continuum data with the infrared maps from the WISE survey (Figure 1) and Chandra X-ray image (Figure 2), we can confidently classify Potoroo as a bow-shock PWN positioned within the plane of our galaxy.
The distance to Potoroo was previously estimated by Jakobsen et al. (2014) based on foreground HI absorption, suggesting a lower bound of 10 kpc. This places Potoroo in the Norma spiral arm on the far side of the Galaxy (Norma II region). We also consider another potential distance of 7.6 kpc, calculated from the Potoroo pulsar’s DM, as discussed in Section 4.1.
Jakobsen et al. (2014) reported the X-ray source position coordinates as RA(J2000) = 16h38m02.7s, Dec(J2000) = 47∘13′58.4′′, peaking at an energy maximum of 5 keV. The radio position of Potoroo, estimated at the peak of radio brightness, has coordinates: RA(J2000) = 16h38m02.6s and Dec(J2000) = 47∘13′53.8′′. We measured the flux densities for the entire object using the techniques described in Filipović et al. (2022). After convolving images to the same resolution as the lowest-resolution image, we determined total radio flux densities for the carefully selected 3-source region, accounting for the local background. These measurements, with a flux density measurement scale error of approximately 10% of the overall flux density, are listed in Table 2.
[MHz ] [mJy beam-1 ] [mJy ] 444Integrated values are measured for the selected regions that match the 3 source significance where = 68 Jy beam-1. The polygonal contours are created with a polygon and the values are calculated with the statistics package from Cube Analysis and Rendering Tool for Astronomy (CARTA) (Comrie et al., 2021). [mJy ] 4 [%] [%] 944 15.58 389 40 1284 10.91 293 30 1368 9.51 238 25 5.90 0.33 6.84 0.45 24
The positional difference between the X-ray and radio peaks is 4.7′′, as shown at the bottom right panel of Figure 2 and Figure 3. Given the uncertainty for the Chandra position of 0.36′′ (Fornasini et al., 2014) and the astrometric precision for ASKAP of about 0.6′′ (Gürkan et al., 2022) for both RA and Dec, the offset must be real. Such an offset has already been seen in other bow-shock PWNe like the Lighthouse nebula (Pavan et al., 2014a) and G319.90.7 (Ng et al., 2010).
Investigating the 944 MHz ASKAP circular polarisation (Stokes ) image of Potoroo, we observe a similar positional difference between the Stokes peak and the peak of the total intensity image (Stokes ). Additionally, the Stokes peak aligns well with the peak of the X-ray source. Both comparisons are shown in Figure 2, right and Figure 3. The circularly polarised emission is detected with a significance greater than 5, with a local rms noise of about 24 Jy beam-1. The fractional circular polarisation, expressed as the V/I ratio, is slightly higher than 1 . Despite the weak circular polarisation, it cannot be attributed to leakage from Stokes , as the peak of the circularly polarised emission is offset from the total intensity peak. Moreover, the leakage across the entire ASKAP FoV is typically around 0.7 .
The circularly polarised emission is almost unique to stellar objects (Dai et al., 2015; Lenc et al., 2018), although it is not universal among them (Gould & Lyne, 1998). However, circularly polarised sources that lack clear optical or infrared association are strong pulsar candidates. Motivated by this, together with the far distance and potentially high dispersion of Potoroo’s pulsar, we reprocessed the archival Parkes data, focusing on the high-frequency band, rather than the L-band typically used for pulsar detection. We identified and confirmed a periodic signal from the pulsar at a DM of 1553 pc cm-3 with a spin period of 65.74 ms. For more details on the PSR J16384713 detection and its properties, see Sections 3.4 and 4.4.
3.1 Potoroo Morphology
The morphology of PWNe is mainly determined by the properties of the ambient medium and the characteristics of the pulsar that powers the PWN. The striking cometary structure of Potoroo is the typical shape of a PWN whose pulsar is moving supersonically through the ambient medium. In this case, the ram pressure exerted by the oncoming medium confines and channels the pulsar wind in the opposite direction to the pulsar motion, as shown in Figure 2, left.
Visual inspection of the radio total intensity images reveals an extended morphological structure of Potoroo, characterized by two distinct components: a compact and bright head followed by a highly elongated tail. The X-ray source has a similar structure but on a different length scale. In addition to the mismatch of the radio and X-ray intensity peaks, Figure 3 shows that the radio emission extends beyond the X-ray emission. This extension is attributed to the synchrotron ageing effect of relativistic electrons, where low-energy electrons lose energy at a slower rate, resulting in longer lifetimes that allow them to travel farther from the pulsar.
Potoroo is roughly conical in shape. The radio source extends approximately 7.2′ along the PA of 0∘, equivalent to a physical size of 21 pc considering the distance of 10 kpc. After a dip in intensity behind the head, the brightness increases, peaking at a distance of about 0.8′. Following this peak, it rapidly dims and remains relatively unchanged. The bright structure (hereafter the main body) covers the first 1.9′ of the object. The tail has a hazy termination due to the complexity of the surrounding medium. Our estimation of the source end is based on the morphological appearance and loss of the tail shape (Figure 2). Additionally, this estimation aligns with a significant increment in the slope of the brightness profile influenced by ambient emission (Figure 3). However, we could not exclude that the source is longer than that. In contrast, the X-ray tail brightness fades to background levels at approximately 0.67′ (2 pc for the distance of 10 kpc) from the pulsar.
The radio shape of the source is narrow overall, ranging from 18′′ 24′′, until it abruptly widens by a factor of 3 at a distance of about 4.4′. The rapid change in tail width is likely due to an ambient density discontinuity. As the ambient density increases along a pulsar path, the ram pressure also increases, causing the PWN to adopt a thinner shape (Yoon & Heinz, 2017). However, if the ambient density remains unchanged over a sufficient distance, the tail flattens again, as observed in other parts of Potoroo.
The Chandra observation of Potoroo has also detected a diffuse feature perpendicular to the PWN axis, extending approximately 19′′ (see Figure 2, right). However, interpreting this feature is challenging due to limited statistical data. Likewise, the radio emission data do not reveal any visible counterpart, similar to other objects with more prominent X-ray misaligned outflows, such as the Lighthouse (Pavan et al., 2014a; Klingler et al., 2022) or Guitar nebula (Hui & Becker, 2007; de Vries et al., 2022).
3.2 Radio Continuum Spectrum of Potoroo
PWNe emit synchrotron radiation detectable across the electromagnetic spectrum, from radio to beyond the X-ray frequencies. In the radio band, the synchrotron emission is characterised by a power law distribution of flux density, expressed as S. PWNe typically have flat spectra with a spectral index in the range of 0.3 0 (Weiler & Sramek, 1988; Kothes, 2017). In rare cases, PWNe spectra can be steeper, with the index as low as 0.7, as observed, for instance, in Dragonfly ( Jin et al., 2023).
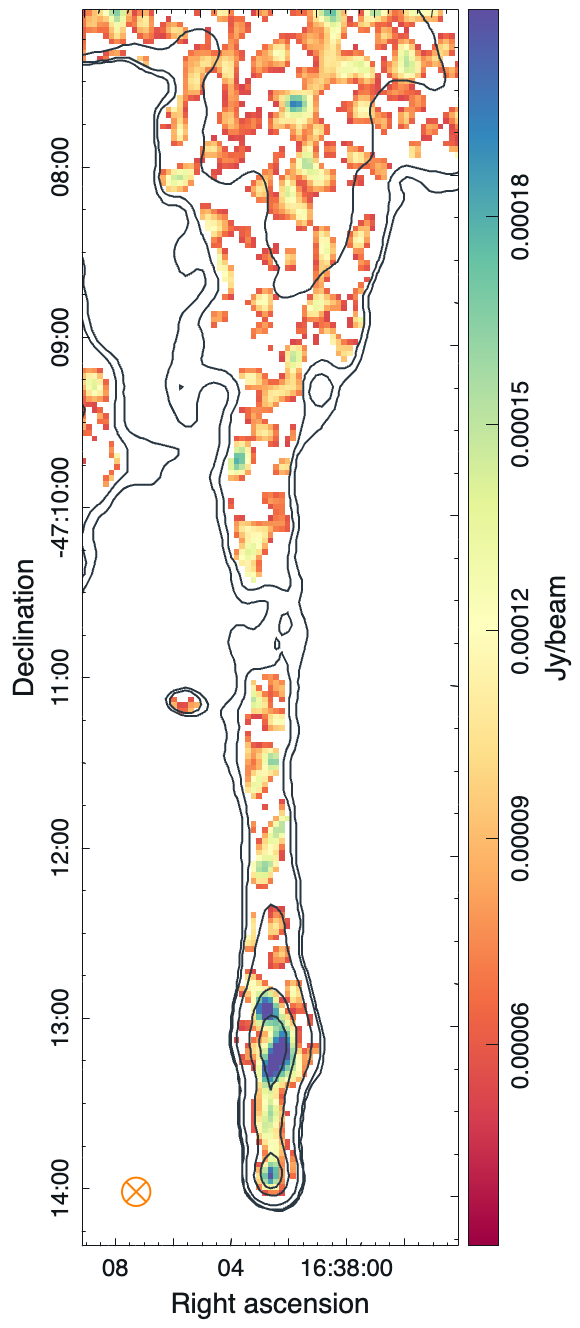
A spectral index map of Potoroo was created using Stokes images at 944, 1284 and 1368 MHz with the MIRIAD software package (Sault et al., 1995). To maintain pixel consistency across all bands, the ASKAP images were first regridded to match the finest pixel grid, 1.5′′1.5′′, of the MeerKAT 1284 MHz image. Then, all images were convolved to the lowest resolution of the dataset, corresponding to the resolution of the ASKAP 944 MHz image with a beam size of 16.3′′ 13.3′′. The local 1 rms noise levels of the individual images were measured using the rms statistics tool in the CARTA software. These measurements were performed on carefully selected regions, excluding all obvious sources. The convolved images were combined, and a spectrum was fitted using a simple weighted linear regression algorithm. The algorithm modelled pixels with flux densities more significant than 5 rms mask thresholds. The flux densities of the same pixel for all bands were fitted, and the resulting slope of the best line fit was stored in a new image. The distribution of these slopes forms the spectral index map of Potoroo, as shown in Figure 4. Pixels with flux densities less than the 5 threshold at least one frequency have default NaN values, do not contribute to future calculations, and are represented as a white background.
The average spectral index measured across Potoroo is 1.26, with a standard deviation of 0.04. The measurement was obtained using the spectral index map for the region marked with the black dotted box in Figure 4. The average value is calculated using the mean statistics tool in the CARTA.
The overall spectral index we obtained is significantly lower than the typical values for PWNe, but it aligns with our expectations for the entire object, covering both the bright and diffuse parts. The steepest section of the Potoroo spectral map corresponds to the large, diffuse area of the tail (marked with the blue box in Figure 4), with an average spectral index of 1.42 0.04. Consequently, the overall spectral index steepens considerably when the diffuse part is included. However, if we only consider the main body (marked with the red box), the calculated average spectral index is 0.210.02. This value is consistent with most PWNe, including the Crab (, Storm & Greidanus, 1992), G319.90.7 (, Ng et al., 2010) and the Boomerang (, Kothes et al., 2006). In Section 4.3, we discuss these radio spectrum results and provide a comparison with the X-ray spectrum.
3.3 Polarisation Analysis
The flat spectral index of PWNe is similar to optically thin thermal emission from HII regions. However, unlike thermal emission, synchrotron radiation in PWNe is linearly polarised, with the degree of polarisation ranging from a few per cent to more than 30% (e.g., Mitchell & Gelfand, 2022, submitted). Typically, the magnetic field within PWNe is assumed to be toroidal (van der Swaluw, 2003; Porth et al., 2017). To investigate the internal magnetic field of PWNe, we need to separate internal Faraday rotation from foreground effects. This process usually requires using three frequencies for accurate measurements.
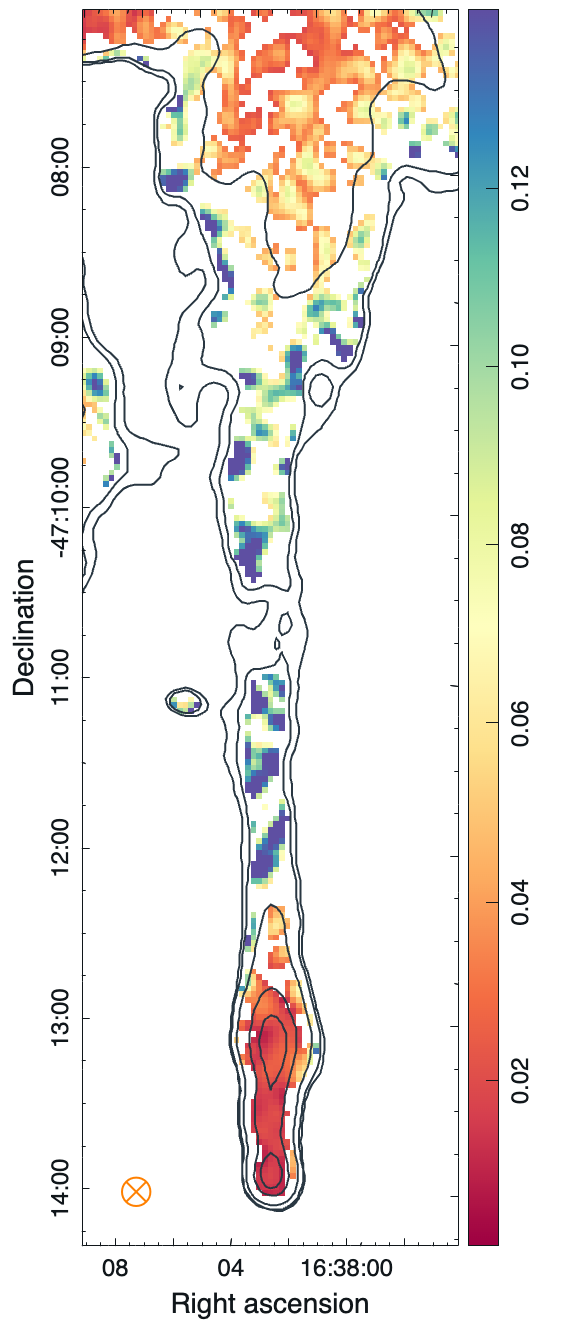
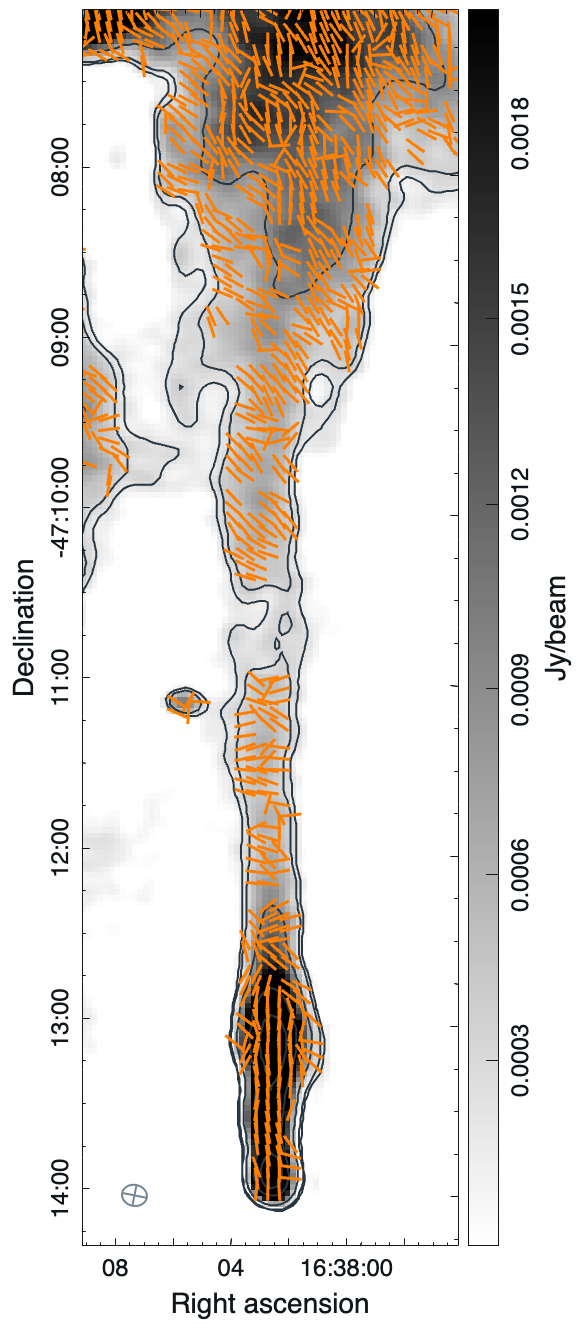
Polarisation analysis of Potoroo was performed using ASKAP 1368 MHz data only, as no Stokes and data were available at any other frequency. Due to low signal-to-noise ratios, the full resolution polarisation Stokes and images were convolved to a common resolution of 10′′10′′. The polarisation intensity, fractional polarisation and polarisation angle maps, along with their errors, were calculated using the standard MIRIAD task impol. Only pixels exceeding 5 noise mask were considered. The resulting maps are presented in Figure 5, and the integrated polarisation intensity, fractional polarisation, and peak fractional polarisation are summarised in Table 2.
The left panel of Figure 5 shows that the linear polarised emission is strongest toward the head and bright features of Potoroo’s tail. It is not surprising that the polarised intensity correlates with the total intensity. There seems to be patches of polarised emission outside of the bright region of the PWN, associated with the diffuse part of the tail. However, this emission is too faint to be properly quantified.
The middle and right panels of Figure 5 display the fractional polarisation map and polarisation vectors in the observed electric field direction, overlaying the Stokes image. The vector lengths are left unscaled for clarity. Our analysis reveals that the polarisation fraction for the entire Potoroo object can reach up to 24%, with an average value below 7%. Focusing solely on the main body, the area with a high signal-to-noise ratio, we observe weak polarisation of approximately 2%, with a peak of about 6% and highly ordered polarisation vectors. The overall lower fractional polarisation could be attributed to internal Faraday rotation, which can cause significant depolarisation at lower frequencies (e.g., Kothes et al., 2006).
The polarisation E-vectors observed in the vicinity of the place of origin exhibit a parallel orientation relative to the Potoroo axis, indicating magnetic field vectors running in the tangential direction. This magnetic field geometry is similar to the findings in G319.90.7 (Ng et al., 2010) and Boomerang (Kothes et al., 2006). In contrast, for the Mouse (Yusef-Zadeh & Gaensler, 2005) and G315.90.0 (the Frying Pan SNR, Ng et al., 2012), the magnetic field shows a parallel alignment with the tail. The polarisation vectors of Potoroo switch orientation with the distance from the pulsar and become disordered, but some radial tendencies can be seen. This change is also detected in G319.90.7 but not in G315.90.0.
It is important to note that polarisation measurements should be considered as indications only, as we used Stokes and maps at one frequency. Without additional data, a precise determination of Faraday rotation and magnetic field properties is not possible. The complete polarisation study will be presented in a subsequent paper.
3.4 Detection of PSR J1638–4713
PSR J16384713 has a spin period of 65.74 ms and the second-highest DM of all known radio pulsars. Its DM of 1553 pc cm-3 is only exceded by the Galactic Centre magnetar (PSR J17452900, Eatough et al., 2013). According to the YMW16555https://www.atnf.csiro.au/research/pulsar/ymw16 electron density model (Yao et al., 2017), this gives a DM distance of kpc, although this could be highly uncertain considering the complexity in the Galactic plane.
The large DM results in the strong scattering we observed in PSR J16384713 and its pulse is completely scattered below 2500 MHz (Figure 6). This explains why this pulsar was not discovered by previous pulsar surveys. We measured the scattering time-scale to be ms at 3700 MHz by fitting the pulse profile with a Gaussian intrinsic pulse profile convolved with an exponential tail (e.g., Bai et al., 2022). Assuming that the scattering time-scale scales as , we estimated the scattering time-scale to be ms at 2 GHz, which is longer than the pulsar spin period and explains its non-detection at lower frequencies.
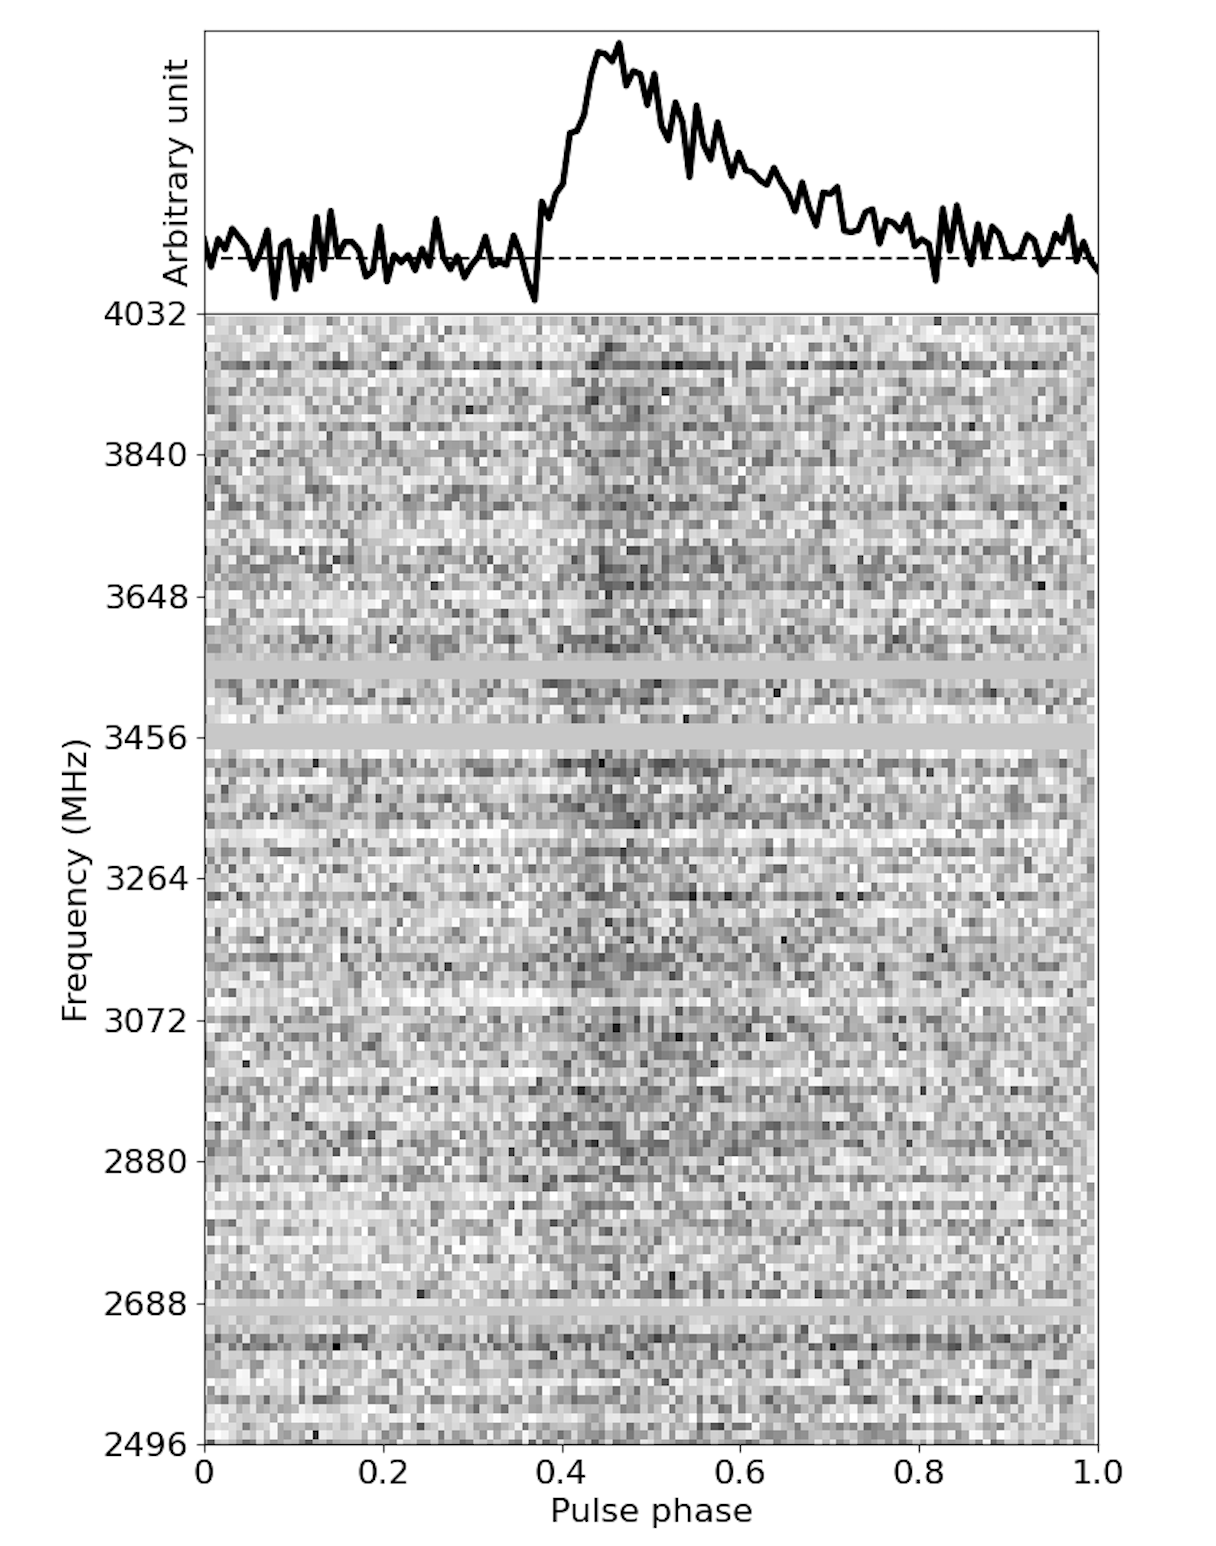
After averaging frequencies from 2496 to 4032 MHz, we measured a pulsar flux density of Jy at 3264 MHz. This is much smaller than the continuum flux density of Potoroo (see Table 2) and suggests that the observed radio continuum emission is dominated by the PWN. No polarised signal has been detected in the pulsed emission so far. Our current Parkes observations are not sensitive enough to detect the circularly polarised emission of mJy, detected in continuum images.
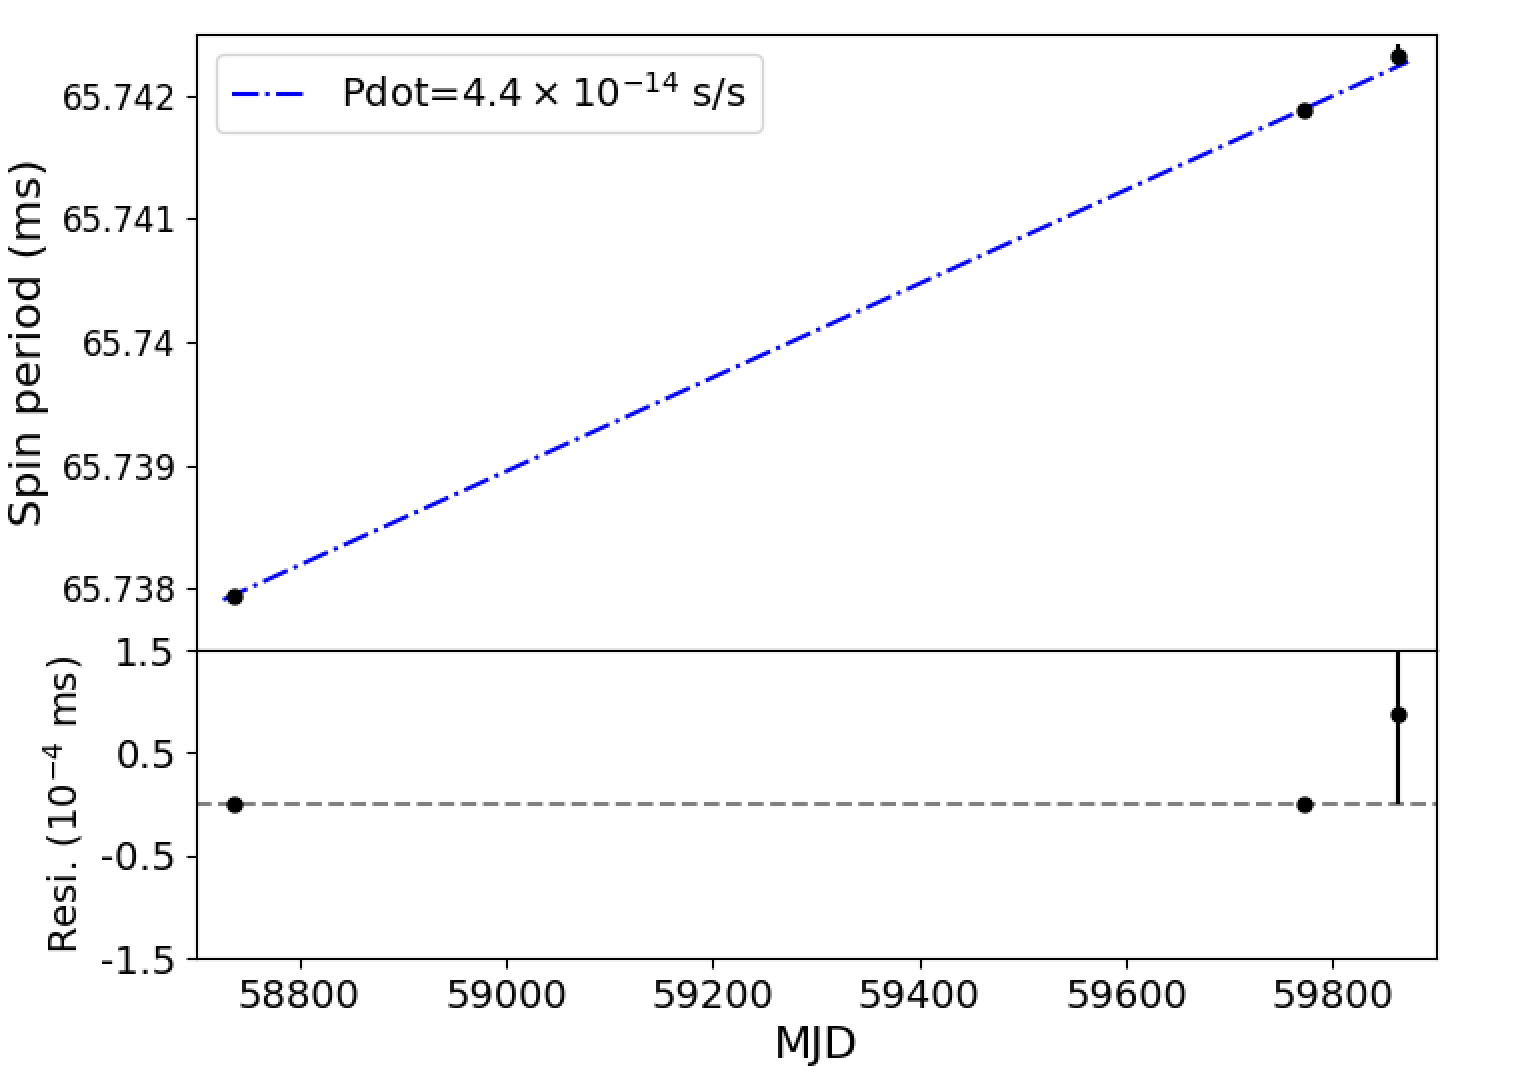
In Figure 7, we show the measured spin period of the pulsar J16384713 as a function of time. We can clearly see the gradual spin-down of PSR J16384713 over the course of yr. To estimate the spin-down rate of PSR J16384713, we fitted a constant spin-down rate (i.e. ) to our measurements and obtained . According to canonical pulsar spin-down models (e.g., Lorimer & Kramer, 2004), we estimated the characteristic pulsar age yr, the characteristic magnetic field G and spin-down luminosity of erg s-1. These parameters indicate that PSR J16384713 is a young pulsar with high spin-down luminosity, which is consistent with our other observations about Potoroo.
3.5 Unknown Origin of Potoroo
Pulsars are expected to originate from the explosion of a massive star when its core undergoes a rapid implosion. The explosion can give the neutron star a significant kick, causing it to move away from its birthplace at high speeds (Lai, 2004). We often observe a pulsar’s trailing emissions pointing back to its origin. However, in the case of Potoroo, we were not able to associate the PWN with any known SNR or detect any sign of a remnant nebula from the explosion of the progenitor star. We also considered the possibility of an off-centre explosion and asymmetries in the surrounding medium. Nevertheless, this is not a unique case as similar examples, PWNe without clear origins, have been observed, e.g. G319.9-0.7 (Ng et al., 2010) and the Mouse (Klingler et al., 2018).
Figure 1 displays the mid-infrared view from WISE using the ISM-sensitive bands (12 m in green and 22 m in blue image layers), alongside the radio continuum view (red layer) of the Galactic plane region in the vicinity of Potoroo. Radio emission from SNRs is primarily synchrotron and should lack clear mid-infrared counterparts. However, a large emission lump located behind the Potoroo trail shows a strong correlation between infrared and radio, indicating its thermal nature originating from HII regions. Moreover, the superposition of the known HII regions (green circles) confirms the previous. No clear evidence has been found for a shell marking the location of the expanding SNR shockwave outside the PWN.
The absence of an apparent parent SNR could be explained by Potoroo’s position in the far Norma arm, known for its abundance of dense molecular clouds, gas, and dust (Dame et al., 2001). These components could potentially obscure emissions coming from behind (Ball et al., 2023, in prep.). In Section 4.1, we discuss further the possible origins of Potoroo.
4 Discussion
Jakobsen et al. (2014) detected extended X-ray emission in the Norma arm using Chandra survey data and tentatively classified it as a bow-shock tail PWN. In addition to X-ray, the authors used radio data of the same field with the highest available resolution at that time, 60′′45′′ for the particular MGPS-2 mosaic image at 843 MHz, and found a radio trail coinciding with the X-ray peak position (see Jakobsen et al., 2014, Figure 5). No radio structure could be resolved. With the recent development of radio telescopes which offer superior sensitivity and high-resolution capabilities, we are able to observe the complex structure of Potoroo in greater detail. Based on the results from the previous section, we can confidently classify Potoroo as a member of a small yet growing group of supersonic pulsars driving a bow-shock through the ambient medium.
4.1 How Far has Potoroo Travelled?
The distance to Potoroo was determined using two different techniques. The first technique involved measuring atomic hydrogen absorption from the spectral fit of the entire X-ray source and comparing it to other objects in the same area. This method suggests that Potoroo is located in a far Norma II region, with a minimum distance of 10 kpc. The second technique involved using the YMW16 model which calculates the density of Galactic electrons and estimates the distance based on the pulsar’s DM. The YMW16 model yielded a distance of 7.6 kpc with an uncertainty of 20% (Yao et al., 2017). However, it’s important to note that our understanding of the distribution of free electrons weakens at large distances, particularly near the Galactic centre. The actual distance to Potoroo may have a larger error than the estimated 20%.
Kothes & Dougherty (2007) calculated the kinematic distances to the Galactic spiral arms using a value for the Galactic centre of R kpc. Based on their calculations, the line of sight passes through the Norma arm at distances of 4.9 and 11.5 kpc with uncertainties of approximately kpc. Given this and considering that distance estimates based on pulsar DM often underestimate the true value, we adopt a distance to Potoroo of 10 kpc as a reasonable assumption and scale all distance-dependent quantities accordingly.
Potoroo is likely a mature nebula whose pulsar received enough of a natal kick to travel away from the centre of its parent SN explosion, and the well-defined outer edges of the nebula suggest that Potoroo has interacted with the reverse shock of the SNR. The duration for the reverse shock to reach maximum strength and dissipate varies depending on factors such as the density of the surrounding medium and the energy of the explosion. Previous studies suggest that, in denser environments, the reverse front can take around 10,000 years to make its way back to the centre (Blondin et al., 2001; van der Swaluw et al., 2001; van der Swaluw, 2004). We have used this estimation as the minimum age for Potoroo.
Although the Potoroo pulsar cannot be resolved in radio continuum images, the flat spectrum of the nebula close to the pulsar suggests the presence of a young, energetic electron population. The radio emission produced by these electrons indicates that the current energy input from the pulsar is significant for the total energy content of the nebula. According to Blondin et al. (2001), the energy input from a pulsar becomes negligible when the nebula’s age is comparable to the characteristic age of the pulsar. Since the current characteristic age of the pulsar is approximately 23,000 years and the energy input is still significant, we can infer that Potoroo is much younger than 24,000 years.
Table 3 presents various SNR ages, ranging from 7.5 kyr to 30 kyr, that were used to estimate the transverse velocities of the pulsar. We also varied the travelled distances (one, two and three times the tail size) to examine the location of the parent SNR. Assuming no inclination with respect to the plane of the sky, we calculated the velocities using the formula . As , the relation simplifies to , where is the distance to Potoroo in units of 10 kpc, corresponds to the angular length for a given travelled distance in arcmin, and stores the probing ages in k year.
| [k year] | [km s-1] | [km s-1] | [km s-1] | [km s-1] | |
| 7.5 | 2732 | 5464 | 8196 | 11763 | |
| 10 | 2049 | 4098 | 6147 | 8822 | |
| 15 | 1366 | 2732 | 4098 | 5881 | |
| 20 | 1025 | 2049 | 3074 | 4411 | |
| 24 | 854 | 1708 | 2561 | 3676 | |
| 30 | 683 | 1366 | 2049 | 2941 |
The study of Kargaltsev et al. (2017) provides a list of kick velocities for bow-shock PWNe (see their Table 1), which varies from 60 km s-1 to around 2,000 km s-1. The upper limit of this range for the projected velocity of Potoroo suggests that a minimum age of 10,000 years is consistent with previous estimates.
We also investigated the pulsar velocity for the case of Potoroo association with SNR G338.1+0.4 (Shaver & Goss, 1970; Whiteoak & Green, 1996), since the trail emission appears to point towards the SNR geometrical centre (Figure 1). Distances to G338.1+0.4 were reported as 6.4 kpc (Shaver & Goss, 1970), 9.9 kpc (Case & Bhattacharya, 1998), 11.9 kpc (Stupar et al., 2007) and 6.2 kpc (Pavlovic et al., 2014), all derived using the brightness–to–diameter (–D) relation. Given the large angular separation of approximately 50′, it is highly unlikely for G338.1+0.4 to be the parent SNR of Potoroo even if they were as close as 6.2 kpc (Table 3).
Our analysis suggests that the progenitor star likely exploded within a distance no greater than twice the size of the Potoroo tail, with the natal kick velocity well exceeding 1000 km s-1. Identifying a parent candidate in the chosen area is challenging due to the extreme density of HII regions. The high concentration of thermal emission in these regions may hinder the detection of any emission from the SNR, as discussed in Section 3.5. Therefore, identifying the origin of Potoroo will require further observations and analyses.
4.2 Potoroo’s Tail Lengths
The observed sizes of Potoroo in radio and X-ray data are approximately 7.2′ and 0.67′, respectively. The size difference is attributed to the synchrotron ageing of relativistic particles generated by a fast-moving pulsar. The X-ray-emitting particles have a shorter lifespan and smaller spatial extent compared to the radio-emitting particles. In contrast, the radio-emitting particles persist for a longer time and form a larger, more diffuse structure that extends further away from the X-ray emission region.
To estimate the physical length of Potoroo’s tails, we converted the angular sizes to minimal lengths of 21 pc and 2 pc for radio and X-ray sources, respectively. However, we believe that the tails may be longer than these estimates. The X-ray emission is only detectable above 2 keV likely due to the severe absorbing column and the emission from a possibly longer tail is blended into the background. On the other hand, the radio tail is well-defined until it reaches the complexity of the ISM, beyond which we cannot confidently identify the Potoroo tail.
Among all the observed pulsar tails, Potoroo stands out with a projected radio length of 21 pc, making it the longest observed PWN. The PWN of PSR J14375959, associated with the Frying Pan SNR, has a similar radio extent of over 20 pc (Camilo et al., 2009), but is not visible in X-rays. The projected velocity of the driving pulsar is 1000 km s-1 (Ng et al., 2012). The Mouse PWN is the next in size and has radio and X-ray tails spanning 17 and 1 pc, respectively (Gaensler et al., 2004), and a pulsar velocity of 300 km s-1 (Hales et al., 2009). The G319.90.7 PWN has the longest X-ray tail of 7 pc, which is also relatively big compared to its 10 pc radio tail (Ng et al., 2010). The velocity of the central pulsar J15095850 is 300 km s-1. As noted earlier, the appearance of PWN is strongly influenced by the physical properties of their surrounding environment, such as density and magnetic field. Hence, a weak correlation between the pulsar velocity and the radio length is not unexpected.
4.3 Radio and X-Ray Spectral Analysis
The spectral map of Potoroo shows a flat radio continuum spectrum near the pulsar due to younger and more energetic electrons, while the spectrum becomes steeper as the distance from the pulsar increases, where synchrotron radiation originates from the older electron population. To examine the spectral variations of Potoroo, we obtained spectral indices from three different regions: the main body, the diffuse part of the tail, and the entire source area (see Figure 4 andTable 4).
While the main body of Potoroo exhibits a typical flat spectral index of 0.21, its overall spectral index is much steeper than that of any other observed PWN. The dominance of its diffuse tail is evident, but its remarkable length coupled with the unusually steep spectrum raises intriguing questions. Taken together, these observed properties provide additional support for classifying Potoroo as a mature PWN.
When a PWN interacts with the reverse shock of its parent SNR, the relativistic particles within the nebula undergo re-acceleration. This process significantly enhances the brightness of the nebula, particularly at radio frequencies. Simultaneously, the magnetic field of the PWN gets compressed by the shock. As synchrotron radiation is emitted when charged particles spiral in a magnetic field, the frequency of this radiation depends on both the energy of particles and the strength of the magnetic field. A stronger magnetic field results in higher frequency radiation leading to a rapid synchrotron burn-off and steepening of the spectral index. The steepest spectral indices known are associated with PWNe that have collided with the reverse shock. However, even in these cases, the spectral indices do not exceed 0.7, e.g. (G141.2+5+0, Kothes et al., 2014) and (G76.9+1.0, Landecker et al., 1993).
| full source | main body | diffuse tail | ||
| 1.260.04 | 0.210.02 | 1.420.04 | ||
| 1.10.7666Reference: Jakobsen et al. (2014). |
In the Chandra observations, Jakobsen et al. (2014) found a similar trend of the spectrum softening with increasing distance from the Potoroo pulsar (see their Figure 2). The authors divided the X-ray source emission into three narrow bands with equal counts. By comparing the softest image with the hardest, they observed that the emission tends to clump towards the point-like source for higher energies, thereby enhancing the prominence of the point-like source and reducing the tail emission.
At X-ray energies and beyond, synchrotron emission is commonly modeled as a power-law distribution of photons: N, where NE is the number of photons with energies E and is the photon index. In the context of PWN, the typical value for is around 2 (Gaensler & Slane, 2006), and the index tends to increase (softens, steepens) with greater distances from the pulsar.
The photon index of Potoroo of 1.1 is taken from the work of Jakobsen et al. (2014), and also listed in Table 4. The authors used data from XMM-Newton to supplement the limited photon statistics of the Chandra data and refine constraints on the spectral parameters. Due to the limited angular resolution of XMM-Newton, the point source and extended emission of Potoroo could not be resolved, so only the full source spectrum was fitted. The calculated photon index of 1.1 is much harder than typical X-ray PWN spectra. This hardness is expected, given that the source is detectable only above 2 keV and lacks any softening towards lower energies.
The collision between PWN and the reverse shock leads to the efficient blending of thermal and non-thermal gases (Blondin et al., 2001), which is expected to produce thermal soft X-ray emissions. Jakobsen et al. (2014) attempt to fit the Potoroo spectra with a thermal model resulted in encountering unconstrained parameters and unacceptable fit statistics.
The complete understanding of the Potoroo’s spectrum remains open. Further investigations using higher frequency radio bands, deeper X-ray data and potential detections are necessary to determine its unique characteristics. However, due to the high absorption in the line of sight toward the Norma spiral arm, it is unlikely that searching for thermal X-ray emission or a bow-shock in H will yield any significant results.
4.4 Properties of PSR J1638–4713
It is well known that NSs move at higher velocities than their progenitor stars (Gunn & Ostriker, 1970). In fact, a significant number of isolated NSs have velocities exceeding 1000 km s-1 (e.g., Hobbs et al., 2005; Deller et al., 2019). These high velocities are believed to result from natal kicks that occur during the NSs’ formation. The natal kicks could be caused by various mechanisms, including asymmetric explosions triggered by hydrodynamical perturbations in the supernova core (e.g., Lai & Goldreich, 2000), or asymmetric neutrino emission in the presence of super-strong magnetic fields ( G) in the proto-neutron star (e.g., Arras & Lai, 1999a, b, and references therein). Therefore, the discovery of fast-moving pulsars might shed light on the physics of supernovae. As discussed in Section 4.1, the transverse velocity of PSR J16384713 is likely to be higher than 1000 km s-1, which makes it among the fastest moving NSs. The relatively strong radio continuum emission from the PWN also opens up the opportunity to place constraints on the proper motion and parallax of PSR J16384713 (Deller et al., 2019). These measurements will be crucial for us to understand the origin and properties of Potoroo.

The spin parameters of PSR J16384713 are consistent with those of young, energetic pulsars. In Figure 8, we show the spin period () and the time derivative of the spin period () for all known pulsars listed in the ATNF Pulsar Catalogue (Manchester et al., 2005). PSR J16384713 is shown as a red triangle and it is located in a region where young pulsars with high energy emissions are. Based on our current estimate of the , the spin-down luminosity of PSR J16384713 is estimated to be erg s-1, revealing an energy loss rate that is among the highest for supersonic pulsars associated with PWN (Table 1, Kargaltsev et al., 2017). We are currently regularly observing PSR J16384713 with the Parkes telescope, and a longer pulsar timing baseline will enable us to precisely measure the spin and astrometric parameters of this pulsar. Better timing models of this pulsar will also enable us to search for high-energy pulsation (e.g., X-ray, -ray) in the future.
5 Conclusion
We report the discovery of a bow-shock PWN, named Potoroo, in the new radio continuum surveys obtained by ASKAP and MeerKAT, and the detection of the associated PSR J16384713 using Parkes observations. We also compared our results with the previous study of the X-ray source detected during the Norma spiral arm Chandra survey. The object exhibits distinctive cometary morphology in both radio and X-ray domains, suggesting pulsar leading the PWN and travelling supersonically through the ambient medium. We estimated a large projected velocity of PSR J16384713, well exceeding 1000 km s-1. The pulsar was identified above 3 GHz at a very high DM of 1553 pc cm-3. Potoroo’s radio size is longer than its X-ray size by a factor of 10. With a distance of at least 10 kpc, the physical sizes are approximately 21 pc and 2 pc for radio and X-ray sources, respectively. This makes Potoroo one of the longest observed radio PWN trail to date.
Our analysis of Potoroo has revealed an unusually steep overall radio spectrum (), which falls far below the typical values for PWNe. However, focusing only on the high signal-to-noise ratio part of the nebula, we found that its value is consistent with the majority of PWNe. We attribute the steep overall spectral index to the interaction of the parent SN reverse shock with the PWN, which results in an increase of the magnetic field of the PWN and severe synchrotron burn-off of the highest energy electrons. This interaction also makes the radio nebula brighter, and along with massive absorption of the surrounding medium, explains the significant length difference observed between the radio and X-ray sources.
Multi-frequency studies of Potoroo are essential to further understand the physics of this remarkable object and its evolution in a very complex environment. In particular, our polarisation analysis revealed highly ordered polarisation vectors that run parallel to the Potoroo’s tail orientation, but additional high-frequency polarimetry is required to constrain the magnetic field. Dedicated Chandra longer exposure observations are necessary in order to investigate the nature of the misaligned outflow and improve our image of the flow structure of the X-ray particles. The parent SNR is not known so far, and to deeper investigate the origin of Potoroo, we intend to study the distribution of the interstellar medium in the surrounding environment through molecular lines. Based on the PSR J16384713 spin-down and characteristic age, we anticipate detecting gamma-ray photons from Potoroo. If TeV emission is detected, we can accurately measure the magnetic field’s strength by jointly modelling the synchrotron and inverse Compton scattering emission.
Acknowledgement
This scientific work uses data obtained from Inyarrimanha Ilgari Bundara, the CSIRO Murchison Radio-astronomy Observatory. We acknowledge the Wajarri Yamaji People as the Traditional Owners and native title holders of the Observatory site. CSIRO’s ASKAP radio telescope is part of the Australia Telescope National Facility (ATNF)777https://ror.org/05qajvd42. Operation of ASKAP is funded by the Australian Government with support from the National Collaborative Research Infrastructure Strategy. ASKAP uses the resources of the Pawsey Supercomputing Research Centre. Establishment of ASKAP, Inyarrimanha Ilgari Bundara, the CSIRO Murchison Radio-astronomy Observatory and the Pawsey Supercomputing Research Centre are initiatives of the Australian Government, with support from the Government of Western Australia and the Science and Industry Endowment Fund. The Parkes radio telescope (recently given the Indigenous Wiradjuri name Murriyang) is also part of ATNF which is funded by the Australian Government for operation as a National Facility managed by CSIRO. We acknowledge the Wiradjuri people as the Traditional Owners of this observatory site.
The MeerKAT telescope is operated by the South African Radio Astronomy Observatory, which is a facility of the National Research Foundation, an agency of the South Africa Department of Science and Innovation.
The National Radio Astronomy Observatory is a facility of the US National Science Foundation, operated under a cooperative agreement by Associated Universities, Inc.
This publication also makes use of data products from the CDA and software provided by the Chandra X-ray Center (CXC), as well as from the Wide-field Infrared Survey Explorer, a joint project of the University of California, Los Angeles, and the Jet Propulsion Laboratory/California Institute of Technology, that is funded by the National Aeronautics and Space Administration (NASA). The authors acknowledge the use of the NASA’s Astrophysics Data System Bibliographic Services888http://adsabs.harvard.edu and Simbad Astronomical Database999http://simbad.u-strasbg.fr/simbad, operated at the CDS, Strasbourg, France. Carta101010https://cartavis.org and SAOImage DS9111111https://sites.google.com/cfa.harvard.edu/saoimageds9 (Joye & Mandel, 2003) tools are extensively used for image display and visualisation.
We thank Fernando Camilo for the early-stage paper discussion and for providing the MeerKAT data. We also thank Naomi van Jaarsveld, Benjamin Stappers and Vanessa McBridge for conducting the initial Parkes observation of Potoroo and generously sharing their notes on data reduction.
S.L., M.D.F., and G.R. acknowledge the Australian Research Council (ARC) funding through grant DP200100784. S.L. also acknowledges support from the Ministry of Education, Science and Technological Development of the Republic of Serbia through contract number 451-03-47/2023-01/200002. S.D. is the recipient of an ARC Discovery Early Career Award (DE210101738) funded by the Australian Government.
We thank an anonymous referee for comments and suggestions that greatly improved our paper.
Data Availability
This study made use of archival ASKAP data obtained from the CSIRO Science Data Archive (CASDA)121212https://research.csiro.au/casda. The observations from the Parkes radio telescope are accessible through the same portal but after an 18-month embargo period. The corresponding author can provide the MeerKAT data upon reasonable request. The X-ray imagining results are based on data from the CDA131313https://cxc.harvard.edu/cda. WISE maps were obtained via the SkyView Virtual Observatory141414https://skyview.gsfc.nasa.gov/current/cgi/titlepage.pl server, which is supported by NASA’s High Energy Astrophysics Science Archive Research Center (HEASARC). This study also drew information from the WISE Catalog of Galactic HII Regions151515http://astro.phys.wvu.edu/wise and the ATNF Pulsar Catalogue161616https://www.atnf.csiro.au/research/pulsar/psrcat.
References
- Alsaberi et al. (2019) Alsaberi, R. Z. E., Maitra, C., Filipović, M. D., et al. 2019, MNRAS, 486, 2507
- Anderson et al. (2014) Anderson, L. D., Bania, T. M., Balser, D. S., et al. 2014, ApJS, 212, 1
- Arras & Lai (1999a) Arras, P., & Lai, D. 1999a, ApJ, 519, 745
- Arras & Lai (1999b) —. 1999b, Phys. Rev. D, 60, 043001
- Baganoff et al. (2003) Baganoff, F. K., Maeda, Y., Morris, M., et al. 2003, ApJ, 591, 891
- Bai et al. (2022) Bai, J. T., Dai, S., Zhi, Q. J., et al. 2022, MNRAS, 513, 1794
- Ball et al. (2023) Ball, B. D., Kothes, R., Rosolowsky, E., et al. 2023, in preparation
- Blondin et al. (2001) Blondin, J. M., Chevalier, R. A., & Frierson, D. M. 2001, ApJ, 563, 806
- Brunthaler et al. (2021) Brunthaler, A., Menten, K. M., Dzib, S. A., et al. 2021, A&A, 651, A85
- Bucciantini (2002) Bucciantini, N. 2002, A&A, 387, 1066
- Bucciantini & Bandiera (2001) Bucciantini, N., & Bandiera, R. 2001, A&A, 375, 1032
- Bucciantini et al. (2003) Bucciantini, N., Blondin, J. M., Del Zanna, L., & Amato, E. 2003, A&A, 405, 617
- Camilo et al. (2009) Camilo, F., Ng, C. Y., Gaensler, B. M., et al. 2009, ApJ, 703, L55
- Case & Bhattacharya (1998) Case, G. L., & Bhattacharya, D. 1998, ApJ, 504, 761
- Comrie et al. (2021) Comrie, A., Wang, K.-S., Hsu, S.-C., et al. 2021, CARTA: The Cube Analysis and Rendering Tool for Astronomy, Zenodo
- Dai et al. (2015) Dai, S., Hobbs, G., Manchester, R. N., et al. 2015, MNRAS, 449, 3223
- Dai et al. (2019) Dai, S., Lower, M. E., Bailes, M., et al. 2019, ApJ, 874, L14
- Dame et al. (2001) Dame, T. M., Hartmann, D., & Thaddeus, P. 2001, ApJ, 547, 792
- de Vries et al. (2022) de Vries, M., Romani, R. W., Kargaltsev, O., et al. 2022, ApJ, 939, 70
- Deller et al. (2019) Deller, A. T., Goss, W. M., Brisken, W. F., et al. 2019, ApJ, 875, 100
- Eatough et al. (2013) Eatough, R. P., Falcke, H., Karuppusamy, R., et al. 2013, Nature, 501, 391
- Filipović & Tothill (2021) Filipović, M. D., & Tothill, N. F. H., eds. 2021, Multimessenger Astronomy in Practice, 2514-3433 (IOP Publishing), doi:10.1088/2514-3433/ac2256
- Filipović et al. (2022) Filipović, M. D., Payne, J. L., Alsaberi, R. Z. E., et al. 2022, MNRAS, 512, 265
- Fornasini et al. (2014) Fornasini, F. M., Tomsick, J. A., Bodaghee, A., et al. 2014, ApJ, 796, 105
- Fruscione et al. (2006) Fruscione, A., McDowell, J. C., Allen, G. E., et al. 2006, in Society of Photo-Optical Instrumentation Engineers (SPIE) Conference Series, Vol. 6270, Society of Photo-Optical Instrumentation Engineers (SPIE) Conference Series, ed. D. R. Silva & R. E. Doxsey, 62701V
- Gaensler & Slane (2006) Gaensler, B. M., & Slane, P. O. 2006, ARA&A, 44, 17
- Gaensler et al. (2004) Gaensler, B. M., van der Swaluw, E., Camilo, F., et al. 2004, ApJ, 616, 383
- Gould & Lyne (1998) Gould, D. M., & Lyne, A. G. 1998, MNRAS, 301, 235
- Green (2019) Green, D. A. 2019, Journal of Astrophysics and Astronomy, 40, 36
- Green (2022) —. 2022, Cavendish Laboratory, Cambridge, United Kingdom (available at ”http://www.mrao.cam.ac.uk/surveys/snrs/”)
- Gunn & Ostriker (1970) Gunn, J. E., & Ostriker, J. P. 1970, ApJ, 160, 979
- Gürkan et al. (2022) Gürkan, G., Prandoni, I., O’Brien, A., et al. 2022, MNRAS, 512, 6104
- Guzman et al. (2019) Guzman, J., Whiting, M., Voronkov, M., et al. 2019, ASKAPsoft: ASKAP science data processor software, ascl:1912.003
- H. E. S. S. Collaboration et al. (2018) H. E. S. S. Collaboration, Abdalla, H., Abramowski, A., et al. 2018, A&A, 612, A2
- Hales et al. (2009) Hales, C. A., Gaensler, B. M., Chatterjee, S., van der Swaluw, E., & Camilo, F. 2009, ApJ, 706, 1316
- Hobbs et al. (2005) Hobbs, G., Lorimer, D. R., Lyne, A. G., & Kramer, M. 2005, MNRAS, 360, 974
- Hobbs et al. (2020) Hobbs, G., Manchester, R. N., Dunning, A., et al. 2020, PASA, 37, e012
- Hobbs et al. (2006) Hobbs, G. B., Edwards, R. T., & Manchester, R. N. 2006, MNRAS, 369, 655
- Hotan et al. (2020) Hotan, A., Whiting, M., Huynh, M., & Moss, V. 2020, ASKAP Data Products for Project AS113 (Other ASKAP pilot science including tests, TOOs or guest observations): images and visibilities, cSIRO. Data Collection.
- Hotan et al. (2004) Hotan, A. W., van Straten, W., & Manchester, R. N. 2004, PASA, 21, 302
- Hotan et al. (2021) Hotan, A. W., Bunton, J. D., Chippendale, A. P., et al. 2021, PASA, 38, e009
- Hui & Becker (2007) Hui, C. Y., & Becker, W. 2007, A&A, 467, 1209
- Jakobsen et al. (2014) Jakobsen, S. J., Tomsick, J. A., Watson, D., Gotthelf, E. V., & Kaspi, V. M. 2014, ApJ, 787, 129
- Jansen et al. (2001) Jansen, F., Lumb, D., Altieri, B., et al. 2001, A&A, 365, L1
- Jin et al. (2023) Jin, R., Ng, C. Y., Roberts, M. S. E., & Li, K.-L. 2023, ApJ, 942, 100
- Johnston et al. (2008) Johnston, S., Taylor, R., Bailes, M., et al. 2008, Experimental Astronomy, 22, 151
- Jonas & MeerKAT Team (2016) Jonas, J., & MeerKAT Team. 2016, in MeerKAT Science: On the Pathway to the SKA, 1
- Jonas (2009) Jonas, J. L. 2009, IEEE Proceedings, 97, 1522
- Joye & Mandel (2003) Joye, W. A., & Mandel, E. 2003, in Astronomical Society of the Pacific Conference Series, Vol. 295, Astronomical Data Analysis Software and Systems XII, ed. H. E. Payne, R. I. Jedrzejewski, & R. N. Hook, 489
- Kargaltsev & Pavlov (2008) Kargaltsev, O., & Pavlov, G. G. 2008, in American Institute of Physics Conference Series, Vol. 983, 40 Years of Pulsars: Millisecond Pulsars, Magnetars and More, ed. C. Bassa, Z. Wang, A. Cumming, & V. M. Kaspi, 171–185
- Kargaltsev et al. (2017) Kargaltsev, O., Pavlov, G. G., Klingler, N., & Rangelov, B. 2017, Journal of Plasma Physics, 83, 635830501
- Kennel & Coroniti (1984) Kennel, C. F., & Coroniti, F. V. 1984, ApJ, 283, 710
- Klingler et al. (2022) Klingler, N., Hare, J., Kargaltsev, O., Pavlov, G. G., & Tomsick, J. 2022, arXiv e-prints, arXiv:2212.03952
- Klingler et al. (2018) Klingler, N., Kargaltsev, O., Pavlov, G. G., et al. 2018, ApJ, 861, 5
- Kothes (2017) Kothes, R. 2017, in Astrophysics and Space Science Library, Vol. 446, Modelling Pulsar Wind Nebulae, ed. D. F. Torres, 1
- Kothes & Dougherty (2007) Kothes, R., & Dougherty, S. M. 2007, A&A, 468, 993
- Kothes et al. (2020) Kothes, R., Reich, W., Safi-Harb, S., et al. 2020, MNRAS, 496, 723
- Kothes et al. (2006) Kothes, R., Reich, W., & Uyanıker, B. 2006, ApJ, 638, 225
- Kothes et al. (2014) Kothes, R., Sun, X. H., Reich, W., & Foster, T. J. 2014, ApJ, 784, L26
- Lai (2004) Lai, D. 2004, in Cosmic explosions in three dimensions, ed. P. Höflich, P. Kumar, & J. C. Wheeler, 276
- Lai & Goldreich (2000) Lai, D., & Goldreich, P. 2000, ApJ, 535, 402
- Landecker et al. (1993) Landecker, T. L., Higgs, L. A., & Wendker, H. J. 1993, A&A, 276, 522
- Lemiere et al. (2009) Lemiere, A., Slane, P., Gaensler, B. M., & Murray, S. 2009, ApJ, 706, 1269
- Lenc et al. (2018) Lenc, E., Murphy, T., Lynch, C. R., Kaplan, D. L., & Zhang, S. N. 2018, MNRAS, 478, 2835
- Lorimer & Kramer (2004) Lorimer, D. R., & Kramer, M. 2004, Handbook of Pulsar Astronomy, Vol. 4 (Cambridge University Press)
- Manchester et al. (2005) Manchester, R. N., Hobbs, G. B., Teoh, A., & Hobbs, M. 2005, AJ, 129, 1993
- Mauch et al. (2020) Mauch, T., Cotton, W. D., Condon, J. J., et al. 2020, ApJ, 888, 61
- McConnell et al. (2016) McConnell, D., Allison, J. R., Bannister, K., et al. 2016, PASA, 33, e042
- Mitchell & Gelfand (2022) Mitchell, A. M. W., & Gelfand, J. 2022, arXiv e-prints, arXiv:2208.11026, submitted
- Murphy et al. (2007) Murphy, T., Mauch, T., Green, A., et al. 2007, MNRAS, 382, 382
- Ng et al. (2012) Ng, C. Y., Bucciantini, N., Gaensler, B. M., et al. 2012, ApJ, 746, 105
- Ng et al. (2010) Ng, C. Y., Gaensler, B. M., Chatterjee, S., & Johnston, S. 2010, ApJ, 712, 596
- Norris et al. (2019) Norris, R., Filipovic, M., Huynh, M., et al. 2019, ASKAP Data Products for Project AS101 (ASKAP Pilot Survey for EMU): images and visibilities, cSIRO. Data Collection.
- Norris et al. (2021) Norris, R. P., Marvil, J., Collier, J. D., et al. 2021, PASA, 38, e046
- Pavan et al. (2014a) Pavan, L., Bordas, P., Pühlhofer, G., et al. 2014a, A&A, 562, A122
- Pavan et al. (2014b) Pavan, L., Bordas, P., Pühlhofer, G., et al. 2014b, in International Journal of Modern Physics Conference Series, Vol. 28, International Journal of Modern Physics Conference Series, 1460172
- Pavlovic et al. (2014) Pavlovic, M. Z., Dobardzic, A., Vukotic, B., & Urosevic, D. 2014, Serbian Astronomical Journal, 189, 25
- Porth et al. (2017) Porth, O., Buehler, R., Olmi, B., et al. 2017, Space Sci. Rev., 207, 137
- Ransom (2001) Ransom, S. M. 2001, PhD thesis, Harvard University, Massachusetts
- Reynolds (2009) Reynolds, S. P. 2009, ApJ, 703, 662
- Reynolds et al. (2017) Reynolds, S. P., Pavlov, G. G., Kargaltsev, O., et al. 2017, Space Sci. Rev., 207, 175
- Sault et al. (1995) Sault, R. J., Teuben, P. J., & Wright, M. C. H. 1995, in Astronomical Society of the Pacific Conference Series, Vol. 77, Astronomical Data Analysis Software and Systems IV, ed. R. A. Shaw, H. E. Payne, & J. J. E. Hayes, 433
- Schinckel et al. (2012) Schinckel, A. E., Bunton, J. D., Cornwell, T. J., Feain, I., & Hay, S. G. 2012, in Society of Photo-Optical Instrumentation Engineers (SPIE) Conference Series, Vol. 8444, Ground-based and Airborne Telescopes IV, ed. L. M. Stepp, R. Gilmozzi, & H. J. Hall, 84442A
- Shaver & Goss (1970) Shaver, P. A., & Goss, W. M. 1970, Australian Journal of Physics Astrophysical Supplement, 14, 133
- Storm & Greidanus (1992) Storm, R. G., & Greidanus, H. 1992, Nature, 368, 6564
- Stupar et al. (2007) Stupar, M., Filipović, M. D., Parker, Q. A., et al. 2007, Ap&SS, 307, 423
- Truelove & McKee (1999) Truelove, J. K., & McKee, C. F. 1999, ApJS, 120, 299
- van der Swaluw (2003) van der Swaluw, E. 2003, A&A, 404, 939
- van der Swaluw (2004) —. 2004, Advances in Space Research, 33, 475
- van der Swaluw et al. (2001) van der Swaluw, E., Achterberg, A., Gallant, Y. A., & Tóth, G. 2001, A&A, 380, 309
- van der Swaluw et al. (2004) van der Swaluw, E., Downes, T. P., & Keegan, R. 2004, A&A, 420, 937
- van Jaarsveld et al. (2019) van Jaarsveld, N., Camilo, F., Stappers, Benjamin, & McBride, V. 2019, Parkes observations for project P1019 semester 2019APRS_01, cSIRO. Data Collection.
- van Straten & Bailes (2011) van Straten, W., & Bailes, M. 2011, PASA, 28, 1
- Weiler & Sramek (1988) Weiler, K. W., & Sramek, R. A. 1988, ARA&A, 26, 295
- Weisskopf et al. (2000) Weisskopf, M. C., Tananbaum, H. D., Van Speybroeck, L. P., & O’Dell, S. L. 2000, in Society of Photo-Optical Instrumentation Engineers (SPIE) Conference Series, Vol. 4012, X-Ray Optics, Instruments, and Missions III, ed. J. E. Truemper & B. Aschenbach, 2–16
- Whiteoak & Green (1996) Whiteoak, J. B. Z., & Green, A. J. 1996, A&AS, 118, 329
- Wright et al. (2010) Wright, E. L., Eisenhardt, P. R. M., Mainzer, A. K., et al. 2010, AJ, 140, 1868
- Yao et al. (2017) Yao, J. M., Manchester, R. N., & Wang, N. 2017, ApJ, 835, 29
- Yoon & Heinz (2017) Yoon, D., & Heinz, S. 2017, MNRAS, 464, 3297
- Yusef-Zadeh & Gaensler (2005) Yusef-Zadeh, F., & Gaensler, B. M. 2005, Advances in Space Research, 35, 1129