Detection of diffuse H i emission in the circumgalactic medium of NGC 891 and NGC 4565 - II
1Kavli Institute for Particle Astrophysics & Cosmology, Stanford University, 452 Lomita Mall, Stanford, CA 94305, USA
2Department of Astronomy, The Ohio State University, 140 West 18th Avenue, Columbus, OH 43210, USA
3Center for Cosmology and Astroparticle Physics, 191 West Woodruff Avenue, Columbus, OH 43210, USA
4Research School of Astronomy & Astrophysics, Australian National University, Canberra, ACT 2611, Australia
5Department of Astronomy, The University of Wisconsin–Madison, 475 N. Charter Street, Madison, WI 53706, USA
6Department of Astronomy, University of Cape Town, Rondebosch 7700, Western Cape, South Africa
7CSIRO Astronomy and Space Science, PO Box 1130, Bentley, WA 6102, Australia
Abstract
We probe the neutral circumgalactic medium (CGM) along the major axes of NGC 891 and NGC 4565 in 21-cm emission out to kpc using the Green Bank Telescope (GBT), extending our previous minor axes observations. We achieve an unprecedented sensitivity of cm-2 per 20 km s-1 velocity channel. We detect H i with diverse spectral shapes, velocity widths, and column densities. We compare our detections to the interferometric maps from the Westerbork Synthesis Radio Telescope (WSRT) obtained as part of the HALOGAS survey. At small impact parameters, of the emission detected by the GBT cannot be explained by emission seen in the WSRT maps, and it increases to at large impact parameters. This implies the presence of diffuse circumgalactic H i. The mass ratio between H i in the CGM and H i in the disk is an order of magnitude larger than previous estimates based on shallow GBT mapping. The diffuse H i along the major axes pointings is corotating with the H i disk. The velocity along the minor axes pointings is consistent with an inflow and/or fountain in NGC 891 and an inflow/outflow in NGC 4565. Including the circumgalactic H i, the depletion time and the accretion rate of NGC 4565 are sufficient to sustain its star formation. In NGC 891, most of the required accreting material is still missing.
keywords:
galaxies: haloes — radio lines: general — galaxies: individual (NGC 891, NGC 4565) — galaxies: formation — galaxies: evolution — accretion1 Introduction
The circumgalactic medium (CGM), the multiphase gaseous extended halo surrounding the stellar disk and the interstellar medium (ISM), represents a large reservoir of baryonic material and plays a key role in the evolution of galaxies (Putman et al., 2012; Faucher-Giguere & Oh, 2023). The inflow of H i, the raw fuel of star formation, from the intergalactic medium (IGM) to the ISM is regulated by the CGM through bimodal processes (Kereš et al., 2005; van de Voort et al., 2011; Nelson et al., 2013). In “hot mode” accretion, the accreting gas is shock-heated to the virial temperature, eventually, a fraction of it cools and fragments into H i clouds and precipitates to form the H i disk. It is predominant in massive (virial mass ) galaxies and galaxies at lower redshift (). In lower mass galaxies or galaxies at higher redshift, the gas is predicted to accrete through “cold mode”, i.e., it is never heated to the virial temperature and it flows through filaments/sheets from the IGM to the ISM bypassing any major thermodynamic interaction with the surrounding hot CGM.
The depletion time, i.e., the ratio of neutral gas (H i + H2) mass in the ISM and the star formation rate (SFR) of galaxies is too small to sustain star formation over the cosmic time (Sancisi et al., 2008). The stellar mass density surpasses the neutral gas density since (Walter et al., 2020). It implies that there has to be an external supply of gas to keep the ISM in a quasi-equilibrium state. The accretion/inflow rate measured from H i in and immediately around the disk of local (D25 Mpc) galaxies is more than an order-of-magnitude smaller than their star formation rate (Kamphuis et al., 2022). It indicates that the rest of the “missing” accreting material could be at larger galactocentric distances, i.e., in the CGM. In addition to the accretion, circumgalactic H i also traces the tidal interaction, ram-pressure stripping, mergers between galaxies, and galactic outflows (e.g., Hibbard & van Gorkom, 1996; Wolfe et al., 2013; Odekon et al., 2016; Veilleux et al., 2020).
Ly absorption studies of H i in the CGM of the Milky Way have shown evidence for a large amount of atomic gas at N(H i) cm-2 (e.g., Richter et al., 2017). The circumgalactic H i in external galaxies has been studied using Ly absorption lines at (e.g., Borthakur et al., 2016; Péroux et al., 2022). These studies have revealed a strong correlation between the atomic gas mass fraction () and the impact-parameter-corrected equivalent width of Ly absorbers, suggesting a physical connection between the atomic ISM and the CGM. However, the Ly absorption lines are often found saturated but undamped, i.e., 1016N(H i)10, a 3 orders of magnitude uncertainty. Absorption studies are limited by the availability of bright background sources like quasars and the covering fraction of the Ly absorbers. The average of many galaxy-quasar pairs is challenging to interpret as the stellar mass, SFR, and inclination of the galaxy disks, and azimuthal angles of CGM absorbers to the disks are often entangled with each other. Also, the sensitivity to Ly absorbers at with existing instruments is limited, and it is unknown how the accretion history from to evolves, if at all. 21-cm H i emission studies can constrain the large-scale spatial distribution and kinematics of neutral gas in the CGM of an individual galaxy in an unbiased and complete way.
Over the past decade, there have been several large interferometric programs to map the H i emission in the CGM of nearby spiral galaxies at high angular resolution and high point source sensitivity, including Hydrogen Accretion in LOcal GAlaxies Survey (HALOGAS, Heald et al., 2011), The Local Volume H i Survey (LVHIS, Koribalski et al., 2018), MeerKAT HI Observations of Nearby Galactic Objects; Observing Southern Emitters (MHONGOOSE, Sorgho et al., 2019) survey, and Widefield ASKAP L-band Legacy All-sky Blind surveY (WALLABY, Kleiner et al., 2019). However, due to the finite size of the dishes, there is a minimum possible spacing (i.e., the diameter of each dish) between neighboring telescopes of an interferometric array. This results in a gap in the uv-coverage, which is called the “short-spacing” problem. It limits the sensitivity of the interferometers to low surface brightness and large angular scales. For example, the smallest baseline length of the Westerbork Synthesis Radio Telescope (WSRT) is 36 m, which translates to a maximum recoverable angular scale of . Because extended H i structures are more likely to survive than small H i clouds in the CGM (Armillotta et al., 2017; Gronke et al., 2022), the “diffuse” circumgalactic H i with low column density across large angular scales might be a significant reservoir of gas around galaxies that interferometers would miss. Single dishes have full uv-coverage, allowing detection of structure at all angular scales. Thus, single-dish observations complement interferometric studies of the CGM.
The unblocked aperture design of the Green Bank Telescope (GBT), decent angular resolution (FWHM 9.1′), its low sidelobes, and high surface brightness sensitivity (T 20 K) make it ideal to search for low column density structures over large scales. There have been several single-dish observations with the GBT targeting the CGM of nearby galaxies, as discussed below.
The CGM of NGC 2403, NGC 2997 and NGC 6946 have been mapped with the GBT down to a 5 detection limit of 1018 cm-2 over a 20 km s-1 channel (de Blok et al., 2014; Pisano, 2014). Observations of NGC 2403 revealed a low column density, 8 kpc extended filament outside the H i disk. It has recently been found to be part of a 20 kpc stellar stream that formed due to a recent (2 Gyr) tidal interaction with a dwarf satellite galaxy (Veronese et al., 2023). The halo of NGC 2997 did not show any filamentary feature, and the H i mass, as measured with the GBT, was only 7% higher than that derived from past interferometric measurements. The H i observations of NGC 6946 revealed a filament of N(H i) = 5 1018 cm-2 connecting the galaxy with its nearest companions. It shows that the H i distribution in the CGM varies from galaxy to galaxy.
As part of the project AMIGA (Absorption Maps In the Gas of Andromeda), Howk et al. (2017) looked for the 21-cm emission with the GBT in the CGM of M 31 along 48 directions at a 5 sensitivity of 41017 cm-2. Except for the 2 sightlines passing through the Magellanic Stream, they were not able to detect any H i emission across an impact parameter of 25 kpc to 340 kpc. The non-detection indicated that unless M 31 is an exception, the covering fraction of the circumgalactic H i might be too low to be detected in the galaxies as nearby as M 31, where the beam of GBT corresponds to a physical length of 2 kpc.
Pingel et al. (2018), hereafter P18, observed the CGM of four galaxies at a distance of 9–18 Mpc: NGC 891, NGC 925, NGC 4414 and NGC 4565 with the GBT, and compared it with the interferometric data from the HALOGAS survey at equal spatial and velocity resolution. They did not detect any considerable amount of excess H i from the GBT data than the WSRT data. It indicated that the column density of diffuse H i, if present, is lower than their 5 GBT detection limit of 0.9–1.41018 cm-2 over a 20 km s-1 line width.
The aforementioned single-dish surveys integrate for a few minutes per point and cover a large area, usually out to the virial radius of each galaxy. Das et al. (2020) adopted a complementary approach and integrated for 3–4 hours on-source toward individual pointings along the minor axes of NGC 891 and NGC 4565, achieving an unprecedented 5 sensitivity of 8.21016 cm-2 over a 20 km s-1 line width. It is more than an order of magnitude deeper observation compared to previous single-dish observations. It led to detections of H i at each pointing. By comparing the sensitive GBT spectra to the deep HALOGAS WSRT measurements, they found that % of the emission detected by the GBT cannot be explained by the interferometric maps. This confirmed the presence of low column density diffuse circumgalactic H i along the minor axes of these galaxies.
In the GBT census of 18 local MHONGOOSE galaxies, the azimuthally averaged cumulative H i profiles of 15 galaxies do not truncate at large impact parameters (Sardone et al., 2021). This indirectly suggests the presence of diffuse H i at a large scale. With a 5 H i column density sensitivity of 1017.9 cm-2, Wang et al. (2023) mapped the CGM of NGC 4631 using Five-hundred-meter Aperture Spherical Telescope (FAST) and detected H i out to 120 kpc from the galaxy. By comparing it with HALOGAS WSRT measurements, they found that more than one-fourth of the emission detected by the FAST is diffuse. These results are consistent with the findings of Das et al. (2020), hereafter D20.
In this paper, we expand the study of D20 along the major axes of NGC 891 and NGC 4565. We achieve a 5 H i column density sensitivity of 6.11016 cm-2, equivalent with H i mass sensitivity of , calculated over a 20 km s-1 line width. These are among the deepest H i observations around external galaxies obtained to date in 21-cm H i.
2 Observations and data reduction
| Pointing(a) | RA | DEC | t | Tsys | d⟂ | v(d) | v | v | n | |
|---|---|---|---|---|---|---|---|---|---|---|
| (J2000) | (J2000) | (hrs) | (K) | (mK) | (kpc) | (km s-1) | (km s-1) | (km s-1) | ||
| (1) | (2) | (3) | (4) | (5) | (6) | (7) | (8) | (9) | (10) | (11) |
| NGC 891 (2h22m33.6s, 42∘20′58′′) | ||||||||||
| UP1J | 2h23m00.6s | 42∘33′03′′ | 0.25 | 19.7 | 2.82 | 35.3 | 5.0 | (-249,117) | (-450,750) | 1 |
| UP2J | 2h23m21.9s | 42∘41′26′′ | 1.69 | 18.5 | 1.02 | 60.1 | 7.5 | (-197,-1) | (-475,900) | 2 |
| UP3J | 2h23m41.6s | 42∘50′17′′ | 1.74 | 18.0 | 0.98 | 85.6 | 10.0 | (110,420) | (-400,1050) | 2 |
| UP1N | 2h21m43.5s | 42∘24′42′′ | 0.33 | 18.4 | 2.28 | 26.8 | 5.0 | (-230,258) | (-450,600) | 1 |
| UP2N | 2h20m55.7s | 42∘27′50′′ | 3.94 | 19.0 | 0.68 | 51.9 | 15.0 | (-244,306) | (-950,1000) | 3 |
| UP3N | 2h20m9.5s | 42∘31′24′′ | 4.11 | 19.0 | 0.67 | 76.6 | 5.0 | (50,137) | (-450,1000) | 3 |
| DN1J | 2h21m57.3s | 42∘05′51′′ | 0.25 | 20.2 | 2.90 | 43.9 | 5.0 | (26,229) | (-450,850) | 2 |
| DN2J | 2h21m38.8s | 41∘57′29′′ | 1.82 | 17.5 | 0.93 | 68.1 | 10.0 | (52,246) | (-355,650) | 1 |
| DN3J | 2h21m18.8s | 41∘48′28′′ | 1.74 | 16.9 | 0.92 | 94.2 | 15.0 | (-85,248) | (-1000,850) | 3 |
| DN1N | 2h23m23.6s | 42∘17′07′′ | 0.33 | 18.4 | 2.29 | 26.7 | 7.5 | (-248,245) | (-450,900) | 3 |
| DN2N | 2h24m14.0s | 42∘13′21′′ | 2.53 | 18.0 | 0.81 | 53.6 | 10.0 | (-227,227) | (-1000,1050) | 3 |
| DN3N | 2h25m04.0s | 42∘09′36′′ | 2.53 | 18.0 | 0.81 | 80.3 | 10.0 | (-189,13) | (-400,650) | 3 |
| NGC 4565 (12h36m20.9s, 25∘59′23′′) | ||||||||||
| UP1J | 12h35m29.8s | 26∘12′37′′ | 0.25 | 17.6 | 2.52 | 55.3 | 5.0 | (132,278) | (-600,800) | 1 |
| UP2J | 12h35m02.9s | 26∘20′07′′ | 1.78 | 18.3 | 0.98 | 85.6 | 17.5 | (138,445) | (-775,800) | 3 |
| UP3J | 12h34m34.0s | 26∘27′17′′ | 1.84 | 18.3 | 0.97 | 115.9 | 5.0 | (147,249) | (-625,525) | 1 |
| UP1N | 12h36m52.3s | 26∘06′27′′ | 0.22 | 17.6 | 2.69 | 31.7 | 7.5 | (-256,311) | (-750,650) | 3 |
| UP2N | 12h37m23.7s | 26∘13′27′′ | 2.81 | 17.2 | 0.73 | 63.0 | 5.0 | (147,259) | (-350,750) | 3 |
| UP3N | 12h37m55.0s | 26∘20′24′′ | 2.81 | 17.2 | 0.73 | 94.0 | 5.0 | (162,210) | (-500,550) | 3 |
| DN1J | 12h37m05.9s | 25∘47′26′′ | 0.25 | 17.5 | 2.51 | 48.9 | 12.5 | (-309,-55) | (-750,700) | 3 |
| DN2J | 12h37m34.5s | 25∘40′04′′ | 1.76 | 18.1 | 0.98 | 79.6 | 5.0 | (-293,-148) | (-550,700) | 3 |
| DN3J | 12h38m03.0s | 25∘32′24′′ | 1.85 | 18.2 | 0.96 | 111.0 | 5.0 | (-196,-153) | (-350,50) | 2 |
| DN1N | 12h35m49.4s | 25∘52′13′′ | 0.22 | 17.6 | 2.67 | 31.3 | 5.0 | (-269,50) | (-900,900) | 3 |
| DN2N | 12h35m20.5s | 25∘45′49′′ | 4.05 | 17.7 | 0.63 | 59.9 | 5.0 | (-264,11) | (-650,1050) | 3 |
| DN3N | 12h34m49.1s | 25∘39′43′′ | 4.23 | 17.8 | 0.62 | 89.2 | 12.5 | (-285,5) | (-1000,625) | 3 |
-
•
“UP” and “DN” denote offset to higher and lower declination than the center of the target galaxy. Pointings along the major and minor axes of the target galaxy end with “J” and “N”, respectively. Pointing “nJ” is n9.1′ away from the edge of the H i disk measured in interferometric surveys (see Figure 1a), and pointing “nN” is n9.1′ away from the center of the galaxy, where 9.1′ is the FWHM size of the GBT beam. The transverse distances of the pointings from the center of the target galaxy are provided in the 7th column, adopting a distance of 9.2 Mpc/10.8 Mpc for NGC 891/NGC 4565 from Heald et al. (2012).
-
•
Effective exposure time teff = ttoff/(ton+toff). Where ton and toff are the integration times toward the on-source and the off-source pointings, respectively. To maximize teff, we maintain ton and toff to be the same.
-
•
The expected noise at km s-1 based on the radiometer equation.
-
•
The velocity resolution at which the spectrum is smoothed.
-
•
The velocity range over which the H i emission is detected.
-
•
The velocity range that we use to estimate the baseline.
-
•
The order of the best-fitted polynomial to describe the baseline.
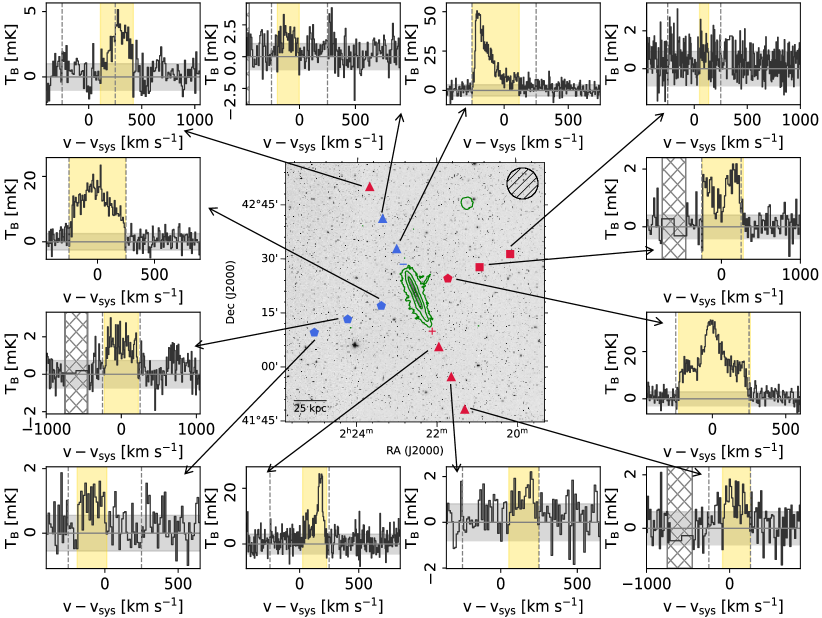
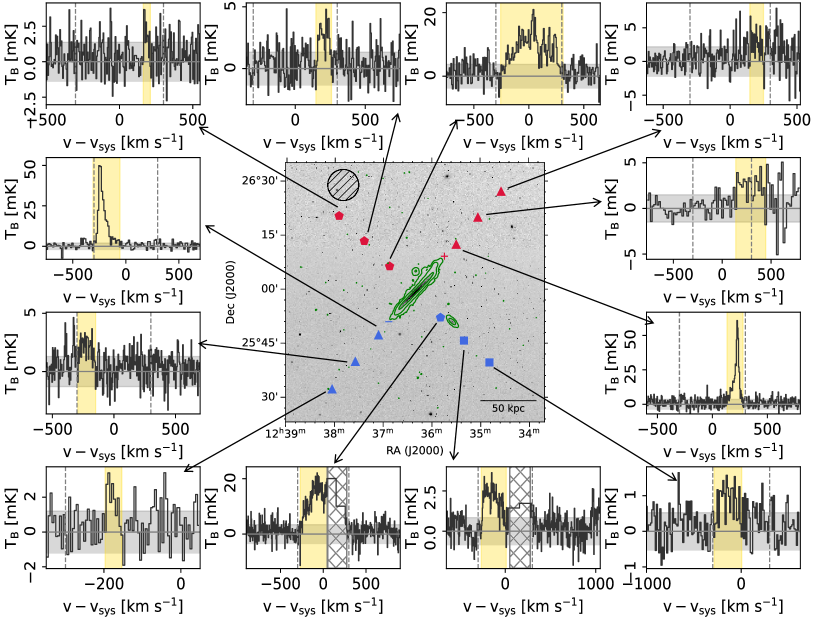
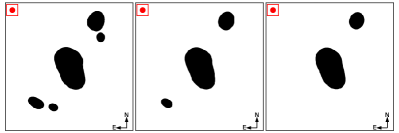
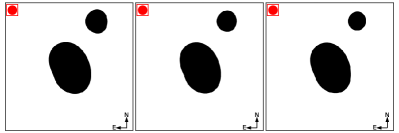
We observed the CGM of NGC 4565 and NGC 891 in 21-cm (1.42 GHz) emission as part of GBT projects 20B-360 (PI: Das) and 21B-324 (PI: Das). These observations add a total of eight new, deep spectra around NGC 891 and eight new, deep spectra around NGC 4565 (Figure 1a, triangles and squares). We combine these with observations from GBT project 15B-257 (Figure 1a, pentagons) published in D20. Including all observations, there are three pointings on each side of each target, with pointings stepping along the major axes (20B-360) and minor axes (15B-257, 21B-324), separated from one another by the FWHM beam size.
To minimize the contamination of the observed spectrum by emission from the disk, we choose the major axes pointings at least 1 FWHM beam size away from the edge of the H i disk measured in interferometric surveys (Figure 1a, contours), and minor axes pointings at least 1 FWHM beam-size away from the center of the galaxy. The details of the observations, including the sky direction of the pointings, the effective integration time at each pointing, , and the system temperature, Tsys are provided in Table 1.
We observed by position switching, using the L-band receiver with the Versatile GBT Astronomical Spectrometer (VEGAS; bandwidth = 23.5 MHz) as the backend. The off-source pointings are chosen to have the same declination as the target pointings and are placed away from the disk. This places the off-source pointing beyond the virial radii of the target galaxies. We also make sure that there is no known H i source within 1 FWHM beam size of the off-source pointings in the velocity range of concern. We used the quasars 3C 48 (in 15B-257, 20B-360) and 3C 123 (in 21B-324) as the primary flux calibrator for NGC 891 and 3C 286 for NGC 4565. The H i disk of each galaxy was observed before the observations of the CGM to verify the setup.
In project 20B-360, for the calibrator source of 3C 48 (3C 286), the average effective temperature of the noise diode, Tcal is 1.600.01 K (1.450.09 K) for the XX polarization and 1.580.01 K (1.660.09 K) for the YY polarization. When the polarizations are averaged to derive the Stokes I component, this translates to systematic uncertainty due to uncertain flux calibration. The systematic uncertainties in projects 21B-324 and 15B-257 are and , respectively.
We use an improved version of the routine developed in GBTIDL by D20 to reduce the position-switched data. We obtain the aperture efficiency and the atmospheric opacity at the zenith, which are used to derive Tcal, based on the elevation during each integration and at each frequency. We use that to construct an off-source spectrum from each off-source scan, then subtract this from the on-source spectrum corresponding to the adjacent on-source scan. The calibrated, off-subtracted spectrum of each scan in a session is then weighted by the combined integration time and system temperature of the on-off pair, teff/T, to calculate a combined spectrum. As part of the processing, we also identify channels visibly affected by RFI (radio frequency interference) and replace these with values linearly interpolated from nearby RFI-free parts of the spectrum.
We construct a spectrum at each pointing in each session for each polarization in units of brightness temperature, TB. We shift the velocity axis of each spectrum so that v km s-1 corresponds to the systemic velocity of the galaxy, vsys. This is 528 km s-1 for NGC 891 and 1230 km s-1 for NGC 4565 (Rupen, 1991). We accumulate the spectra from individual sessions at the native velocity resolution of 1.25 km s-1.
For each pointing, we combine the spectra for each polarization from all sessions, again weighted by the total teff/T for each single-session spectrum. Thus, we obtain the mean spectrum for each polarization, in units of brightness temperature. Finally, we average the two polarizations, which increases the final S/N by a factor of .
After constructing the final spectrum, we apply an iterative signal finding and baseline fitting technique, which we describe in Appendix A. The algorithm tests a variety of channel widths and baseline orders. It identifies regions of candidate emission, fits regions away from candidate emission, and subtracts the lowest order robustly-fitted polynomial baseline. Table 1 reports the optimum channel width , velocity range used for the baseline fit , the velocity range of identified emission , and the order of the polynomial fit . Because this differs somewhat from the approach used by Das et al. (2020), we also re-reduce, re-stack, and then fit new baselines to the spectra from that paper (project 15B-257). This gives us a single homogeneously reduced data set.
As a final check, we compare the RMS noise measured from signal-free regions of the baseline-subtracted spectrum with the noise expected based on the radiometer equation using teff and Tsys (Table 1). The measured RMS noise is on average a factor of and larger than the expected noise for NGC 891 and NGC 4565. This could be due to residual imperfections in the baseline subtraction that require higher-order polynomial or more sophisticated baseline fitting techniques. Below we use the measured RMS noise rather than the radiometer equation-based estimates, so we expect our S/N estimation to be conservative and capture this additional uncertainty.
3 Analysis
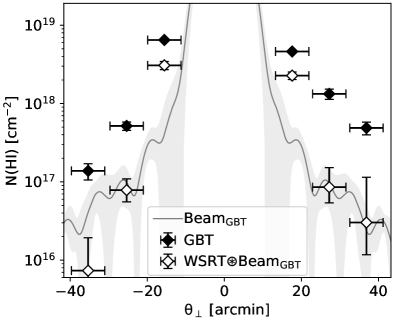
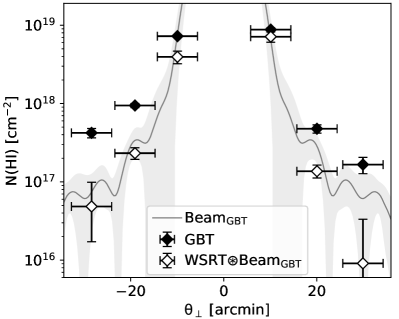
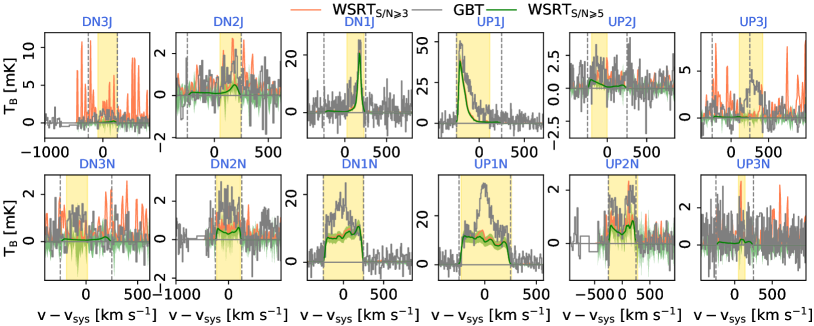
In the final spectra, we detect H i emission in most of the pointings (Figure 1a and 1b, yellow shaded area). We integrate each spectrum over the range of vemit to obtain the intensity, in units of K km s-1. We calculate the statistical uncertainty in the integrated intensity using , v and vemit. We add the systematic uncertainty in flux calibration (see §2) to the statistical uncertainty in quadrature. Except for the pointings immediately next to the H i disk, our detections at all other pointings lie below the sensitivity limit of the GBT-HALOGAS survey (P18).
We convert the integrated intensity at each pointing to column density, N(H i)GBT, assuming that the emission is optically thin and the number density of the gas is well above the critical density of H i for collisions with electrons (710-6 cm-3 at 104 K; Draine, 2011). We do not apply any correction for the inclination angle in computing the column density, because we do not know the geometry and morphology of the detected emission. We show the derived N(H i) as a function of galactocentric radius in Figure 3.
We calculate the intensity-weighted mean velocity over the range of vemit: . We also calculate the H i mass within each beam from the integrated intensities, adopting a gain of 1.86 K Jy-1. We quote the N(H i)GBT, the associated H i masses, and in Table 2.
3.1 Comparison with interferometric data
Our GBT spectra include emission both from high column density H i clouds and any diffuse, extended CGM structures. They may also include stray light from the disk of the galaxy, reflecting that even the relatively clean GBT beam can still pick up emission from the bright inner region of the galaxy. To help disentangle these components, we compare our GBT measurements to sensitive interferometric maps from the HALOGAS survey using WSRT (Heald et al., 2011). These interferometric data are sensitive to compact, high column density structures and they capture the main disk of the galaxy well, but they lack sensitivity to extended, low surface brightness structures.
To carry out a rigorous comparison, we convolve the masked interferometric data cubes with the GBT beam so that the interferometric data are at the angular resolution of the GBT. From the convolved interferometric maps, we can estimate the contribution of compact, relatively high column density structures to our observed GBT spectra, i.e., any extraplanar H i emission, and pickup of the galaxy disk from the sidelobes of the GBT beam. The excess in the GBT spectra compared to the spectra from convolved WSRT data cubes will correspond to the extended low column density structures missed by the interferometer.
| Pointing | N(H i) | M(H i)GBT | N(H i) | N(H i) | M(H i)CGM | ||
|---|---|---|---|---|---|---|---|
| (cm-2) | (km s-1) | (M⊙) | (cm-2) | (cm-2) | (km s-1) | (M⊙) | |
| (1) | (2) | (3) | (4) | (5) | (6) | (7) | (8) |
| NGC 891 | |||||||
| M(H i) = M⊙, SFR(d) = 2.2 M⊙yr-1, sSFR(e) = yr-1, M⊙ yr-1 kpc-2 | |||||||
| UP1J | 19.0820.0100.003 | -1235 | 4.10.1 | 18.6520.0050.042 | 18.880.03 | -8418 | 2.60.2 |
| UP2J | 17.6550.0690.003 | -10435 | 1.50.2 | 16.9920.1530.053 | 17.550.10 | -9130 | 1.20.3 |
| UP3J | 18.1510.0320.003 | 2821 | 4.80.3 | 16.1751.3750.038 | 18.150.04 | 26513 | 4.70.4 |
| UP1N | 19.1750.0080.001 | 62 | 5.00.1 | 18.8630.0030.081 | 18.890.08 | 232 | 2.60.5 |
| UP2N | 18.0640.0260.005 | 288 | 3.90.2 | 17.5610.0690.048 | 17.900.05 | 325 | 2.70.3 |
| UP3N | 17.1880.0970.005 | 901 | 5.21.2 | 16.4560.3560.092 | 17.100.15 | 8210 | 4.21.4 |
| DN1J | 18.5410.0260.003 | 1441 | 1.20.1 | 18.1850.0100.053 | 18.290.06 | 1112 | 6.51.0 |
| DN2J | 17.5470.0800.003 | 1541 | 1.20.2 | 16.8480.2130.053 | 17.450.11 | 14018 | 9.52.5 |
| DN3J | 17.7470.0620.003 | 728 | 1.90.3 | 16.7560.4290.033 | 17.700.08 | 631 | 1.70.3 |
| DN1N | 19.0340.0110.001 | -124 | 3.60.1 | 18.7720.0040.070 | 18.690.09 | -4413 | 1.60.3 |
| DN2N | 18.0800.0330.001 | -210 | 4.10.3 | 17.4840.0750.054 | 17.950.05 | -57 | 3.00.4 |
| DN3N | 17.5230.0590.001 | -8626 | 1.10.2 | 16.3990.6310.103 | 17.490.08 | -7925 | 1.00.2 |
| NGC 4565 | |||||||
| M(H i)= M⊙, SFR(d) = 0.67 M⊙yr-1, sSFR(e) = yr-1, M⊙ yr-1 kpc-2 | |||||||
| UP1J | 18.6650.0160.003 | 2150 | 2.10.1 | 18.3570.0040.048 | 18.370.06 | 2023 | 1.10.1 |
| UP2J | 18.1240.0650.003 | 2833 | 6.20.9 | 16.9330.1550.116 | 18.090.07 | 27340 | 5.81.0 |
| UP3J | 17.6890.0800.003 | 1911 | 2.30.4 | 16.4810.2630.207 | 17.660.10 | 18030 | 2.10.5 |
| UP1N | 18.9440.0220.004 | 326 | 4.10.2 | 18.8530.0030.065 | 18.220.30 | 12588 | 7.75.4 |
| UP2N | 17.6780.0520.004 | 2060 | 2.20.3 | 17.1350.0590.057 | 17.530.08 | 19520 | 1.60.3 |
| UP3N | 17.2210.1020.004 | 1811 | 7.71.8 | 15.9590.5810.320 | 17.200.12 | 17231 | 7.32.0 |
| DN1J | 18.8120.0140.003 | -21312 | 3.00.1 | 18.4880.0040.051 | 18.530.05 | -17858 | 1.60.2 |
| DN2J | 17.7140.0530.003 | -22455 | 2.40.3 | 16.8940.1160.079 | 17.640.07 | -21043 | 2.00.3 |
| DN3J | 17.1400.1020.003 | -17983 | 6.41.5 | 15.8660.6930.067 | 17.120.11 | -16954 | 6.11.6 |
| DN1N | 18.8600.0150.004 | -857 | 3.40.1 | 18.5960.0030.080 | 18.520.10 | -4539 | 1.50.4 |
| DN2N | 17.9750.0260.006 | -14117 | 4.40.3 | 17.3660.0540.050 | 17.850.04 | -12821 | 3.30.3 |
| DN3N | 17.6260.0590.006 | -13841 | 2.00.3 | 16.6860.2660.178 | 17.570.08 | -12734 | 1.70.3 |
-
•
The statistical uncertainty is followed by the multiplicative systematic uncertainty due to the variation in flux calibration from session to session.
-
•
The column density obtained from the masked WSRT data convolved with the GBT beam map, estimated over the velocity range where emission is detected in the GBT. Here, the statistical uncertainty is followed by the systematic uncertainty. The latter includes multiplicative systematic uncertainty due to averaging the azimuthally asymmetric GBT beam map to 1-D and additive systematic uncertainty in the masking threshold, added in quadrature.
-
•
The excess H i detected by the GBT compared to that by the WSRT, i.e., the diffuse N(H i) in the CGM. The error includes (in quadrature) the statistical uncertainties and systematic uncertainties in N(H i) measured by the GBT and WSRT.
-
•
Adapted from Heald et al. (2012)
-
•
Stellar mass adapted from Monachesi et al. (2016)
-
•
Obtained from Pingel et al. (2018)
Same as D20, we follow the method of 1) global noise estimation and 2) primary-beam correction of the low-resolution111 for NGC 891 and NGC 4565 WSRT data cubes, 3) masking of the primary-beam corrected WSRT data cubes, 4) circularization of the GBT beam model, 5) convolution of the masked WSRT data cube with the circularized GBT beam, and 6) estimation of the statistical uncertainty in the convolved WSRT spectra. The WSRT data cubes masked with S/N are used to calculate the best estimate of the spectra. The additive systematic uncertainty comes from the convolution of the WSRT data cubes that are masked with thresholds of S/N and S/N. In Appendix B we discuss why S/N is not a good mask. The circularized beam map accounts for the continuous change in the orientation of the GBT beam throughout the observation, but it averages out the details of the shape of the GBT beam. To account for the azimuthal asymmetry in the GBT beam, we incorporate a multiplicative systematic uncertainty that depends on the sky position of the pointing and thus is different for every pointing.
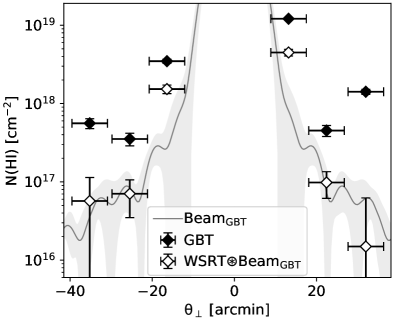
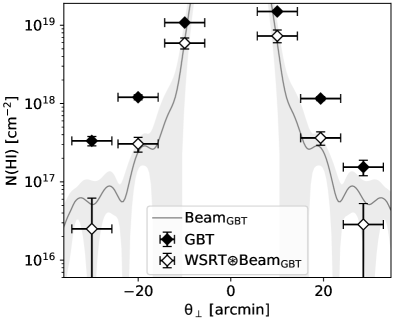
By integrating the masked and convolved WSRT spectrum over at each pointing, we obtain the H i column density from WSRT, N(H i)WSRT. We compare N(H i)GBT to N(H i)WSRT in Figure 3. We find two sets of results:
1) Outer halo (pointings UP/DN 2 and 3): There is significant excess in our GBT measurements compared to the WSRT estimates across most of the velocity channels of vemit (Figure C.1). The excess emission, N(H i)GBT–N(H i)WSRT, is 75% and 81% of the GBT emission, N(H i)GBT, of NGC 891 and NGC 4565, respectively.
Because the column densities at these pointings are way below the sensitivity limit of the WSRT data cubes (), the masked WSRT data cube is unlikely to have any high S/N emission within the main lobe of the GBT beam of these pointings. That means the masked and convolved WSRT spectra at these pointings represent the stray light from the H i disk and the extraplanar region. Therefore, the offset between the GBT and the WSRT estimates at these pointings is due to the diffuse H i emission from the CGM. From the diverse shape, velocity width, and amplitude of the emissions, we cannot determine whether it consists of extended H i structure and/or discrete H i clouds/clumps. It would require high-sensitivity interferometric measurements to distinguish between these cases.
2) Inner halo (pointings UP/DN 1): The emission detected in GBT at some of the velocity channels is explained by the WSRT. Thus the excess in GBT than WSRT is narrower than (Figure C.1). The excess emission accounts for 5411(42)% of the GBT emission of NGC 891 (NGC 4565). In addition to the stray light from the H i disk of the target galaxy and its companions (e.g., NGC 4562), the masked and convolved WSRT spectra at these pointings represent the small-scale H i in the extraplanar region. Thus, the offset between our GBT and WSRT columns at these pointings represents the diffuse and large-scale H i emission from the CGM. We test it more rigorously by redefining noise and masking through intermediate convolution in Appendix D and confirm this inference.
3.2 Properties of the CGM
We obtain the H i column density in the CGM, N(H i)CGM, by subtracting the H i column density of the masked and convolved WSRT spectrum from that of our GBT spectrum at each pointing:
| (1) |
The subscripts 1 and 2 correspond to the GBT and the WSRT, respectively. The column density of the H i disk, N(H i)disk, is not the same across all observing sessions of the GBT due to systematic errors. Also, they are not the same as the N(H i)disk estimated from the masked and convolved WSRT spectrum. Therefore, we apply their ratio as a correcting factor in the latter term in equation 1.
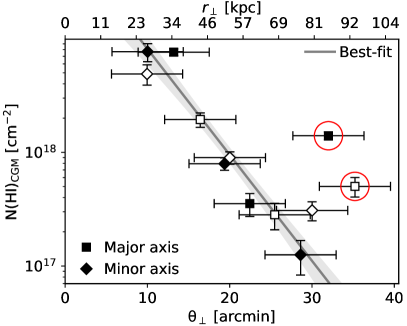
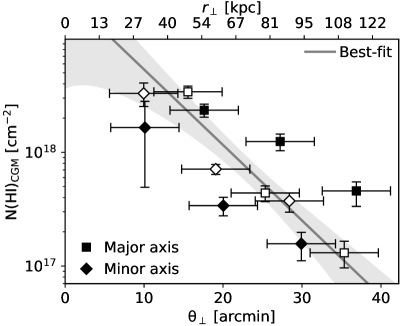
We fit the radial profile of N(H i)CGM as an exponentially decreasing profile:
| (2) |
The two parameters N(H i)o and are the central column density of H i and the scale radius. We also fit different subsets of the data to test the azimuthal symmetry and axial symmetry around the H i disk.
Using the best-fitted N(H i)CGM profile from equation 2, we calculate the H i mass in the CGM by integrating the surface mass density, , over the area of concern:
| (3a) | |||
| To calculate the mass within the main lobe of the GBT beam, we use the area | |||
| (3b) | |||
| with being the FWHM of the GBT beam. To calculate the mass in each quadrant, i.e., within of the major and minor axes, we use the area | |||
| (3c) | |||
We obtain the average line-of-sight velocity of the H i emission in the CGM, , using equation 4.
| (4) |
Here, brightness temperature is integrated over the velocity range of , and subscript 1 and 2 corresponds to the GBT and the WSRT, respectively.
We calculate the accretion rate using equation 5a. The assumed location of the circumgalactic H i is illustrated in Figure 7. We assume the velocity in the sky plane to be toward the galaxy disk (i.e., radially inward) and the same as our measured line-of-sight velocity.
| (5a) | |||
| Here the radial profile of comes from equation 2. For the major axes pointings, we estimate the accretion rate also using the angular velocity, in the disk plane: | |||
| (5b) | |||
4 Results and discussion
Below we discuss our results on the density, mass, velocity, and accretion rate of the detected H i in the CGM of NGC 891 and NGC 4565 and interpret them in the context of star-forming activities in these galaxies.
4.1 Density profile
We note the N(H i)CGM at each pointing in Table 2. We show the best-fitted radial profile of N(H i) in the CGM of NGC 891 and NGC 4565 in Figure 4.
In the CGM of NGC 891 we have excluded two pointings, UP 3J and DN 3J, from the fit (highlighted with red circles in Figure 4, left panel). These pointings are the farthest from the center of NGC 891 along the major axes. Because the velocity of the H i emission at UP 3J pointing is significantly different from its adjacent pointings (see Figure 1a), this emission might not be co-spatial with its adjacent pointings. Despite moving at similar velocities, the N(H i) toward DN 3J is larger than that toward DN 2J, which is not suitable for an exponentially decreasing radial profile. The excess N(H i) toward DN 3J than DN 2J might be a result of unresolved H i cloud(s) embedded in diffuse H i. Or, the radial profile of the diffuse H i column density at this radius might become flatter than an exponential. Verifying this scenario would require further deep and high-spatial-resolution observation around DN 2J–DN 3J pointings.
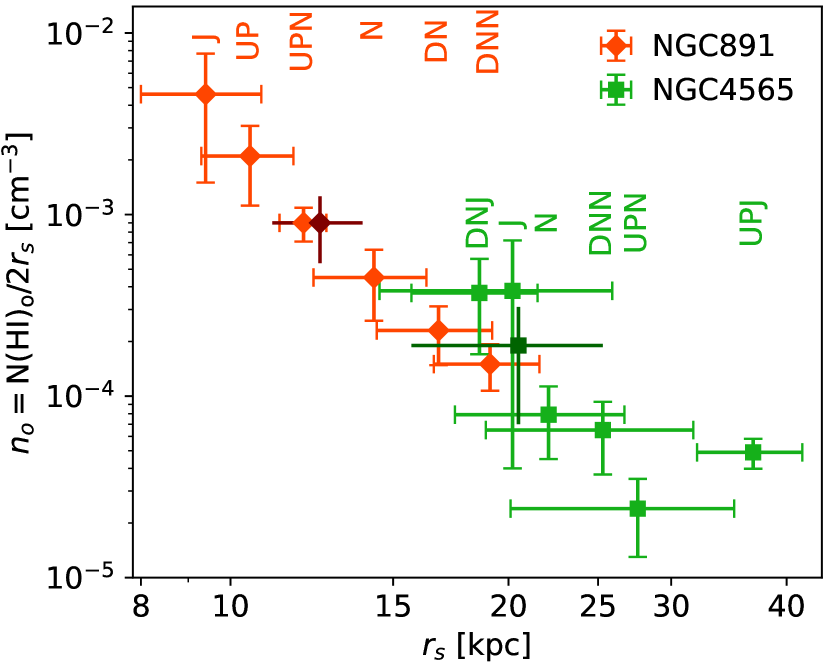
Overall, NGC 891 has a steeper profile with higher central H i density, N(H i), than NGC 4565. It results in times more H i in the extraplanar region (i.e., at and around UP/DN 1 pointings) of NGC 891 than NGC 4565. This ratio is similar to the ratio of SFR of these galaxies. This supports the “bathtub” model of star formation where the main factor controlling the SFR of a galaxy is the available H i in and around the galaxy disk (Dekel & Mandelker, 2014). Our result is qualitatively consistent with the finding of D20 based on the four pointing (blue triangles in Figure 1a and 1b) along the minor axes of these galaxies.
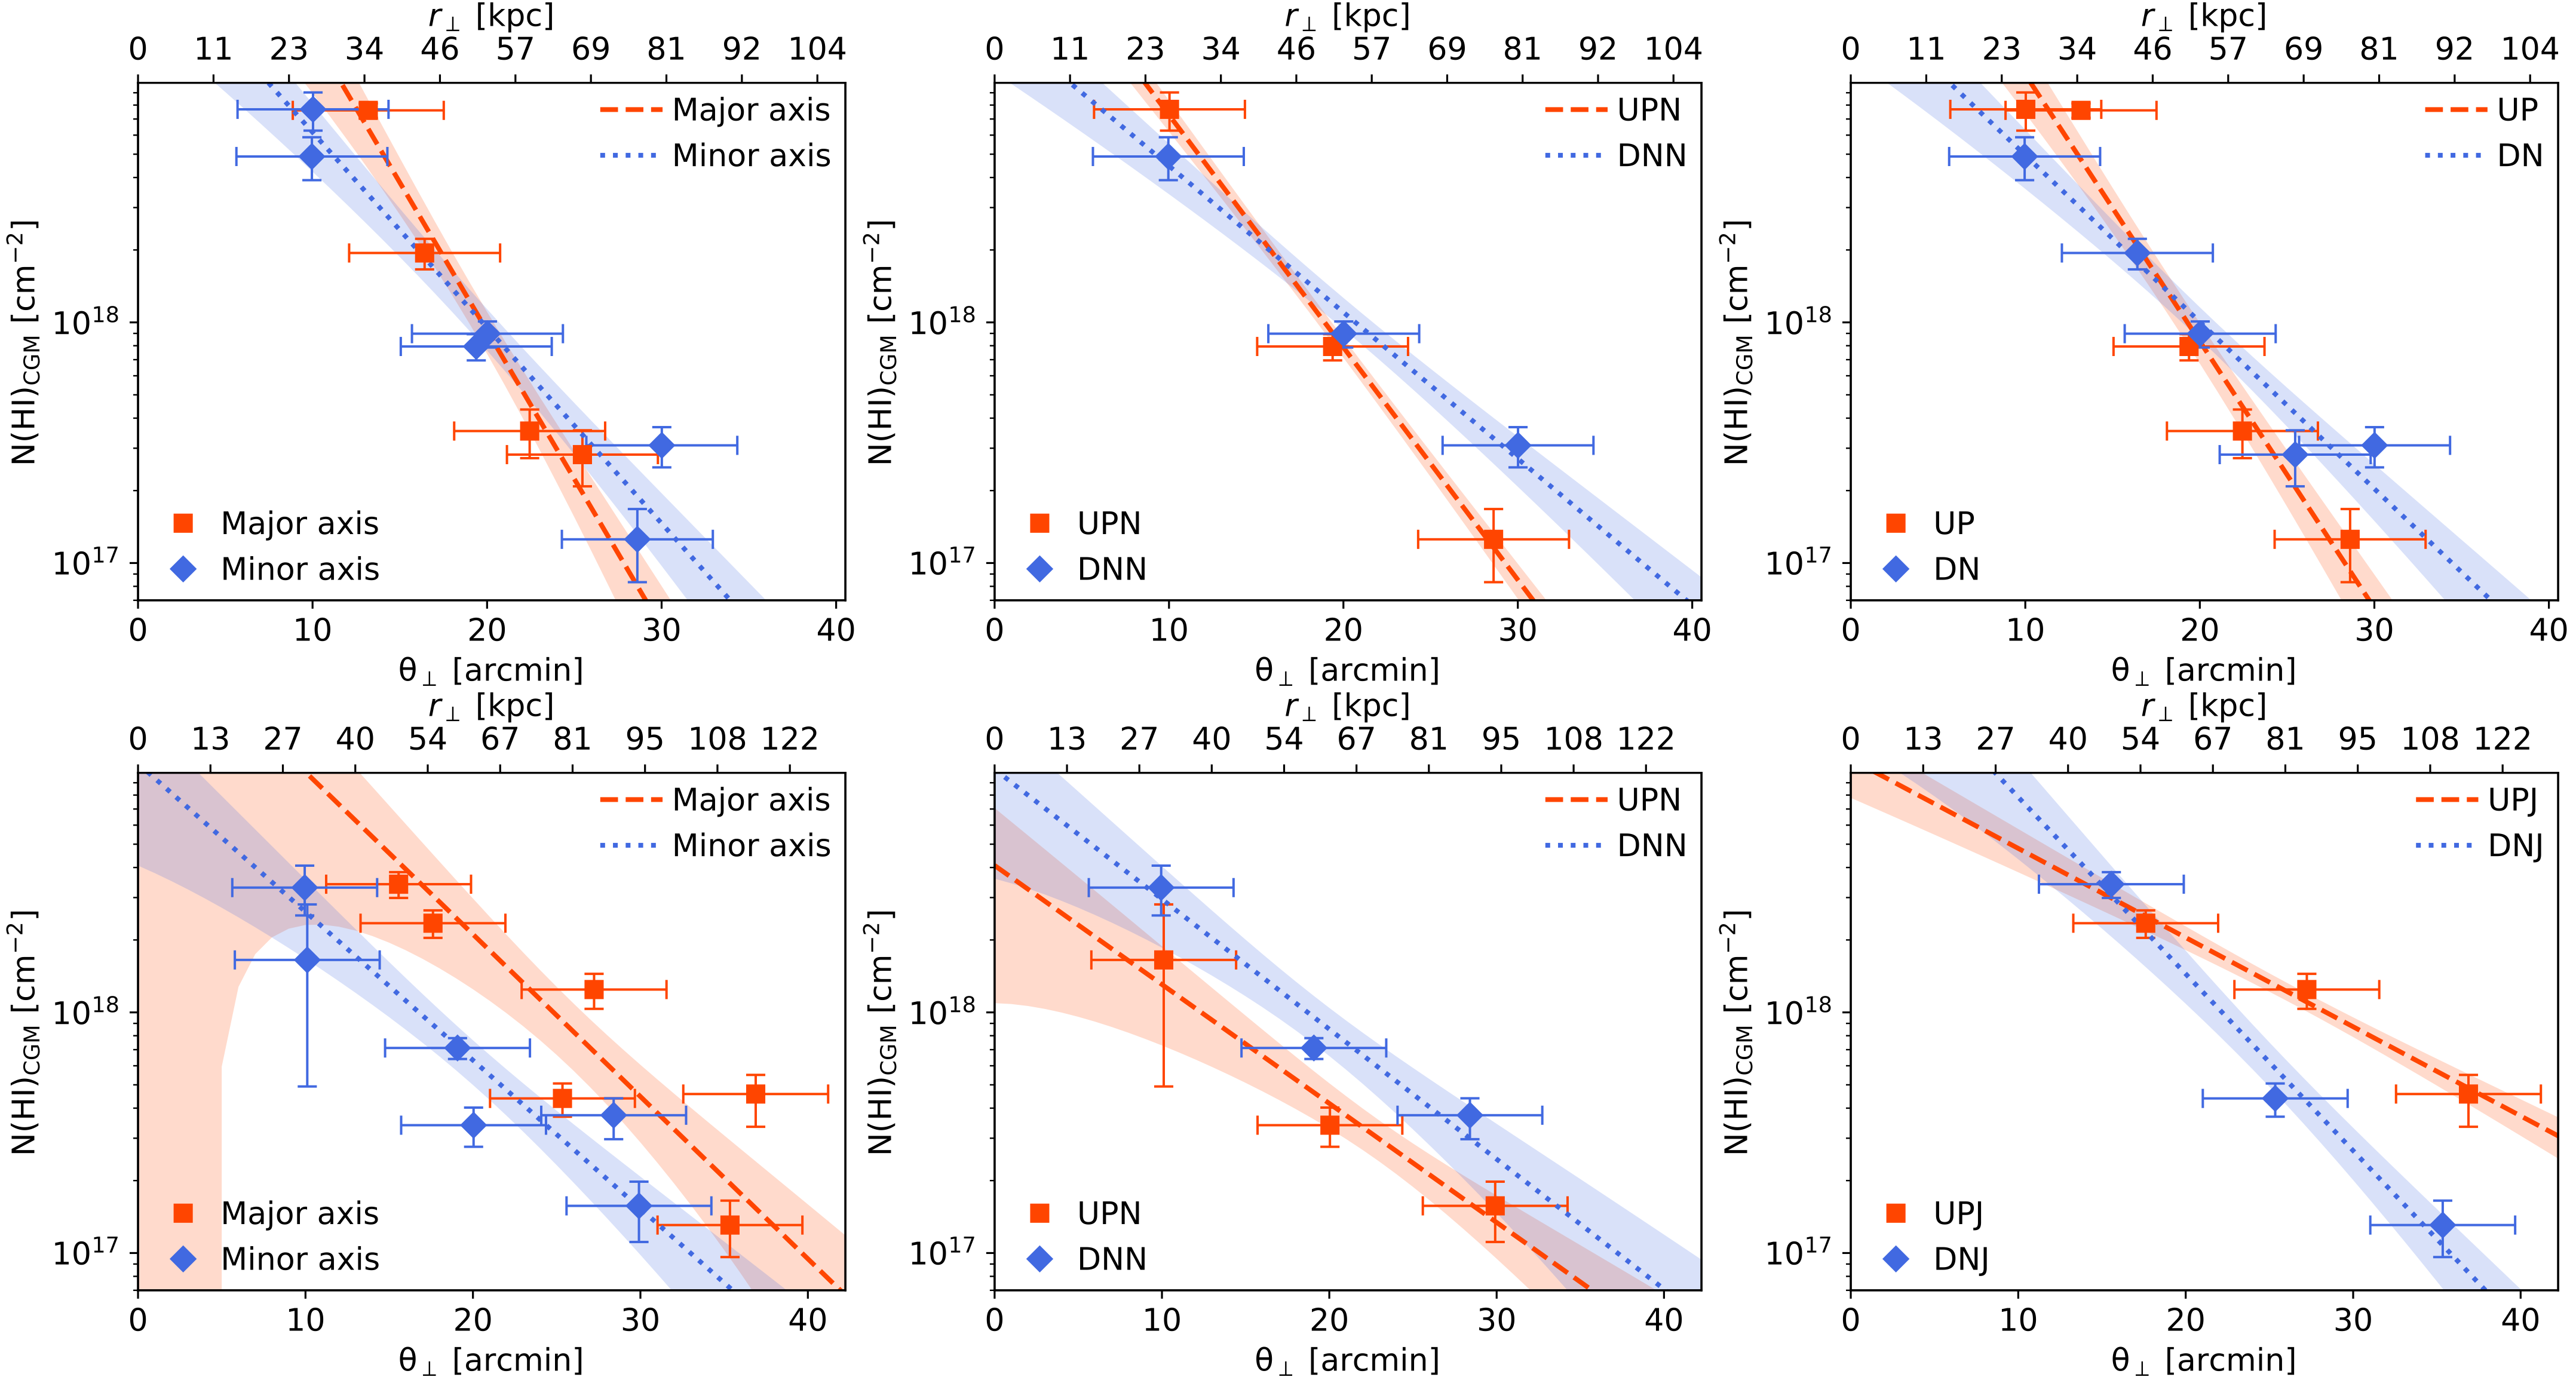
In Figure 5, we show the best-fits (panel b) and the best-fit parameters (panel a) for the different subsets of our data: pointings only along the major axes (‘J’) or minor axes (‘N’), only at higher declination (‘UP’) or lower declination (‘DN’) than the H i disk, etc. In each galaxy, the scatter of across 2 orders-of-magnitude and scatter of across a factor for these different subsets indicate that the circumgalactic H i is not symmetric in two sides of the disk and along the azimuth.
4.1.1 NGC 891
H i profiles are different along the major and minor axes, with the major axis having a denser and steeper H i profile (Figure 5(b), top left). It could be due to the active accretion of H i from the CGM to the disk along the major axis.
The H i profiles along the minor axis are different on two sides of the disk (Figure 5(b), top middle), with the higher declination side of the disk (‘UPN’) having a denser and steeper H i profile. There is already a galactic fountain along the minor axis (Oosterloo et al., 2007; Fraternali & Binney, 2008). Thus the H i asymmetry in two sides of the disk along the minor axis might be due to a diffuse extended part of the fountain which is not mapped in shallow WSRT observations.
We also fit the major and minor axes pointings at higher declination, i.e., UP J and UP N together, and compare it with lower declination pointings (Figure 5(b), top right panel). It essentially splits the data into two diagonal sides of the disk, northwest and southeast, respectively. The H i profile is denser and steeper at the higher declination (‘UP’) pointings. There is a H i filament (Oosterloo et al., 2007) toward UGC 1807 in the northwest of NGC 891 (green contours in the DSS image of Figure 1a). Thus the H i asymmetry in two diagonal sides of the disk might be the result of a diffuse extended arm of that filament which is not captured in shallow interferometric maps.
What is the origin of H i at UP3J?
Given the shape and width of the H i spectrum and the mass of the H i emission at the UP 3J pointing of NGC 891 (top left panel of Figure 1a), we cannot rule out the possibility of a dwarf galaxy. However, we did not find any known object within 10′ of this pointing at the similar line-of-sight velocity of the detected H i emission in NED222https://ned.ipac.caltech.edu/conesearch. Its velocity offset from the systemic velocity of NGC 891 is similar to the high-velocity clouds found in the CGM of Milky Way (Putman et al., 2012; Richter et al., 2017). Whether or not the H i emission detected at this pointing is a high velocity H i cloud in the CGM of NGC 891 and/or a yet undetected dwarf galaxy needs further investigation with deep interferometric and optical surveys, respectively.
4.1.2 NGC 4565
Along the major and minor axes, the H i profiles have similar slopes (Figure 5(b), bottom left). The best-fit is higher by a factor of 4.8 along the major axis possibly due to active accretion, but it is consistent with along the minor axis due to the large errors in density estimate along the major axis (Figure 5(a)).
The lower declination side of the disk along the major axis (‘DNJ’) has a denser and steeper H i profile than the higher declination side (Figure 5(b), bottom right). The asymmetry might have caused/be caused by the strong warp around the disk of NGC 4565 observed in 21-cm (Zschaechner et al., 2012). Also, NGC 4565 hosts 5-6 dwarf galaxies (Carlsten et al., 2020) along the higher declination arm (‘UPJ’). The flatness in the H i profile on this side might be due to ram-pressure/tidally stripped H i from these dwarf satellite galaxies.
Along the minor axis, the H i profiles have similar slopes on both sides of the disk, but is larger on the lower declination side of the disk (‘DNN’), resulting in more H i mass in the CGM (Figure 5(b), bottom middle). This enhancement could be due to tidal interactions between the H i disks of NGC 4565 and its companion NGC 4562 to the southwest (contours in the DSS image of Figure 1b).
Thus, the detected circumgalactic H i can be primarily explained by a diffuse extended H i, with some H i clouds embedded in it, and the interaction of the target galaxies with their companions.
4.2 Mass
We note the M(H i)CGM at each pointing within the beam in Table 2. For NGC 891 (excluding the UP3J/DN3J pointings), M(H i)CGM along and around (within ) the major and minor axes are M⊙ and M⊙, respectively, resulting in total mass of M⊙. For NGC 4565, M(H i)CGM along and around the major and minor axes are M⊙ and M⊙, respectively, resulting in the total mass of M⊙.
Thus, both galaxies have more mass along the major axes than the minor axes, indicating active accretion along the major axes. The masses quoted in D20 based on minor axes pointings and assuming azimuthal symmetry were underestimated.
M(H i)CGM is % and % of the M(H i)disk of NGC 891 and NGC 4565, respectively. Based on the GBT and WSRT measurements within 50 kpc of NGC 891 and NGC 4565, P18 estimated , the fraction of H i mass below N(H i) = 1019 cm-2 to be 0.4–0.6% and 0.7–0.9%, respectively. Our measurement is larger than the estimation of P18 by an order of magnitude. It suggests the presence of a large amount of diffuse, extended H i with N(H i) below cm-2, extending beyond 50 kpc. This emission might have been missed due to the lower sensitivity of the GBT observations presented in P18. Also, in P18 was based on azimuthal averages in circular annuli around the galaxies, whereas we focus on pointings along principal axes. Therefore, most of the circumgalactic H i could be concentrated along principal axes of the galaxies, leading to a higher estimate in our case.
The depletion timescale, (M(H i)disk + M(H i) is Gyr for NGC 891 and Gyr for NGC 4565. By combining this information with the amount of H i in the extraplanar region estimated in the previous subsection, we infer the following. NGC 891 might have accreted most of its star-forming fuel by now and will soon run out of fuel unless there is a huge H i reservoir in the regions not probed in our observations – regions away from the principal axes, and regions at the larger galactocentric radius. NGC 4565, on the other hand, is forming stars almost quiescently; it has an ample supply of H i to continue forming stars at this rate.
4.3 Velocity
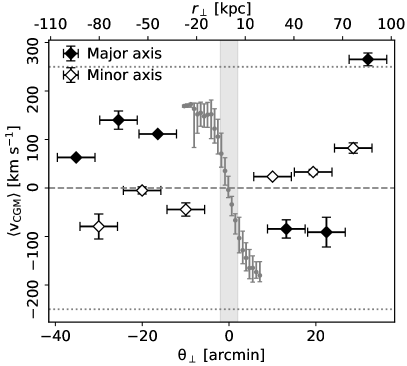
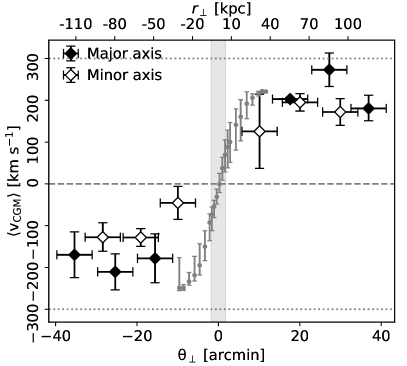
We show the line-of-sight mean velocity of the circumgalactic H i in Figure 6 and quote them in Table 2. Except for the UP 3J pointing of NGC 891, the velocities at all other pointings of both galaxies display interesting trends that we discuss below.
4.3.1 Major axis
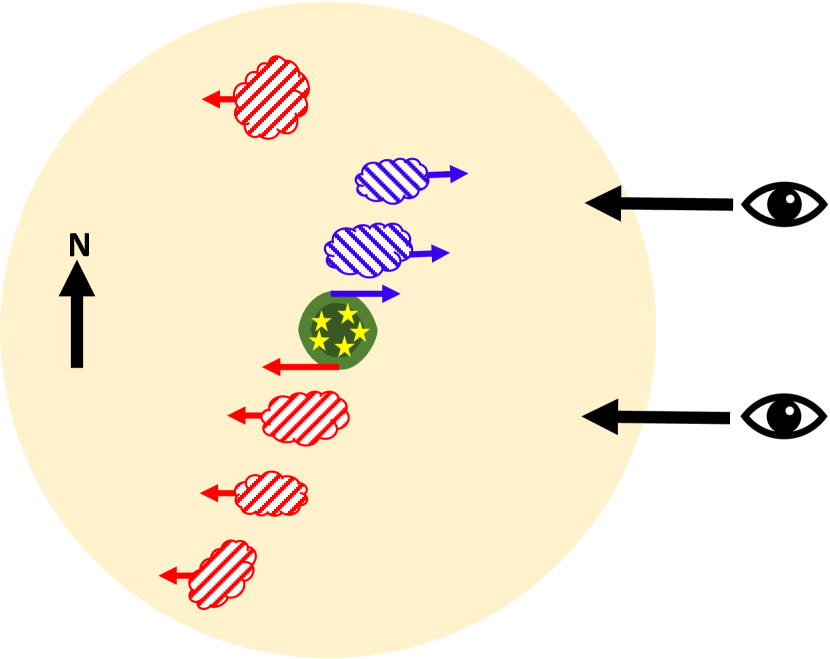
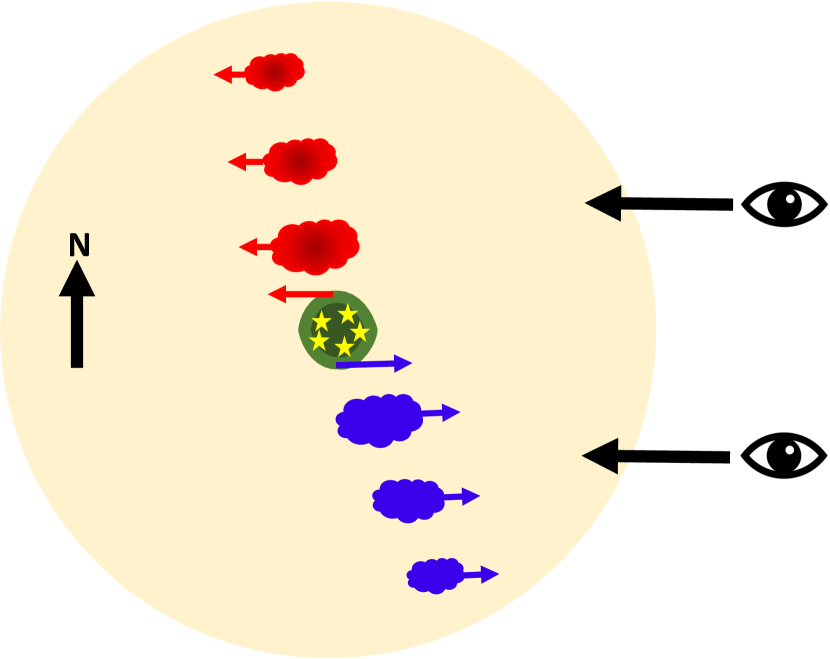
In both galaxies, the H i velocity in the CGM along the major axes is aligned with the disk rotation (illustrated in panels (a) and (b) of Figure 7). Such co-rotation has been observed previously in a few Mg ii absorbers at (Ho et al., 2017; Martin et al., 2019) and at (Zabl et al., 2019) and in one Ly absorber at (Weng et al., 2023), but not in H i emission at . It could be the neutral CGM that is accreting onto the disk keeping the angular momentum conserved.
Otherwise, the H i disk might not truncate sharply and could be larger than what is found in shallow () interferometric observations (the green contours on DSS images in Figure 1a and 1b). In that case, our detected H i would be the outer part of an extended H i disk. The column density of this co-rotating H i is consistent with the predicted “proto-disk” extended out to 80 kpc, modulo the degeneracy between the volume-filling factor, covering fraction and intensity of the cosmic ionizing background (Bland-Hawthorn et al., 2017).
Distinguishing between the scenarios of a co-rotating neutral CGM or an extended H i disk is beyond the scope of this paper. It would require deep co-spatial observations of H emission and H i emission at high angular resolution in the future.
4.3.2 Minor axis
The velocities of circumgalactic H i along the minor axes show a similar gradient in both galaxies (Figure 6), although the velocities are smaller in NGC 891 than NGC 4565.
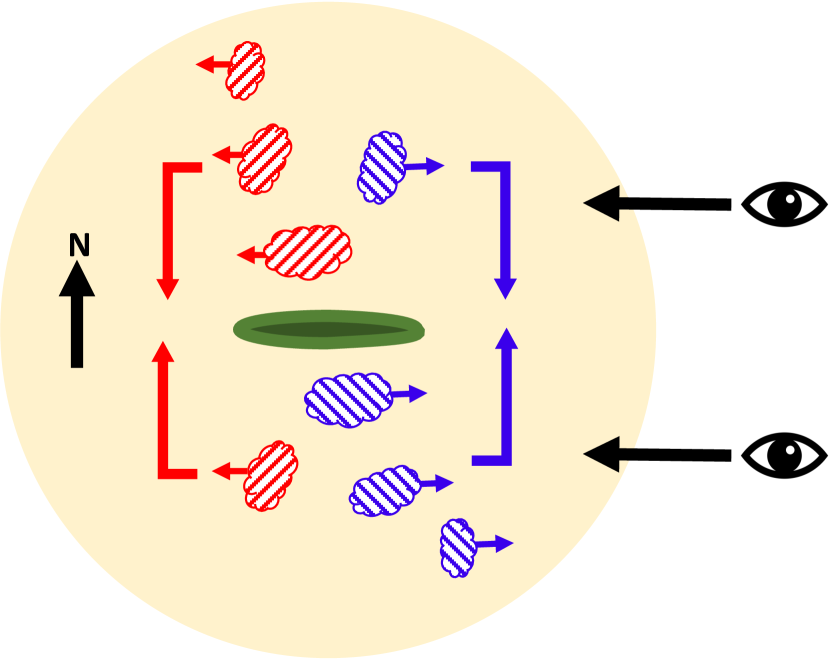
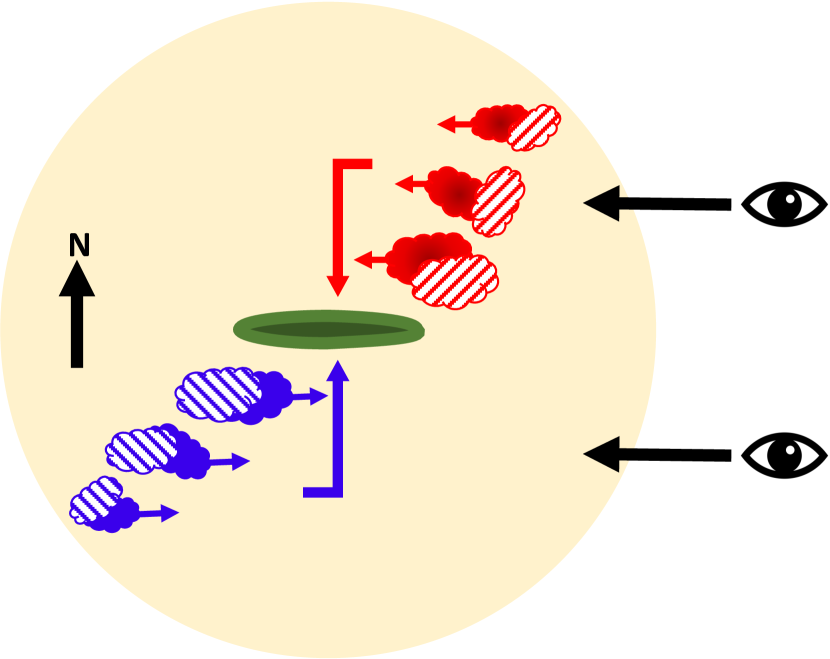
Here the velocity profile is complicated by the possibility of inflow, fountain, or outflow. The interpretation of a pure inflow or a pure outflow is degenerate to the location of the H i emitter in the CGM along our line-of-sight. In an inflow, the redshifted/blueshifted emission is on the nearer/farther side of the disk than the observer (panel (d) of Figure 7). The fountain, in principle, has both outflowing and inflowing components. If the fountain is not perfectly aligned along the minor axis, the mean line-of-sight velocity would depend on whether it is titled toward/away from the observer. If the redshifted/blueshifted emission is on the farther/nearer side of the disk, it would be an outflow or fountain if its velocity in the sky plane is away from or toward the disk, respectively.
In NGC 891, the presence of a galactic fountain is already known from the increasing lag in rotation with height (Oosterloo et al., 2007; Fraternali & Binney, 2008, also discussed in §4.1). Our observed velocity gradient could be due to a cosmic inflow and/or a diffuse extended part of the fountain that is tilted away from us. In the latter scenario, the smaller velocities compared to the maximum rotational velocity of the disk could be due to H i emitters moving at opposite velocities in the fountain suppressing the mean velocity (panel (c) of Figure 7).
NGC 4565 hosts a low-luminosity type 2 AGN (Véron-Cetty & Véron, 2000), which could be responsible for a nuclear outflow. Also, based on 144 MHz observations tracing the non-thermal emission from cosmic ray electrons in the extraplanar region of NGC 4565, Heesen et al. (2019) argue that NGC 4565 could be in transition from a weak outflow-dominated phase to an inflow-dominated phase in the past 40 Myr. Thus we cannot conclusively comment on the origin of the H i emitters along the minor axis of NGC 4565 without constraining their velocity in the sky plane. While inflows and outflows should have distinct metallicity, measuring it might not be useful in reality as the CGM is predicted to be inhomogeneously mixed in simulations and there is no observational evidence for a correlation between absorber metallicity and azimuthal angle (Martin et al., 2019; Weng et al., 2023).
4.4 Accretion rate
In NGC 891, the total accretion rate, , at the position of all observed pointings integrated within the GBT beam is . For all pointings except UP3J and DN3J (as they were excluded from the fitting of N(H i)CGM in §4.1), we extend the accretion rate calculation to each quadrant in the CGM (i.e., region around the major and minor axes) assuming azimuthal symmetry, and obtain of . Adding it to the accretion rate measured within the GBT beam of the excluded pointings, the total is . along the major and minor axes are and .
In NGC 4565, the total at the position of all observed pointings integrated within the GBT beam is . Extending the accretion rate calculation to each quadrant in the halo, we obtain a total of . along the major and minor axes are and .
Using the second definition of accretion rate (equation 5b), along the major axes of NGC 891 and NGC 4565 are and , respectively.
Thus, the total accretion rate in both galaxies is similar, and it is larger along the major axes (irrespective of the definition of accretion rate used) than the minor axes, indicating active accretion onto the disk. The specific star formation rate, sSFR = SFR/M⋆, and surface density of SFR, are an order-of-magnitude larger in NGC 891 than NGC 4565 (see Table 2). Despite this difference, the similarity in H i accretion rate suggests that the intermediate stages between the accumulation of H i and star-formation, e.g., the H i – conversion, are inefficient in NGC 4565 compared to NGC 891.
4.4.1 Tracing accretion: found or missing?
In NGC 4565, is . Because we cannot distinguish between an outflow or an inflow along the minor axis of NGC 4565, excluding the estimates along the minor axis, we obtain of (or using the second definition of accretion rate in equation 5b). This is arguably the first galaxy where the accretion rate is consistent with the SFR. It implies that the CGM of NGC 4565 is continuously supplying H i to the disk for a sustainable star formation. Excluding NGC 4562 and IC 3571 that are already detected in WSRT maps, NGC 4565 hosts 19 dwarf galaxies down to within 150 kpc (Carlsten et al., 2020), with H i masses of each being M⊙(Karunakaran et al., 2022). Determining if the accreting H i is dominated by the cosmic inflow or the ram-pressure/tidally stripped H i from these satellite galaxies is beyond the scope of this paper. If H i along the minor axis pointings trace an outflow, the mass-loading factor, , is .
In NGC 891, is (or using the second definition of accretion rate in equation 5b). Thus, 60–90% of the required accreting material is still missing. Below we discuss some of the possibilities of where the missing accretion could be:
-
1.
Beam smearing: If the length scale of the H i in the sky plane is smaller than the GBT beam, its intensity could be underestimated due to the GBT beam smearing that dilutes the intensity of any probed structure. The smaller the size of the H i emitters, the higher the dilution. The WSRT can capture up to the length scale of which is larger than the GBT beam. Thus the beam smearing is not expected to affect the excess H i detected by the GBT than the WSRT. However, our GBT observation is more than 2 orders-of-magnitude deeper than the WSRT maps. Thus, some of the excess H i detected by the GBT could be smaller than the GBT beam whose column density is below the sensitivity of the WSRT maps. While we can rule it out for pointings close to the disk (Appendix D), it remains plausible for the far-away pointings.
-
2.
Opacity: If the length scale of the H i along the line of sight is smaller than that assumed here, the number density and hence the opacity of the measured H i would be higher. Thus, for a given intensity, the column density would increase after correcting for the self-shielding. This is more likely to be the case for the major axis pointings if the corotating H i we find in §4.3 is genuinely the outermost disk instead of the CGM.
-
3.
Sky-plane motion: We have calculated the accretion rate based on the line-of-sight motion. If the circumgalactic H i is spiraling in with the velocity in the sky plane being larger than the line-of-sight velocity, the accretion rate could be larger.
-
4.
Ionization: Given the mass of NGC 891, it is likely a “hot mode” accretion where the H i forms out of the hot CGM. Near the galaxy disk, H i is pressure confined due to the larger density and temperature of the hot CGM. At the interface of the hot ionized CGM and the neutral CGM, partially ionized warm/cool CGM can form because of thermal conduction and enhanced cooling rate due to condensation (Li et al., 2020). If our detected H i is partially ionized, the mass of H i containing gas would be higher than the current estimate. The hydrogen is rapidly ionized at K, thus a 60–90% ionization is not impossible.
-
5.
Off-axis: If most of the accretion is happening away from the principal axes, the accretion rate might have been underestimated.
-
6.
Larger distance: There might be more H i, diffuse and/or compact, at larger impact parameters. The H i is less likely to be destructed at large galactocentric distances due to the lower density of the surrounding hot CGM (Li et al., 2020). Whether or not it immediately contributes to the SFR would depend on its density and velocity.
Testing these possibilities would require highly sensitive mapping of the whole CGM out to the virial radii of these galaxies using single-dish and interferometers in the future.
4.4.2 In-situ fueling
Most of the discussion has assumed that the circumgalactic H i contributes to the star formation in the disk. However, if there is in-situ star formation in the CGM of these galaxies, the circumgalactic H i might be locally supplying fuel to those star formation hubs.
NGC 891 has abundant stellar structures in its CGM, e.g., a thick star-forming cocoon extended out to 40 kpc/15 kpc along the major/minor axis, a giant 90 kpc stellar stream, a few arching stellar streams up to 50 kpc looping around the stellar disk and a stellar halo extended out to 50 kpc (Mouhcine et al., 2010; Monachesi et al., 2016). NGC 4565 has a 60 kpc stellar halo, but it is more massive, flatter, and is a larger fraction of the stellar disk mass in NGC 891 than in NGC 4565 (Harmsen et al., 2017). The stellar metallicity, [Fe/H], steeply declines radially in the stellar halo, implying a comparatively young stellar population in the CGM (Monachesi et al., 2016). NGC 4565, showing no evidence of stellar streams/cocoons, has its stellar disk sharply truncated at 3 kpc/26 kpc along minor/major axis (Martínez-Lombilla et al., 2019). The inner CGM of NGC 891 has an extended dust component likely embedded in an atomic gas (Howk & Savage, 1997; Bocchio et al., 2016; Yoon et al., 2021) while NGC 4565 does not have any (Howk & Savage, 1999). Also, NGC 891 has only 7 (3 confirmed) dwarf satellite galaxies within 200 kpc (Carlsten et al., 2022), while NGC 4565 has 21 satellite galaxies within 150 kpc (Carlsten et al., 2020). Whether some of the stellar structures in the CGM of NGC 891 are disrupted satellites, and whether NGC 891 might have accumulated H i through minor mergers with its satellites in the past are not currently constrained.
Thus, the H i in the CGM of NGC 891 and NGC 4565 might have different origins. The circumgalactic H i might be locally fueling star formation in the CGM of NGC 891. In that scenario, the line-of-sight velocities of H i would follow that of the stellar structures in the CGM. NGC 4565, on the other hand, might be accreting through tidally/ram-pressure stripped H i from its satellites. This might explain the different velocities of circumgalactic H i in these galaxies.
5 Conclusions
In this paper, we have extended the study of Das et al. (2020) and presented the GBT observations of NGC 891 and NGC 4565 in 21-cm emission along their major axes out to kpc in the CGM, and also revisited the observations in D20. Instead of the traditional mapping which is more expensive due to the required exposure time, we stare at a few selected (24) pointings for hours and achieve an unprecedented sensitivity of cm-2 for 20 km s-1 velocity width at 5 km s-1 velocity resolution.
We substantially revised our GBT data reduction routine and the baseline subtraction method. We follow the methods outlined in \al@Pingel2018,Das2020b; \al@Pingel2018,Das2020b to compare our GBT observation and interferometric WSRT maps from the HALOGAS survey. We include the systematic uncertainty to account for the azimuthal asymmetry in the GBT beam and the variation in position angle throughout our GBT observation. We also rigorously test the angular size of the detected diffuse H i by redefining noise and masking through intermediate convolution of the WSRT data cubes. Below we list our scientific results:
-
1.
We detect H i emission at all GBT pointings at significance including systematic uncertainties, with 3 pointings below .
-
2.
More than % and of the H i emission detected by the GBT at small and large impact parameters cannot be explained by the WSRT maps. It implies the presence of a diffuse neutral CGM. The shape, velocity width, and column density of the diffuse H i are quite diverse, indicating a complex morphology and kinematics.
-
3.
The CGM of NGC 891 has a steeper profile than NGC 4565, with the ratio of H i mass in the extraplanar region being . It is consistent with their SFR ratio, supporting the “bathtub” model of star formation.
-
4.
The N(H i) profiles have different normalizations and scale radii for different subsets of the data, indicating a lack of azimuthal symmetry and axial symmetry around the H i disk. These asymmetries can be attributed to the diffuse extended arm of the filament and fountain of NGC 891, ram-pressure stripped H i from the satellite galaxies of NGC 4565, and tidal interaction with the companion galaxies of NGC 891 and NGC 4565.
-
5.
The mass ratio of H i in the CGM and the disk is and for NGC 891 and NGC 4565, an order of magnitude larger than previous estimates based on shallow ( cm-2) GBT mapping within 50 kpc of these galaxies.
-
6.
The velocity of the diffuse H i along the major axes pointings are aligned with the disk rotation in both galaxies, suggesting a corotating CGM or the outer part of an extended H i disk. Along the minor axes pointings, the velocities resemble the signatures of an inflow and/or a galactic fountain in NGC 891. In NGC 4565 we cannot distinguish between the scenarios of an inflow or an outflow.
-
7.
The depletion timescale and accretion rate in NGC 4565 are Gyr and M⊙ yr-1, large enough to sustain its star formation. NGC 891, with of the required accreting material still missing, would run out of its raw fuel by Gyr.
The Parkes-IMAGINE (Imaging Galaxies Intergalactic and Nearby Environments) survey has mapped the entire CGM of 28 nearby galaxies in H i, reaching sensitivities comparable to our GBT observation (Sardone et al., 2020). In the future, coordinated and deeper interferometric surveys and single-dish observations outfitted with phased array feeds or FLAG (The Focal L-band Array for the GBT; Pingel et al., 2021) architecture would substantially improve our understanding of the large-scale H i accretion in the CGM, the true radial extent of H i disk, and the relation between H i accretion and star-formation in the disk. Measurements of low ionized metal absorbers would constrain the gas-phase metallicity and the ionization fraction of the H i emitters. Along with kinematic information, it would help disentangle the origin of circumgalactic H i unambiguously and better understand the role of H i in galaxy evolution.
acknowledgments
We thank the anonymous referee for the constructive comments and suggestions. The Green Bank Observatory is a facility of the National Science Foundation operated under a cooperative agreement by Associated Universities, Inc. This research made use of data from Westerbork Synthesis Radio Telescope (WSRT) HALOGAS-DR1. The WSRT is operated by ASTRON (Netherlands Institute for Radio Astronomy) with support from the Netherlands Foundation for Scientific Research NWO. S.D. acknowledges support from the Presidential Graduate Fellowship from the Ohio State University, and KIPAC Fellowship from KIPAC, Stanford University. DJP acknowledges support from the South African Research Chairs Initiative of the Department of Science and Technology and the National Research Foundation. This research has made use of NASA’s Astrophysics Data System Bibliographic Services.
Data Availability
The raw GBT data presented here is publicly accessible in the NRAO archive333https://data.nrao.edu/portal/. The WSRT data cubes are in the HALOGAS444https://www.astron.nl/halogas/data.php website. The reduced and analyzed data are available from the corresponding author upon reasonable request.
Appendix A Baseline subtraction
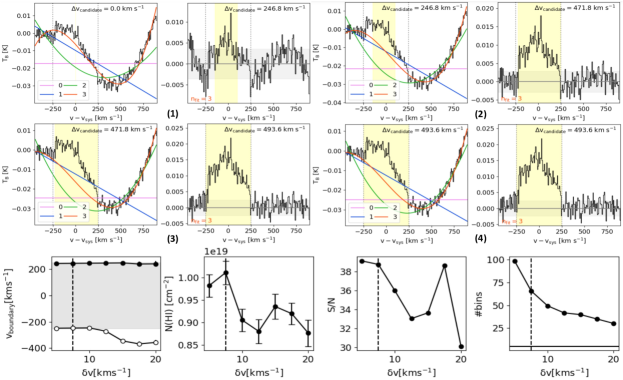
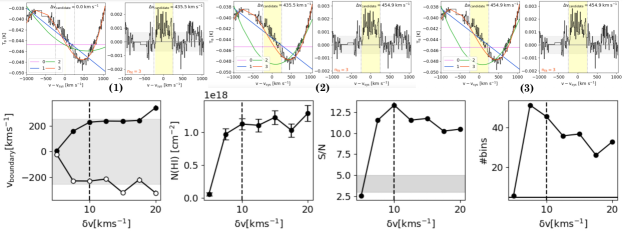
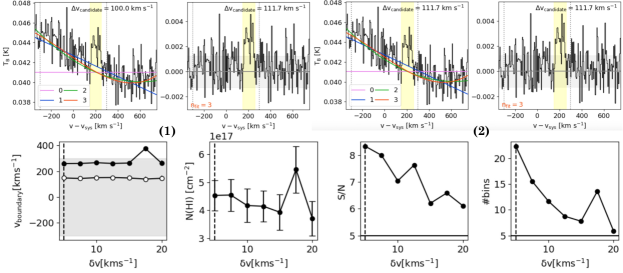
We use an iterative approach to fit and subtract polynomial baselines from our final averaged spectra. The goal of the technique is to identify the signal-free regions of the spectrum and then to fit and subtract the lowest-order polynomial that yields a good fit to these signal-free regions. To accomplish this we need to identify the likely velocity range of emission and then fit and subtract the baseline.
The procedure, which is illustrated for one pointing in Figure A.1, proceeds as follows:
-
1.
To identify the velocity range of the possible signal, we create boxcar smoothed versions of the spectrum at a series of progressively lower velocity resolutions from to km s-1 in steps of 2.5 km s-1. Smoothing reduces the noise in the spectrum and makes it easier to identify possible signals at the expense of losing information on the velocity structure of emission.
-
2.
For each smoothed version of the spectrum, we start with a large velocity range to estimate the baseline. We mask the emission from the Milky Way so that it does not contaminate the baseline.
-
3.
To determine an approximate velocity region of a potential H i emission, , we fit the whole baseline without excluding the velocity region of the H i disk emission (250 km s-1 for NGC 891 and 300 km s-1 for NGC 4565). We call this best fit a “temporary baseline”.
For the fitting, we use a robust polynomial fitting algorithm imodpoly from pybaseline. modpoly iteratively fits a polynomial baseline to the data using thresholding to reject outliers. Thresholding first fits the data using traditional least-squares and then sets the input data of the next iteration as the element-wise minimum between the current data and the current fit. imodpoly is an improved modpoly algorithm for noisy data that includes the standard deviation of the residual (= data – baseline) when performing the thresholding.
We restrict our fits to use only low-order () polynomials to avoid over-fitting and under- or over-estimating the emission we are looking for. Then the best-fit polynomial order for the working , , is decided based on the smallest , supported by the qualitative judgment from inspecting the results by eye.
-
4.
In the “temporary baseline”-subtracted spectrum, we identify the initial by eye. We identify a positive fluctuation as a candidate emission when the velocity width of that fluctuation is at least 4–5 times the velocity resolution, e.g., a 20–25 km s-1 wide positive fluctuation is considered a candidate emission in a v = 5 km s-1 spectrum.
-
5.
We return to the smoothed spectrum in step # 2, and fit a new baseline to the spectrum. This time we exclude the region from fitting if the candidate emission is not at rest (i.e., not centered around 0 km s-1). If the candidate emission is at rest, the algorithm can identify it anyway. For example, we do not exclude any velocity region for all minor axis pointings of NGC 891 (except UP3N, where the 50–150 km s-1 region is excluded). For the major axis pointings of NGC 891, we exclude the 0–250 km s-1 region at lower declination (‘DN’), and the -250 to 0 km s-1 region at higher declination (‘UP’, except ‘UP3J’, where we exclude the 100–400 km s-1 region).
If needed, we adjust the velocity range used for the baseline fit vbase to ensure that it is larger than and includes enough spectral range for a good fit. This best-fit baseline is the “intermediate baseline”.
-
6.
We calculate the velocity range over which in the “intermediate baseline”-subtracted spectrum is continuously positive around the center of the region. That velocity range is set to be the new . Because we look for H i emission bound to the halo, the maximum allowed candidate velocity range is set by (except ‘UP3J’ of NGC 891).
-
7.
With the new exclusion region defined in step # 6, we repeat step # 5, this time using the “intermediate baseline”-subtracted spectrum as input. We repeat steps #5 and #6 until converge over successive iterations. Then the converged is taken as the velocity range of detected H i emission, vemit, for the working . The best-fit baseline of the converged fit is the “final baseline”.
-
8.
We calculate the RMS noise, from the signal-free part of the “final baseline”-subtracted spectrum. Then, we integrate the spectrum over the range of vemit to obtain the intensity, in units of K km s-1. We calculate the statistical uncertainty in the integrated intensity, .
-
9.
We repeat steps # 2 to 8 for different values of .
-
10.
We choose the optimum velocity resolution, the final v, to be the value where the H i emission is detected at maximum signal-to-noise ratio (S/N = I/) in the smoothed and final-baseline-subtracted spectrum.
In Table 1, we provide the optimum velocity resolution, the final velocity range of H i emission vemit, the final velocity range of baseline vbase, and the best-fit polynomial orders that we find for each pointing.
Appendix B Deciding Threshold for masking WSRT data cubes
-
1.
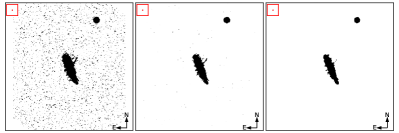
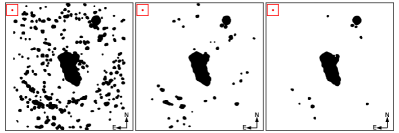
Noise Calculation: To estimate the noise in the WSRT data cubes, we consider two “emission-free” regions by excluding data within a radius of 20′ and 30′ from the center of the target galaxy. A 20′ mask is appropriate because signals can be visually identified within this radius, although some of our pointings lie beyond it. A 30′ mask provides a truer representation of the “emission-free” region, although it leaves a smaller amount of data to estimate the noise. Thus there is a trade-off between the accuracy and amount of the data used to estimate the noise. Because the positive values in the “emission-free” region might be affected by the faint (and visually unidentifiable) signals, we fit the histogram of only negative values in the “emission-free” region with a Gaussian. We consider the best-fitted standard deviation of that Gaussian as the global noise of the data cube. In the following steps, We consider the minimum of the noise values calculated using the two “emission-free” regions.
-
2.
Masking: Spectra from the unmasked and convolved WSRT cube would be heavily contaminated by noise, especially at the pointings more than 1 GBT beamsize away from the H i disk. It might lead to the WSRT column densities being significantly larger than the GBT column densities, which is physically impossible. That makes it useless to compare unmasked and convolved WSRT spectra with the GBT spectra.
To mask the WSRT data cubes based on noise calculated in the previous step, we consider the S/N of each pixel in each velocity channel. We retain the value of a pixel at a given velocity channel if the S/N of that pixel at that velocity channel and in at least one of the adjacent velocity channels is above the required threshold. This allows us to avoid spurious emissions at a deserted velocity channel. We consider thresholds of 1–7 at a step of 1. Masked pixels in the cube are rendered with a value of zero.
-
3.
Convolution and Spectra Extraction: We convolve the WSRT cubes masked at different thresholds with the circularized GBT beam and extract the spectrum at each pointing. In Fig. B.1, we show the convolved WSRT spectrum toward the UP 1N pointing of NGC 891 from the WSRT cubed masked at seven different masking thresholds.
The spectra corresponding to the cube masked at S/N and 2 are discarded since the baseline is far from zero and is systematically positive by construction. In the S/N masking, the baseline estimate is significantly improved. But it still retains some residual noise in the cube (see the mask in Fig. D.1, top row, left panel), leading to the residual emission in the convolved spectrum. While it is visible in the baseline region in contrast to the expected constant zero value of the baseline, it can affect any velocity channel, thus leading to an overestimated column density of the WSRT spectrum. It becomes more problematic for pointings farther out from the disk (Fig. C.1). Therefore, we discard this threshold as well. Additionally, S/N does not offer any significant improvement compared to S/N and is therefore discarded. Thus, we discard thresholds of S/N 1–3 and , while retaining S/N .
We consider the spectrum from the cube masked at S/N5 as the best estimate. We use the spectra from S/N 4 and 6 masked cubes to calculate the additive systematic uncertainty.
Appendix C Difference spectra
The masked and convolved WSRT spectra in comparison with GBT spectra of NGC 891 are shown in Figure C.1. Qualitatively, the results look similar for NGC 4565.
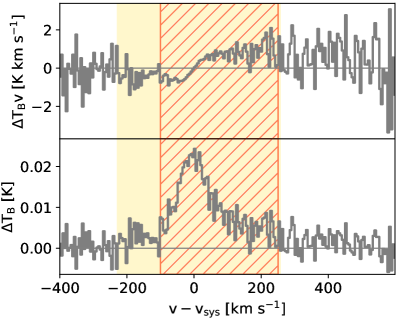
We show an example of the channel-wise difference between GBT and WSRT spectra for UP 1N pointing of NGC 891 in Figure C.2. Because the velocity channels of GBT and WSRT are not the same, we reconstruct the WSRT spectrum at the velocity channels of GBT using linear interpolation. In the top and bottom panels, we show the difference in brightness temperature weighted velocity and the brightness temperature.
Appendix D Intermediate Convolution
Traditionally, masking involves comparing pixel values to an S/N threshold. However, we propose masking with intermediate convolution. This process is similar to traditional convolution but we introduce angular scale as an additional parameter. Instead of masking pixel values directly, we retain every value within a 3 arcmin radius. The radius of inclusion is determined as half the FWHM (beam size). To estimate the noise, we employ intermediate convolution with a Gaussian kernel on the data cube.
We convolve the WSRT data cube with a Gaussian beam of FWHM = . We calculate the noise of that intermediate convolved cube in the same way as in the previous section. We mask the original cube by retaining pixels at every velocity channel with values above a certain S/N threshold depending on that noise and also all other pixels within of those pixels. We try = 1, 3, and 5. The larger the , the smaller the noise, and the higher the chance to extract more low-intensity genuine (not spurious) H i emission from the WSRT data cube that could have been removed in the direct masking process discussed in the previous section.
We convolve these masked-based-on-intermediate-convolution WSRT data cubes with the GBT beam and obtain the convolved spectra at our observed GBT pointings. At the same pointing, the difference in the spectra for different levels of intermediate convolution, if any, would be an indirect constraint on the angular scale of the detected H i emission. We compare the shape and column density of these spectra with our GBT spectra and the directly masked and convolved WSRT spectra.
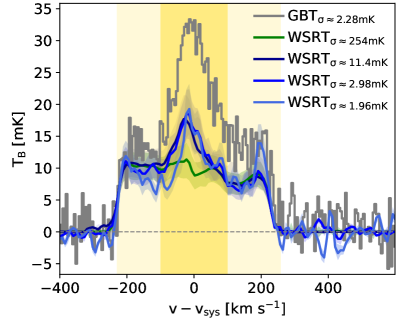
We show an example for the UP 1N pointing in Figure D.2. The shape of the GBT spectrum (gray curve) can be decomposed into two components: a broad emission due to the H i disk contamination (pale yellow patch), and a narrow emission (bright yellow patch) possibly connected to the filament (visible in the green contours in Figure 1a). All WSRT spectra can explain the broad emission, as expected, but the narrow emission is not captured by the directly masked and convolved WSRT spectrum (green curve in Figure D.2). Because the WSRT data cube is two orders of magnitude shallower than our GBT observation (statistical noise level noted in the legend of Figure D.2), we cannot rule out the possibility of the excess emission detected by GBT being small-scale low column density H i that is hidden under the noise of the WSRT data cube but is missed through the masking process. The masking based on intermediate convolution allows us to extract some of that low column density H i and thus retrieve a fraction of the narrow emission (blue curves in Figure D.2). The N(H i) of these WSRT spectra are , , and cm-2 (for intermediate convolution with and Gaussian beams, respectively). These are consistent with the N(H i) of the directly masked and convolved WSRT spectrum, cm-2, within uncertainty, thus making a negligible difference despite the difference in shape. The noise level of the WSRT data cube convolved with Gaussian beam is lower than that of our GBT spectrum, yet we can see that a large fraction of the narrow emission remains unexplained. This is a rigorous confirmation of the excess emission detected by our GBT observation being a diffuse extended H i and not small-scale clumps/clouds.
References
- Armillotta et al. (2017) Armillotta L., Fraternali F., Werk J. K., Prochaska J. X., Marinacci F., 2017, MNRAS, 470, 114
- Bland-Hawthorn et al. (2017) Bland-Hawthorn J., Maloney P. R., Stephens A., Zovaro A., Popping A., 2017, ApJ, 849, 51
- Bocchio et al. (2016) Bocchio M., Bianchi S., Hunt L. K., Schneider R., 2016, A&A, 586, A8
- Borthakur et al. (2016) Borthakur S., et al., 2016, ApJ, 833, 259
- Carlsten et al. (2020) Carlsten S. G., Greco J. P., Beaton R. L., Greene J. E., 2020, ApJ, 891, 144
- Carlsten et al. (2022) Carlsten S. G., Greene J. E., Beaton R. L., Danieli S., Greco J. P., 2022, ApJ, 933, 47
- Das et al. (2020) Das S., Sardone A., Leroy A. K., Mathur S., Gallagher M., Pingel N. M., Pisano D. J., Heald G., 2020, ApJ, 898, 15
- Dekel & Mandelker (2014) Dekel A., Mandelker N., 2014, MNRAS, 444, 2071
- Draine (2011) Draine B. T., 2011, Physics of the Interstellar and Intergalactic Medium. Princeton University Press
- Faucher-Giguere & Oh (2023) Faucher-Giguere C.-A., Oh S. P., 2023, arXiv e-prints, p. arXiv:2301.10253
- Fraternali & Binney (2008) Fraternali F., Binney J. J., 2008, MNRAS, 386, 935
- Gronke et al. (2022) Gronke M., Oh S. P., Ji S., Norman C., 2022, MNRAS, 511, 859
- Harmsen et al. (2017) Harmsen B., Monachesi A., Bell E. F., de Jong R. S., Bailin J., Radburn-Smith D. J., Holwerda B. W., 2017, MNRAS, 466, 1491
- Heald et al. (2011) Heald G., et al., 2011, A&A, 526, A118
- Heald et al. (2012) Heald G., et al., 2012, A&A, 544, C1
- Heesen et al. (2019) Heesen V., et al., 2019, A&A, 628, L3
- Hibbard & van Gorkom (1996) Hibbard J. E., van Gorkom J. H., 1996, AJ, 111, 655
- Ho et al. (2017) Ho S. H., Martin C. L., Kacprzak G. G., Churchill C. W., 2017, ApJ, 835, 267
- Howk & Savage (1997) Howk J. C., Savage B. D., 1997, AJ, 114, 2463
- Howk & Savage (1999) Howk J. C., Savage B. D., 1999, AJ, 117, 2077
- Howk et al. (2017) Howk J. C., et al., 2017, ApJ, 846, 141
- Kamphuis et al. (2022) Kamphuis P., et al., 2022, A&A, 668, A182
- Karunakaran et al. (2022) Karunakaran A., Spekkens K., Carroll R., Sand D. J., Bennet P., Crnojević D., Jones M. G., Mutlu-Pakdıl B., 2022, MNRAS, 516, 1741
- Kereš et al. (2005) Kereš D., Katz N., Weinberg D. H., Davé R., 2005, MNRAS, 363, 2
- Kleiner et al. (2019) Kleiner D., et al., 2019, MNRAS, 488, 5352
- Koribalski et al. (2018) Koribalski B. S., et al., 2018, MNRAS, 478, 1611
- Li et al. (2020) Li Z., Hopkins P. F., Squire J., Hummels C., 2020, MNRAS, 492, 1841
- Martin et al. (2019) Martin C. L., Ho S. H., Kacprzak G. G., Churchill C. W., 2019, ApJ, 878, 84
- Martínez-Lombilla et al. (2019) Martínez-Lombilla C., Trujillo I., Knapen J. H., 2019, MNRAS, 483, 664
- Monachesi et al. (2016) Monachesi A., Bell E. F., Radburn-Smith D. J., Bailin J., de Jong R. S., Holwerda B., Streich D., Silverstein G., 2016, MNRAS, 457, 1419
- Mouhcine et al. (2010) Mouhcine M., Ibata R., Rejkuba M., 2010, ApJ, 714, L12
- Nelson et al. (2013) Nelson D., Vogelsberger M., Genel S., Sijacki D., Kereš D., Springel V., Hernquist L., 2013, MNRAS, 429, 3353
- Odekon et al. (2016) Odekon M. C., et al., 2016, ApJ, 824, 110
- Oosterloo et al. (2007) Oosterloo T., Fraternali F., Sancisi R., 2007, AJ, 134, 1019
- Péroux et al. (2022) Péroux C., et al., 2022, MNRAS, 516, 5618
- Pingel et al. (2018) Pingel N. M., et al., 2018, ApJ, 865, 36
- Pingel et al. (2021) Pingel N. M., et al., 2021, AJ, 161, 163
- Pisano (2014) Pisano D. J., 2014, AJ, 147, 48
- Putman et al. (2012) Putman M. E., Peek J. E. G., Joung M. R., 2012, ARA&A, 50, 491
- Richter et al. (2017) Richter P., et al., 2017, A&A, 607, A48
- Rupen (1991) Rupen M. P., 1991, AJ, 102, 48
- Sancisi et al. (2008) Sancisi R., Fraternali F., Oosterloo T., van der Hulst T., 2008, A&ARv, 15, 189
- Sardone et al. (2020) Sardone A., Pisano D., Popping A., Rhee J., Staveley-Smith L., Kleiner D., 2020, in American Astronomical Society Meeting Abstracts #235. p. 444.01
- Sardone et al. (2021) Sardone A., Pisano D. J., Pingel N. M., Sorgho A., Carignan C., de Blok W. J. G., 2021, ApJ, 910, 69
- Sorgho et al. (2019) Sorgho A., et al., 2019, MNRAS, 482, 1248
- Veilleux et al. (2020) Veilleux S., Maiolino R., Bolatto A. D., Aalto S., 2020, A&ARv, 28, 2
- Véron-Cetty & Véron (2000) Véron-Cetty M. P., Véron P., 2000, A catalogue of quasars and active nuclei
- Veronese et al. (2023) Veronese S., de Blok W. J. G., Walter F., 2023, A&A, 672, A55
- Walter et al. (2020) Walter F., et al., 2020, ApJ, 902, 111
- Wang et al. (2023) Wang J., et al., 2023, ApJ, 944, 102
- Weng et al. (2023) Weng S., et al., 2023, MNRAS, 523, 676
- Wolfe et al. (2013) Wolfe S. A., Pisano D. J., Lockman F. J., McGaugh S. S., Shaya E. J., 2013, Nature, 497, 224
- Yoon et al. (2021) Yoon J. H., et al., 2021, MNRAS, 502, 969
- Zabl et al. (2019) Zabl J., et al., 2019, MNRAS, 485, 1961
- Zschaechner et al. (2012) Zschaechner L. K., Rand R. J., Heald G. H., Gentile G., Józsa G., 2012, ApJ, 760, 37
- de Blok et al. (2014) de Blok W. J. G., et al., 2014, A&A, 569, A68
- van de Voort et al. (2011) van de Voort F., Schaye J., Booth C. M., Haas M. R., Dalla Vecchia C., 2011, MNRAS, 414, 2458