Dynamic Adversarial Attacks on Autonomous Driving Systems
Abstract
This paper introduces an attacking mechanism to challenge the resilience of autonomous driving systems. Specifically, we manipulate the decision-making processes of an autonomous vehicle by dynamically displaying adversarial patches on a screen mounted on another moving vehicle. These patches are optimized to deceive the object detection models into misclassifying targeted objects, e.g., traffic signs. Such manipulation has significant implications for critical multi-vehicle interactions such as intersection crossing and lane changing, which are vital for safe and efficient autonomous driving systems. Particularly, we make four major contributions. First, we introduce a novel adversarial attack approach where the patch is not co-located with its target, enabling more versatile and stealthy attacks. Moreover, our method utilizes dynamic patches displayed on a screen, allowing for adaptive changes and movement, enhancing the flexibility and performance of the attack. To do so, we design a Screen Image Transformation Network (SIT-Net), which simulates environmental effects on the displayed images, narrowing the gap between simulated and real-world scenarios. Further, we integrate a positional loss term into the adversarial training process to increase the success rate of the dynamic attack. Finally, we shift the focus from merely attacking perceptual systems to influencing the decision-making algorithms of self-driving systems. Our experiments demonstrate the first successful implementation of such dynamic adversarial attacks in real-world autonomous driving scenarios, paving the way for advancements in the field of robust and secure autonomous driving.
1 Introduction
As autonomous vehicles and driver assistance systems become more prevalent, it is imperative to ensure that their decision-making systems are robust. The ability to detect and recognize traffic signs and cars accurately is crucial for autonomous vehicles to make safe and efficient decisions [35, 9, 37]. Deep neural networks (DNNs) [32] provide an efficient framework for real-time object recognition widely used by autonomous driving systems. However, it is not immune to adversarial attacks, which can potentially have serious consequences in real-world scenarios [33, 24, 39, 42]. In the past several years, scientists have investigated the reasons behind neural networks’ vulnerability to adversarial examples and devised techniques for generating digitally perturbed images [8, 19, 27, 22, 5]. In a range of real-world scenarios, several studies indicated that adversarial perturbations on actual objects can deceive DNN-based object detectors in real-world scenarios [36, 13, 7, 3, 2, 40, 28, 4, 17]. For instance, To avoid detection, an individual can either carry a cardboard plate with a printed adversarial patch as described in [34] or wear an adversarial T-shirt as proposed by [40], both oriented towards the surveillance camera. Furthermore, [6] and [30] have demonstrated the feasibility of real-world adversarial attacks on Yolo [25] and Faster R-CNN [26]. They focus on manipulating stop signs by hiding the stop sign using an adversarial stop sign poster or by affixing adversarial stickers onto the sign.
However, in [20], it showed that the printed patches cannot fool object detectors across a wide range of distances and angles. To come up with a variety of distances and angles, we aim to deceive and mislead the DNN detectors by generating dynamic adversarial patches which are adapted based on the camera and target positions. We place the patches in a location distinct from the location of the target object. Specifically, we display the patch using a screen mounted on a robot car rather than on the target traffic sign itself. Our methodology employs an optimization process that operates at the pixel level, aiming to display a patch that significantly enhances the probability of misclassifying the object within a substantial dataset. Notably, our attack is carried out by a dynamic patch displayed on the screen, making its formulation and simulation more challenging due to several environmental variables.
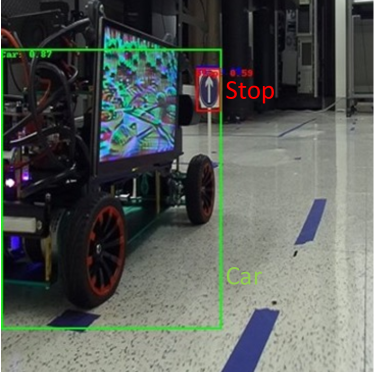
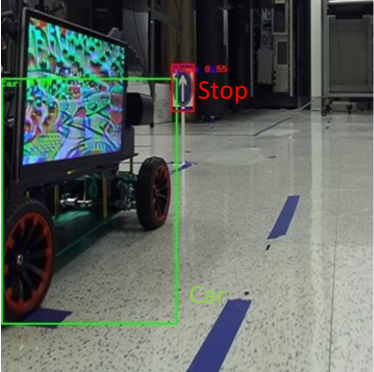
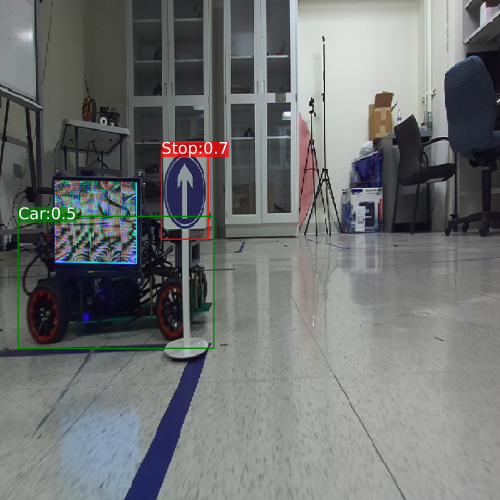
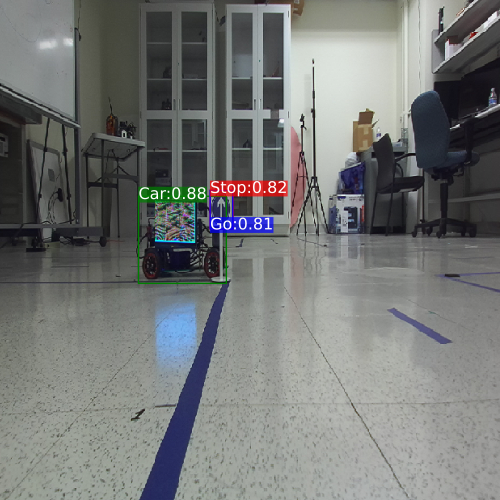
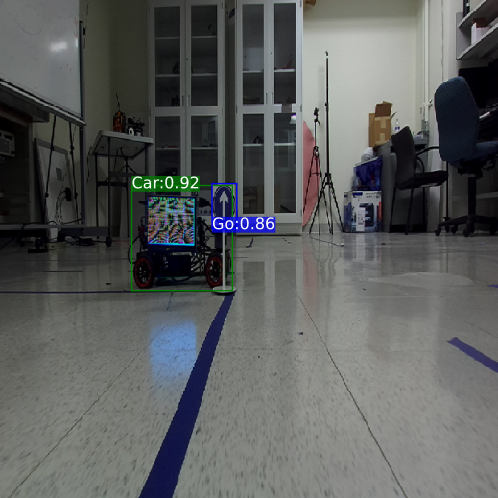
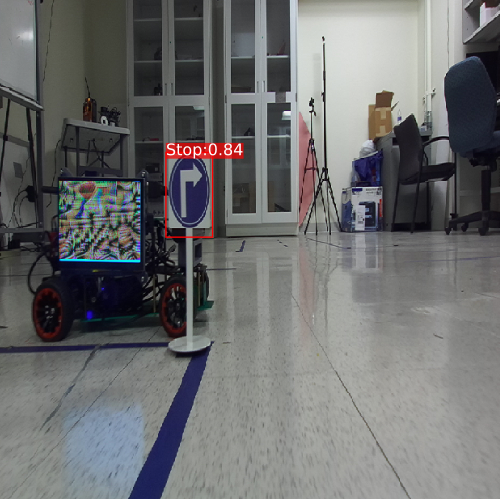
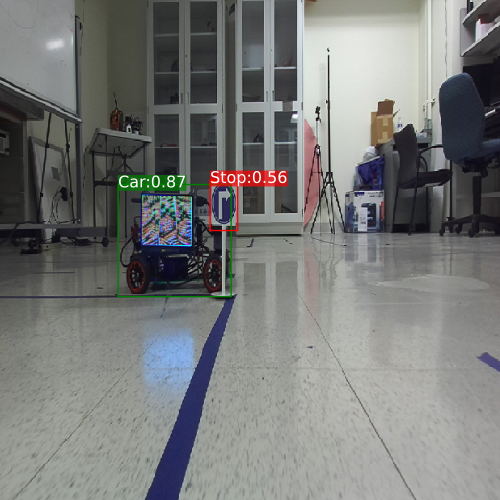
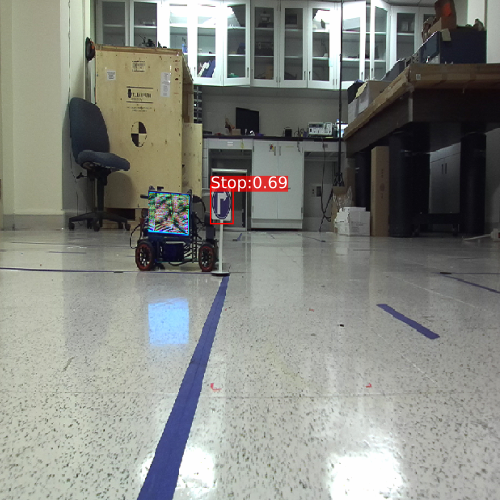
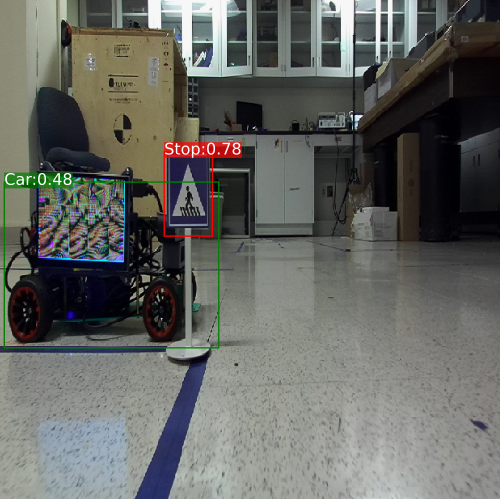
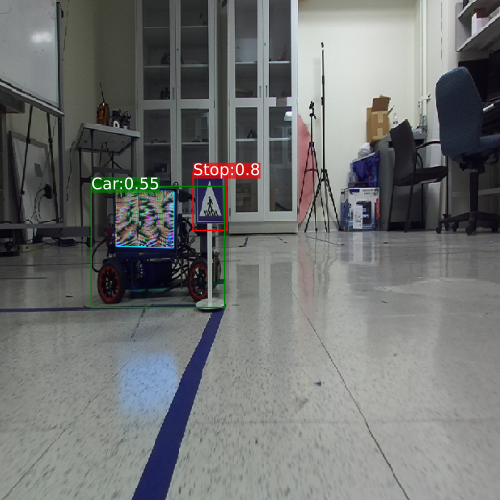
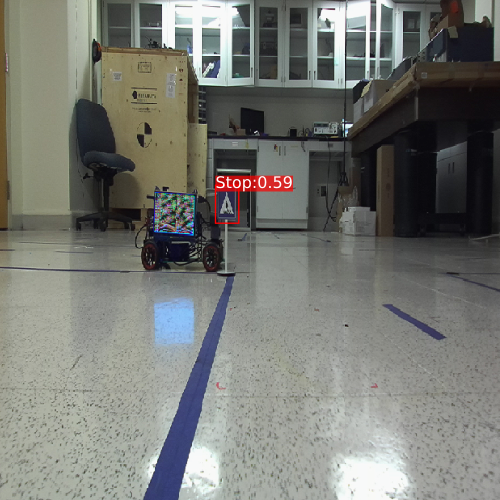
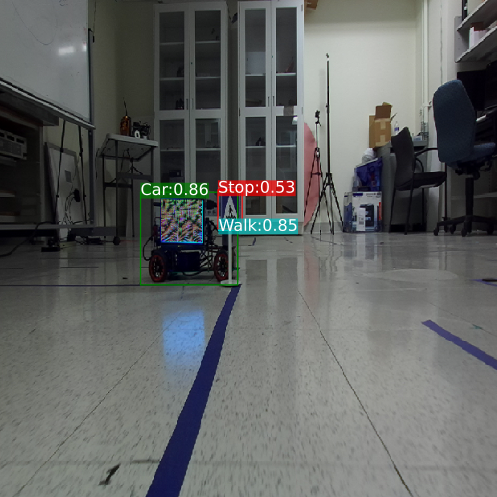
The goal of this work is to affect the decision-making of an autonomous vehicle by affixing a custom-designed dynamic patch to another moving vehicle, causing the object detector model to misclassify an object, e.g., a non-restrictive traffic sign as a restrictive one as shown in Figure 1. This adversarial attack could potentially manipulate the behavior of the attacked vehicle in various vehicle interaction scenarios including navigating intersections, changing lanes, and merging into a lane, underpinning the importance of robust object detection in safety-critical autonomous driving systems.
Contributions. In this paper, we make four main contributions as follows.
-
•
We formulate the problem of attacking the object detection of traffic signs by displaying a dynamic patch on a screen mounted on an autonomous robot car which enables the patch not only to be dynamically changing and moving but also short-lived and harder to detect.
-
•
We reformulate the loss function of state-of-the-art adversarial neural network models by integrating a positional loss term that aligns the target object bounding box to increase the likelihood of a successful attack in the presence of corroborating sensory data.
-
•
We propose a SIT-Net that simulates the color and contrast transformation of the displayed image on the screen captured by the camera to mitigate the gaps between the simulation and the physical world.
-
•
We conduct extensive experiments to show successful attacks across various multi-vehicle interaction scenarios including intersection passing and lane changing, and attacking various traffic signs including Go-straight, Turn, and Pedestrian signs. This allows the attacker to adversarially manipulate other vehicles’ decisions to take the lead and move with lower risk.
Furthermore, to the best of our knowledge, we are the first to design and demonstrate dynamic adversarial attacks on real-world autonomous driving systems.
2 Related Work
In the field of autonomous vehicles, the authors in [43] proposed systematic solutions for Hiding Attack (HA) and Appearing Attack (AA), enhancing the robustness of adversarial examples (AEs) against varying distances and angles. In [14], a method for generating physical AEs that fools traffic sign recognition of autonomous vehicles was presented which employs single and multiple bounding box filters, as well as considering different attack vectors, such as hiding, appearance, non-target, and target attacks. In [18], the authors proposed Short-Lived Adversarial Perturbations (SLAP) that allow adversaries to create physically robust real-world AEs using a projector that provides better control over the attack compared to traditional adversarial patches, as projections can be turned on and off as needed and leave no obvious trace of an attack. Furthermore, in [12], a dynamic adversarial patch technique was introduced to circumvent the object detection model by employing several dynamic patches applied to a target object that adapt to the location of the camera. The authors showed by switching between optimized patches based on the camera’s position, the attack can adapt to different situations and achieve optimal results.
In all the previous physical targeted attacks, the patch is deployed at the location of the target object, which makes the patch implementation hard and even unfeasible in most practical cases. In this paper, we focus on the AEs in which a patch is in a different place from the target object and is dynamically displayed through the screen mounted on a either moving or stationary vehicle. Moreover, the final goal is to mislead the autonomous driving system’s decision-making instead of purely deceiving its perceptions.
3 Problem Formulation
We investigate physical dynamic adversarial attacks on a DNN object detector for various autonomous driving scenarios where two robot cars, namely patch car and the camera car, are interacting with each other. The camera car employs a DNN object detector to detect other cars and traffic signs, which informs its decision-making process. Additionally, it utilizes a range of sensors, such as Lidar, to acquire the positions of these objects. The patch car is equipped with a screen that displays a deceptive patch. We aim to trick the camera car’s decision making such as coming to a halt by attacking its object detector, thereby allowing the patch car to take over and navigate through with earlier passing time and lower risk. Importantly, we also consider the camera car’s ability to cross-reference detected object positions with its proximity data. For example, the agent matches detected objects’ locations with the Lidar point clouds to verify it for the decision-making process [38, 1]. This adds an extra layer of complexity to the task of successfully deceiving it. In the following, we introduce our attack model in two dimensions—the attacker and the objective.
3.1 Attacker
Attacker, i.e., the patch car, is a specialized agent that can display adversarial patches dynamically on a display screen attached to it. Instead of altering objects physically, this agent aims to manipulate object recognition processes through visual perturbations shown on its screen. The attacker employs a white-box attack strategy, granting it full access to the object detector model. It can also obtain the proximity of the objects including the position of the camera car using a Lidar.
To formally define the dynamic patch, let be the state space representing all possible positions of the camera car, and the patch car, , and be the space of all possible adversarial patches. The function maps the patch given a tuple of states to a specific transformed adversarial patch in . Moreover, to model environmental parameters affecting the patch visibility, we integrate the variable into the map function. This can be denoted as:
| (1) |
The variable represents a specific color transformation of the displayed patch in the camera’s image over all possible ones. We discuss it in the Section 4.2.
3.2 Objectives
We aim to devise an attack that misguides the object detector model, causing it to incorrectly classify a traffic sign to a target sign when viewed from the perspective of the camera car. We formally define the problem given that:
-
•
: the space of all possible input images.
-
•
: the space of potential output predictions.
-
•
: the space of possible positions of the cars.
-
•
: the detector model, parameterized by weights .
The objective is to find the patch that maximizes the probability of the target class, e.g., stop-sign.
| (2) | ||||||
| subject to | ||||||
denotes the input image after applying the transformed patch. The patch must be applied within the coordination of the display screen which depends on the positions of the cars. denotes the adversarial patch displayed on the screen transformation function provided earlier in Equation 1. denotes the output prediction corresponding to the confidence of target. denotes the output prediction corresponding to the bounding box of the target.
We utilize gradient descent optimization to identify the patch that maximizes the misclassification rate of the detector model. Gradient descent is widely used for training adversarial attacks on DNNs [16]. In our case, we aim to optimize the patch that minimizes the loss function, as described in the section 3.3.
According to the proposed function 1 for the patch, it depends on the position of the cars () and the environmental parameters. In Section 4.1, we introduce how to capture the changes in the positions of the cars and integrate these, resulting in a dynamic patch. To integrate the environmental parameters , we propose a solution in Section 4.2.
3.3 Objective Function
To effectively deceive the camera car, our approach must address both the positional accuracy and the classification accuracy of the adversarial patch. The objective function is defined as follows:
| (3) |
| (4) |
is the probability of the -th bounding box being the target class (e.g., stop sign). is the objectiveness probability of the -th bounding box. The is the Intersection over Union (IoU) between the -th bounding box of the target class (e.g., stop sign). The predicted by model and the original object bounding box . is the set of all the bounding boxes overlapping the original object. is the optimized patch. The objective function, , is designed to optimize two key factors.
Confidence score. The function aims to increase the probability that the object detector misclassifies the objects to the target class (e.g., a stop sign). This involves manipulating the patch in such a way that the object detector is highly confident in its misclassification.
Bounding box overlap. Alongside the confidence score, the function also aims to maximize the overlap between the bounding box predicted by the object detector caused by the adversarial patch and the bounding box of the actual object. The combination of these two factors ensures that the adversarial patch not only deceives the detector in terms of classification but also aligns accurately with the expected position of the target object, as determined by the camera car’s other sensory inputs, e.g., Lidar.
4 Approach
This section elaborates on our proposed process for generating dynamic adversarial patches. Section 4.1 explains how the patch training data is collected capturing the dynamic of the setting. In Section 4.2, we encounter the image transformation of the displayed patch on the screen. Finally, we describe the patch optimization in Section 4.3.
4.1 Dynamic Environment Settings
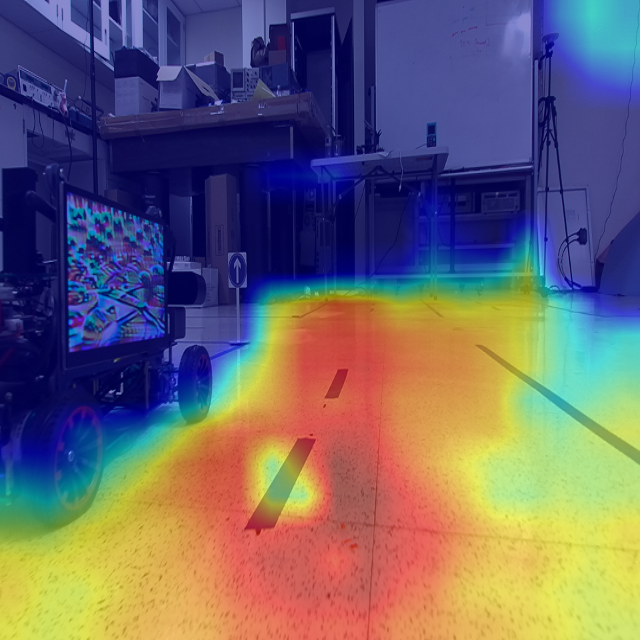
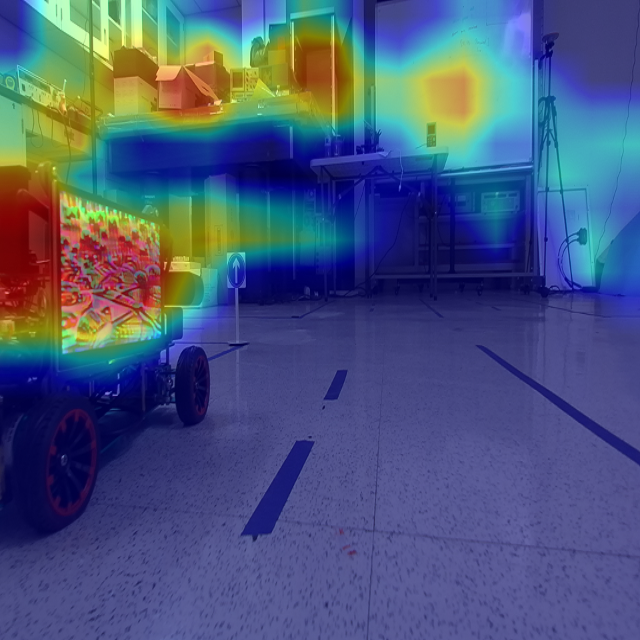
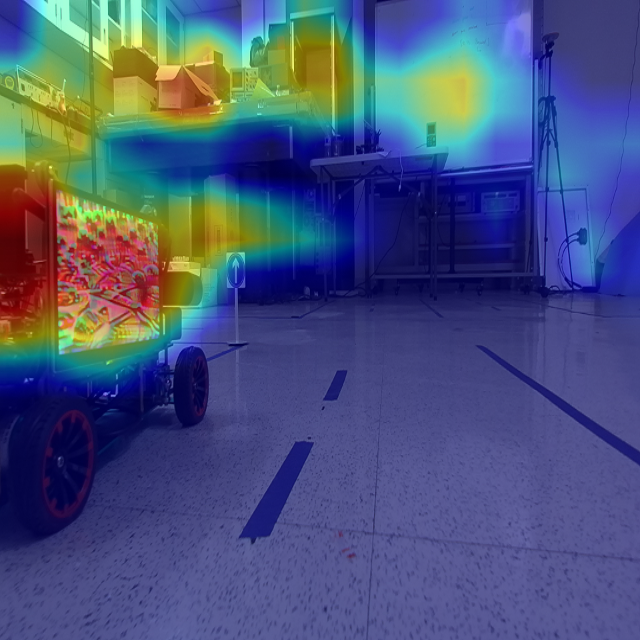
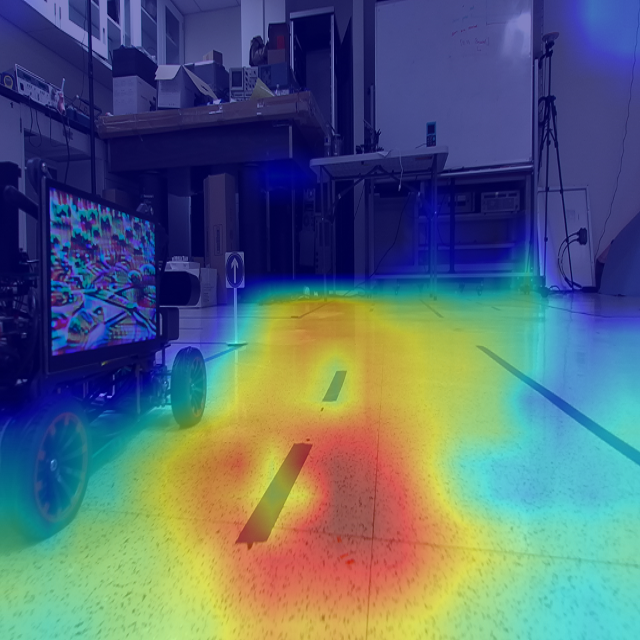
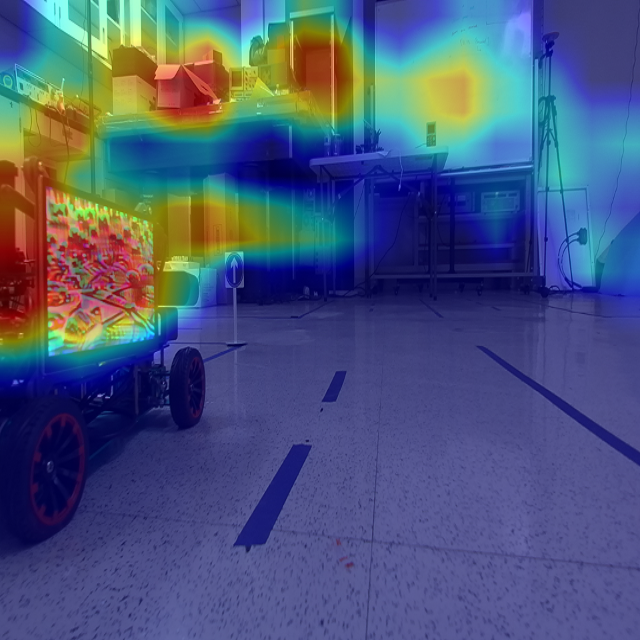
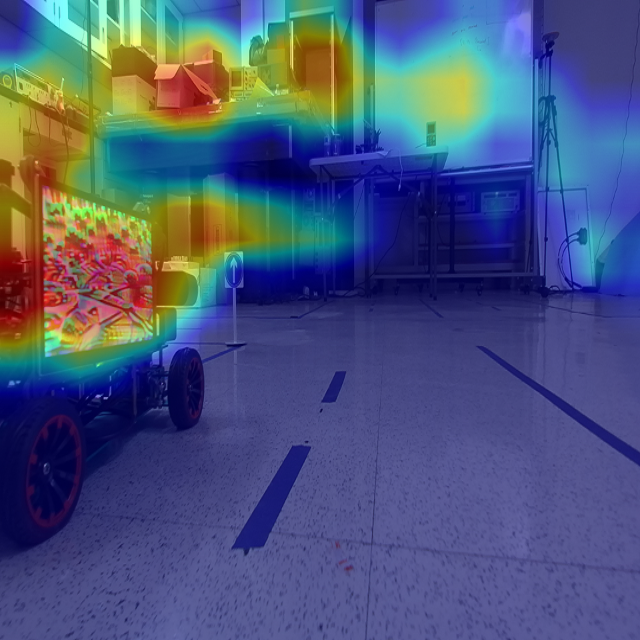
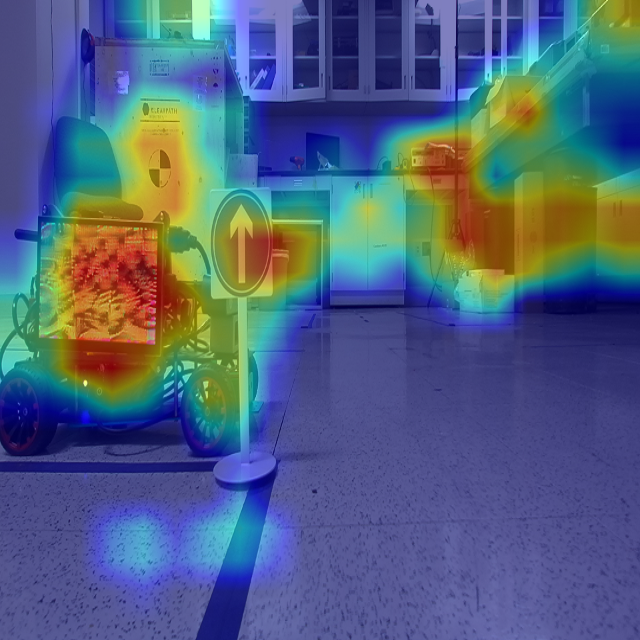
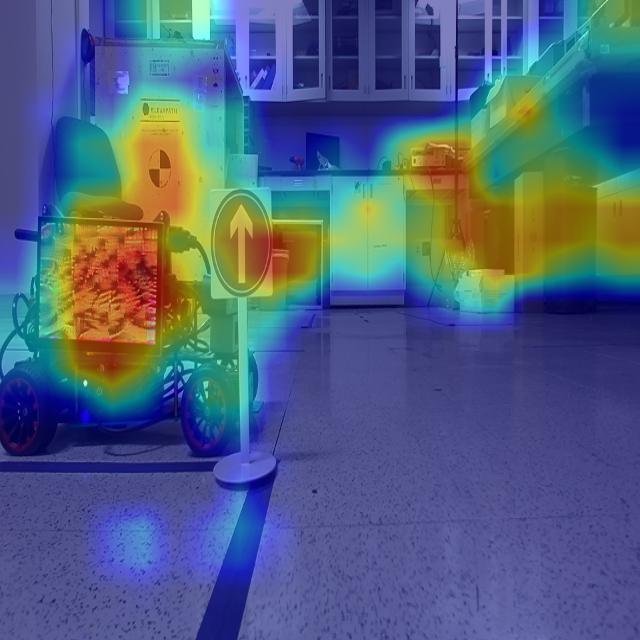
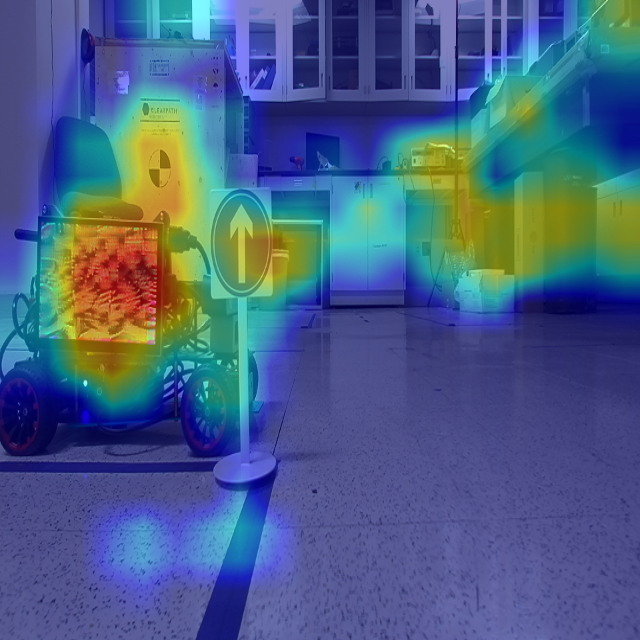
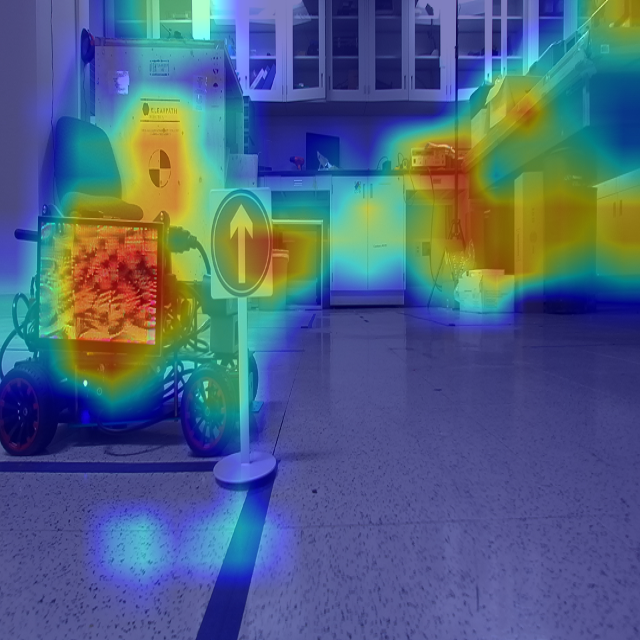
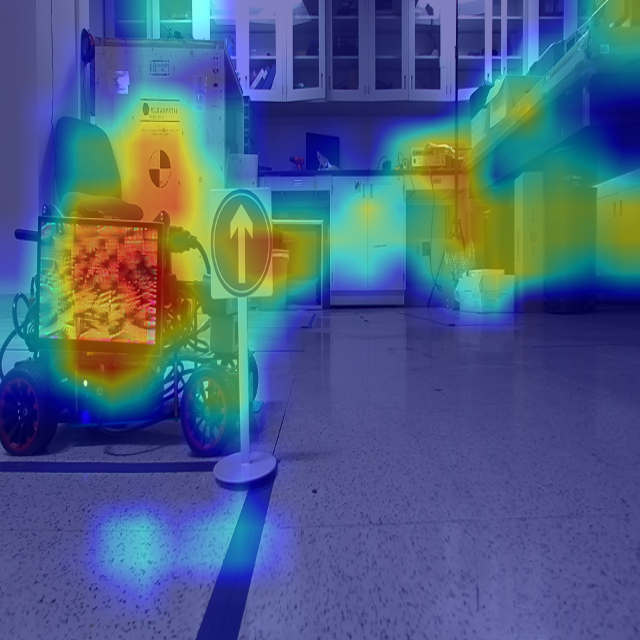
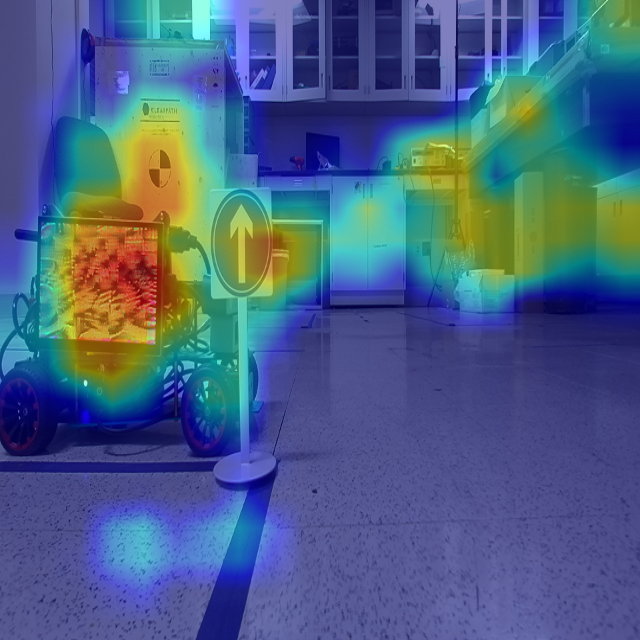
The predictions of object detectors are influenced by the positions of objects in the image. To visualize the principal components of the learned features and representations, we apply Eigen-CAM [23, 11] which reflects the influence level of each image region on the model through a heatmap (red to purple denoting most to least influence). As depicted in Figure 2, the model’s influence shifts according to changes in object positions. This in turn impacts the effectiveness of adversarial patches that are not overlaid on the target object. To compensate, a dynamic patch that adapts to the target’s position could be a more effective approach. Without direct access to the camera car’s captured images during an attack, the patch car can estimate the target’s position and adjust its patch accordingly to account for positional changes.
4.1.1 Data collection
We employ Lidar to obtain the positions of the cars and the target object. Multiple autonomous driving scenarios involving the patch car and the target object are collected synchronously using Lidar and camera data.
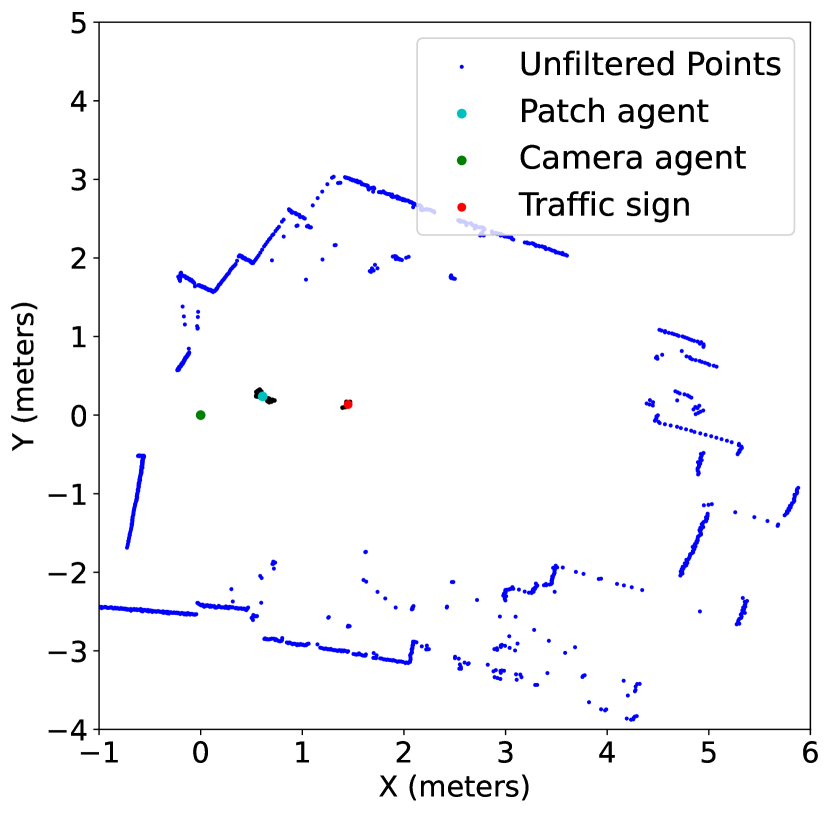
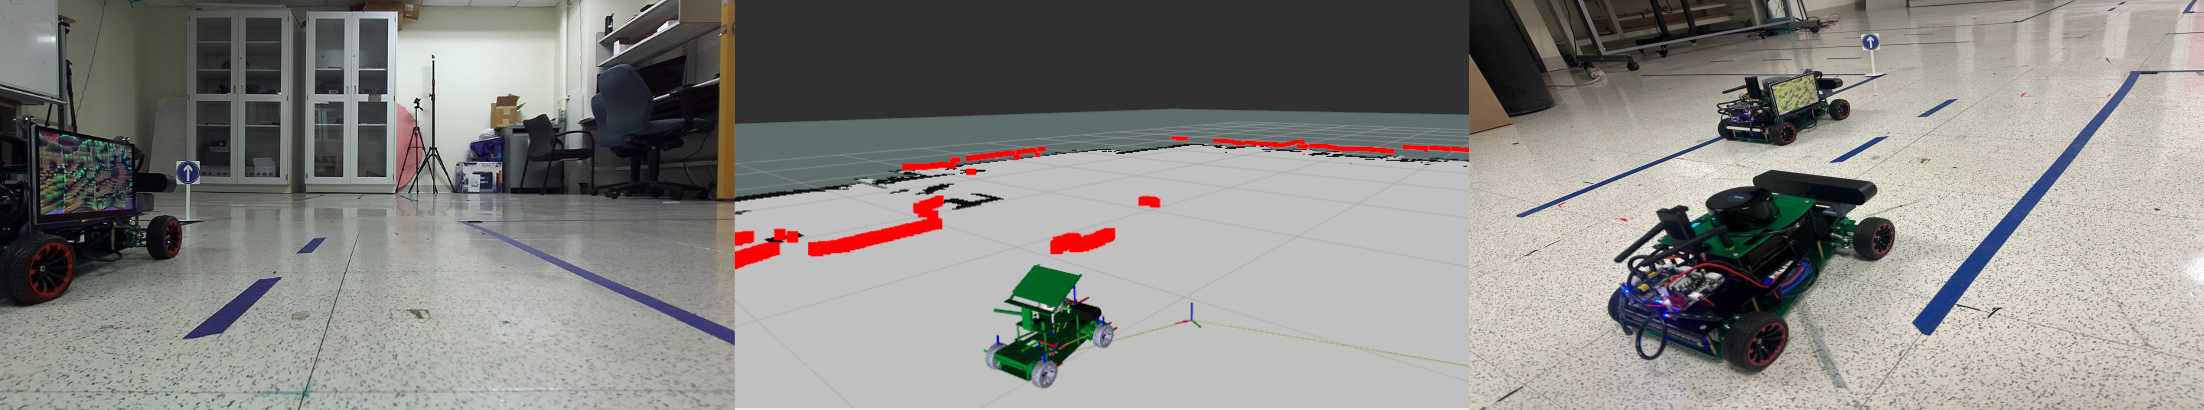
Image and Lidar recording. Both the patch car and the target object are recorded using a camera, and their positions are recorded via Lidar. This synchronized dual recording setup is designed to capture a variety of scenarios, including those where either one or both subjects are in motion. We enhance our position tracking accuracy using Lidar-based SLAM techniques, specifically AMCL [10], which affords robust pose estimation even in dynamic and unpredictable environments. Figure 3(a) demonstrates the camera car’s map generated with lidar points.
Screen contour identification. A full blue image is displayed on the screen during the recording sessions. This practice assists in the accurate identification of screen contours, which is crucial for the perspective transformation of the patches during the training phase.
4.1.2 Data clustering
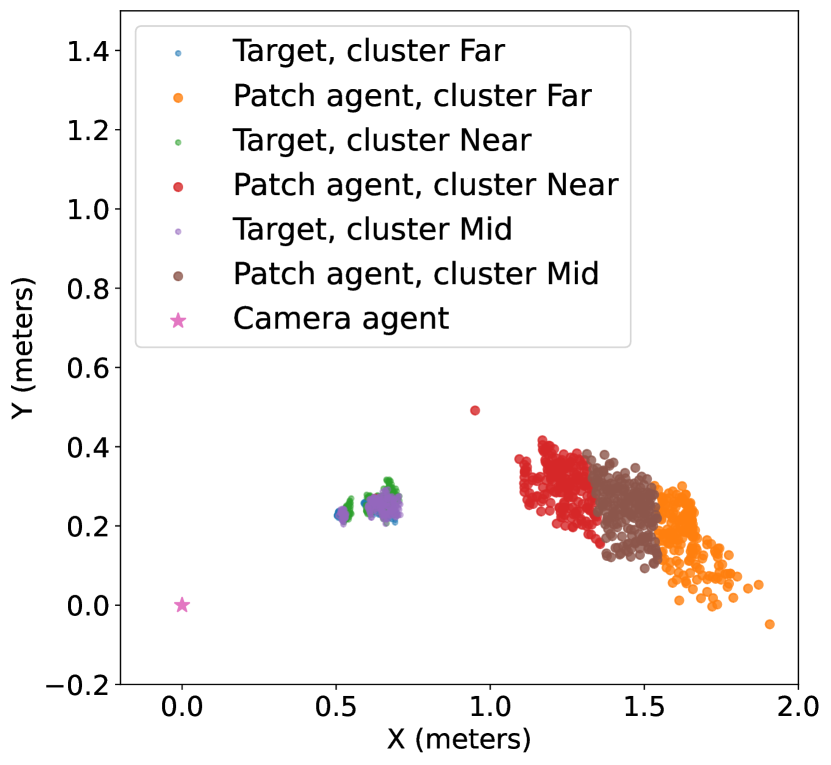
The recorded data is then clustered by the K-means clustering algorithm based on the distance of the patch car and target object from the camera car. This way, the positions of the patch car and the target in the images in the same cluster are within the same threshold Each cluster represents a specific range of distances, and a dedicated patch is trained for each cluster. Figure 3(b) shows the clustered points of the patch car and the target. This enhances the performance of the patches that are optimized for different.
Dynamic patch display. The trained patches are then employed in a dynamic fashion. The system utilizes the camera car’s position to determine the appropriate patch to display, ensuring a more effective and contextually relevant visual transformation.
This structured and strategic approach to data collection and processing ensures that our system is equipped to handle a variety of real-world scenarios, making the patches dynamic and enhancing the overall effectiveness of the visual transformations.
4.2 Screen Image Transformation Network (SITNet)
To model the visual changes of the patch in the images captured by the camera, we use a convolutional neural network (CNN) model. The SITNet is a CNN designed to transform the colors and contrast of images to mitigate the difference between simulation and the real world. It specifically focuses on adapting the appearance of images displayed on a screen, as captured by the camera, ensuring a more accurate representation and smoother transition between the simulated and physical environments. SITNet comprises two convolutional layers. In the following, we describe data processing and loss functions in the SIT-Net training steps.
4.2.1 Screen Data Collection and Prepossessing
We manually collected the dataset used to train SITNet to address the challenges of discrepancies between simulated and real-world visual data. The collection procedure is as follows:
Input image generation. A diverse set of patch-like images was created, ensuring a variety of color and contrast scenarios. These patches are of the same size as the targeted screen area to maintain consistency.
Screen display. The generated images were displayed on a screen, capturing a wide range of total variations to adequately represent different potential real-world conditions.
Image recording. A camera was utilized to record the displayed images. Precise coordination of the four corner points of the screen area was maintained to aid in the subsequent image-processing steps.
Image preprocessing. The captured images were subjected to cropping and perspective transformation based on the known screen coordinates. This step ensures that the images are accurately aligned and standardized, mirroring the conditions of the screen display.
This comprehensive data collection and preprocessing procedure ensures that the network is exposed to a wide spectrum of visual variations, enhancing its ability to generalize and accurately transform images in practical scenarios.
4.2.2 Loss Function and Optimization
The mean squared error is used in the loss function to reduce the difference between predicted and real-world images. However, these pixel-level differences might not correlate well with how images are perceived or their similarity. Perceptual loss addresses this limitation by incorporating features extracted from pre-trained neural networks that are designed to mimic human visual perception. Moreover, a total variation term [21] is added to the loss function to smooth the predicted images.
Mean squared error (MSE) loss. We quantify the pixel-wise difference between the predicted and real-world images by MSE loss.
| (5) |
where is the total number of pixels in the image.
Perceptual loss. The perceptual loss measures the difference in style between images at the feature level rather than the pixel level. The first nice layers of the pre-trained VGG19 network [29] are used to extract feature maps from the input and target images. Then the MSE between these feature maps is computed. This way, the model is forced to generate images that are perceptually similar to the target images. The perceptual loss is defined below.
| (6) |
where is the total number of elements in the VGG feature maps.
Total variation (TV) loss [21]: The TV loss below encourages spatial smoothness in the predicted image.
| (7) |
The overall loss is a weighted sum of MSE loss, Perceptual loss, and TV loss.
| (8) |
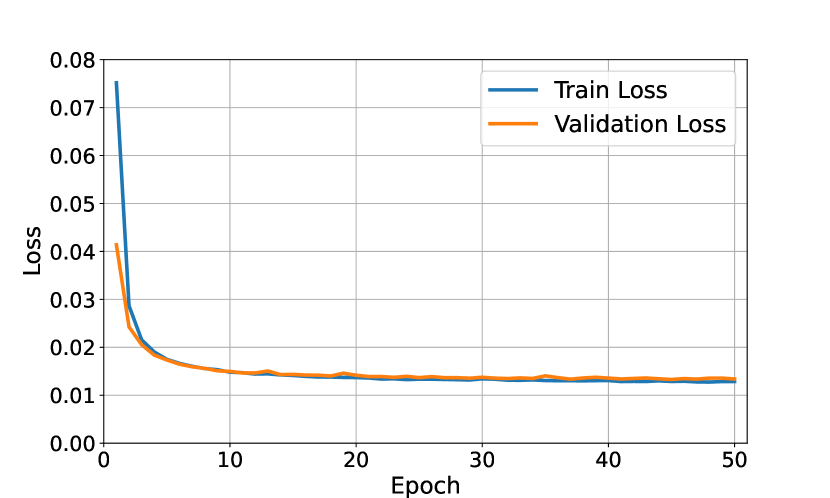
The network is trained over epochs, with a learning rate of 0.001. The weights for the perceptual and total variation losses are set as and , respectively. Figure 4 depicts the training curves and the SIT-Net predictions for an environment instance.
4.3 Patch Optimization
The optimization procedure for the patch is described in Algorithm 1. We optimize a patch for each cluster in the dataset. First, the patch is transformed by the SIT-Net. Then we apply the transformed patch, , to the images and pass it to the object detector. The line 7 includes filtration of the object detector’s prediction and extraction of all bounding boxes in the area of the original object. The objectiveness probabilities of these bounding boxes are integrated into the class probabilities. Then we extract the top- target class confidence values.
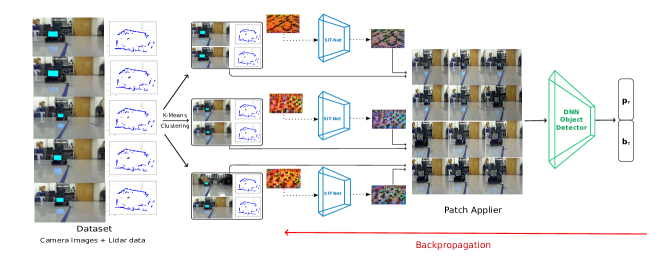
Subsequently, in line 9, the IoU of the top- target class bounding boxes with the original object bounding box is computed. In the next step, the IoU values are multiplied by the top- confidence, and its mean is calculated. This value represents the alignment and confidence of the selected bounding boxes. Finally, This value is utilized in the optimization process of the patch. Figure 5 shows a pipeline of the patch optimization process.
5 Evaluation
We test our proposed dynamic attack in different scenarios where two robotic agents interact with each other and must follow traffic signs.
5.1 Experimental Setup
Agents. We use two Rosmaster R2 robot cars with Ackermann structure [41] equipped with Lidar and IMU sensors for localization and mapping. The camera car uses a Zed2 camera [31] for image recording. The patch car is equipped with a seven-inch LCD screen attached to the side of the robot to display the patches. The car’s decision-making planner employs object detection results to plan for their motions. Object detection and patch training are carried out by a server using a Navidia RTX4090 GPU.
Object detector model. For each robot car, we fine-tuned the model from yolov5 [15] to detect traffic signs and the other robot car. The model trained over 1.8 K images with the weights from a pre-trained model yolov5s and the input image size of . The dataset is available online.111https://universe.roboflow.com/r2-5io2k/rosmaster-r2-traffic-sign
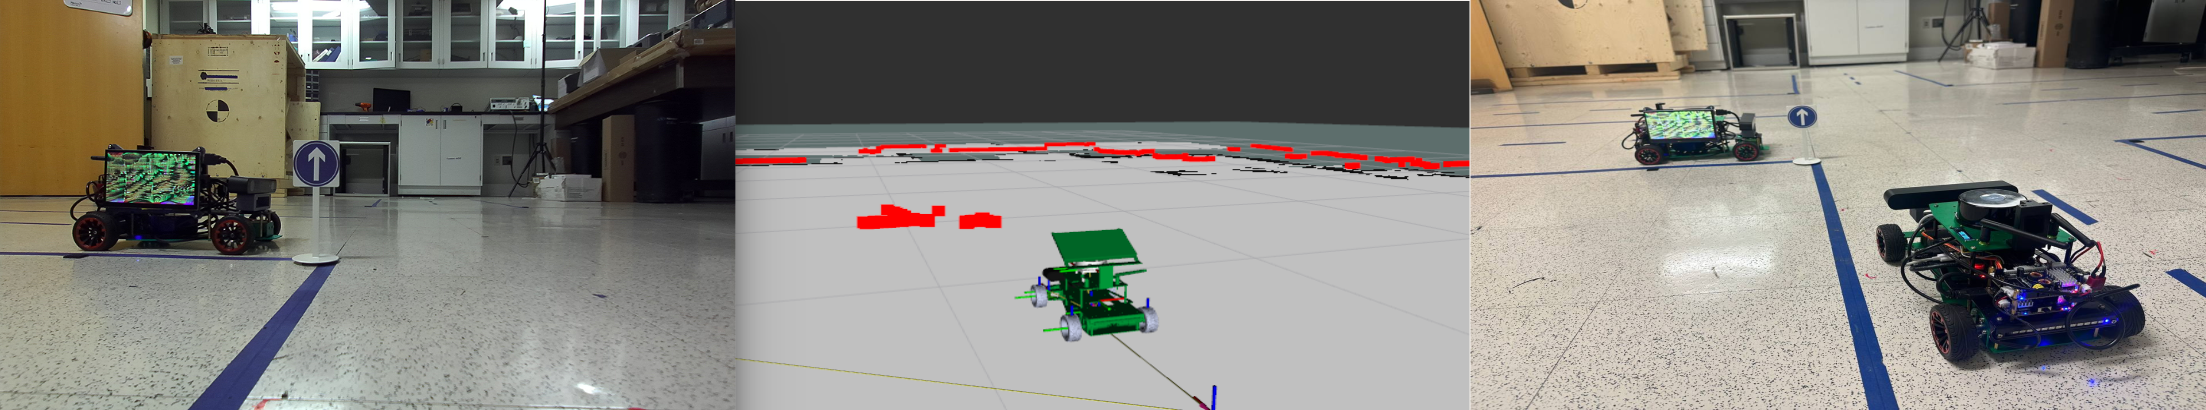
Autonomous driving scenarios. We consider two different robot positional settings at the intersections where the traffic signs are crucial for decision-making. When the patch car must yield to the camera car according to the traffic signs, it aims to alter the class of the detected signs by the camera car to pass the intersection or change its lane earlier. The first setting is a passing intersection where both cars approach an intersection within the same time window while driving on crossed roads, and the patch car tries to pass the intersection before the camera car. There are three possible traffic signs—Go-straight, Turn, and Pedestrian crossing signs, that are targeted by the attack to be misclassified as a stop sign. In the second setting, both cars are driving on the same road and the patch car tries to merge to the lane of the camera car with lower risk by deceiving the camera car to detect the sign as a stop sign. Figure 6 shows our setup for the experiment.
| Near | Mid | Far | All |
|

|
|
|
|
|
|

|
|
|
|
|
| Method | Go-straight sign | Turn sign | Pedestrian sign | |||
|---|---|---|---|---|---|---|
| Similar Env. | Unseen Env. | Similar Env. | Unseen Env. | Similar Env. | Unseen Env. | |
| Dynamic Patch (ours) | 28.8% | 4.0% | 47.5% | 5.1% | 41.0% | 5.0% |
| Static Patch (SoA) | 22.0% | 2.0% | 32.8% | 2.0% | 40.8% | 7.0% |
| Total frames | 59 | 98 | 61 | 98 | 61 | 99 |
5.2 Attack Procedure
Step 1. We collect images from the display screen to construct the SIT-Net as explained in Section 4.2.
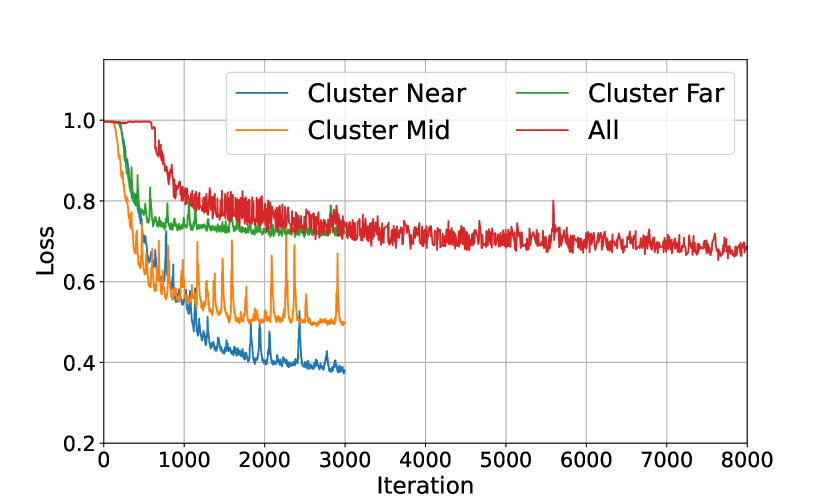
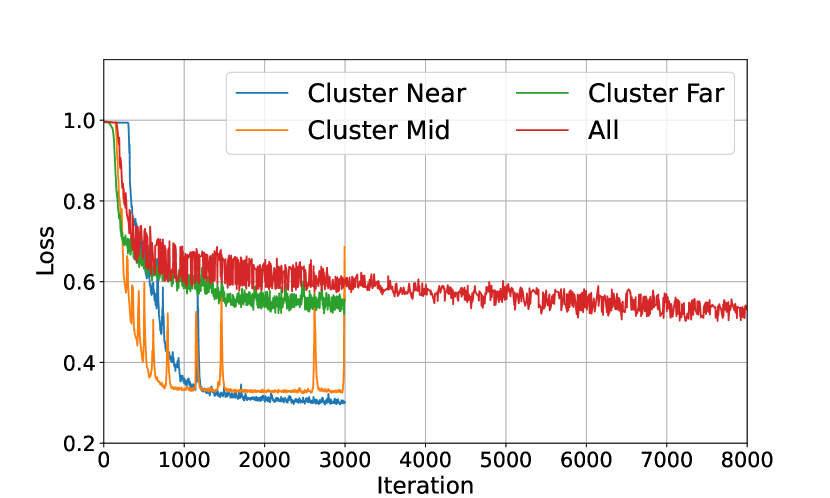
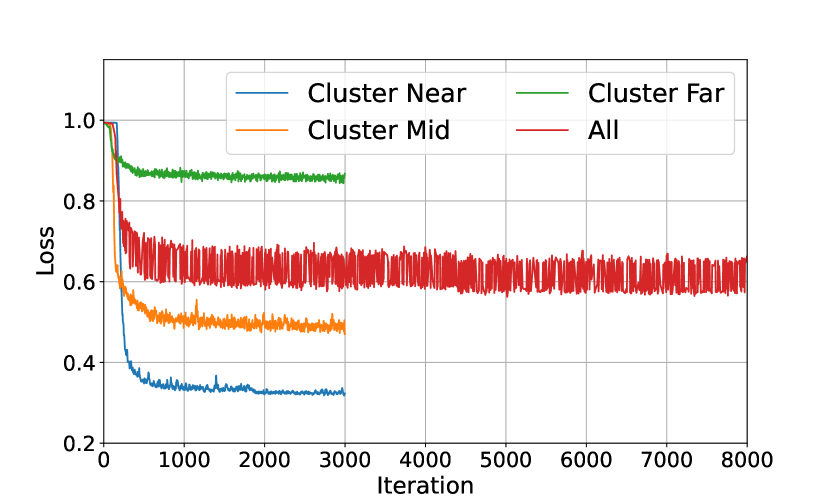
Step 2. We run robot cars in each scenario to collect synchronized Lidar and image data. This dataset is clustered as explained in Section 4.1. The number of clusters hinges on the total distance traversed and the precision of positional estimations. For our experiments, we set the cluster count to three. We utilize this processed dataset to optimize a set of patches using Algorithm 1. We set the training epoch at 1000 for each cluster and start with a randomly generated initial patch. Concurrently, a static patch is trained across all clusters for an identical epoch count.
Step 3. After training, we evaluate the effectiveness of the generated patches by the attack success rate on a subset including images captured in a similar environment and background and on a dataset of images with a background that is not in the attack dataset. An attack is considered successful if the patch makes the object detector predict a stop sign with confidence greater than 0.5 in place of the original sign.
5.3 Results and Discussion
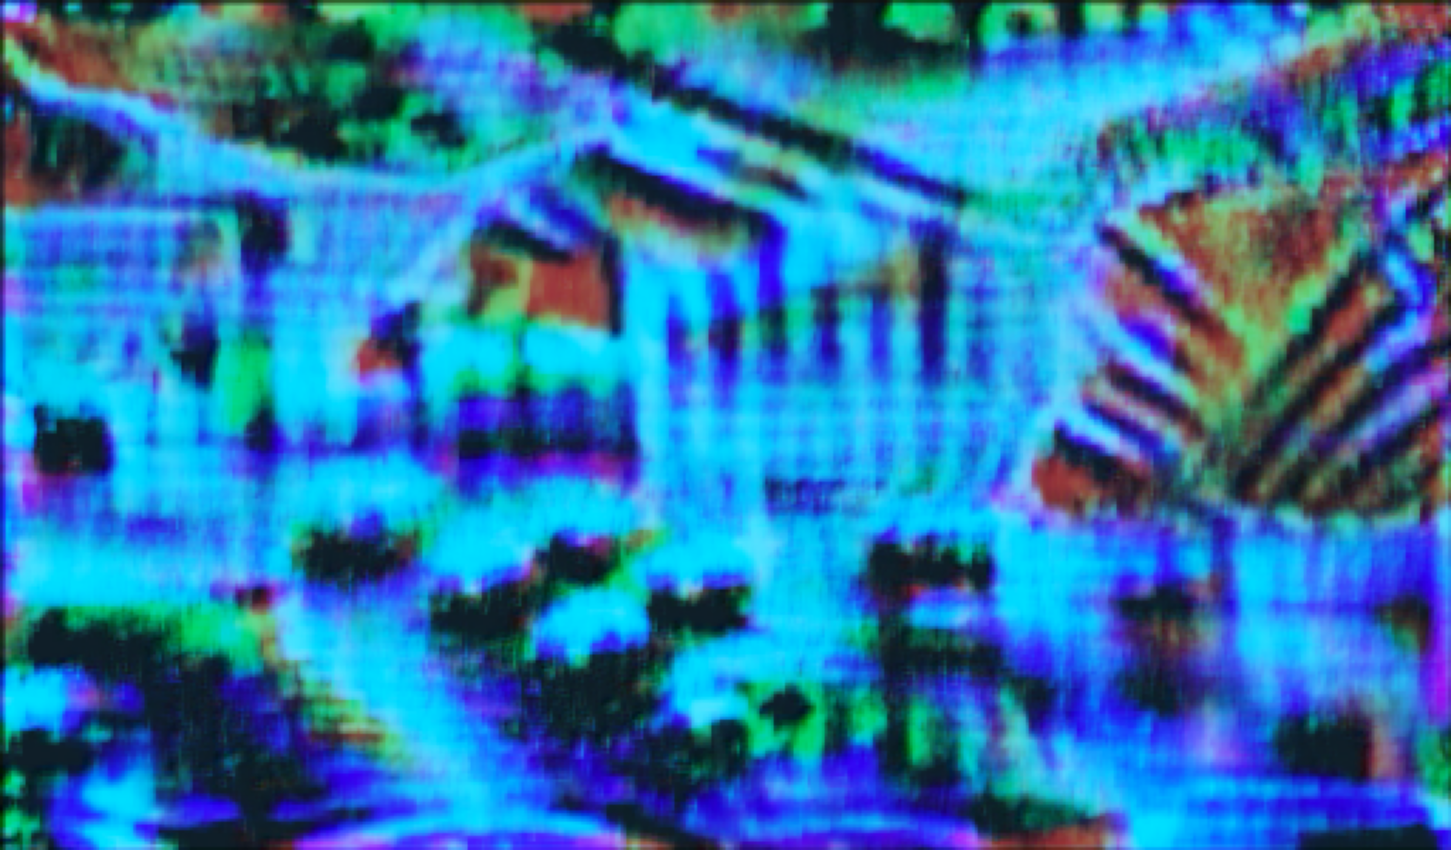
The loss over iterations during training of the patch for each cluster and all dataset is depicted in Figure 7. This demonstrates that optimizing adversarial patches specifically for individual data clusters significantly expedites the training process and enhances the overall effectiveness of the attack. This cluster-based approach benefits from the inherent homogeneity within each cluster, allowing for more rapid optimization compared to a normal training approach on a broader dataset. Dynamic patches, tailored to specific environmental conditions and scenarios, clearly outperformed static patches that attempted to cover all data variances. This is visually represented in Figure 8, which illustrates the variations in attack strategies. A video showing attacks using dynamic patches in various autonomous driving scenarios involving two R2 robot cars is available online222https://youtu.be/2bLEHNTJ1pI. In addition, Figure 9 shows the optimized patches for different clusters and the entire dataset.
Moreover, the designed objective function demonstrates the efficiency in generating a stop sign in the location of the original traffic sign as shown in Figure 8. This functionality is essential for the success of the adversarial attack, as it directly influences the decision-making algorithms of the autonomous driving systems being attacked. By misclassifying crucial traffic signs, the dynamic patches effectively mislead the autonomous vehicle, compelling it to make erroneous navigational decisions.
Further, Table 1 reveals that the success rate of the attacks is higher with the dynamic patch in most cases. This is because the chance of deception is higher in closer clusters. This is significant because it aligns well with the practical requirements of autonomous driving systems, where the accuracy and reliability of object detection are most critical at closer distances for immediate navigational decisions. The enhanced success rate in closer clusters means that our approach could potentially be more effective in real-world scenarios, where misclassification of traffic signs at closer ranges poses a higher risk. Consequently, this could lead to more effective strategies for reducing risks associated with the navigation and planning of autonomous vehicles.
5.4 Conclusions
We formulate a novel approach for attacking object detectors by employing dynamic patches displayed on a screen to influence the decisions of autonomous driving systems. We have demonstrated that data clustering substantially accelerates the training process and enhances the overall efficacy of the attack. Additionally, to address the issue of color transformation in captured images of the displayed patch, we have introduced a straightforward CNN model capable of compensating for environmental factors. Our findings underscore the potential vulnerabilities in the perception mechanisms of autonomous driving systems and highlight the importance of considering such adversarial tactics in the development of robust decision-making algorithms.
References
- Asvadi et al. [2018] Alireza Asvadi, Luis Garrote, Cristiano Premebida, Paulo Peixoto, and Urbano J. Nunes. Multimodal vehicle detection: fusing 3d-lidar and color camera data. Pattern Recognition Letters, 115:20–29, 2018. Multimodal Fusion for Pattern Recognition.
- Athalye et al. [2017] Anish Athalye, Logan Engstrom, Andrew Ilyas, and Kevin Kwok. Synthesizing robust adversarial examples. CoRR, abs/1707.07397, 2017.
- Brown et al. [2017] Tom B. Brown, Dandelion Mané, Aurko Roy, Martín Abadi, and Justin Gilmer. Adversarial patch. ArXiv, abs/1712.09665, 2017.
- Cao et al. [2019] Yulong Cao, Chaowei Xiao, Dawei Yang, Jing Fang, Ruigang Yang, Mingyan Liu, and Bo Li. Adversarial objects against lidar-based autonomous driving systems. CoRR, abs/1907.05418, 2019.
- Chen et al. [2021] Kejiang Chen, Yuefeng Chen, Hang Zhou, Chuan Qin, Xiaofeng Mao, Weiming Zhang, and Nenghai Yu. Adversarial examples detection beyond image space. In ICASSP 2021 - 2021 IEEE International Conference on Acoustics, Speech and Signal Processing (ICASSP), pages 3850–3854, 2021.
- Chen et al. [2018] Shang-Tse Chen, Cory Cornelius, Jason Martin, and Duen Horng Chau. Robust physical adversarial attack on faster R-CNN object detector. CoRR, abs/1804.05810, 2018.
- Du et al. [2022] Andrew Du, Bo Chen, Tat-Jun Chin, Yee Wei Law, Michele Sasdelli, Ramesh Rajasegaran, and Dillon Campbell. Physical adversarial attacks on an aerial imagery object detector. In Proceedings of the IEEE/CVF Winter Conference on Applications of Computer Vision (WACV), pages 1796–1806, 2022.
- Fawzi et al. [2016] Alhussein Fawzi, Seyed-Mohsen Moosavi-Dezfooli, and Pascal Frossard. Robustness of classifiers: from adversarial to random noise. CoRR, abs/1608.08967, 2016.
- Geng et al. [2020] Keke Geng, Ge Dong, Guodong Yin, and Jingyu Hu. Deep dual-modal traffic objects instance segmentation method using camera and lidar data for autonomous driving. Remote Sensing, 12(20):3274, 2020.
- Gerkey [Accessed: 2023] Brian P. Gerkey. amcl: Adaptive monte carlo localization. ROS Wiki, Accessed: 2023. Available: http://wiki.ros.org/amcl.
- Gildenblat and contributors [2021] Jacob Gildenblat and contributors. Pytorch library for cam methods. https://github.com/jacobgil/pytorch-grad-cam, 2021.
- Hoory et al. [2020] Shahar Hoory, Tzvika Shapira, Asaf Shabtai, and Yuval Elovici. Dynamic adversarial patch for evading object detection models. CoRR, abs/2010.13070, 2020.
- Huang et al. [2019] Lifeng Huang, Chengying Gao, Yuyin Zhou, Changqing Zou, Cihang Xie, Alan L. Yuille, and Ning Liu. UPC: learning universal physical camouflage attacks on object detectors. CoRR, abs/1909.04326, 2019.
- Jia et al. [2022] Wei Jia, Zhaojun Lu, Haichun Zhang, Zhenglin Liu, Jie Wang, and Gang Qu. Fooling the eyes of autonomous vehicles: Robust physical adversarial examples against traffic sign recognition systems. Internet Society, 2022.
- Jocher et al. [2020] Glenn Jocher, Alex Stoken, Jirka Borovec, NanoCode012, ChristopherSTAN, Liu Changyu, Laughing, tkianai, Adam Hogan, lorenzomammana, yxNONG, AlexWang1900, Laurentiu Diaconu, Marc, wanghaoyang0106, ml5ah, Doug, Francisco Ingham, Frederik, Guilhen, Hatovix, Jake Poznanski, Jiacong Fang, Lijun Yu, changyu98, Mingyu Wang, Naman Gupta, Osama Akhtar, PetrDvoracek, and Prashant Rai. ultralytics/yolov5: v3.1 - Bug Fixes and Performance Improvements, 2020.
- Lee and Kolter [2019] Mark Lee and Zico Kolter. On physical adversarial patches for object detection. 2019.
- Li et al. [2019] Juncheng Li, Frank Schmidt, and Zico Kolter. Adversarial camera stickers: A physical camera-based attack on deep learning systems. In Proceedings of the 36th International Conference on Machine Learning, pages 3896–3904. PMLR, 2019.
- Lovisotto et al. [2020] Giulio Lovisotto, H.C.M. Turner, Ivo Sluganovic, Martin Strohmeier, and Ivan Martinovic. Slap: Improving physical adversarial examples with short-lived adversarial perturbations. In USENIX Security Symposium, 2020.
- Lu et al. [2017a] Jiajun Lu, Theerasit Issaranon, and David A. Forsyth. Safetynet: Detecting and rejecting adversarial examples robustly. CoRR, abs/1704.00103, 2017a.
- Lu et al. [2017b] Jiajun Lu, Hussein Sibai, Evan Fabry, and David A. Forsyth. NO need to worry about adversarial examples in object detection in autonomous vehicles. CoRR, abs/1707.03501, 2017b.
- Mahendran and Vedaldi [2015] Aravindh Mahendran and Andrea Vedaldi. Understanding deep image representations by inverting them. In 2015 IEEE Conference on Computer Vision and Pattern Recognition (CVPR), pages 5188–5196, 2015.
- Moosavi-Dezfooli et al. [2016] Seyed-Mohsen Moosavi-Dezfooli, Alhussein Fawzi, Omar Fawzi, and Pascal Frossard. Universal adversarial perturbations. CoRR, abs/1610.08401, 2016.
- Muhammad and Yeasin [2020] Mohammed Bany Muhammad and Mohammed Yeasin. Eigen-cam: Class activation map using principal components. In 2020 international joint conference on neural networks (IJCNN), pages 1–7. IEEE, 2020.
- Nguyen et al. [2014] Anh Mai Nguyen, Jason Yosinski, and Jeff Clune. Deep neural networks are easily fooled: High confidence predictions for unrecognizable images. CoRR, abs/1412.1897, 2014.
- Redmon et al. [2016] Joseph Redmon, Santosh Divvala, Ross Girshick, and Ali Farhadi. You only look once: Unified, real-time object detection. In Proceedings of the IEEE conference on computer vision and pattern recognition, pages 779–788, 2016.
- Ren et al. [2015] Shaoqing Ren, Kaiming He, Ross B. Girshick, and Jian Sun. Faster R-CNN: towards real-time object detection with region proposal networks. CoRR, abs/1506.01497, 2015.
- Sabour et al. [2015] Sara Sabour, Yanshuai Cao, Fartash Faghri, and David J. Fleet. Adversarial manipulation of deep representations, 2015.
- Sharif et al. [2016] Mahmood Sharif, Sruti Bhagavatula, Lujo Bauer, and Michael K. Reiter. Accessorize to a crime: Real and stealthy attacks on state-of-the-art face recognition. In Proceedings of the 2016 ACM SIGSAC Conference on Computer and Communications Security, page 1528–1540, New York, NY, USA, 2016. Association for Computing Machinery.
- Simonyan and Zisserman [2014] Karen Simonyan and Andrew Zisserman. Very deep convolutional networks for large-scale image recognition. 2014.
- Song et al. [2018] Dawn Song, Kevin Eykholt, Ivan Evtimov, Earlence Fernandes, Bo Li, Amir Rahmati, Florian Tramèr, Atul Prakash, and Tadayoshi Kohno. Physical adversarial examples for object detectors. In 12th USENIX Workshop on Offensive Technologies (WOOT 18), Baltimore, MD, 2018. USENIX Association.
- Stereolabs [2023] Stereolabs. Zed 2 - ai stereo camera, 2023. Technical specifications and features of ZED 2 camera.
- Szegedy et al. [2013a] Christian Szegedy, Alexander Toshev, and Dumitru Erhan. Deep neural networks for object detection. In Advances in Neural Information Processing Systems. Curran Associates, Inc., 2013a.
- Szegedy et al. [2013b] Christian Szegedy, Wojciech Zaremba, Ilya Sutskever, Joan Bruna, Dumitru Erhan, Ian Goodfellow, and Rob Fergus. Intriguing properties of neural networks, 2013b.
- Thys et al. [2019] Simen Thys, Wiebe Van Ranst, and Toon Goedemé. Fooling automated surveillance cameras: adversarial patches to attack person detection. CoRR, abs/1904.08653, 2019.
- Van Brummelen et al. [2018] Jessica Van Brummelen, Marie O’Brien, Dominique Gruyer, and Homayoun Najjaran. Autonomous vehicle perception: The technology of today and tomorrow. Transportation Research Part C: Emerging Technologies, 89:384–406, 2018.
- Wang et al. [2021] Jiakai Wang, Aishan Liu, Zixin Yin, Shunchang Liu, Shiyu Tang, and Xianglong Liu. Dual attention suppression attack: Generate adversarial camouflage in physical world. CoRR, abs/2103.01050, 2021.
- Wang et al. [2023] Ningfei Wang, Yunpeng Luo, Takami Sato, Kaidi Xu, and Qi Alfred Chen. Does physical adversarial example really matter to autonomous driving? towards system-level effect of adversarial object evasion attack. In Proceedings of the IEEE/CVF International Conference on Computer Vision, pages 4412–4423, 2023.
- Xie et al. [2020] Liang Xie, Chao Xiang, Zhengxu Yu, Guodong Xu, Zheng Yang, Deng Cai, and Xiaofei He. Pi-rcnn: An efficient multi-sensor 3d object detector with point-based attentive cont-conv fusion module. Proceedings of the AAAI Conference on Artificial Intelligence, 34(07):12460–12467, 2020.
- Xu et al. [2019] Kaidi Xu, Sijia Liu, Pu Zhao, Pin-Yu Chen, Huan Zhang, Quanfu Fan, Deniz Erdogmus, Yanzhi Wang, and Xue Lin. Structured adversarial attack: Towards general implementation and better interpretability. In International Conference on Learning Representations, 2019.
- Xu et al. [2020] Kaidi Xu, Gaoyuan Zhang, Sijia Liu, Quanfu Fan, Mengshu Sun, Hongge Chen, Pin-Yu Chen, Yanzhi Wang, and Xue Lin. Adversarial t-shirt! evading person detectors in a physical world. In Computer Vision – ECCV 2020, pages 665–681, Cham, 2020. Springer International Publishing.
- Yahboom Technology [Accessed: 2023] Yahboom Technology. Rosmaster r2 study material. Yahboom Technology, Accessed: 2023. Available: http://www.yahboom.net/study/ROSMASTER-R2.
- Zhao et al. [2019a] Pu Zhao, Kaidi Xu, Sijia Liu, Yanzhi Wang, and Xue Lin. Admm attack: an enhanced adversarial attack for deep neural networks with undetectable distortions. In Proceedings of the 24th Asia and South Pacific Design Automation Conference, pages 499–505, 2019a.
- Zhao et al. [2019b] Yue Zhao, Hong Zhu, Ruigang Liang, Qintao Shen, Shengzhi Zhang, and Kai Chen. Seeing isn’t believing: Towards more robust adversarial attack against real world object detectors. In Proceedings of the 2019 ACM SIGSAC Conference on Computer and Communications Security, page 1989–2004, New York, NY, USA, 2019b. Association for Computing Machinery.