Self-assembly of Colloids with Competing Interactions Confined in Spheres
Abstract
At low temperatures, colloidal particles with short-range attractive and long-range repulsive interactions can form various periodic microphases in bulk.In this paper, we investigate the self-assembly behaviour of colloids with competing interactions under spherical confinement by conducting molecular dynamics simulations. We find that the cluster, mixture, cylindrical, perforated lamellar and lamellar structures can be obtained, but the details of the ordered structures are different from those in bulk systems. Interestingly, the system tends to form more perforated structures when confined in smaller spheres. The mechanism behind this phenomenon is the relationship between the energy of the ordered structures and the bending of the confinement wall, which is different from the mechanism in copolymer systems.
I Introduction
Self-assembly is a ubiquitous process in which multiple subunits spontaneously organise into collective and coherent structures or patterns. It plays an important role in both non-living and living systems, including polymers, colloids, liquid crystals, biomembranes, and proteins[1, 2]. Applications of self-assembly include nanotechnology and nanostructure producing in polymer systems and colloidal systems[3, 4, 5].
Colloids with short-range attractive and long-range repulsive (SALR) interactions have attracted research interest in recent years. Previous studies have shown how the attractive and repulsive interactions of these colloids can be controlled experimentally, by precisely controlling the paremeters of colloidal suspensions[6, 7] and very recently dynamic control over the interparticle interactions by adding magnetic nanoparticles together with external magnetic fields[8, 9]. The framework of competing interactions also applies to proteins, amphiphilic and other systems[10, 11, 12, 13, 14, 15, 7]. Studies of the self-assembly of colloids with SALR interactions suggest that short-range interparticle attraction is frustrated by long-range repulsion, preventing particles from merging and thus leading such systems to microphase separation and forming ordered phases at low temperatures, including cluster phase, cylindrical phase, lamellar phase, and others[16, 17, 18, 19]. These phases are also observed in bulk diblock copolymer systems[20, 21, 22, 23, 24, 25, 26]. The remarkable similarity between the bulk phase diagram of colloids with SALR interactions and that of diblock copolymers has been confirmed by computer simulations[17] and a Landau-Brazovskii model has been proposed to explain it[27].
Self-assembly under confinement often leads to richer patterns and structures[28, 29, 30]. The self-assembly of diblock copolymers under various confinements has been extensively studied[30, 31, 32, 33, 34, 35, 36, 37, 38, 39, 40, 41, 42, 43, 44, 45, 46], among which shows that helical morphologies are observed in systems confined in cylindrical pores with neutral surfaces[47, 48, 49, 30]. Meanwhile, the self-assembly of colloids with SALR interactions confined in slit pores or cylinders has also been studied[50, 51, 52], among which suggests that helical structures are formed in systems confined in cylindrical pores[51], similar to that in diblock copolymer systems[47, 48, 49, 30]. Structures such as perpendicular lamellae, helices, embedded structures, perforated lamellar structures and concentric-spherical lamellae are predicted for diblock copolymers confined inside spherical cavities in theoretical and simulation studies[39, 38, 46, 45, 53, 43, 44, 30]. SALR fluid on spherical surfaces and SALR colloids forming cylindrical structures within spherical shells also have been studied recently[54, 55]. However, the self-assembly of colloids with SALR interactions confined in spherical cavity is not fully understood yet.
In order to elucidate the similarities and differences between the self-assembly of SALR colloids and diblock copolymers under spherical confinement, in this paper we investigate the self-assembly of colloids with SALR interactions confined in spheres via molecular dynamics simulations. We compare the self-assembly behaviour between our confinement systems and bulk systems, as well as diblock copolymer systems. The differences of structures between spherically confined copolymer systems and bulk copolymer systems are solely due to the surface preference for a certain block[30]. In contrast, we reveal that the differences of structures between our systems and bulk colloidal systems are due to the bending of the confinement wall.
II Model and Methods
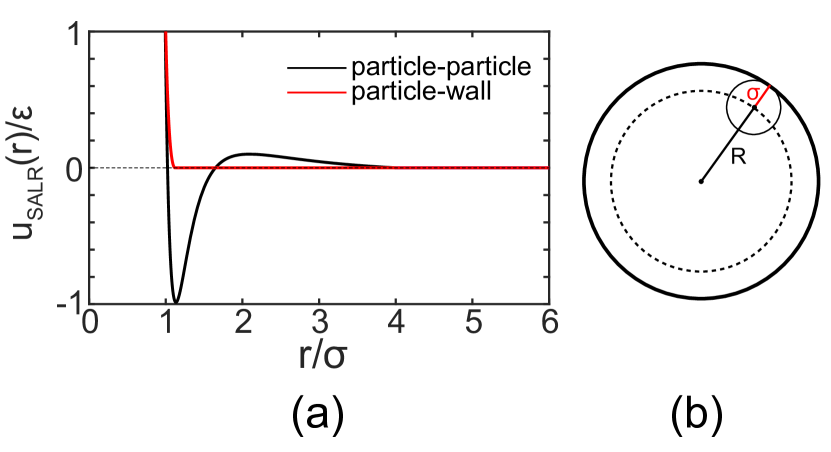
The interaction between colloidal particles is described by an effective SALR potential, which is the addition of a Lennard-Jones (LJ) potential plus a screened electrostatic interaction represented by the Yukawa potential (LJY):
| (1) |
where is the distance between particles and ; and are the usual LJ parameters. The parameter measures the strength of the electrostatic interaction, and is the Debye screening length. The parameters are given the same values as in the bulk systems[18]. The potential function for , , and is shown as the black curve in Fig. 1(a). In particular, we truncate the potential at to improve computational efficiency. In the following, we use and as the units of distance and energy respectively.
The confinement is imposed by placing a spherical wall with a radius of . Particles interact with the wall via truncated Lennard-Jones potential (WCA)[56]:
| (2) |
where , , and is the distance between particle and the spherical wall . The WCA potential between the particles and the spherical wall is shown as the red curve in Fig. 1(a). The total energy of this system is given by
| (3) |
We employ molecular dynamics (MD) by using the open-source package LAMMPS[57, 58]. We choose a confinement radius range of – and a system density of or less for our simulations. We employ the simulated annealing method to accelerate the equilibration of the systems and obtain the structures at low temperature[59]. The temperature is controlled by a Langevin thermostat with a relaxation time of , where the time step is . The simulations are run for time steps for equilibration at each temperature. The annealing process starts from the temperature to with a temperature step of , and then continues from to with a temperature step of .
The radius of the free volume for particles is illustrated in Fig. 1(b). The number density is calculated based on free volume, which is defined as . The radial density distribution is defined by
| (4) |
where is the number of particles between and . We set in our calculation. All plots of radial density distribution are averaged from 10000 configurations, each of which is sampled every .
The various snapshots of the systems are plotted by the open-source visualisation software OVITO[60]. In order to clearly visualise the global structures, the alpha-shape method[61] and the Gaussian density method[62] are employed, which are surface mesh functions in OVITO.
The bond-orientation order parameters and the hexatic order parameter for particles are calculated[63, 64]. For each particle , bond-orientation order parameter is a real number defined as , where . Here are the spherical harmonics, bond vector is from particle to one of its nearest neighbours, particle , and is the number of nearest neighbours. We choose and in our calculation. The data of and are obtained by the LAMMPS compute command.
For each particle in a 2D system, hexatic order parameter is defined as , where is the number of nearest neighbours, bond vector is from particle to one of its nearest neighbours, particle , and the angle is formed by the bond vector and the given axis. Though the systems we investigate are 3D, we calculate the of a particular particle by projecting the particle and its nearest neighbours in a spherical layer onto its tangent plane.
III Results and Discussions
The phase diagram is shown in Fig. 2. The density range we investigate is from to , with a density separation between two adjacent simulated parameters. The systems spotaneously form ordered structures at low temperature for chosen parameters.
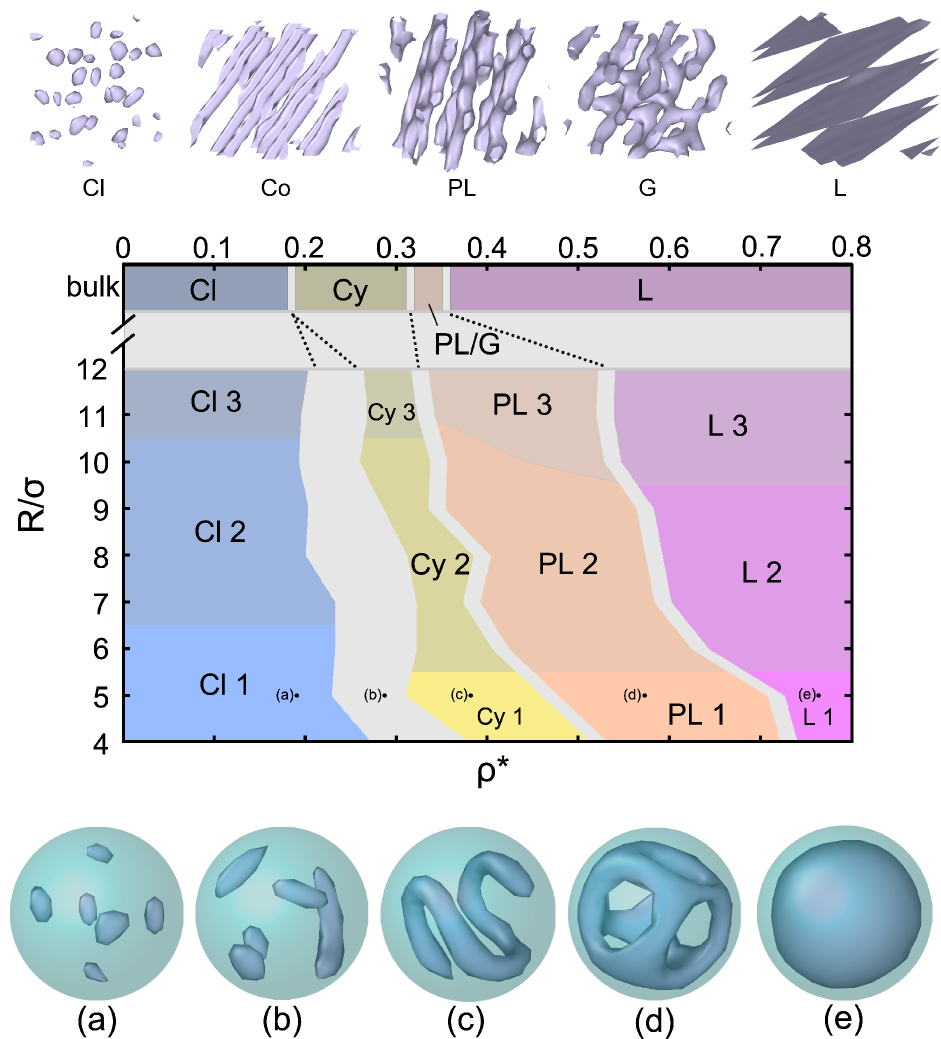
As density increases, we obtain four ordered structures of cluster, cylindrical, perforated lamellar and lamellar in turn. The structure formed at each thermodynamic state is identified from surface snapshots. Spherelike clusters are identified as cluster strcutures. Long cylinders or rings with no or only one small cluster in the centre are identified as cylindrical structures. Concentric structures with three-fold or more than three-fold junctions are identified as perforated lamellar structures. We identify the structures as lamellar when there are no holes observed on the surface.
For the points near the phase boundary on the phase diagram, we performed 10 simulations, for the other points on the phase diagram, we performed 6 simulations. Points where the same structure consistently appears are identified as corresponding to that structure (i.e. the coloured regions in the phase diagram Fig 2), while points where different structures emerge are identified as co-existence zones (i.e. the gray regions in the phase diagram Fig 2). We select the midpoint between two adjacent points representing different structures as the phase boundary on the phase diagram.
The phase boundaries generally tend to be at higher density with smaller confinement radius. When we compare our systems with the bulk systems, we find that there is no wide co-existence zone from cluster to cylinder in the bulk systems. But there is a wide co-existence region between cluster structures and cylindrical structures in the phase diagram, where the mixture of clusters and short cylinders are observed. In bulk systems, the region of the perforated lamellar structures in the phase diagram is very narrow. The gyroid structures are observed in bulk systems. However, the gyroid structures are not observed in either colloidal systems or polymer systems under confinement.
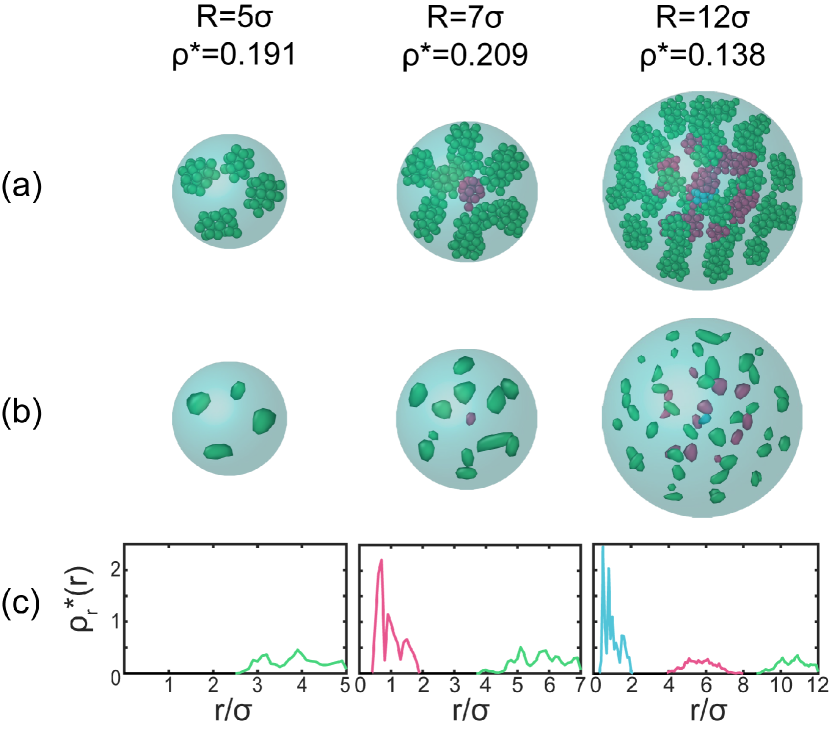
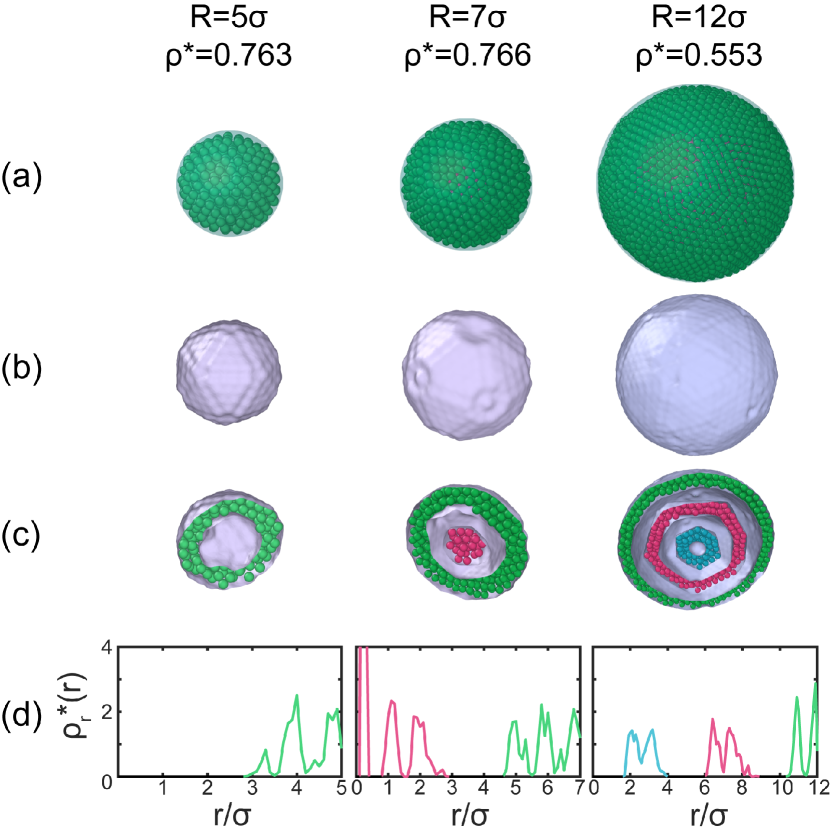
Cluster. We show typical snapshots of cluster structures in Fig. 3(a) and (b). As the confinement radius of the system increases, the radial distribution of clusters form one-, two- and three-layer structures, which can be clearly recognized by the radial density distribution in Fig. 3(c).
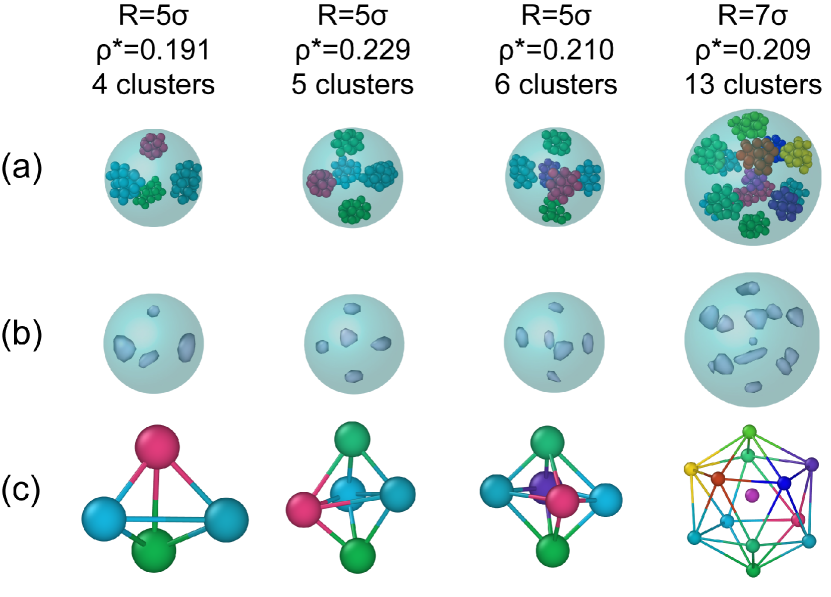
We also find that the outermost clusters are arranged into vertices of regular Platonic solids (convex regular polyhedrons) at low temperatures in some cases (Fig. 4). This is very similar to diblock copolymer systems, and the packing of geometric solids under spherical confinement[42, 65]. Among these polyhedrons, some are identified as ortho-tetrahedrons, ortho-octahedrons, ortho-icosahedrons, and others, as shown in Fig. 4. While in bulk systems, the cluster phase forms a lattice structure close to face-centred cubic (FCC) or body-centred cubic (BCC)[18].
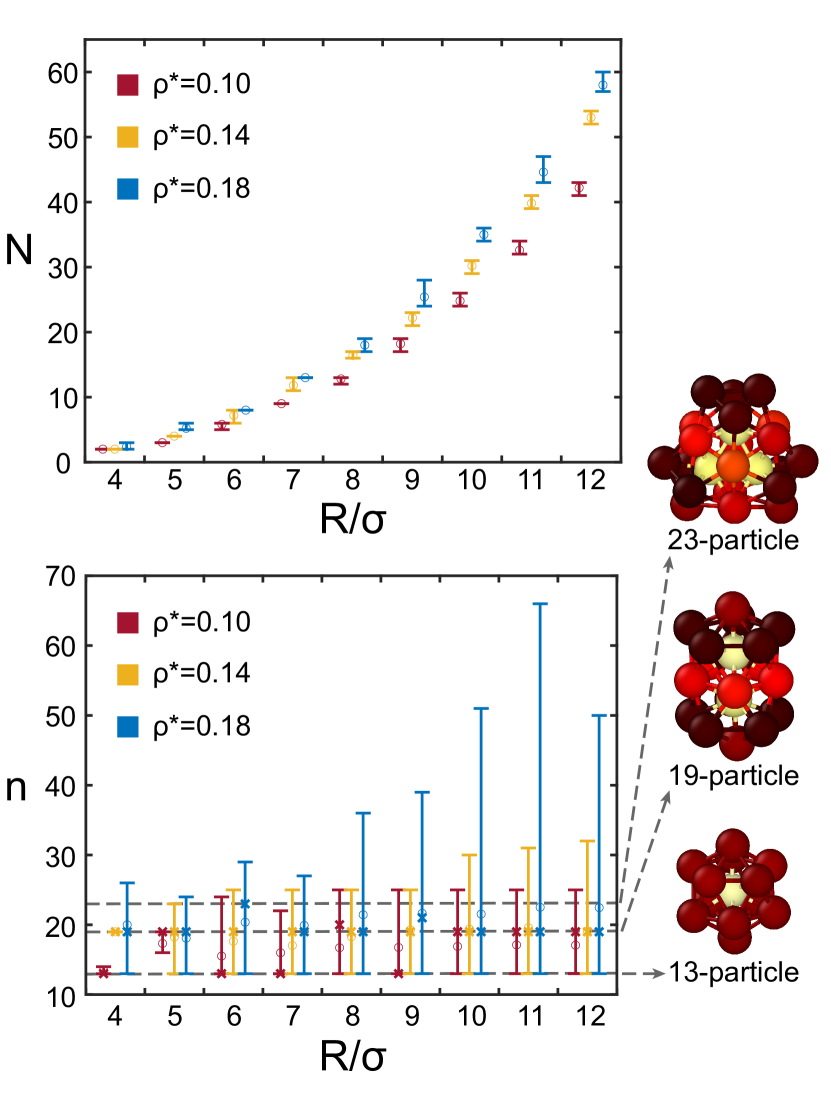
We count the number and size of clusters from multiple simulations at each thermodynamic parameters. For all of our simulation results, no clusters with less than 13 particles are observed. When the density is , some big clusters emerge for it is close to the co-existence zone between cluster and cylinder. Though there is some big clusters with more than 30 particles, they are always very few. We notice that clusters with 13, 19, and 23 particles are usually the most in our system. The shapes of clusters with 13 particles, 19 particles and 23 particles are regular, as shown in Fig. 5, which is the same as the results in the bulk system[18].
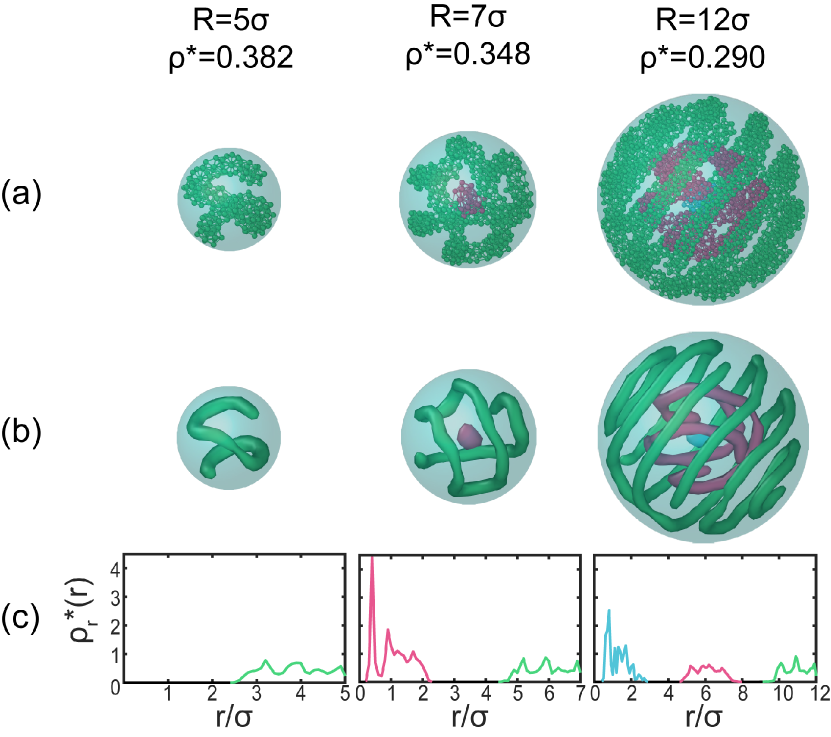
Cylindrical. We show typical snapshots of cylindrical structures in Fig. 6(a) and (b). Clearly, the radial distribution of cylinders form one-, two- and three-layer structures as the confinement radius increases, which can also be recognized by the radial density distribution in Fig. 6(c). The cylinders are curved along the spherical wall, which is different from bulk systems where the cylinders mostly maintain a straight shape[18].
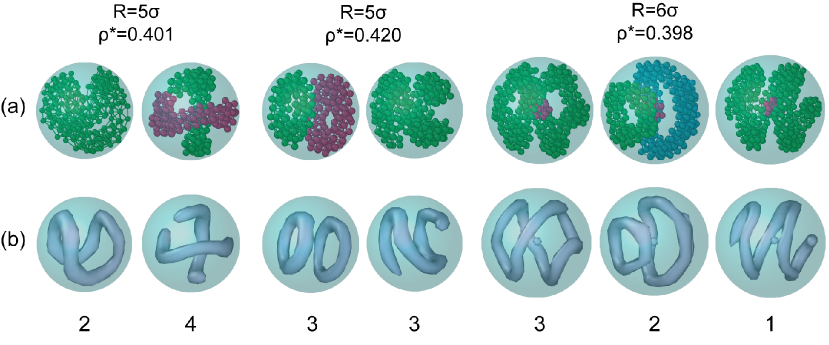
Multiple cylindrical structures can be obtained at the same thermodynamic state, which is similar to confined diblock copolymer systems[42]. Bent cylindrical strutures, ring structures and saddle-shape structures can be formed, with snapshots shown in Fig. 7. We perform 6 simulations with different random seeds for each thermodynamic state. The average energy per particle is nearly equal for different cylindrical structures obtained at the same thermodynamic state. Examples include that the average energy per particle is around when and , around when and , and around when and . Different cylindrical structures are obtained at different frequencies in different thermodynamic states. Configurations and occurrence frequencies of frequent structures at some specific thermodynamic states are shown in Fig. 7. The morphology of the saddle-shape structure is similar to the semiflexible ring polymers under spherical confinement[66]. As the density increases, the saddle-shape ring might bend further, or forming multiple rings, or becoming longer cylinders (Fig. 7).
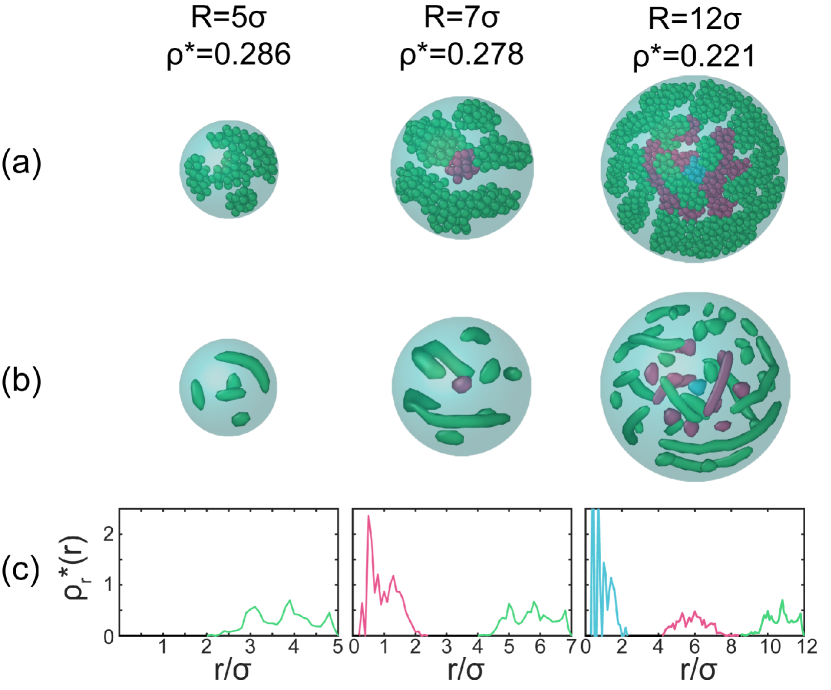
When the density is between the density of forming the cluster and cylindrical structures, mixture structures of clusters and cylinders are formed, with typical snapshots shown in Fig. 8(a) and (b). It is a very wide co-existence region of clusters and cylinders. The radial distribution of mixtures forms one-, two- and three-layer structures as the confinement radius increases, which is the same as previously discussed in cluster structures and cylindrical structures. The radial density distribution is plotted in Fig. 8(c).
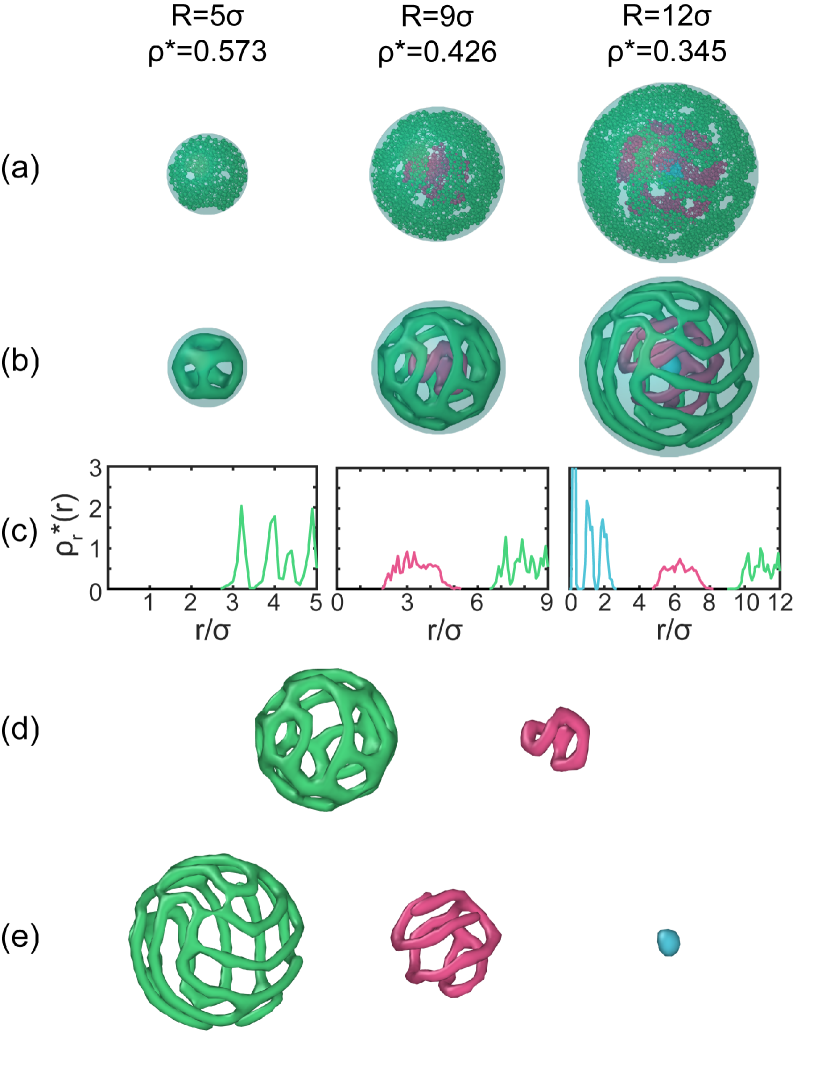
Perforated Lamellar. With density larger than that of forming the cylindrical structures, perforated lamellar structures are formed. Typical snapshots are shown in Fig. 9(a) and (b). As the density increases, the cylinders are connected to each other. These structures are similar to the structures of diblock copolymers confined in spheres[39, 41]. Clearly, systems exhibit multi-layer structures as the wall radius gradually increases, which can also be recognized by the radial density distribution shown in Fig. 9(c). We note that at and , the system is a two-layer structure (Fig. 9(d)). Both the outer layer and the inner layer are perforated lamellar structure. While at and , the innermost particles form a cluster (Fig. 9(e)).
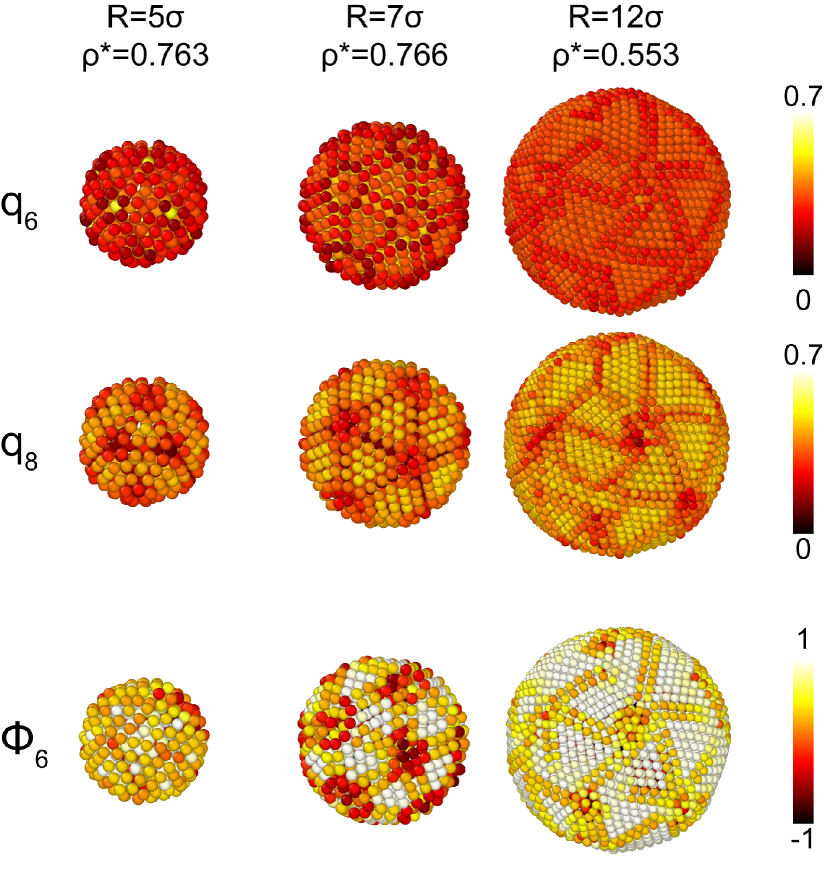
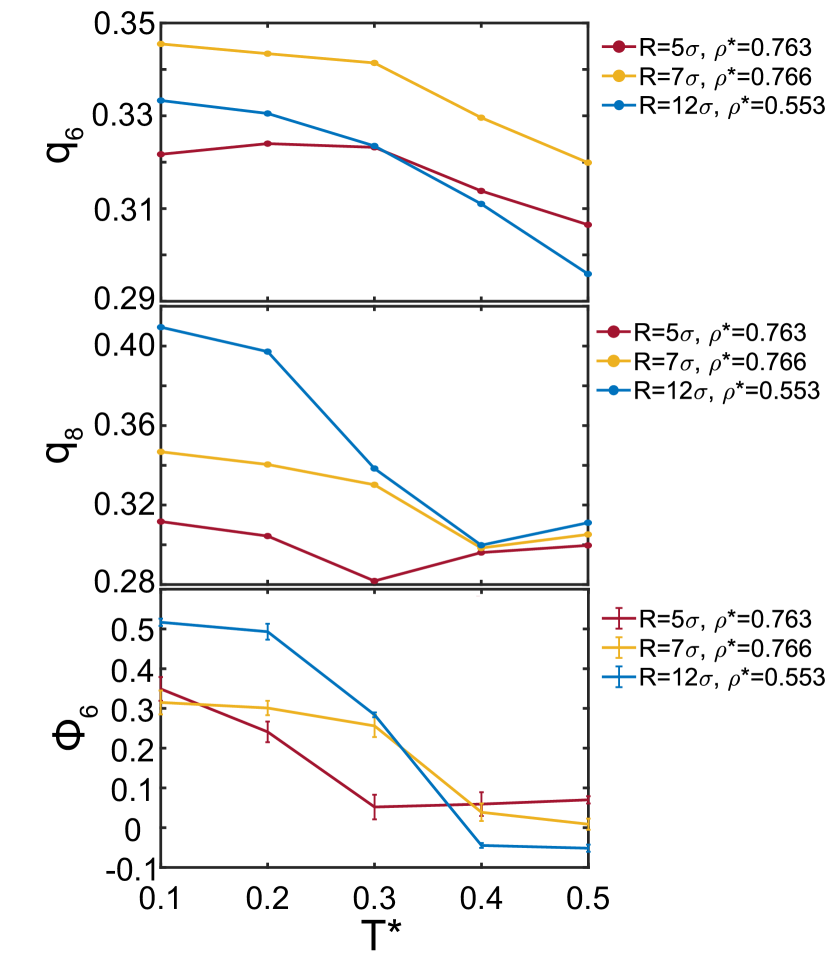
Lamellar. When the systems are denser, lamellar structures are formed. The lamellae crystallise at low temperatures (as shown in Fig. 10(a) and (b), Fig 11), which is not observed in confined diblock copolymer systems[30]. According to the plots shown in Fig. 12, when the temperature is over , the order parameter is nearly and and are also small, which suggests that the system is disordered at high temperatures. The order parameters , and significantly increase at low temperatures, meaning that systems become ordered and the lamellae crystallise except for unavoidable defects. The local shape of the spherical lamella is nearly flat to form an energetically favourable structure (Fig. 10(b)). Similar to experimental and simulated results involving other colloids or hard geometric solids, crystallised lamellae form ortho-icosahedrons[67, 68, 69, 70, 71]. We can find that there are obvious patterns of defects, satisfying the topologic requirement.
In bulk systems, the lamellar structure behaves as flat lamellae parallel to each other[18]. In our systems, the particles form a concentric spherical lamellar structure, which is also observed in spherically confined diblock copolymer systems[39, 30]. As the wall radius increases, the system gradually exhibits a multilayer structure (Fig. 10(c)). Each layer will form a same lamellar structure when the density and the confinement radius is appropriate. The thickness of each lamella is 2 or 3 particles, as shown in the snapshots in Fig. 10(c) and the radial density distribution in Fig. 10(d). The thickness of each spherical lamella is not fixed. It is influenced by the size and density.
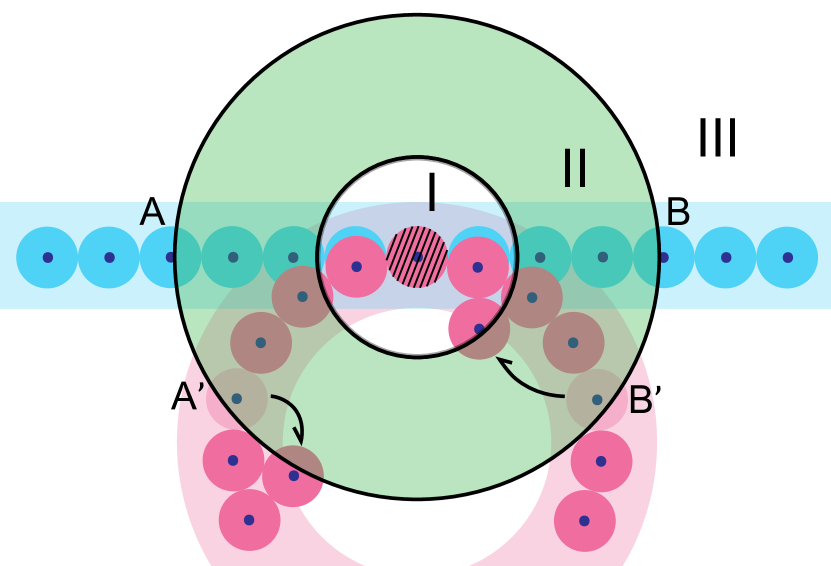
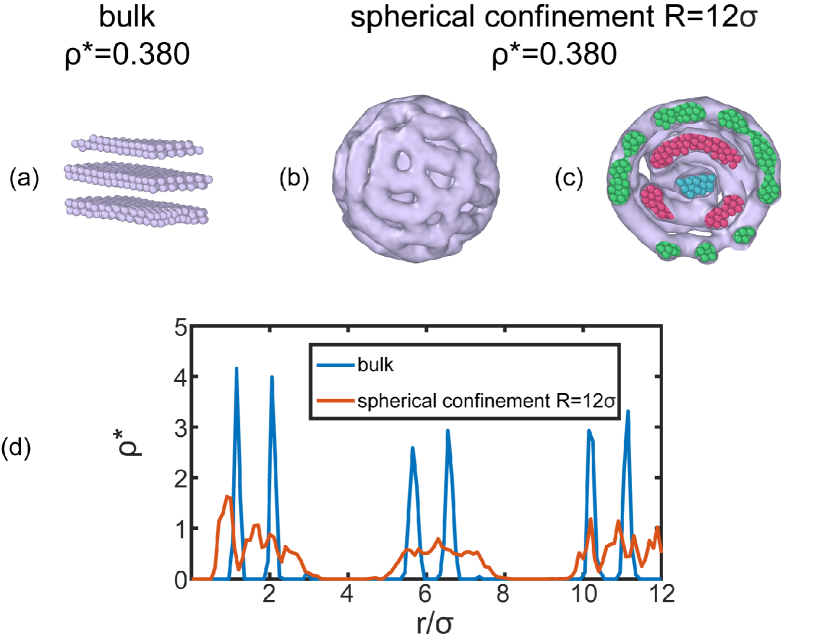
The phase boundaries generally tend to be at greater density with smaller wall radius (Fig. 2). We proposed the mechanism for explaining this phenomenon, with an illustration shown in Fig. 13. The layer composed of particles is flat in bulk systems, while it will bend when it is confined in a spherical wall. As the layer bends along with the spherical wall, some particles in the region III in Fig. 13 enter the region II, increasing the average energy per particle. Particles entering region II will be attracted by the shaded particle into the lower-energy region I, or be repelled to the lower-energy truncated region III, therefore the layer will be thicker and more perforated, reducing the additional positive potential energy. Consequently, more perforated lamellar structures are formed at the density where lamellar structures are formed in bulk systems. Concretely, when the density is , a lamellar structure is formed in the bulk system, while a perforated lamellar structure is formed when it was confined in a sphere with (Fig. 14(a), (b), and (c)). Due to the same reason, colloids confined in spheres tend to form more cylindrical structures at the density where perforated lamellar structures are formed in bulk systems.
Furthermore, the smaller the wall radius is, the greater the curvature of the lamella becomes, which means that more particles enter the region II, resulting more increase in average energy per particle. Thus, the system is energetically more favourable for forming a perforated structure when the confinement radius is smaller, which results in the phase boundaries tilting to the right.
Our simulations show that colloidal systems under spherical confinement tend to form more perforated lamellar structures than colloidal systems in bulk (Fig. 14(a), (b), and (c)). Though our systems form perforated lamellar structures with a smaller outer surface, the perforated lamella is thicker than the lamellae in bulk (which can be clearly recognised by the density distribution shown in Fig. 14(d)), suggesting that the number of particles in one layer being almost unchanged. Also, the structure of each layer is almost the same. It suggests that, compared with the bulk system, when layer in a confinement system become bent, the particles at the layer relocate within the same layer as shown in the Fig. 13 and form more perforated and thicker structures, rather than relocating to another layer.
In terms of lamellae in bulk systems, the distance between lamellae is between and (see the blue curve in Fig. 14(d)). It means that diferent particles at different lamellae interact with each other in the end of the repulsive region with very small potential energy, or in the cut-off region (see the potential function in Fig. 1(a)). If more perforated and thicker lamellar structures are formed in the bulk system, the distance between different lamellae become closer, around , and more particles will interact in the repulsive region with greater potential energy. These particles get much greater positive potential energy from interlayer interaction, thus it is not energetically favourable to form perforated structures in bulk. However, as previously discussed, forming perforated and thicker structures can reduce the additional intralayer potential energy in confinement systems. The reduction of intralayer energy is greater than the increase of interlayer energy brought by becoming thicker. This competition between interlayer energy and intralayer energy results in more perforation under confinement but less perforation in bulk.
The confinement wall we use is neutral which only has volume exclusion. Colloids confined in spheres form more perforated structures than in bulk, while the diblock copolymers confined in neutral spherical walls are not obviously perforated than in bulk[30]. The reason for this difference is that, there is not a mechanism of bending in confined diblock copolymer systems. In confined diblock copolymer systems, the interaction between the wall and the block dominates, and blocks tend to relocate themselves among different layers. The self-assembly structures are significantly different according to the wall surface preference for the block[39, 30].
We measure the average energy per particle for dentities , , and , at for different confinement radii. At the same density, the average energy per particle in our systems is below that in bulk systems, which is shown in Fig. 15. The explanation for this pheomenon is illustrated in Fig. 16. In both bulk and confinement systems, the distance between lamellae (or cylinders, or clusters) remains around (see e.g. Fig. 14(d)). Particles at this distance repel each other with a positive potential energy. As a result, there is a positive potential energy between the outer particles and the inner particles. In spherical confinement systems, the energy given by outside of the outermost particles vanished (Fig. 16 right column), resulting in a decrease in average energy per particle compared with the bulk systems (Fig. 16 left column). At the same time, the smaller the confinement radius is, the larger the ratio of the surface particle number to the number of all particles becomes, meaning that more energy per particle vanished. This causes the energy diagram to reflect a trend that the smaller the wall radius is, the smaller the average energy per particle of the system is.
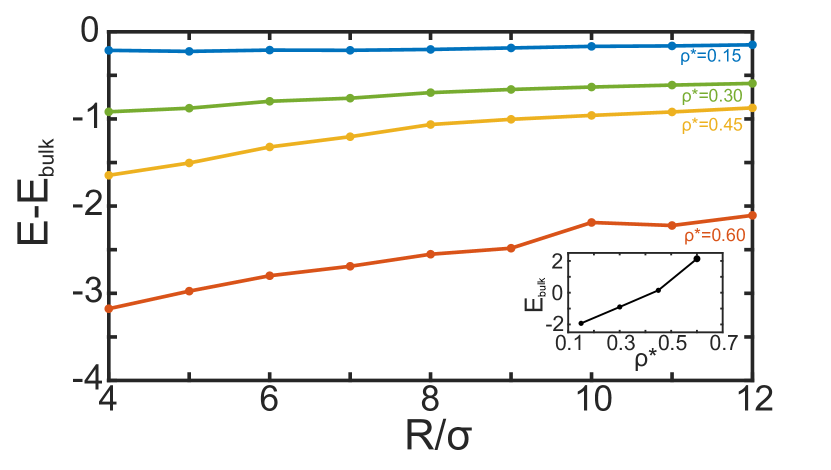
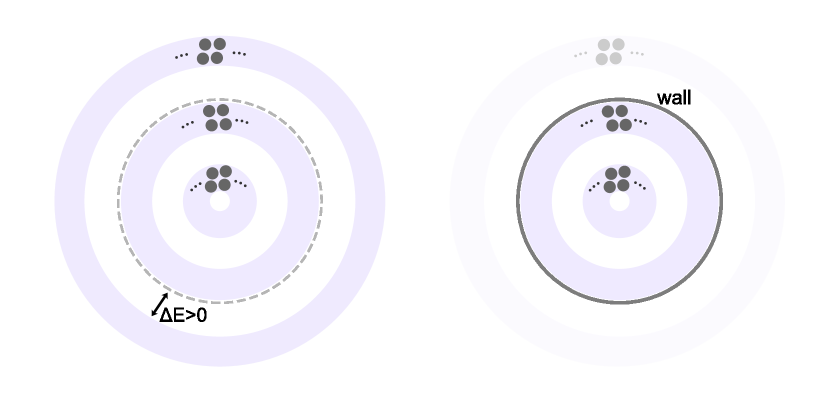
The confinement causes additional positive energy generated by the bending of the layer. But the vanished energy is significantly greater than the additional energy brought by bending. Therefore, the overall average energy per particle for our confinement systems is smaller than that for the bulk systems.
IV Conclusion
In this article we have studied colloidal systems with competing interactions confined in spheres. Our results showed that, in spherical confinement systems of particles with SALR interactions, the cluster, cylindrical, perforated lamellar, and lamellar structures are formed at low temperature. The configuration of self-assembled clusters in some cases fits the vertices of Platonic solids. More structures such as ring structures are formed under confinements compared with the bulk systems[18]. We also found that the average energy per particle is below that in bulk systems. Crystallisation occurs on the surface at appropriate densities, which is not observed in diblock copolymer systems[39, 30].
Moreover, we found that the phase boundaries tend to be at higher density with smaller confinement radius. Our systems tend to form perforated structures when confined in smaller spheres, which is different from diblock copolymer systems[30]. Perforated lamellar structures are formed in spherical confinement systems at densities where lamellar structures are formed in the bulk systems. Layers composed of particles bend along the wall in confined SALR colloidal systems, which increases the average energy per particle. Perforated lamellar structures are energetically favourable under spherical confinement. Due to the same reason, column structures are formed at densities where perforated lamellar structures are formed in the bulk systems. However, in confined diblock copolymer systems, the differences of structures compared with the bulk systems are almost only due to the interaction between the wall and the block[30]. The intralayer relocation of the colloidal particles makes the layer becomes perforated and thicker, while the possible changes of polymers only caused by interlayer relocation. The mechanism of structural changes in colloidal systems under spherical confinement is completely different from that in copolymer systems. The studies on SALR fluid on spherical surfaces and SALR colloids in spherical shells focused on quasi-two-dimensional systems, characterized by a single layer of particles[54, 55]. Thus, it is impossible to investigate the pheononon about multiple layers, for example the competition between interlayer energy and intralayer energy results more perforated lamellar structure formation in the current work.
We hope this study helps to the design of particle self-assembly under confinement especially the utility of the curvature of the confinement wall, with promising applications in nanostructure designs and understanding living systems, such as porous structure formations.
Author Contribusions
Conceptualisation, Y. L.; methodology, N. L and J. L.; validation, N. L. and J. L.; formal analysis, N. L., J. L., and Y. L.; investigation, N. L., J. L., and Y. L.; data curation, N. L. and J. L.; writing—original draft, N. L., J. L.; writing—review and editing, N. L., J. L., L. Q., S. M., Y. L., B. L.; visualisation, N. L. and J. L.; supervision, B. L. and Y. L.; project administration, B. L. and Y. L.; funding acquisition, B. L. and Y. L..
Conflicts of Interest
There are no conflicts to declare.
Acknowledgements.
This work was supported by the National Natural Science Foundation of China (12275137), Fundamental Research Funds for the Central Universities, Nankai University (63221053, 63231190). We thank Ho-Kei Chan and Peng Tan for helpful discussions, and Jun Zhong for helping on data visualisation.References
- Philp and Stoddart [1996] D. Philp and J. F. Stoddart, Self-assembly in natural and unnatural systems, Angew. Chem. Int. Ed. 35, 1154 (1996).
- Whitesides and Grzybowski [2002] G. Whitesides and B. Grzybowski, Self-assembly at all scales, Science 295, 2418 (2002).
- Hu et al. [2014] H. Hu, M. Gopinadhan, and C. O. Osuji, Directed self-assembly of block copolymers: a tutorial review of strategies for enabling nanotechnology with soft matter, Soft Matter 10, 3867 (2014).
- Doerk and Yager [2017] G. S. Doerk and K. G. Yager, Beyond native block copolymer morphologies, Mol. Syst. Des. Eng 2, 518 (2017).
- Míguez et al. [2003] H. Míguez, S. M. Yang, and G. A. Ozin, Optical Properties of Colloidal Photonic Crystals Confined in Rectangular Microchannels, Langmuir 19, 3479 (2003).
- Royall [2018] C. P. Royall, Hunting mermaids in real space: known knowns, known unknowns and unknown unknowns, Soft Matter 14, 4020 (2018).
- Ruiz-Franco and Zaccarelli [2021] J. Ruiz-Franco and E. Zaccarelli, On the Role of Competing Interactions in Charged Colloids with Short-Range Attraction, Annu. Rev. Conden. Ma. P. 12, 51 (2021).
- Al Harraq et al. [2022] A. Al Harraq, A. A. Hymel, E. Lin, T. M. Truskett, and B. Bharti, Dual nature of magnetic nanoparticle dispersions enables control over short-range attraction and long-range repulsion interactions, Communications Chemistry 5, 72 (2022).
- Gauri et al. [2023] H. M. Gauri, Z. M. Sherman, A. Al Harraq, T. M. Truskett, and B. Bharti, Magnetic field enabled in situ control over the structure and dynamics of colloids interacting via salr potentials, Soft Matter 19, 4439 (2023).
- Stradner et al. [2004] A. Stradner, H. Sedgwick, F. Cardinaux, W. Poon, S. Egelhaaf, and P. Schurtenberger, Equilibrium cluster formation in concentrated protein solutions and colloids, Nature 432, 492 (2004).
- Sedgwick et al. [2007] H. Sedgwick, J. E. Cameron, W. C. K. Poon, and S. U. Egelhaaf, Protein phase behavior and crystallization: Effect of glycerol, J. Chem. Phys. 127, 125102 (2007).
- Campbell et al. [2005] A. I. Campbell, V. J. Anderson, J. S. van Duijneveldt, and P. Bartlett, Dynamical arrest in attractive colloids: The effect of long-range repulsion, Phys. Rev. Lett. 94, 208301 (2005).
- Sanchez and Bartlett [2005] R. Sanchez and P. Bartlett, Equilibrium cluster formation and gelation, J. Phys.: Condens. Matter 17, S3551 (2005).
- Klix et al. [2010] C. L. Klix, C. P. Royall, and H. Tanaka, Structural and dynamical features of multiple metastable glassy states in a colloidal system with competing interactions, Phys. Rev. Lett. 104, 165702 (2010).
- Kohl et al. [2016] M. Kohl, R. Capellmann, M. Laurati, S. Egelhaaf, and M. Schmiedeberg, Directed percolation identified as equilibrium pre-transition towards non-equilibrium arrested gel states, Nat. Commun. 7, 11817 (2016).
- Pini and Parola [2017] D. Pini and A. Parola, Pattern formation and self-assembly driven by competing interactions, Soft Matter 13, 9259 (2017).
- Zhuang et al. [2016] Y. Zhuang, K. Zhang, and P. Charbonneau, Equilibrium Phase Behavior of a Continuous-Space Microphase Former, Phys. Rev. Lett. 116, 098301 (2016).
- Serna et al. [2021a] H. Serna, A. D. Pozuelo, E. G. Noya, and W. T. Góźdź, Formation and internal ordering of periodic microphases in colloidal models with competing interactions, Soft Matter 17, 4957 (2021a).
- Zhao et al. [2012] H. J. Zhao, V. R. Misko, and F. M. Peeters, Analysis of pattern formation in systems with competing range interactions, New J. Phys. 14, 063032 (2012).
- Yu et al. [2005] B. Yu, B. Li, P. Sun, T. Chen, Q. Jin, D. Ding, and A.-C. Shi, Cylinder-gyroid-lamella transitions in diblock copolymer solutions: A simulated annealing study, J. Chem. Phys. 123, 234902 (2005).
- Bates et al. [1994] F. S. Bates, M. F. Schulz, A. K. Khandpur, S. Förster, J. H. Rosedale, K. Almdal, and K. Mortensen, Fluctuations, conformational asymmetry and block copolymer phase behaviour, Faraday Discuss. 98, 7 (1994).
- Matsen and Schick [1994] M. W. Matsen and M. Schick, Stable and unstable phases of a diblock copolymer melt, Phys. Rev. Lett. 72, 2660 (1994).
- Matsen and Bates [1996] M. W. Matsen and F. S. Bates, Unifying weak- and strong-segregation block copolymer theories, Macromolecules 29, 1091 (1996).
- Hajduk et al. [1997] D. A. Hajduk, H. Takenouchi, M. A. Hillmyer, F. S. Bates, M. E. Vigild, and K. Almdal, Stability of the perforated layer (pl) phase in diblock copolymer melts, Macromolecules 30, 3788 (1997).
- Vassiliev and Matsen [2003] O. N. Vassiliev and M. W. Matsen, Fluctuation effects in block copolymer melts, J. Chem. Phys. 118, 7700 (2003).
- Matsen et al. [2006] M. W. Matsen, G. H. Griffiths, R. A. Wickham, and O. N. Vassiliev, Monte carlo phase diagram for diblock copolymer melts, J. Chem. Phys. 124, 024904 (2006).
- Ciach et al. [2013] A. Ciach, J. Pȩkalski, and W. T. Góźdź, Origin of similarity of phase diagrams in amphiphilic and colloidal systems with competing interactions, Soft Matter 9, 6301 (2013).
- Park et al. [2020] S. Park, H. Hwang, M. Kim, J. H. Moon, and S.-H. Kim, Colloidal assembly in droplets: structures and optical properties, Nanoscale 12, 18576 (2020).
- Yabu et al. [2014] H. Yabu, T. Higuchi, and H. Jinnai, Frustrated phases: polymeric self-assemblies in a 3d confinement, Soft Matter 10, 2919 (2014).
- Shi and Li [2013] A.-C. Shi and B. Li, Self-assembly of diblock copolymers under confinement, Soft Matter 9, 1398 (2013).
- Stewart-Sloan and Thomas [2011] C. R. Stewart-Sloan and E. L. Thomas, Interplay of symmetries of block polymers and confining geometries, Eur. Polym. J. 47, 630 (2011).
- Yin et al. [2004] Y. Yin, P. Sun, T. Chen, B. Li, Q. Jin, D. Ding, and A.-C. Shi, Simulated Annealing Study of Diblock Copolymer Thin Films Confined between Two Homogeneous Surfaces, ChemPhysChem 5, 540 (2004).
- Chen et al. [2007] P. Chen, H. Liang, and A.-C. Shi, Origin of microstructures from confined asymmetric diblock copolymers, Macromolecules 40, 7329 (2007).
- [34] B. Yu, P. Sun, T. Chen, Q. Jin, D. Ding, B. Li, and A.-C. Shi, Self-assembly of diblock copolymers confined in cylindrical nanopores, J. Chem. Phys. 127, 114906.
- Yu et al. [2007a] B. Yu, P. Sun, T. Chen, Q. Jin, D. Ding, B. Li, and A.-C. Shi, Self-assembled morphologies of diblock copolymers confined in nanochannels: Effects of confinement geometry, J. Chem. Phys. 126, 204903 (2007a).
- Yu et al. [2006] B. Yu, P. Sun, T. Chen, Q. Jin, D. Ding, B. Li, and A.-C. Shi, Confinement-induced novel morphologies of block copolymers, Phys. Rev. Lett. 96, 138306 (2006).
- Yu et al. [2008] B. Yu, Q. Jin, D. Ding, B. Li, and A.-C. Shi, Confinement-induced morphologies of cylinder-forming asymmetric diblock copolymers, Macromolecules 41, 4042 (2008).
- Chen et al. [2008] P. Chen, H. Liang, and A.-C. Shi, Microstructures of a cylinder-forming diblock copolymer under spherical confinement, Macromolecules 41, 8938 (2008).
- Yu et al. [2007b] B. Yu, B. Li, Q. Jin, D. Ding, and A.-C. Shi, Self-assembly of symmetric diblock copolymers confined in spherical nanopores, Macromolecules 40, 9133 (2007b).
- Zhao et al. [2021] F. Zhao, Z. Xu, and W. Li, Self-Assembly of Asymmetric Diblock Copolymers under the Spherical Confinement, Macromolecules 54, 11351 (2021).
- Li and Wickham [2009] W. Li and R. A. Wickham, Influence of the Surface Field on the Self-Assembly of a Diblock Copolymer Melt Confined in a Cylindrical Nanopore, Macromolecules 42, 7530 (2009).
- Wu et al. [2023] J. Wu, X. Wang, Z. Wang, Y. Yin, R. Jiang, Y. Li, and B. Li, Nanospheres with patches arranged in polyhedrons from self-assembly of solution-state diblock copolymers under spherical confinement, Macromolecules 56, 335 (2023).
- Yu et al. [2011] B. Yu, B. Li, Q. Jin, D. Ding, and A.-C. Shi, Confined self-assembly of cylinder-forming diblock copolymers: effects of confining geometries, Soft Matter 7, 10227 (2011).
- Chi et al. [2011] P. Chi, Z. Wang, B. Li, and A.-C. Shi, Soft confinement-induced morphologies of diblock copolymers, Langmuir 27, 11683 (2011), pMID: 21834527.
- Fraaije and Sevink [2003] J. G. E. M. Fraaije and G. J. A. Sevink, Model for pattern formation in polymer surfactant nanodroplets, Macromolecules 36, 7891 (2003).
- Huh et al. [2010] J. Huh, C. Park, and Y. K. Kwon, Commensurability effect in diblock copolymer lamellar phase under d-dimensional nanoconfinement, J. Chem. Phys. 133, 10.1063/1.3489685 (2010), 114903.
- Chen et al. [2006] P. Chen, X. He, and H. Liang, Effect of surface field on the morphology of a symmetric diblock copolymer under cylindrical confinement, J. Chem. Phys. 124, 10.1063/1.2178802 (2006), 104906.
- Feng and Ruckenstein [2006] J. Feng and E. Ruckenstein, Morphology transitions of AB diblock copolymer melts confined in nanocylindrical tubes, J. Chem. Phys. 125, 10.1063/1.2362818 (2006), 164911.
- Pinna et al. [2009] M. Pinna, X. Guo, and A. V. Zvelindovsky, Diblock copolymers in a cylindrical pore, J. Chem. Phys. 131, 10.1063/1.3264946 (2009), 214902.
- Serna et al. [2021b] H. Serna, W. T. Góźdź, and E. G. Noya, Structural and Dynamical Behaviour of Colloids with Competing Interactions Confined in Slit Pores, Int. J. Mol. Sci. 22, 11050 (2021b).
- Serna et al. [2019] H. Serna, E. G. Noya, and W. T. Góźdź, Assembly of Helical Structures in Systems with Competing Interactions under Cylindrical Confinement, Langmuir 35, 702 (2019).
- Franzini et al. [2018] S. Franzini, L. Reatto, and D. Pini, Formation of cluster crystals in an ultra-soft potential model on a spherical surface, Soft Matter 14, 8724 (2018).
- Li et al. [2011] S. Li, P. Chen, L. Zhang, and H. Liang, Geometric frustration phases of diblock copolymers in nanoparticles, Langmuir 27, 5081 (2011).
- Franzini et al. [2022] S. Franzini, L. Reatto, and D. Pini, Phase diagram of salr fluids on spherical surfaces, Soft Matter 18, 186 (2022).
- Serna et al. [2023] H. Serna, A. G. Meyra, E. G. Noya, and W. T. Gózdz, Structural characterization of systems with competing interactions confined in narrow spherical shells, Soft Matter 19, 5103 (2023).
- Andersen et al. [1971] H. C. Andersen, J. D. Weeks, and D. Chandler, Relationship between the Hard-Sphere Fluid and Fluids with Realistic Repulsive Forces, Phys. Rev. A 4, 1597 (1971).
- Plimpton [1995] S. Plimpton, Fast Parallel Algorithms for Short-Range Molecular Dynamics, J. Comput. Phys. 117, 1 (1995).
- Thompson et al. [2022] A. P. Thompson, H. M. Aktulga, R. Berger, D. S. Bolintineanu, W. M. Brown, P. S. Crozier, P. J. in ’t Veld, A. Kohlmeyer, S. G. Moore, T. D. Nguyen, R. Shan, M. J. Stevens, J. Tranchida, C. Trott, and S. J. Plimpton, Lammps - a flexible simulation tool for particle-based materials modeling at the atomic, meso, and continuum scales, Comput. Phys. Commun. 271, 108171 (2022).
- Kirkpatrick et al. [1983] S. Kirkpatrick, C. Gelatt, and M. Vecchi, Optimization by simulated annealing, Science 220, 671 (1983).
- Stukowski [2010] A. Stukowski, Visualization and analysis of atomistic simulation data with OVITO–the Open Visualization Tool, Model Simul Mater Sc 18, 015012 (2010).
- Stukowski [2013] A. Stukowski, Computational analysis methods in atomistic modeling of crystals, JOM 66, 10.1007/s11837-013-0827-5 (2013).
- Krone et al. [2012] M. Krone, J. Stone, T. Ertl, and K. Schulten, Fast Visualization of Gaussian Density Surfaces for Molecular Dynamics and Particle System Trajectories, in EuroVis - Short Papers, edited by M. Meyer and T. Weinkaufs (The Eurographics Association, 2012).
- Steinhardt et al. [1983] P. J. Steinhardt, D. R. Nelson, and M. Ronchetti, Bond-orientational order in liquids and glasses, Phys. Rev. B 28, 784 (1983).
- Nelson and Halperin [1979] D. R. Nelson and B. I. Halperin, Dislocation-mediated melting in two dimensions, Phys. Rev. B 19, 2457 (1979).
- Teich et al. [2016] E. G. Teich, G. van Anders, D. Klotsa, J. Dshemuchadse, and S. C. Glotzer, Clusters of polyhedra in spherical confinement, Proc. Natl. Acad. Sci. 113, E669 (2016).
- Guven and Vázquez-Montejo [2012] J. Guven and P. Vázquez-Montejo, Confinement of semiflexible polymers, Phys. Rev. E 85, 026603 (2012).
- Wang et al. [2018a] J. Wang, C. F. Mbah, T. Przybilla, B. Apeleo Zubiri, E. Spiecker, M. Engel, and N. Vogel, Magic number colloidal clusters as minimum free energy structures, Nat. Commun. 9, 5259 (2018a).
- Wang et al. [2019] J. Wang, C. F. Mbah, T. Przybilla, S. Englisch, E. Spiecker, M. Engel, and N. Vogel, Free energy landscape of colloidal clusters in spherical confinement, ACS Nano 13, 9005 (2019).
- Wang et al. [2021] D. Wang, T. Dasgupta, E. B. van der Wee, D. Zanaga, T. Altantzis, Y. Wu, G. M. Coli, C. B. Murray, S. Bals, M. Dijkstra, and A. van Blaaderen, Binary icosahedral clusters of hard spheres in spherical confinement, Nat. Phys. 17, 128 (2021).
- Chen et al. [2021] Y. Chen, Z. Yao, S. Tang, H. Tong, T. Yanagishima, H. Tanaka, and P. Tan, Morphology selection kinetics of crystallization in a sphere, Nat. Phys. 17, 121 (2021).
- Wang et al. [2018b] D. Wang, M. Hermes, R. Kotni, Y. Wu, N. Tasios, Y. Liu, B. de Nijs, E. B. van der Wee, C. B. Murray, M. Dijkstra, and A. van Blaaderen, Interplay between spherical confinement and particle shape on the self-assembly of rounded cubes, Nat. Commun. 9, 2228 (2018b).