Exploration of Superposition Theorem in Spectrum Space for Composite Event Analysis in an ADN
Abstract
This study presents a formulation of the Superposition Theorem (ST) in the spectrum space, tailored for the analysis of composite events in an active distribution network (ADN). Our formulated ST enables a quantitative analysis on a composite event, uncovering the property of additivity among independent atom events in the spectrum space. This contribution is a significant addition to the existing literature and has profound implications in various application scenarios. To accomplish this, we leverage random matrix theory (RMT), specifically the asymptotic empirical spectral distribution, Stieltjes transform, and R transform. These mathematical tools establish a nonlinear, model-free, and unsupervised addition operation in the spectrum space. Comprehensive details, including a related roadmap, theorems, deductions, and proofs, are provided in this work. Case studies, utilizing field data, validate our newly derived ST formulation by demonstrating a remarkable performance. Our ST formulation is model-free, non-linear, non-supervised, theory-guided, and uncertainty-insensitive, making it a valuable asset in the realm of composite event analysis in ADN.
Index Terms:
superposition theorem, data-driven, spectrum, random matrix theory, Stieltjes transform, R transformI Introduction
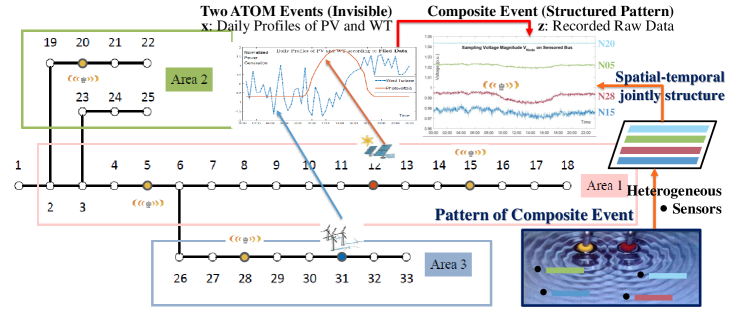
The term “composite event” refers to an event that is constructed from multiple atom events111Atom events are fundamental constituents of observable composite event. They are often directly invisible, relatively simpler, and mutually independent. [1]. The two-wave interference displayed in Figure 1 is a typical composite event. The composite event is also pretty common in an active distribution network (ADN). For instance, a composite event may be easily triggered by simultaneous power generation of distributed energy resources (DERs), which often exhibit diverse behaviors and considerable uncertainties [2].
I-A Motivation of Our Works
The presence of composite event may distort the typical pattern we observe, and hence disable tradition indicators we rely on, resulting in a poor (event-trigger) decision we make eventually. This issue is particularly critical in today’s ADN, which incorporates a multitude of DERs.
The composite event is analyzable, although it defies classical formulation, as discussed in Section II. Triggered by its heterogeneous components (atom events), the composite event does induce some intricate yet identifiable (although maybe previously unknown) pattern, just akin to the two-wave interference pattern displayed in the right-bottom part of Figure 1. Such an induced pattern is usually accompanied by a nonlinear, stochastic, complex, and dynamic procedures, making it too intricate for analytical solutions or simple characterization through an a prior signature dictionary [3].
Fortunately, numerous cutting-edge data technologies, such as advanced sensors, 5G/6G, and cloud platforms, have converged to supply massive structured (spatial-temporal) data from heterogeneous sensors, making a numerical description as a viable alternative. It enable us to model the induced intricate pattern, in a straightforward manner, using the so-called spatial-temporal data matrix—a structured entirety with sampling points (spatial dimensions) and sampling times (temporal dimensions) each. As a result, we naturally turn the original composite event analysis task into jointly spatial-temporal analysis problem. High-dimensional statistics, more specifically, random matrix theory (RMT) is proved to be effective to address this problem [4].
I-B Relevant Works
Composite event analysis has demonstrated fruitful performance in many fields. Reference [5], in wireless sensor networks, devises an event detection model and a warning delivery model, with the goal of monitoring composite events and delivering warnings to users. Reference [6], in image processing, proposes a wireless embedded smart-camera system for cooperative object tracking and detection of composite events spanning multiple camera views. Reference [7] develops a maritime monitoring system based on a Run-Time Event Calculus, and a composite event recognition system with formal, declarative semantics.
Prevailing event analyses in power system, however, are mostly spatial-temporal disjointed, as illustrated at the left part of Figure 1. They are mainly based on physical/mechanical models with assumptions/simplifications, or a large labelled sample set, and thereby capable of handling ideal, typical, extreme, or frequent scenarios only. Reference [8] proposes a data-driven event identification method that can precisely determine the types of overlapping events, which is built upon a labelled phasor measurement unit (PMU) dataset for offline neural network training. Reference [9] develops an algorithm that utilizes both PMU data and known system topology information to detect system line outages. Reference [10, 11] study data-driven algorithms for multiple event detection and classification with a two-step process, in which the temporal analysis and spatial analysis are mutually independent.
Recently, the spatial-temporal jointed correlation attracted scholars’ attention in power system, and big data analytics (BDA) became a stress and hot topic [12]. Utilizing the sparsity property of signals, Reference [13] presents a cluster-based sparse coding (CSC) for multiple event recognition, and Reference [3] presents a nonnegative sparse event unmixing (NSEU) algorithm, respectively. Reference [14] study a data-driven method based on moving window principal component analysis (MW-PCA), allowing the spatial-temporal correlations to be taken into consideration. Besides, to its inversion, decomposition of composite event, some NILM (non-intrusive load monitoring) solutions are discussed [15, 16].
Our previous work, concerning with spatial-temporal jointed correlation, has already made a series of exploration based on RMT. RMT is an emerging discipline closely associated with and taking a dominant role in high-dimensional statistics [17]. In Reference [4], we firstly propose a unified and generalized RMT framework, which handles the spatial-temporal data as a matrix-variable (as depicted in the top part and the right part of Figure 1). The superiority and application scenarios of the proposed RMT framework are discussed in details in References [18, 19]. This work is also an extension of our proposed RMT framework. See Section III for details.
I-C Contribution of Our Works
This work strives to implement composite event analysis, a challenging task in an ADN. In this regard, superposition theorem (ST) is formulated in spectrum space, providing a quantitative analysis on and a numerical solution to composite event analysis. Specially, this work, rooted in RMT, proposes a combination of asymptotic empirical spectrum distribution and two transforms (Stieltjes and R transforms). The corresponding roadmap, theorems, deductions, and proofs are outlined to offer a comprehensive understanding of our work.
Our RMT-based composite event analysis is tailored to handle spatial-temporal data in the form of matrix-variables. Hence it inherits several advantages associated with RMT—it is model-free, non-supervised, theory-guided, and uncertainty-insensitive. Consequently, it outperforms in terms of complexity and noise accumulation, making it highly competitive in engineering applications. Moreover, our method does not demand a large number of labeled data samples, a requirement that may often be impractical in real-world scenarios. Additionally, our approach is characterized by transparency due to its strong theoretical foundation.
Employing Stieltjes transform and R transform, this work introduces an abstract notation . This innovation, to the best of our knowledge, presents a pioneering exploration into the additivity properties of atom events within the spectrum space. This groundbreaking finding paves the way for advanced applications in various domains, including but not limited to component identification and anomaly detection. This work could be helpful not only to ADN dispatchers, who may encounter obsolete topology configuration information due to reconfiguration of ADN network (with wrong physical model information), but also to VPP operators, who may only have local knowledge confined to their region (with no real-time model information).
Our work is organized as follows: Section II revisits traditional Superposition Theorem (ST) formulations for event superposition. Section III, by employing jointly spatial-temporal analysis, reformulates ST in spectrum space. Section IV studies some common scenes in ADN to verify our suggested composite event analysis. Section V concludes our work.
II Composite Event Formulations in Power Grid
It is well-known that “linear addition +”, “model-based addition ”, and “Fourier addition ” are used to formulate concurrent events superposition, respectively, in circuit analysis, power flow analysis (PFA), and harmonic analysis. Based on these addition rules, many advanced servers/functions are further developed, e.g., line loss calculation [20], harmonic source detection [21]. In contrast to the above addition, this work strives to define an addition “” concerning with the formulation of heterogeneous DERs’ influence upon ADN, as shown in Figure 1. This exploration should be very helpful for ADN dispatchers and VPP operators.
II-A Linear Addition with Traditional Superposition Theorem
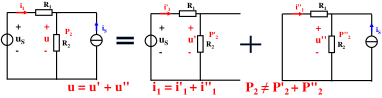
Superposition Theorem (ST), as shown in Figure 2a, is one of the most fundamental theorem in conventional circuit analysis. It tells that for a linear system, the response (voltage or current) in any branch of a bilateral linear circuit having more than one independent source equals the algebraic sum of the responses caused by each independent source acting alone, where all the other independent sources are replaced by their internal impedances [22].
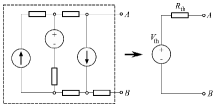
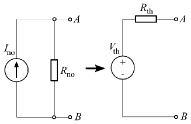
ST helps to solve linear circuit with more than one current or voltage source, outputting the resultant linear parameters including voltage and current . It could aid in converting any linear circuit into its Thévenin equivalent or Norton equivalent, as shown in Figure 2. However, ST is only applicable for linear parameters but not for non-linear ones such as power , let alone the unanticipated trigged event. In summary, traditional ST defines a “linear addition ” for linear parameters .
II-B Model-based Addition in Power Flow Analysis
For non-linear factors , we switch to PFA. PFA states one of the most fundamental equations for describing the grid’s behavior in the steady-state [23]. PFA says that for each node, Node for instance,
| (1) | ||||
Abstractly, Eq. (1) can be regarded as a model-based analog engine—it takes bus voltage magnitude and phase angle as inputs, conductance and susceptance as given parameters, and “computes” active power injection and reactive power injection as outputs. Many classical iteration methods, e.g., Newton-Raphson algorithms [24], are capable of solving Eq. (1). It is worth noting that the prior knowledge about each physical parameter (e.g., in Eq. 1) is required for this formulation. In summary, PFA defines a “model-based addition ” for non-linear parameters .
II-C Fourier Addition in Harmonic Analysis
Harmonic analysis is concerned with the representation of observed signals as the superposition of some particular waves in a power system. Harmonic analysis is built upon some basic assumptions [25]: a) The signal is stationary (constant magnitude); b) The sampling frequency is greater than twice the highest frequency in the signal to be analyzed; and c) Each frequency in the signal is an integer multiple of the fundamental frequency . (The presence of interharmonic components may largely decrease the performance [26].) When these assumptions are satisfied, we have
| (2) |
where is the amplitude of the phasor quantity representing the harmonic at time , is the phase angle of the harmonic relative to a reference rotating at , and is the harmonic order. In summary, Fourier transform defines a “Fourier addition ” in frequency-series space.
II-D Our Addition Formulation in High-dimensional Space
The composite event in ADN, as illustrated in Figure 1, is often non-linear and without reliable topology knowledge, especially for those grid dispatchers or VPP operators. The addition of such concurrent events cannot be effectively formulated using above “linear addition +”, “model-based addition ”, or “Fourier addition ”. Fortunately, the ever-increasing sampled spatial-temporal data, which already cover the majority of the composite event, can help inspect and conceptualize the composite event and its intricate yet identifiable pattern. Those spatial-temporal data naturally form data matrix, a structured entirety with sampling points (spatial dimension) and sampling times (temporal dimension) each. As a result, high-dimensional statistics, more specifically, random matrix theory (RMT), is tightly tied to our formulation. Furthermore, we strive to formulate some “RMT-derived addition ”, as
| (3) |
where . is the random matrix for the resultant composite event, and for each of its components, i.e., independent atom event each. is some RMT-derived function that projects the (event data) matrix onto a (high-dimensional) variable. In practice, is usually observable directly, while is invisible.
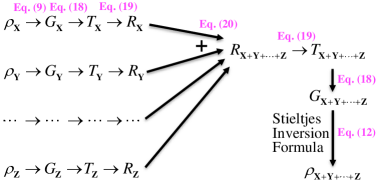
In this way, Eq. (3) tries to formulate event superposition phenomenon as a matrix-variables operation—the superposition of concurrent atom events (e.g., two Atom Events in Figure 1) is turned into “RMT-derived addition ” of their corresponding matrix-variables. The key challenge lies in defining the operation symbol “”. Throughout our study, this challenge remains a central theme, and we provide a roadmap in Figure 5.
III RMT-derived Addition in Spectrum Space
As discussed in Section I, RMT tools are naturally connected to composite event analysis task.
III-A RMT in Engineering
In engineering, these raw data are sampled by heterogeneous sensors independently, and then gather together in the data platform/cloud. Traditionally, they are used in a spatial-temporally disjointed manner—either in the form of an isolated time-series, or in the form of a single time slice.
Jointly spatial-temporal analysis is a challenging task in modern statistics [27]—it is hard for spatial-temporal data to get correlated to a unified and generalized framework. This is the motivation for our research on RMT, which is naturally connected to spatial-temporal data. To our best knowledge, RMT is developed to address the high-dimensional regime since the classical statistic theory applies to the low-dimensional regime only [17]. Under the RMT framework [4], we often encounter a dataset with a big number of observed variables and a large number of sampling points , but a ratio that is not small compared to unity. This setting is known as the high-dimensional limit in the literature; it is totally different from the traditional large , fixed (small, often [17]) situation (i.e. ).
RMT, concerning with the joint distribution of eigenvalues as the statistic analytics, mainly studies the eigenvalues (spectrum) of covariance matrices, an object of central interest in multivariate (high-dimensional) statistics [28]. The spectrum has strong correlation with principal/independent/free component analysis (PCA/ICA/FCA) [29], where one tries to find out the “best” possible component from some observed intricate pattern, and thus can be further used for anomaly detection [4] or event disaggregation [19].
III-B Asymptotic Empirical Spectral Distribution based on RMT
In RMT, Gaussian unitary ensemble (GUE) and Laguerre unitary ensemble (LUE) are studied firstly [30]:
| (4) |
where is a standard Gaussian random matrix whose entries are i.i.d. real Gaussian random variables, and is a complex Gaussian random matrix whose entries are i.i.d. complex Gaussian random variables (, where , are two independent standard Gaussian random matrices.)
Let be the empirical density of , and define its empirical spectral distribution (ESD) :
| (5) |
where is GUE (or LUE) matrix, and represents the event indicator function. We investigate the rate of convergence of the expected ESD to the Wigner’s Semicircle Law (or Wishart’s M-P Law).
Let and denote the true eigenvalue density and the true spectral distribution of in Eq. (4). For GUE and LUE, respectively, the Wigner’s Semicircle Law and Wishart’s M-P Law say that
| (6) |
where , and .
Then, we denote the Kolmogorov distance between and as :
Gotze and Tikhomirov, in [31], prove an optimal bound for of order . It means that more heterogeneous sources in engineering may theoretically benefit our analysis. This is a very reason why RMT is suitable for spatial-temporal data. In practice, RMT performs well with (unlabelled) data in moderate size such as tens, which is often true for ADN.
III-C Stieltjes Transform of Random Matrix
Stieltjes Transform, built upon the spectral distribution of matrices [28], enables the event addition, i.e., in Eq. 3. Stieltjes transform is closely connected with RMT. A large number of results concerning the asymptotic properties of the eigenvalues of large dimensional random matrices are formulated in terms of limiting behavior of the Stieltjes transform of their ESD.
III-C1 Random Matrix and its Spectrum Space
Consider a Hermitian random matrix . For a continuous function , we can built a mapping by defining normalized trace (i.e. , represents the identity matrix) when , since that
| (7) |
where is the -th eigenvalue of . And denotes the spectrum distribution of
| (8) |
where is the eigenvalue density at Note that
III-C2 Definition of Stieltjes Transform
Stieltjes transform is a convenient and powerful tool in the study of the convergence of spectral distribution of matrices. Just as the characteristic function of a probability distribution for central limit theorems, i.e., , Stieltjes transform is specially useful to study the limit spectral properties and to tackle the polynomial calculation of random matrices. Based on it, R transform is suggested by problems of interest in engineering [17].
Definition (Stieltjes Transform). Let be a non-negative, finite Borel measure on and for . Then Stieltjes transform of is defined as
| (9) |
For all .
In Eq. (7), we take . As a result, it is deduced that Stieltjes transform is actually simplified to
| (10) |
III-C3 Stieltjes Transform of GUE and LUE Ensemble
III-C4 Validation of Stieltjes Transform
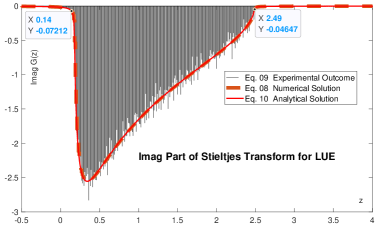
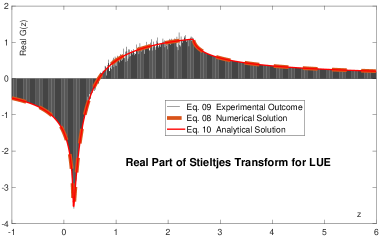
Figure 3 depicts Stieltjes transform of LUE.
- •
- •
-
•
The analytical solution (thin solid line) is computed via Eq. (11) theoretically.
The three lines are perfectly matched on both image part and real part. In this way, RMT and R Transform are naturally connected to our task composite event analysis in ADN. We try to complete Eq. (3), by designing spectrum function and abstract addition , in order to turn the spatial-temporal data into computable matrix-variables in the spectrum space.
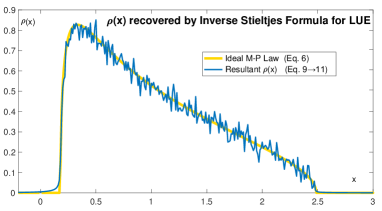
Furthermore, we give the Stieltjes Inversion Formula as
| (12) |
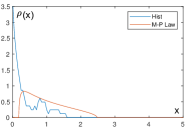
Inverse Stieltjes Formula is used to recover the eigenvalue density in the spectrum space. Figure 4 shows that the experimental outcome (Eq. 10 12) is entirely consistent with M-P Law (Eq. 6).
III-D Additivity Law (R) for Event Addition
Transform is derived from Stieltjes transform. Transform enables the characterization of the limiting spectrum of a sum of random matrices from their individual limiting spectra. These properties would turn out to be extremely useful in the engineering system whose data in the form of spatial-temporal rectangular matrix . These matrix-variables can be further turned into a Hermitian random matrix : , where is the transpose matrix of and .
For a Hermitian matrix , its -th moment is defined as
| (13) |
Following we define the moment series of
| (14) |
and cumulant series
where Note that denote all partitions of the set , and is the Bell polynomials. (see Appendix C).
Proposition. The relation between the moment series and the cumulant series is given by [32]
| (15) |
see Appendix D for the proof.
Now consider the Stieltjes Transform :
| (16) | ||||
The Transform is defined by
| (17) |
And furthermore, if we define
| (18) |
III-D1 Properties of Transform
Then we give two important properties of Transform:
1. : let , and be the Transform of matrices , and , respectively. We have
| (20) |
2. : For any ,
| (21) |
Additivity law can be easily understood in terms of Feynman diagrams (see [17, 33] for details). The above two properties of Transform enable us to conduct linear calculation of the asymptotic spectrum of random matrices.
With Stieltjes Transform ( Transform) and Transform, asymptotic free independence of the sum of elements is acquired. In such a way, we define an abstract addition to complete Eq. (3) in the spectrum space. The general idea of implementing multi-events operation is given in Figure 5.
In such a manner, we model the phenomena of a composite event in spectrum space by defining an abstract addition . Unlike raw data or most classical low-dimensional statistics, the spectrum does depend on the entirety of a matrix. Hence spectrum-derived indicators embody much more information on spatial-temporal correlation, and their operation are usually sensitive to signals and robust against i.i.d. noise [4].
III-D2 Example of Additivity Law (R)
Let
where for . and are independent for all . Then, the asymptotic eigenvalue distribution of follows M-P Law:
Then,
Hence according to Additivity Law
Finally, we use Stieltjes Inversion Formula Eq. (12) to obtain the asymptotic eigenvalue distribution of :
| (22) |
where , and
Figure 6 shows the comparison of the ESD (the bars) and theoretical asymptotic spectral density function (the line) given in (22). The two are perfectly matched.


IV Case Study in ADN
IV-A Scene Designing and Preliminary Analysis
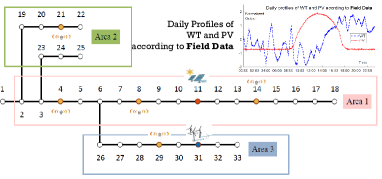
Figure 7 depicts our designed case. We set an IEEE 33-bus distribution system with integrations of two independent renewables—photovoltaic and wind turbine, respectively, on Node 11 (Area 1) and 31 (Area 3).
IV-A1 Scene Designing
Without loss of generality, two assumptions are made first:
-
a)
In the mixing composite event, each event are relatively distinct. For instance, the pattern of power generated by rooftop PV, for example, is obviously different from that by generated a wind turbine.
- b)
The daily profiles of PV and WT are assigned to the filed data as Signal and according to [35]. We take account of noises which are independent with signals on each sensor, and assume that the sampling rate is 1/min (the original sampling rate is /min in practice). We thus have a daily dataset with 1440 sampling points for further analysis.
Three scenarios are set as follows:
-
-
Scene : Only PV (Signal ):
-
-
Scene : Only WT (Signal ):
-
-
Scene : PV & WT ( & ):
where More concretely, is our observation spatial-temporal data. is the signal-derived (principle) component. is the independent noise-derived component.
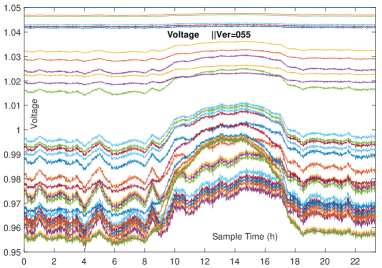
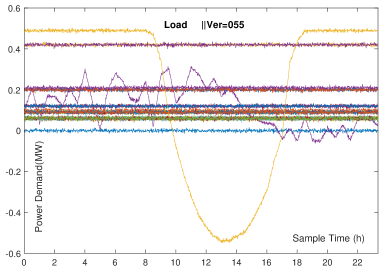
Figure 8 shows the voltage magnitude (outcome) and power demand (input) for Scene . Voltage magnitude data are easily accessible to advanced sensors, and hence are chosen as spatial-temporal data .
IV-A2 Spectrum Space is Immune to Non-Gaussian Noises
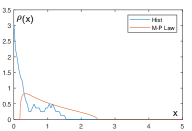
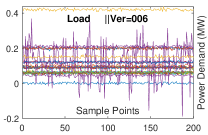
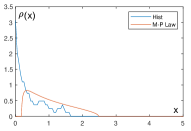
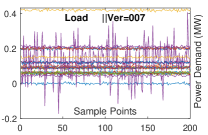
The events in ADN are assumed as follows: 1) wind turbine generation on Node 31 (Event ), and 2) regular small load fluctuations on all the nodes. According to [36], the auto-regression (AR) process is used to model the wind speed. We run the simulation several times, and then obtain the voltage magnitude data , which is easily accessible in engineering, as depicted in the left parts of Figure 9. The right parts tell that our designed mapping (i.e., Event spectral density) is immune to noise; some very similar ESD patterns are observed in each simulation, even though wind turbine generation (following AR model) and ubiquitous noises (following i.i.d Gaussian model) are quite distinct.
IV-B Validation of Superposition Theorem in Spectrum Space
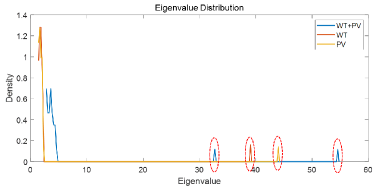
We calculate the spectrum for Scene as designed in Section IV-A1. Figure 10 depicts the results. The spectrum mainly consists of two parts: A few spikes/outliers and the bulk. The former represents the part of composite event that mainly drive the features of scene, and the latter represents the part of composite event that arise from idiosyncratic noise. It is consistent with our observation in Figure 10—one outlier for Scene , one for Scene , and two for Scene .
According to Section III, the events addition is formulated in the spectrum space. With the field data, we ordinarily can not build the exact analytic expression for the eigenvalue density . In practice, instead of analytical solution as Eq. (11), we acquire through numerical solution. Figure 11 depicts the resultant outcomes of numerical solution.
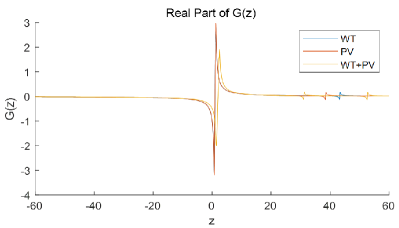
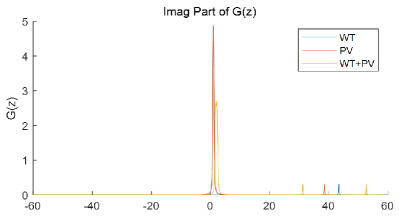
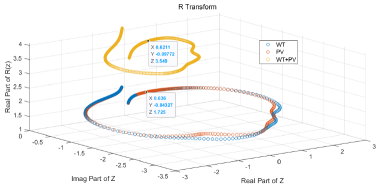
According to the real part of (Figure 11a), R transform is implemented among . The result is depicted in Figure 12. It gives a rough display of . For instance, when , it is found that , , and (where means real.
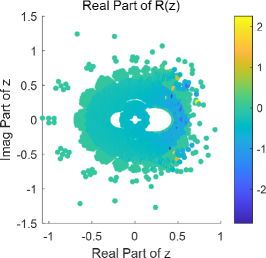
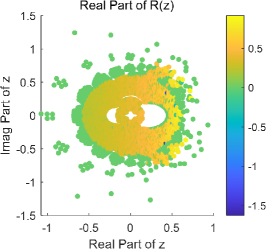
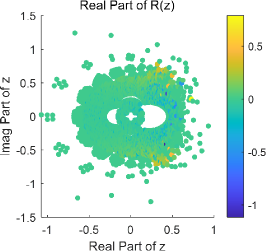
Furthermore, we implement test on (i.e., , , and ), and Figure 13 depicts the results respectively. We then sum their absolute value, i.e., , and obtain and for each case. is significantly superior to the other two combinations (at level), which means the composite event is more likely to be composed of A and B (i.e., ). In practice, , based on our observation, is calculable, while and are experience-based and immune to noises in the spectrum space (see Figure 9). This case verifies that the RMT-derived addition does help composite event analysis in ADN.
V Conclusion
In conclusion, this study has presented a groundbreaking formulation of the Superposition Theorem (ST) within the spectrum domain. Tying together Stieltjes transform and R transform, we unveil spectrum-based insights into the observed composite event, allowing us to conduct analysis on those previously invisible atom events in an active distribution network (ADN). These insights provide a novel framework for modeling the behaviors of Distributed Energy Resources (DER) integrated across the ADN.
A pivotal achievement of this study is the development of the formulation denoted as , which characterizes the superposition behavior of composite events. This formulation is model-free, non-linear, non-supervised, theory-guided, and uncertainty-insensitive. Its validation using field data from the IEEE-33 bus system further demonstrates its applicability. By providing an abstract “” based ST in spectrum space, this study offers valuable insights for network dispatchers and operators. It holds the potential to advance the analysis of composite events within the ADN, potentially yielding rules akin to Thévenin Conversion for nonlinear analysis. Besides, this study may benefit its inversion, blind decomposition of composite event (BDCE), and thus some advanced tasks, such as the extraction and identification of characteristic components related to faults or anomalies.
The aspiration to merge traditional tasks in power systems with cutting-edge tools in data science represents a long-term goal within our community. This study represents a significant step towards realizing this vision, highlighting the possibilities for innovative advancements at the intersection of power systems and data science. It underscores the potential for harnessing data-driven approaches to enhance the reliability, resilience, and efficiency of modern power grids.
Appendix A Stieltjes Transform of GUE (Eq. 11)
Recall Eq. (6) , . Thus
(i) Make the substitution for :
(ii) Make the substitution for :
where
Tips:
(iii) Show that the roots of are and . and , using the branch defined above.
Tips:
For (i.e., , Im)
with equality in the second relation only when .
(iv) Using the residue calculus, show that:
.
Appendix B Proof of Stieltjes Inversion Formula (Eq. 12)
Proof: We have
Thus
Let , and
As a result
put ,
Appendix C Relationship of Moment and Cumulant
The definition of Moment and Cumulant tells that
Check the -th term of both side
| L | |||
| R | |||
where
As a result
where
and thus
Appendix D Proof of (Eq. 15)
Proposition 1:
Proof:
Check the -th derivative of both side
Appendix E Proof of (Eq. 18)
Put Then we have
Thus
References
- [1] N. H. Gehani, H. V. Jagadish, and O. Shmueli, “Composite event specification in active databases: Model & implementation,” in VLDB, vol. 92. Citeseer, 1992, pp. 327–338.
- [2] V. F. Martins and C. L. Borges, “Active distribution network integrated planning incorporating distributed generation and load response uncertainties,” IEEE Transactions on power systems, vol. 26, no. 4, pp. 2164–2172, 2011.
- [3] W. Wang, L. He, P. Markham, H. Qi, Y. Liu, Q. C. Cao, and L. M. Tolbert, “Multiple event detection and recognition through sparse unmixing for high-resolution situational awareness in power grid,” IEEE Transactions on Smart Grid, vol. 5, no. 4, pp. 1654–1664, 2014.
- [4] X. He, Q. Ai, R. C. Qiu, W. Huang, L. Piao, and H. Liu, “A big data architecture design for smart grids based on random matrix theory,” IEEE Transactions on Smart Grid, vol. 8, no. 2, pp. 674–686, 2017.
- [5] Y. Li, C. Ai, C. Vu, Y. Pan, and R. Beyah, “Delay-bounded and energy-efficient composite event monitoring in heterogeneous wireless sensor networks,” IEEE Transactions on Parallel and Distributed Systems, vol. 21, no. 9, pp. 1373–1385, 2009.
- [6] Y. Wang, S. Velipasalar, and M. Casares, “Cooperative object tracking and composite event detection with wireless embedded smart cameras,” IEEE Transactions on Image Processing, vol. 19, no. 10, pp. 2614–2633, 2010.
- [7] M. Pitsikalis, A. Artikis, R. Dreo, C. Ray, E. Camossi, and A.-L. Jousselme, “Composite event recognition for maritime monitoring,” in Proceedings of the 13th ACM International Conference on Distributed and Event-based Systems, 2019, pp. 163–174.
- [8] S. Brahma, R. Kavasseri, H. Cao, N. R. Chaudhuri, T. Alexopoulos, and Y. Cui, “Real-time identification of dynamic events in power systems using PMU data, and potential applications—models, promises, and challenges,” IEEE Transactions on Power Delivery, vol. 32, no. 1, pp. 294–301, 2017.
- [9] J. E. Tate and T. J. Overbye, “Line outage detection using phasor angle measurements,” IEEE Transactions on Power Systems, vol. 23, no. 4, pp. 1644–1652, 2008.
- [10] M. Biswal, S. M. Brahma, and H. Cao, “Supervisory protection and automated event diagnosis using PMU data,” IEEE Transactions on Power Delivery, vol. 31, no. 4, pp. 1855–1863, 2016.
- [11] R. Yadav, A. K. Pradhan, and I. Kamwa, “Real-time multiple event detection and classification in power system using signal energy transformations,” IEEE Transactions on Industrial Informatics, vol. 15, no. 3, pp. 1521–1531, 2019.
- [12] T. Hong, C. Chen, J. Huang, N. Lu, L. Xie, and H. Zareipour, “Guest editorial big data analytics for grid modernization,” IEEE Transactions on Smart Grid, vol. 7, no. 5, pp. 2395–2396, Sept 2016.
- [13] Y. Song, W. Wang, Z. Zhang, H. Qi, and Y. Liu, “Multiple event detection and recognition for large-scale power systems through cluster-based sparse coding,” IEEE Transactions on Power Systems, vol. 32, no. 6, pp. 4199–4210, 2017.
- [14] M. Rafferty, X. Liu, D. M. Laverty, and S. McLoone, “Real-time multiple event detection and classification using moving window pca,” IEEE Transactions on Smart Grid, vol. 7, no. 5, pp. 2537–2548, 2016.
- [15] J. Kelly and W. Knottenbelt, “Neural NILM: Deep neural networks applied to energy disaggregation,” in Proceedings of the 2nd ACM international conference on embedded systems for energy-efficient built environments, 2015, pp. 55–64.
- [16] F. Ciancetta, G. Bucci, E. Fiorucci, S. Mari, and A. Fioravanti, “A new convolutional neural network-based system for nilm applications,” IEEE Transactions on Instrumentation and Measurement, vol. 70, pp. 1–12, 2020.
- [17] R. Qiu and P. Antonik, Smart Grid and Big Data. John Wiley and Sons, 2015.
- [18] X. Xu, X. He, Q. Ai, and C. Qiu, “A correlation analysis method for power systems based on random matrix theory,” IEEE Transactions on Smart Grid, vol. 8, no. 4, pp. 1811–1820, 2017.
- [19] X. He, R. C. Qiu, Q. Ai, and T. Zhu, “A hybrid framework for topology identification of distribution grid with renewables integration,” IEEE Transactions on Power Systems, vol. 36, no. 2, pp. 1493–1503, 2021.
- [20] D. Sun, S. Abe, R. Shoults, M. Chen, P. Eichenberger, and D. Farris, “Calculation of energy losses in a distribution system,” IEEE transactions on power apparatus and systems, no. 4, pp. 1347–1356, 1980.
- [21] R. Sinvula, K. M. Abo-Al-Ez, and M. T. Kahn, “Harmonic source detection methods: A systematic literature review,” IEEE Access, vol. 7, pp. 74 283–74 299, 2019.
- [22] J. A. Svoboda and R. C. Dorf, Introduction to electric circuits (9th ed.). John Wiley & Sons. pp. 527–529, 2013.
- [23] A. Gomez-Exposito, A. J. Conejo, and C. Canizares, Electric energy systems: analysis and operation. CRC press, 2018.
- [24] V. M. da Costa, N. Martins, and J. L. R. Pereira, “Developments in the newton raphson power flow formulation based on current injections,” IEEE Transactions on power systems, vol. 14, no. 4, pp. 1320–1326, 1999.
- [25] A. Girgis, W. Chang, and E. Makram, “A digital recursive measurement scheme for online tracking of power system harmonics,” IEEE Transactions on Power Delivery, vol. 6, no. 3, pp. 1153–1160, 1991.
- [26] A. Testa, M. F. Akram, R. Burch, and G. Carpinelli, “Interharmonics: Theory and modeling,” IEEE Transactions on Power Delivery, vol. 22, no. 4, pp. 2335–2348, 2007.
- [27] J. Bun, R. Allez, J. Bouchaud, and M. Potters, “Rotational invariant estimator for general noisy matrices,” IEEE Transactions on Information Theory, vol. 62, no. 12, pp. 7475–7490, 2016.
- [28] N. El Karoui, “Spectrum estimation for large dimensional covariance matrices using random matrix theory,” Ann. Statist., vol. 36, no. 6, pp. 2757–2790, 12 2008.
- [29] R. R. Nadakuditi and H. Wu, “Free component analysis: Theory, algorithms and applications,” Foundations of Computational Mathematics, pp. 1–70, 2022.
- [30] X. He, L. Chu, R. C. Qiu, Q. Ai, and Z. Ling, “A novel data-driven situation awareness approach for future grids—using large random matrices for big data modeling,” IEEE Access, vol. 6, pp. 13 855–13 865, 2018.
- [31] F. Götze and A. Tikhomirov, “The rate of convergence for spectra of gue and lue matrix ensembles,” Open Mathematics, vol. 3, no. 4, pp. 666–704, 2005.
- [32] J. Mingo and R. Speicher, Free probability and random matrices. New York: Springer, 2017.
- [33] D. V. Voiculescu, K. J. Dykema, and A. Nica, Free random variables. American Mathematical Soc., 1992, no. 1.
- [34] B. Yang, T. Yu, H. Shu, J. Dong, and L. Jiang, “Robust sliding-mode control of wind energy conversion systems for optimal power extraction via nonlinear perturbation observers,” Applied Energy, vol. 210, pp. 711–723, 2018.
- [35] X. He, R. C. Qiu, L. Chu, Q. Ai, Z. Ling, and J. Zhang, “Invisible units detection and estimation based on random matrix theory,” IEEE Transactions on Power Systems, vol. 35, no. 3, pp. 1846–1855, 2020.
- [36] Z. Huang and Z. Chalabi, “Use of time-series analysis to model and forecast wind speed,” Journal of Wind Engineering and Industrial Aerodynamics, vol. 56, no. 2-3, pp. 311–322, 1995.