Low Temperature Multi-mode Microwave Spectroscopy of Single Crystal Calcium Tungstate
Abstract
Single crystal calcium tungstate (CaWO4) is an interesting material for investigating spins in solids using microwave quantum electrodynamics (QED). We construct a dielectrically loaded microwave cavity resonator from a cylindrical single crystal of CaWO4 and perform whispering gallery multi-mode spectroscopy at 30 mK. This study found many high- modes, indicating a low dielectric loss tangent () which enables high sensitivity analysis of photon-spin interactions. Measurements of spin factors and zero field splittings (ZFS) allow for identification and characterization of spins that arise from the presence of paramagnetic impurities. We found Gd3+ concentrations of cm-3 and lower bounds on the spin concentration could be placed on the order of ppb. Additionally, we observe the presence of unknown rare-earth metal impurities at much lower concentrations.
I INTRODUCTION
Scheelite, or calcium tungstate (CaWO4) is a crystalline dielectric material whose crystal structure has been well characterized [1] and is an important material that is implemented as a scintillation detector for rare events, such as neutrinoless double -decay [2], radioactive decay of very long-living isotopes [3] and searches for weakly interacting massive particles (WIMPs), a candidate for Dark Matter (DM) [4, 5]. The low nuclear-spin density of CaWO4 makes it a promising platform for hosting spin qubits, with particular interest in utilizing rare-earth ions for quantum information storage and processing. Spin populations can be introduced via doping mechanisms but commonly arise from contamination during the crystal growth process [6]. Samples may be subject to contamination from radioactive isotopes (leading to the creation of colour centres), and rare-earth impurities [7, 8]. Previous experimental investigations have been performed on CaWO4, studying Er3+[9, 10, 11, 12, 13, 14, 15, 16], Yb3+ [17], Nd3+ [18] and Pr3+[19, 20, 21] dopants.
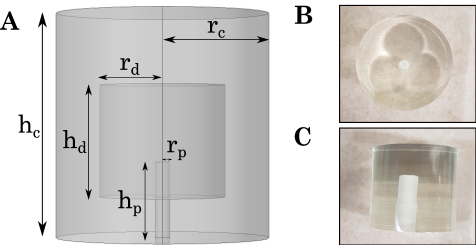
This work explores the spectroscopic response of CaWO4 manufactured by SurfaceNet GmbH in the microwave regime and at low temperatures, which is shown in Fig. 1. We identified some residual paramagnetic impurities that exist within the crystal lattice, in particular, the large spin system of the rare earth ion, Gd3+ [22]. Knowledge of the properties of these impurities in CaWO4 at cryogenic temperatures represents a gap in the scientific literature at present. The prospect for employing this crystal in rare-event searches either as a cryogenic bolometer or qubit host motivates the use of non-destructive spectroscopy which will be outlined in the following section.
II Experiment Setup
![[Uncaptioned image]](/html/2312.05199/assets/x2.png) Figure 2: The crystal was placed in an oxygen-free copper cavity and mounted within the magnet bore of a dilution refrigerator. A microwave signal was input to the cavity using a Vector Network Analyser (VNA).
The VNA and cryogenic dilution refrigerator were controlled by a computer that sets all parameters such as scan rate, power input, magnetic field strength, and frequency span.
Figure 2: The crystal was placed in an oxygen-free copper cavity and mounted within the magnet bore of a dilution refrigerator. A microwave signal was input to the cavity using a Vector Network Analyser (VNA).
The VNA and cryogenic dilution refrigerator were controlled by a computer that sets all parameters such as scan rate, power input, magnetic field strength, and frequency span.
The CaWO4 crystal lattice is made of diamagnetic atoms, thus, any paramagnetic impurities and lattice distortions can be detected using electron spin resonance spectroscopy (ESR). Coupling photonic resonances to spin resonances allows us to determine zero-field splittings (ZFS) and Landé g factors () via Zeeman splitting [23]. The energies of such interactions are characteristic markers for ion impurities that allow for their identification. Even at low concentrations of paramagnetic impurity () [24], the spin magnetic moment can be sensed. In order to discern weakly coupled spin systems, we excite spin transitions using high- photonic modes, namely, transverse magnetic whispering gallery modes (TM-WGM) from GHz to GHz. When the energy of a spin transition matches the energy of an injected WGM, the photon resonance is coupled to the spin resonance to induce the spin transition. The spin transition can be considered a hybridisation of the spin and photon resonances. This hybridisation results in a frequency shift of the photonic mode as well as a sharing of loss mechanisms between the two systems, typically resulting in a transmission amplitude shift and change in microwave -factor.
To determine the paramagnetic impurities present in the sample, the dielectrically loaded cavity was cooled to 30 mK in a dilution refrigerator as shown in Fig. 2. A VNA was swept to determine the frequencies of the high- WGMs. An external DC magnetic field was then ramped, tuning the spin transition energies across the high- WGMs. The transmission spectra of each of these modes were recorded at all magnetic field values so the specific interaction field could be captured as well as the impacts on the photon mode’s frequency, -factor, and transmission. By compiling all of the ESR interactions across the 23 recorded WGMs, a complete picture of paramagnetic impurity interactions could be constructed. Characteristic Hamiltonians for spin impurities in CaWO4 could then be used to fit the ZFS and magnetic field dependence of the observed interactions, allowing a determination of the impurity species. Further, shifts in -factors of the WGMs and fitted coupling rates between the WGM and ESR allowed the determination of limits on spin line-width and spin concentration, respectively.
Evanescent fields exist beyond the dielectric surface which decay exponentially in the axial direction above and below the crystal and as a modified Bessel function of the second kind in the radial direction [25]. WGMs are measured by coupling to these radiative fields using transmission line probes. Co-axial probes were inserted parallel to the z-axis at the base of the cavity at a depth adjusted for under-coupling (, for , where and are the loss rates of the input probes and the microwave resonance, respectively). The crystal was mounted on a sapphire post which was clamped to the base of the cavity to prevent loss from thermal contact with the conducting surfaces of the cavity. The associated readouts are specified by scattering parameters or s-parameters ( is the input port power reflection coefficient and is the forward power gain). Vector network analysis extracted the parameter and the transfer function was modelled as a Breit-Wigner distribution or asymmetric Fano pulse [26]:
| (1) |
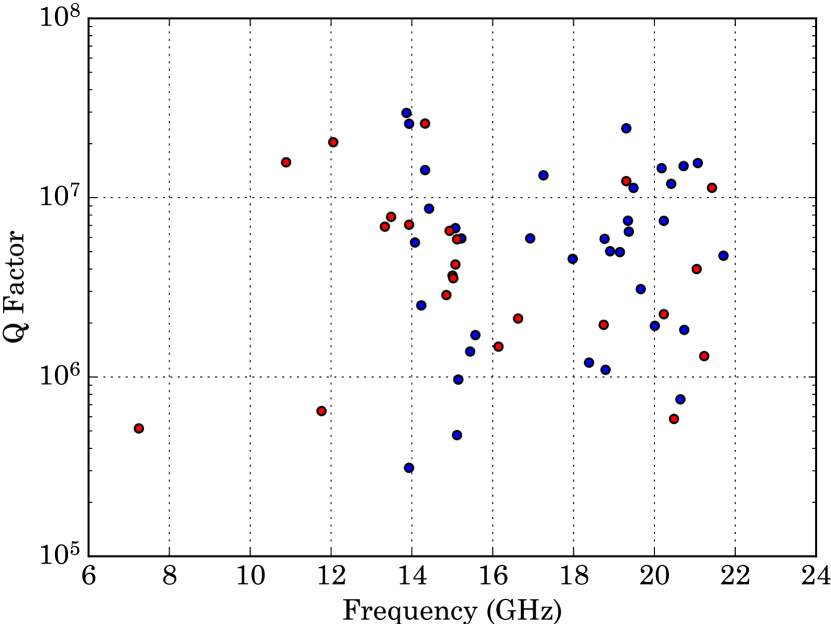
where q is the Fano parameter measuring the ratio of resonant scattering to background scattering, is the photonic resonance line-width, and is the frequency detuning (). The Q-factors of the modes can be calculated from the line-widths and are shown for zero DC magnetic field in Fig. 3. The best Q-factors in the crystal are of order of close to 14 GHz, indicating a loss tangent of order , which could be determined more precisely using the Whispering Gallery technique [27, 28, 29, 30], which for our purposes here this was not necessary to implement..
III Multimode Spectroscopy
We undertook multi-mode spectroscopy by varying the DC magnetic field and continually measuring the high-Q WGMs of Fig. 3. This allowed us to experimentally measure multiple paramagnetic spins interacting with the multiple microwave modes. During the interactions the photons and the spins hybridize, and may be modelled as a coupled harmonic oscillator with and as the eigensolutions to the characteristic equation [31];
| (2) |
where is a particular photonic resonance frequency and is the spin resonance frequency, and is the inductive coupling between these two resonant systems. parameterises the rate of coupling (). In the limit where is detuned far from , exhibits linear dependence on the magnetic field () where is the gyromagnetic ratio. As , and are detuned asymptotically around the intersection point representing a forbidden region of energy for the coupled system, called an avoided level crossing (ALC). When , the two resonant systems are maximally hybridised, and and represent the normal mode solutions of the coupled system. The frequency separation of these two modes () can be extracted by fitting equation 2 to the ALC. With a single photonic resonance, multiple spin interactions can be observed as the magnetic field tunes the latter over the former. If the photonic mode’s frequency increases (decreases) as , then the Zeeman energy levels of the spin resonance transition are diverging (converging) as magnetic field is increased. In the present study, all ALCs were categorized accordingly to better track the spin resonances over multiple TM-WGMs and denoted as ‘+ve ALC’ (‘-ve ALC’).
![[Uncaptioned image]](/html/2312.05199/assets/x5.png)
![[Uncaptioned image]](/html/2312.05199/assets/x6.png) Figure 5: A The ALC map summarises the results of the spectroscopy. Shown are the locations of ALCs in the frequency to magnetic field parameter space. Spin transitions in CaWO4:Gd3+ are derived from the spin Hamiltonian (see equation 5) and the corresponding transitions are shown in the CaWO4:Gd3+ energy-level diagram in B. The dashed red line marks the resonant frequency of the WGM shown in Fig. 4. The grey lines, A and B, track the spin transitions of unidentified impurities as a function of magnetic field and allow the determination of the ZFS. The gradient gives ( where is Plank’s constant).
Figure 5: A The ALC map summarises the results of the spectroscopy. Shown are the locations of ALCs in the frequency to magnetic field parameter space. Spin transitions in CaWO4:Gd3+ are derived from the spin Hamiltonian (see equation 5) and the corresponding transitions are shown in the CaWO4:Gd3+ energy-level diagram in B. The dashed red line marks the resonant frequency of the WGM shown in Fig. 4. The grey lines, A and B, track the spin transitions of unidentified impurities as a function of magnetic field and allow the determination of the ZFS. The gradient gives ( where is Plank’s constant).
From the ALCs, information about the spin systems could be extracted. The factor of the coupled photon-spin system can be modelled with the following equation [32]:
| (3) |
This expression allows for the determination of upper bounds on spin resonance line widths () and lower bound on spin quality factor (). Fig. 4B shows how the of the hybrid system in the coupling regime is limited by the highest loss system, which in this case is the spin resonance, leading to the degradation of the photonic resonance quality factor (). There is a corresponding dip in transmission, demonstrated by Fig. 4C.
The concentration of impurity spins () was derived from the rate of coupling:
| (4) |
where is the Bohr Magneton, is the reduced Planck’s constant, is the perpendicular magnetic filling factor [31] ( for TM-WGMs), and is the permeability of free space. With sufficient coupling rate, spin interactions such as those shown in Fig. 4 help derive spin quality factor (), , and impurity concentrations. Zooming out along the frequency axis allows us to follow ALC locations across an ensemble of WGMs and allows us to track the as magnetic field strength increases. This gives us the and ZFS (see Tab. I), which are typical for a paramagnetic impurity in a given crystal field environment, allowing for the identification of the impurity.
| Species | M | ZFS (GHz) | Transition |
|---|---|---|---|
| CaWO4:Gd3+ | |||
| A | |||
| - | - | ||
| B | |||
| - | - |
From the results of the spectroscopy, an ‘interaction map’ can be plotted as shown in Fig. 5A from which the spin transition frequencies can be fitted as a function of magnetic field, using +ve or -ve ALC designation as a helpful guide. The energies of these spin transitions can be described using a spin Hamiltonian that takes into consideration the following contributions; the Zeeman splitting term, the crystal field, and hyperfine splitting due to spin-orbit coupling. On the scale of GHz, spin-orbit coupling is not elucidated by the data, as the detuning resolution and the uncertainty of the detuning from the fitting is on the order of magnitude as the hyper-fine structure constants. Thus, their contribution is neglected for the present study and we turn our focus to the crystal field parameters and the Zeeman splitting term. The Zeeman term gives us the and we extract this value from the slopes of the Zeeman levels. The crystal field parameters are constructed by well-defined tesseral harmonics that describe the spin energy levels. We choose the Stevens representation which builds operators from spin operators as a basis, and determine the Stevens coefficients experimentally. We rely here on the work of previous investigations that analysed doped CaWO4 samples to check which Hamiltonians correspond to the data in the ALC map. Pitfalls arise as not all the energy levels are occupied or coupled to with the present setup. Thus, not every energy level theoretically predicted is reflected in the experiment. Nevertheless, with ZFS values and values, we can check through various elements to match this experiment to previously derived results. It is through this process of matching, checking, and eliminating that we find the results indicate that the CaWO4 sample is contaminated with trace amounts () of Gd3+ ions, and other rare-earth metals yet to be identified.
| lower bound | (kHz) | (MHz) upper bound | n (cm-3) | |
|---|---|---|---|---|
| 6.53 | 5.5 | 1.14 | 1.35 | 8.28 |
The crystal field of CaWO4:Gd3+ was modelled in this work by the following Hamiltonian;
| (5) |
where are Stevens operators, and . The crystal field parameters are; , , , , and in units of GHz. This Hamiltonian allows the determination of the Zeeman energy levels of Gd3+ in CaWO4, which are shown in Fig. 5B. The energy difference (vertical dashed lines) between the allowed transitions of these levels (coloured lines) allows one to identify the spin transitions in Fig. 5A. This result is in good agreement with the literature [33] with the only discrepancy being a increase in the value of which dictates the ZFS values. This is due to the difference in orientation of this sample’s c-axis to that of Baibekov et.al. who use a cut single crystal.
IV Conclusion
This study found the presence of rare-earth impurities in a scheelite sample as indicated by the high factors and low ZFS which is characteristic of f-shell elements. The limitation in magnetic field resolution ( T) made sound model fitting unfeasible in many instances, which would require more refined magnetic fields steps.
This work adds to the literature of paramagnetic spin impurities in crystalline CaWO4, useful for designs which require coherent spin ensembles to perform quantum information processes and as well as applications, which would utilise such a crystal for novel sensing methods, such as bolometers for dark matter detection.
V Acknowledgements
This work was funded by the ARC Centre of Excellence for Engineered Quantum Systems, CE170100009, and Dark Matter Particle Physics, CE200100008. BM was also funded by the Forrest Research Foundation.
References
- [1] CaWO4 crystal structure: Datasheet from pauling file multinaries edition 2022. accessed 2023-07-14.
- [2] Yu.G. Zdesenko, F.T. Avignone, V.B. Brudanin, F.A. Danevich, V.V. Kobychev, B.N. Kropivyansky, S.S. Nagorny, V.I. Tretyak, and Ts. Vylov. Carvel experiment with crystal scintillators for the double decay study of . Astroparticle Physics, 23:249–263, 2005.
- [3] C. Cozzini, G. Angloher, C. Bucci, F. von Feilitzsch, D. Hauff, S. Henry, Th. Jagemann, J. Jochum, H. Kraus, B. Majorovits, V. Mikhailik, J. Ninkovic, F. Petricca, W. Potzel, F. Pröbst, Y. Ramachers, W. Rau, M. Razeti, W. Seidel, M. Stark, L. Stodolsky, A. J. B. Tolhurst, W. Westphal, and H. Wulandari. Detection of the natural decay of tungsten. Phys. Rev. C, 70:064606, Dec 2004.
- [4] G. Angloher, C. Bucci, P. Christ, C. Cozzini, F. von Feilitzsch, D. Hauff, S. Henry, Th. Jagemann, J. Jochum, H. Kraus, B. Majorovits, J. Ninkovic, F. Petricca, W. Potzel, F. Pröbst, Y. Ramachers, M. Razeti, W. Rau, W. Seidel, M. Stark, L. Stodolsky, A.J.B. Tolhurst, W. Westphal, and H. Wulandari. Limits on wimp dark matter using scintillating cawo4 cryogenic detectors with active background suppression. Astroparticle Physics, 23:325–339, 2005.
- [5] M.v. Sivers, C. Ciemniak, A. Erb, F.v. Feilitzsch, A. Gütlein, J.-C. Lanfranchi, J. Lepelmeier, A. Münster, W. Potzel, S. Roth, R. Strauss, U. Thalhammer, S. Wawoczny, M. Willers, and A. Zöller. Influence of annealing on the optical and scintillation properties of cawo4 single crystals. Optical Materials, 34(11):1843–1848, 2012.
- [6] Nobuhiko Sarukura, Teruhiko Nawata, Hiroyuki Ishibashi, Mitsuru Ishii, and Tsuguo Fukuda. 4 - czochralski growth of oxides and fluorides. In Peter Rudolph, editor, Handbook of Crystal Growth (Second Edition), Handbook of Crystal Growth, pages 131–168. Elsevier, Boston, second edition edition, 2015.
- [7] B. Cockayne. The melt growth of oxide and related single crystals. Journal of Crystal Growth, 42:413–426, December 1977.
- [8] M. Moszynski, M. Balcerzyk, W. Czarnacki, A. Nassalski, T. Szczesniak, H. Kraus, V.B. Mikhailik, and I.M. Solskii. Characterization of cawo4 scintillator at room and liquid nitrogen temperatures. Nuclear Instruments and Methods in Physics Research Section A: Accelerators, Spectrometers, Detectors and Associated Equipment, 553(3):578–591, 2005.
- [9] W. B. Mims. Phase memory in electron spin echoes, lattice relaxation effects in caw: Er, ce, mn. Phys. Rev., 168:370–389, Apr 1968.
- [10] Bernal G. Enrique. Optical Spectrum and Magnetic Properties of Er3+ in CaWO4. The Journal of Chemical Physics, 55(5):2538–2549, 12 2003.
- [11] S. Bertaina, S. Gambarelli, A. Tkachuk, I. N. Kurkin, B. Malkin, A. Stepanov, and B. Barbara. Rare-earth solid-state qubits. Nature Nanotechnology, 2(1):39–42, 2007.
- [12] S. Bertaina, J. H. Shim, S. Gambarelli, B. Z. Malkin, and B. Barbara. Spin-orbit qubits of rare-earth-metal ions in axially symmetric crystal fields. Phys. Rev. Lett., 103:226402, Nov 2009.
- [13] S. Probst, G. Zhang, M. Rančić, V. Ranjan, M. Le Dantec, Z. Zhang, B. Albanese, A. Doll, R. B. Liu, J. Morton, T. Chanelière, P. Goldner, D. Vion, D. Esteve, and P. Bertet. Hyperfine spectroscopy in a quantum-limited spectrometer. Magnetic Resonance, 1(2):315–330, 2020.
- [14] M. Rančić, M. Le Dantec, S. Lin, S. Bertaina, T. Chanelière, D. Serrano, P. Goldner, R. B. Liu, E. Flurin, D. Estève, D. Vion, and P. Bertet. Electron-spin spectral diffusion in an erbium doped crystal at millikelvin temperatures. Phys. Rev. B, 106:144412, Oct 2022.
- [15] Marianne Le Dantec, Miloš Rančić, Sen Lin, Eric Billaud, Vishal Ranjan, Daniel Flanigan, Sylvain Bertaina, Thierry Chanelière, Philippe Goldner, Andreas Erb, Ren Bao Liu, Daniel Estève, Denis Vion, Emmanuel Flurin, and Patrice Bertet. Twenty-three–millisecond electron spin coherence of erbium ions in a natural-abundance crystal. Science Advances, 7(51):eabj9786, 2021.
- [16] Salim Ourari, Łukasz Dusanowski, Sebastian P. Horvath, Mehmet T. Uysal, Christopher M. Phenicie, Paul Stevenson, Mouktik Raha, Songtao Chen, Robert J. Cava, Nathalie P. de Leon, and Jeff D. Thompson. Indistinguishable telecom band photons from a single er ion in the solid state. Nature, 620(7976):977–981, 2023.
- [17] R. M. Rakhmatullin, I. N. Kurkin, G. V. Mamin, S. B. Orlinskii, M. R. Gafurov, E. I. Baibekov, B. Z. Malkin, S. Gambarelli, S. Bertaina, and B. Barbara. Coherent spin manipulations in at - and -band epr frequencies. Phys. Rev. B, 79:172408, May 2009.
- [18] C. G. B. Garrett and F. R. Merritt. PMR SPECTRA OF Nd3+ IN COMPENSATED AND UNCOMPENSATED CaWO4. Applied Physics Letters, 4(2):31–32, 12 2004.
- [19] I. B. Aizenberg, F. Z. Gil’fanov, and A. L. Stolov. Absorption and luminescence spectra of pr3+ in cawo4 monocrystals. Soviet Physics Journal, 9(1):29–33, 1966.
- [20] Enrico Cavalli, Philippe Boutinaud, and Marek Grinberg. Luminescence dynamics in cawo4:pr3+ powders and single crystals. Journal of Luminescence, 169:450–453, 2016. The 17th International Conference on Luminescence and Optical Spectroscopy of Condensed Matter (ICL’14).
- [21] Tian-Shu Yang, Ming-Xu Su, Jian-Yin Huang, You-Cai Lv, Zong-Quan Zhou, Chuan-Feng Li, and Guang-Can Guo. Spectroscopic investigations of at liquid-helium temperatures. Phys. Rev. A, 107:022802, Feb 2023.
- [22] Lingfei Zhao, Maxim Goryachev, Jeremy Bourhill, and Michael E Tobar. Indirect methods to control population distribution in a large spin system. New Journal of Physics, 19(3):033016, mar 2017.
- [23] Larry Kevan. Electron paramagnetic resonance: Elementary theory and practical applications. Foundations of Physics, 27(6):959–960, Jun 1997.
- [24] Electron paramagnetic resonance; an introduction to transition group ions in crystals. ILIFF BOOKS LTD], 1968.
- [25] Dielectric resonators. 1986.
- [26] Mikhail F. Limonov, Mikhail V. Rybin, Alexander N. Poddubny, and Yuri S. Kivshar. Fano resonances in photonics. Nature Photonics, 11(9):543–554, Sep 2017.
- [27] Michael Edmund Tobar, Jerzy Krupka, Eugene Nicolay Ivanov, and Richard Alex Woode. Anisotropic complex permittivity measurements of mono-crystalline rutile between 10 and 300 k. Journal of Applied Physics, 83(3):1604–1609, 1998.
- [28] J. Krupka, K. Derzakowski, A. Abramowicz, M. E. Tobar, and R. G. Geyer. Use of whispering-gallery modes for complex permittivity determinations of ultra-low-loss dielectric materials. IEEE Transactions on Microwave Theory and Techniques, 47(6):752–759, 1999.
- [29] Jerzy Krupka, Krzysztof Derzakowski, Michael Tobar, John Hartnett, and Richard G Geyer. Complex permittivity of some ultralow loss dielectric crystals at cryogenic temperatures. Measurement Science and Technology, 10(5):387, 1999.
- [30] Warrick G Farr, Daniel L Creedon, Maxim Goryachev, Karim Benmessai, and Michael E Tobar. Ultrasensitive microwave spectroscopy of paramagnetic impurities in sapphire crystals at millikelvin temperatures. Physical Review B, 88(22):224426, 2013.
- [31] Jeremy F. Bourhill. Quantum Hybrid Systems in Low-Loss Crystalline Solids. PhD thesis, The University of Western Australia, 2016.
- [32] N. C. Carvalho, M. Goryachev, J. Krupka, P. Bushev, and M. E. Tobar. Low-temperature microwave properties of biaxial . Phys. Rev. B, 96:045141, Jul 2017.
- [33] E. I. Baibekov, M. R. Gafurov, D. G. Zverev, I. N. Kurkin, A. A. Rodionov, B. Z. Malkin, and B. Barbara. Coherent spin dynamics in a gadolinium-doped cawo4 crystal. Physical Review B, 95(6), feb 2017.