[b,c]Bárbara Cid-Mora
The from Lattice QCD:
Determining the Finite-volume Spectra
Abstract
This work presents technical details of determining the finite-volume energy spectra for the scattering amplitude of the coupled-channel from lattice QCD data. The importance of reliably extracting such spectra lies in the crucial dependence of the hadronic scattering amplitudes analysis on the energy spectrum when using Lüscher’s formalism. Results of the methods used are presented and the final finite-volume spectra are shown. The analysis of the scattering amplitude based on these results, exhibits a two-pole structure for the , a virtual bound state below the threshold and a resonance pole right below the threshold.
1 Introduction
The baryon with strangeness , isospin , negative parity and spin is recognized as a 4-star resonance by the Particle Data Group [1], implying a somewhat well-known hadron. It was first predicted in Ref. [2], where the existence of a resonance in the spectrum was suggested just below the threshold. Historically, this hadron attracted attention due to its unexpectedly low mass compared to its nucleon counterpart when studied from a conventional quark model picture. Currently, the growing interest in investigating this baryon is rather based on the ideas proposed in Ref. [3], specifically the concept of two-pole structures. This concept allows the existence of an additional state, and cases like the can be dynamically generated by meson-baryon interactions [4, 5]. Although many lattice QCD studies have been conducted since, none of them have extracted the full spectrum in the coupled-channel region in order to appropriately study the pole structure.
These aspects motivated this first study [6] determining the coupled-channel scattering amplitudes from lattice QCD, thus attempting to get a better understanding of the pole structure and the positions of the resonance poles in the region. In order to achieve this, the Lüscher formalism [7, 8] is employed, which relates discrete finite-volume energy spectra extracted from lattice QCD data to scattering amplitudes. Given the crucial dependence of the scattering amplitudes on the finite-volume spectra, the latter must be extracted reliably from lattice QCD calculations. Therefore, the main focus of this report is to present essential specifics of the lattice QCD calculations, which include details about the generation of lattice data, type of operators used to construct correlation functions, analysis of correlation functions, and final extraction of finite-volume energy spectra.
This brief introduction is followed by Section 2 which summarizes all the details of the lattice QCD ensemble used, including the construction of correlation functions based on a diverse set of interpolating operators. This part also introduces the methodology used to diagonalize correlation matrices, its variations and example results. Section 2.4 presents the fits performed to lattice data that led to the final results, meaning the final finite-volume energy spectra. Finally, Section 3 outlines the main results and conclusions from the methods used, as well as the importance for the analysis of scattering amplitudes.
2 Spectrum determination
The determination of the finite-volume energy spectra from lattice QCD data starts with the generation of gauge configurations, followed by the evaluation of correlation functions using an appropriate operator basis, continued by diagonalization of these correlation functions, and finally fitting the data to extract the finite-volume energy spectra.
2.1 Ensemble details
The study is carried out using a single ensemble of QCD gauge configurations: D200, generated by the Coordinated Lattice Simulations (CLS) consortium [9]. The light quark masses used for the gauge fields generation are heavier-than-physical and degenerate and quarks, and a lighter-than-physical quark. The resulting hadron masses, and properties of the lattice are shown in Table 1. The gauge configurations of the D200 ensemble were generated using the tree-level improved Lüscher-Weisz gauge action and a non-perturbatively -improved Wilson fermion action. Additionally, open temporal boundary conditions were employed in order to reduce autocorrelation, constraining the interpolating fields to be far from the boundaries, hence the maximal temporal separation in correlation functions of .
2.2 Correlation functions
The correlation functions are built using an appropriate set of interpolating operators that overlap with the states of interest, and include both single-hadron operators and multi-hadron operators [10], as well as meson-baryon interpolators with different momentum combinations: , and , as shown in Table 2 (see Ref. [11] for the complete list and for a comprehensive description of the naming scheme). The inclusion of a more diverse set of operators has the fundamental role of ultimately extracting the full finite-volume energy spectra below the lowest-three-particle threshold, namely the threshold.
| Operators | |
|---|---|
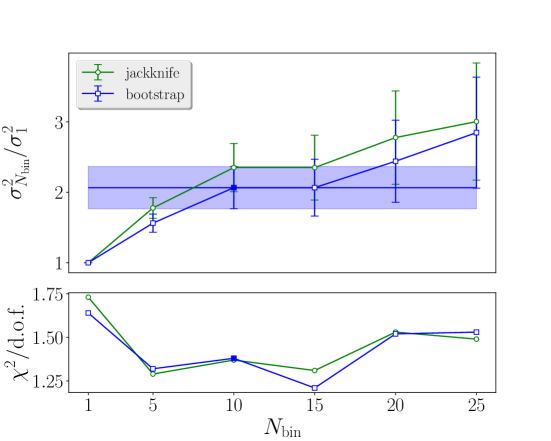
These temporal correlation functions are evaluated using the stochastic Laplacian Heaviside method (sLapH) [12, 13]. Once the correlation matrices are computed, autocorrelation of the data is studied with binning by computing the single hadron masses and their variance with different (see Fig. 1 as an example of the pion mass). The final binning choice is made based on behavior of the variance and the corresponding correlated- for a certain value of of resampled data (jackknife or bootstrap), and these results are shown in Fig. 1.
2.3 Extraction of energy spectra
Now the correlation matrices must be diagonalized in order to extract stationary-state energies. This is achieved by solving the so-called Generalized Eigenvalue Problem (GEVP) (more details of this method can be found in Refs. [14, 15, 16]). The method diagonalizes correlation matrices as:
| (1) |
where is the metric time, is the diagonalization time, and are the eigenvalues. This prescription connects the latter to an exponential of the form:
| (2) |
where is the distance to the closest energy level, and discussed in more details in Ref. [15].
The spectrum results are obtained using two different independent implementations of the variational method: single pivot and rolling pivot. For the single pivot a single choice of and is used, where the eigenvectors extracted at are used to rotate the correlators at all times , whilst for the rolling pivot a single choice of is used, and the correlator is diagonalized at all times . Figure 2 depicts the results from both implementations and a variation of .
2.4 Finite-volume energies
The correlation functions are fitted using variations of tower of exponentials as fit forms. The energies are then determined from correlated- fits over different intervals. Single-hadron and multi-hadron correlation functions are treated differently.
-
1.
Single Hadrons:
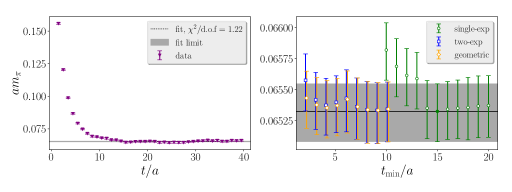
Diverse fit models are used, such as one- and two-exponential fits, and geometric exponential series fits. The single-hadron energies correspond to the lowest-lying mesons and baryons. A summary of their masses in lattice units is shown in Table 3. The chosen is based on the consistency of the results from the correlated- with different fit forms (see Figure 3).
-
2.
GEVP Eigenvalues:
Additionally to the fits used for the single-hadrons, one-exponential fits to a ratio of correlators are included for the eigenvalues obtained from the GEVP procedure (see Figure 4). This ratio is defined as
| (3) |
where corresponds to the diagonal of the resulting rotated correlation matrices in the single pivot case, and to the eigenvalues in the rolling pivot case; are the correlation functions of single hadrons, are the thresholds of interest; and are the units of momentum squared for that hadron. This ratio enables the determination of the energy interaction shift from the non-interacting energy , whilst taking advantage of partial cancellation in the systematic uncertainties.
| (4) |
where is the non-interacting energy sum close to the stationary state energy. From this shift the laboratory frame energy can be reconstructed as
| (5) |
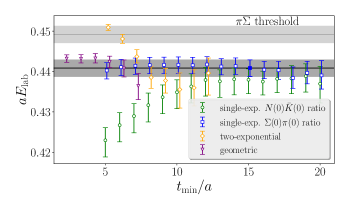
Given that more than one non-interacting energy can be near a certain energy level, and that the reconstructed lab-energy frame should be independent of the choice, all the types of non-interacting levels are used to check consistency of the fit results (see Figure 4 for an example).
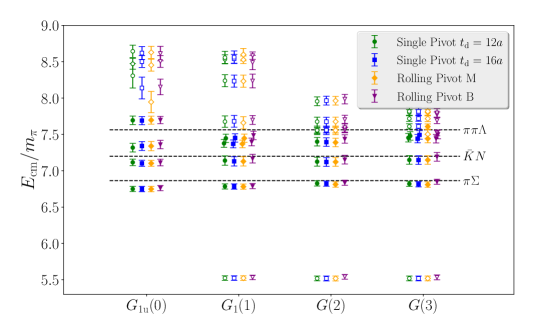
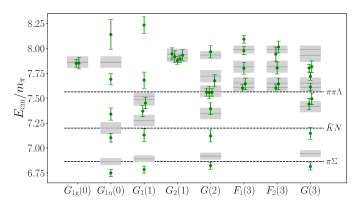
The final spectrum results consist of the finite-volume stationary-state energy spectra shown in Figure 5, where all the energy levels extracted from all different irreps are summarized. Results from the relevant irreps are the fundamental physics input that constrains the coupled-channel scattering-amplitude analysis when employing the Lüscher formalism [7, 8] to explore the energy region.
3 Conclusion
This is the first lattice QCD calculation of the coupled-channel scattering-amplitude. This study was performed using a single ensemble of gauge configurations with MeV and fm. The spectra were reliably extracted using different methods, which consist of variations of the implementation of the GEVP and a variety of fit models, including ratios-of-correlators for diagonalized correlation functions. The spectrum results showed good agreement with the different implementations of the GEVP and consistency with respect to different fit forms. These energy spectra are the key input for the scattering-amplitude analysis via the Lüscher method, which was successfully employed based on the finite-volume stationary-state energy spectra obtained from lattice QCD data, here the final results favored a two-pole picture in the energy region. More details can be found in Refs. [11, 6].
Acknowledgements
We thank our colleagues within the CLS consortium for sharing ensembles. Computations were carried out on Frontera at TACC, and at the (NERSC), a U.S. Department of Energy Office of Science User Facility, located at Lawrence Berkeley National Laboratory, Contract No. DE-AC02-05CH11231 using NERSC, awards NP-ERCAP0005287, NP-RCAP0010836 and NP-ERCAP0015497. Supported in part by: the U.S. National Science Foundation under awards PHY-1913158 and PHY-2209167 (CJM and SK), the Faculty Early Career Development Program (CAREER) under award PHY-2047185 (AN) and by the Graduate Research Fellowship Program under Grant No. DGE-2040435 (JM); the U.S. Department of Energy, Office of Science, Office of Nuclear Physics, under grant contract numbers DE-SC0011090 and DE-SC0021006 (FRL), DE-SC0012704 (ADH), DE-AC02-05CH11231 (AWL) and within the framework of Scientific Discovery through Advanced Computing (SciDAC) award “Fundamental Nuclear Physics at the Exascale and Beyond” (ADH); the Mauricio and Carlota Botton Fellowship (FRL); and the Heisenberg Programme of the Deutsche Forschungsgemeinschaft project number 454605793 (DM). NumPy [17], matplotlib [18], and the CHROMA software suite [19] were used for analysis, plotting, and correlator evaluation.
References
- [1] R. L. Workman et al. Particle Data Group, PTEP 2022, 083C01 (2022)
- [2] R. H. Dalitz and S. F. Tuan, Phys. Rev. Lett. 2, 425-428 (1959)
- [3] P. J. Fink, Jr., G. He, R. H. Landau and J. W. Schnick, Phys. Rev. C 41, 2720-2725 (1990)
- [4] J. A. Oller and U. G. Meissner, Phys. Lett. B 500, 263-272 (2001) [arXiv:hep-ph/0011146 [hep-ph]].
- [5] D. Jido, J. A. Oller, E. Oset, A. Ramos and U. G. Meissner, Nucl. Phys. A 725, 181-200 (2003) [arXiv:nucl-th/0303062 [nucl-th]].
- [6] J. Bulava et al. [Baryon Scattering (BaSc)], [arXiv:2307.10413 [hep-lat]].
- [7] M. Luscher, Nucl. Phys. B 354, 531-578 (1991)
- [8] M. Luscher, Nucl. Phys. B 364, 237-251 (1991)
- [9] M. Bruno, D. Djukanovic, G. P. Engel, A. Francis, G. Herdoiza, H. Horch, P. Korcyl, T. Korzec, M. Papinutto and S. Schaefer, et al. JHEP 02, 043 (2015) [arXiv:1411.3982 [hep-lat]].
- [10] C. Morningstar, J. Bulava, B. Fahy, J. Foley, Y. C. Jhang, K. J. Juge, D. Lenkner and C. H. Wong, Phys. Rev. D 88, no.1, 014511 (2013) [arXiv:1303.6816 [hep-lat]].
- [11] J. Bulava et al. [Baryon Scattering (BaSc)], [arXiv:2307.13471 [hep-lat]].
- [12] M. Peardon et al. [Hadron Spectrum], Phys. Rev. D 80, 054506 (2009) [arXiv:0905.2160 [hep-lat]].
- [13] C. Morningstar, J. Bulava, J. Foley, K. J. Juge, D. Lenkner, M. Peardon and C. H. Wong, Phys. Rev. D 83, 114505 (2011) [arXiv:1104.3870 [hep-lat]].
- [14] C. Michael and I. Teasdale, Nucl. Phys. B 215, 433-446 (1983)
- [15] B. Blossier, M. Della Morte, G. von Hippel, T. Mendes and R. Sommer, JHEP 04, 094 (2009) [arXiv:0902.1265 [hep-lat]].
- [16] J. Bulava, A. D. Hanlon, B. Hörz, C. Morningstar, A. Nicholson, F. Romero-López, S. Skinner, P. Vranas and A. Walker-Loud, Nucl. Phys. B 987, 116105 (2023) [arXiv:2208.03867 [hep-lat]].
- [17] C. R. Harris, K. J. Millman, S. J. van der Walt, R. Gommers, P. Virtanen, D. Cournapeau, E. Wieser, J. Taylor, S. Berg and N. J. Smith, et al. Nature 585, no.7825, 357-362 (2020) [arXiv:2006.10256 [cs.MS]].
- [18] J. D. Hunter, Comput. Sci. Eng. 9, no.3, 90-95 (2007)
- [19] R. G. Edwards et al. [SciDAC, LHPC and UKQCD], Nucl. Phys. B Proc. Suppl. 140, 832 (2005) [arXiv:hep-lat/0409003 [hep-lat]].