JWST UNCOVER: The Overabundance of Ultraviolet-luminous Galaxies at
Abstract
Over the past year, JWST has uncovered galaxies at record-breaking distances up to . The JWST UNCOVER (ultra-deep NIRSpec and NIRcam observations before the epoch of reionization) program has obtained ultra-deep multiwavelength NIRCam imaging of the massive galaxy cluster Abell 2744 over arcmin2 down to AB mag. Here, we present a robust ultraviolet (UV) luminosity function derived through lensing clusters at . Using comprehensive end-to-end simulations, we account for all lensing effects and systematic uncertainties in deriving both the amplification factors and the effective survey volume. Our results confirm the intriguing excess of UV-bright galaxies ( AB mag) previously reported at in recent JWST studies. In particular, a double power-law (DPL) describes better the bright-end of the luminosity function compared to the classical Schechter form. The number density of these bright galaxies is 10-100 times larger than theoretical predictions and previous findings based on Hubble Space Telescope (HST) observations. Additionally, we measure a star formation rate density of M⊙ yr-1 Mpc-3 at these redshifts, which is 4 to 10 times higher than galaxy formation models that assume a constant star formation efficiency. Future wide-area surveys and accurate modeling of lensing-assisted observations will reliably constrain both the bright and the dim end of the UV luminosity function at , which will provide key benchmarks for galaxy formation models.
keywords:
galaxies:high-redshift – galaxies: evolution – gravitational lensing: strong1 Introduction
The advent of the James Webb Space Telescope (JWST) has opened a new era in our exploration of the distant universe. While the Hubble Space Telescope (HST) helped identify more than 2,000 dropout galaxy candidates at , its restricted near-infrared coverage, and the limited capabilities of the Spitzer Space Telescope hampered the identification of galaxies at and the characterization of their stellar populations. The unprecedented capabilities of JWST’s Near Infrared Camera (NIRCam; Rieke et al., 2023), which uniformly covers the spectral range with exquisite spatial resolution, provides the opportunity to routinely identify galaxies.
The first JWST observing programs, which included the Early Release Observations (ERO) and the Early Release Science Programs (ERS) (e.g., Pontoppidan et al., 2022; Treu et al., 2022; Finkelstein et al., 2022b), have unveiled a large sample of galaxies at redshifts higher than (Atek et al., 2023a; Castellano et al., 2022; Donnan et al., 2023; Finkelstein et al., 2022a; Morishita et al., 2023; Naidu et al., 2022b; Robertson et al., 2023; Bunker et al., 2023a; Adams et al., 2023; Austin et al., 2023). These sources have been photometrically identified via their Lyman-break signature, photometric redshifts derived from model fitting to their spectral energy distribution (SED), or a combination thereof. Furthermore, spectroscopic follow-up campaigns with the Near-infrared Spectrograph (NIRSpec; Jakobsen et al., 2022) instrument has allowed us to confirm the high-redshift nature of these candidates at an unprecedented rate (e.g. Curtis-Lake et al., 2022; Arrabal Haro et al., 2023a; Hainline et al., 2023; Roberts-Borsani et al., 2022, 2023; Hsiao et al., 2023; Bunker et al., 2023a; Wang et al., 2023a; Fujimoto et al., 2023)
One of the most prominent results is the surprising over-abundant population of UV-bright galaxies at when compared to theoretical predictions of the UV luminosity function at those redshifts (e.g. Naidu et al., 2022b; Harikane et al., 2023b; Bouwens et al., 2023; Mauerhofer & Dayal, 2023). Indeed, most models suggest that galaxy evolution should extend beyond (e.g.; Hutter et al., 2021; Dayal et al., 2022), including a rapid decline in the star formation efficiency. However, strong observational constraints have been lacking until the recent JWST results. Given the small area probed by these surveys, the expected rapid evolution predicts more than an order of magnitude fewer galaxies than observed. This small survey area could also result in a significant cosmic variance (e.g.; Ucci et al., 2021). From the theoretical point of view, several physical explanations have been investigated, which are mostly based on the star formation histories and the stellar population properties of these galaxies. Some suggest that the expected decline in the number density of galaxies with redshift is balanced by the decrease of dust content (Ferrara et al., 2022), while others suggest the inefficient star-formation feedback (Dekel et al., 2023) or a weaker pre-reionization background (Harikane et al., 2023b) result in a larger population of bright galaxies at . Stochastic star formation histories (SFH) have also been invoked to explain this excess, resulting in notable disagreements across the literature. Some show that bursty SFHs cause UV luminosity deviations large enough to explain these observations (Shen et al., 2023; Sun et al., 2023; Muñoz et al., 2023; Whitler et al., 2023) while others find it to be insufficient (Pallottini & Ferrara, 2023; Ciesla et al., 2023; Mason et al., 2023). An evolution in the initial mass function (IMF) or UV contribution from active galactic nuclei (AGNs Ono et al., 2018; Fujimoto et al., 2023) can also explain such UV excess (Pacucci et al., 2022). Indeed, the past year of JWST observations has revealed an astonishing number of optically red AGNs at that have been entirely missed by previous UV-based selections (Matthee et al., 2023; Furtak et al., 2023c, a; Labbe et al., 2023; Greene et al., 2023; Maiolino et al., 2023). A few galaxy candidates have shown signs of black hole activity via their emission lines or their X-ray emission (Kokorev et al., 2023; Goulding et al., 2023; Fujimoto et al., 2023; Larson et al., 2023), potentially proving a non-negligible contribution to the bright-end of the UV luminosity function. While their number density is still an order of magnitude lower than that of galaxies, it appears to be larger than previous UV-based determinations at . Another potential source of contamination is the low-redshift dusty galaxies that can mimic the broadband colors of high-redshift galaxies (e.g.; Naidu et al., 2022a; Zavala et al., 2023; Arrabal Haro et al., 2023a).
In this work, we present the galaxy UV luminosity function (UV LF) over the redshift range based on the lensing-assisted observations from the JWST UNCOVER program. The observations consist of deep NIRCam imaging of the Abell 2744 cluster (A2744), which is at the redshift . This work builds on a comprehensive assessment of the lensing effects impacting the UV LF using end-to-end simulations from the source plane to the final UV LF. The paper is organized as follows: in Section 2 we describe the imaging data-set used in the study and the lensing model is covered in Section 3. We present the high-redshift galaxies catalog at and mock galaxies at the same redshift in Section 4. Our forward modeling procedure and the final UV LF with the associated uncertainties are presented in Section 5 while the star formation rate density in the early Universe is detailed in Section 6. The conclusion is given in Section 7.
Throughout this work, we assume a flat CDM cosmology with = 70 km s-1 Mpc-1, = 0.3 and = 0.7.
2 Observations
The first part of UNCOVER consisted of multi-wavelength NIRCam imaging of the lensing cluster Abell 2744 in 6 broadband filters (F115W, F150W, F200W, F277W, F356W, and F444W) and one medium-band filter (F410M), reaching a limiting magnitude of AB over arcmin2 (Bezanson et al., 2022). Observations were obtained across multiple days, between November 2nd and 15th 2022. The JWST imaging data also include parallel observations with the Near Infrared Imager and Slitless Spectrograph (NIRISS), using five broadband filters — F115W, F150W, F200W, F356W, and F444W. We also incorporate imaging data obtained by the ERS program GLASS (Treu et al., 2022) and the DDT (Director Discretionary Time) program ID 2756, which cover the outer regions of the UNCOVER field and which use a nearly identical filter set, except for the addition of F090W for the former, and the absence of F444W for the latter, respectively.
| Filter | Exposure | Depth |
|---|---|---|
| F115W | 6.0h | 28.85 |
| F150W | 6.0h | 28.27 |
| F200W | 3.7h | 28.92 |
| F277W | 3.7h | 29.34 |
| F356W | 3.7h | 29.45 |
| F410M | 3.7h | 28.85 |
| F444W | 4.6h | 29.10 |
The reduction of the imaging data was performed using the grizli (Brammer et al., 2022) software and presented in Weaver et al. (2023). The data were drizzled into mosaics with a pixel scale of 0.400 pix-1 (Atek et al., 2023b). The exposure times with the resulting magnitude limits in all filters are listed in Table 1.
The galaxy cluster A2744 was part of the Hubble Frontier Fields (HFF) clusters. As such, it has deep Hubble Space Telescope (HST) imaging data across the optical and near-infrared range, including ancillary data from multiple programs (Lotz et al., 2017). These data include deep Advanced Camera for Surveys (ACS) imaging in the cluster core (F435W, F606W, and F814W) and Wide-Field Camera Three (WFC3) observations in 4 filters (F105W, F125W, F140W, and F160W). In addition, A2744 was observed as part of the HST program BUFFALO (Steinhardt et al., 2020). The ACS observations included three broadband filters (F435W, F606W, F814W) while the WFC3 used four filters (F105W, F125W, F140W, F160W). The JWST and HST observations were drizzled to the same pixel scale and aligned. Weaver et al. (2023) contains a thorough discussion of the data reduction procedure.
3 Gravitational lensing
To compute the UV LF at = 9 - 12, we need to have a good understanding of the lensing power of the galaxy cluster A2744. Lensing models are crucial not only for estimating the magnification of the sources but also for estimating the effective survey volume. In this work, we adopt the v1.1 UNCOVER strong lensing (SL) model of A2744, presented in Furtak et al. (2023b), which is publicly available on the UNCOVER website111https://jwst-uncover.github.io/DR2.html#LensingMaps. This model was constructed using a new version of the parametric code by Zitrin et al. (2015), updated to be fully analytic and thus not dependent on a fixed grid, which allows for faster computation and with a higher resolution (Pascale et al., 2022; Furtak et al., 2023b). The model for A2744 comprises five smooth cluster-scale dark matter halos, centered on the five brightest cluster galaxies (BCGs), and 421 cluster member galaxies, as detailed in (Furtak et al., 2023b). More than half of the cluster galaxies are spectroscopically confirmed (Bergamini et al., 2023a). The v1.1 of the model used here is constrained by a total of 141 multiple images (belonging to 48 sources), of which 96 have spectroscopic redshifts (Bergamini et al., 2023a, b; Roberts-Borsani et al., 2023) and the remaining ones are photometric systems discovered with the UNCOVER imaging (Furtak et al., 2023b, c). With these constraints, the model achieves a lens plane image reproduction RMS of . We compute analytic magnifications and their uncertainties for our sample at each object’s position and spectroscopic redshift.
4 High-redshift galaxy sample
4.1 Observed galaxies
The first step is to select a sample of dropout galaxies in the imaging data of A2744, before proceeding to compute their number density. In this work, we rely on the sample selection and the derived high-redshift galaxy catalog presented in Atek et al. (2023b). The general UNCOVER catalog is presented in Weaver et al. (2023). However, our high-redshift selection is based on a second photometric catalog, which is tailored towards high-redshift sources, and presented in Atek et al. (2023b). The full description of this catalog will be given in Weibel et al. (in prep). Briefly, this catalog was produced by using the SExtractor tool (Bertin & Arnouts, 1996) in its dual mode, using the F444W as the detection image. Fluxes in each filter are measured in 0.24″ apertures, whereas total fluxes are derived by applying a scaling factor calculated from the ratio of aperture flux and F444W SExtractor AUTO FLUX. We adopted the Lyman break selection criteria defined in Atek et al. (2023a) to define the selection window. This color selection was done to minimize the contamination rate. The most important sources of contamination consist of dust-obscured and evolved galaxies at lower redshift with extremely red colors, and low-mass stars. In addition to selection criteria, we require non-detection in the bands blueward of the Lyman break. All details are described in Atek et al. (2023b).
| ID | RA | Dec | ||||
|---|---|---|---|---|---|---|
| 1870 | 3.648010 | -30.426616 | -19.78 0.18 | |||
| 3148 | 3.646481 | -30.421615 | -20.51 0.18 | |||
| 17987 | 3.641572 | -30.382825 | -19.39 0.18 | |||
| 26928 | 3.511925 | -30.371861 | -20.36 0.12 | |||
| 2065 (3686) | 3.617194 | -30.425536 | -21.67 0.12 | |||
| 83338 | 3.454706 | -30.316898 | -19.24 0.18 | |||
| 10619 | 3.594996 | -30.400738 | -17.57 0.13 | |||
| 21623* (26185) | 3.567067 | -30.377869 | -19.01 0.14 | |||
| 52008 | 3.478739 | -30.345535 | -19.90 0.14 | |||
| 81198 | 3.451367 | -30.320717 | -19.90 0.14 | |||
| 39074 (37126) | 3.590115 | -30.359743 | -20.03 0.14 | |||
| 73667 | 3.451412 | -30.321807 | -20.55 0.13 | |||
| 22360 | 3.637111 | -30.376780 | -19.85 0.18 | |||
| 3160 | 3.591436 | -30.421663 | -19.06 0.15 | |||
| 46026 | 3.605690 | -30.352664 | -19.92 0.16 | |||
| 31763 | 3.519867 | -30.366428 | -18.89 0.17 | |||
| 42329 (38766) | 3.513568 | -30.356804 | -19.13 0.18 | |||
| 46075 | 3.546722 | -30.352425 | -19.10 0.19 | |||
| 70846 | 3.498983 | -30.324758 | -20.79 0.12 |
The final sample consists of 19 galaxies in the redshift range . Among these four sources were included in the NIRSpec MSA (Micro Shutter Assembly) design of the UNCOVER spectroscopic follow-up Fujimoto et al. (2023); Wang et al. (2023a). The physical parameters of the galaxy candidates are listed in Table 2 together with their spectroscopic confirmation . Remarkably, we report a 100% success rate in our spectroscopic confirmation, demonstrating the robustness of the photometric selection. Other studies (e.g.. Bunker et al., 2023b; Hainline et al., 2023; Arrabal Haro et al., 2023b) also show high confirmation rate, 80% or more.
4.2 Simulated galaxies
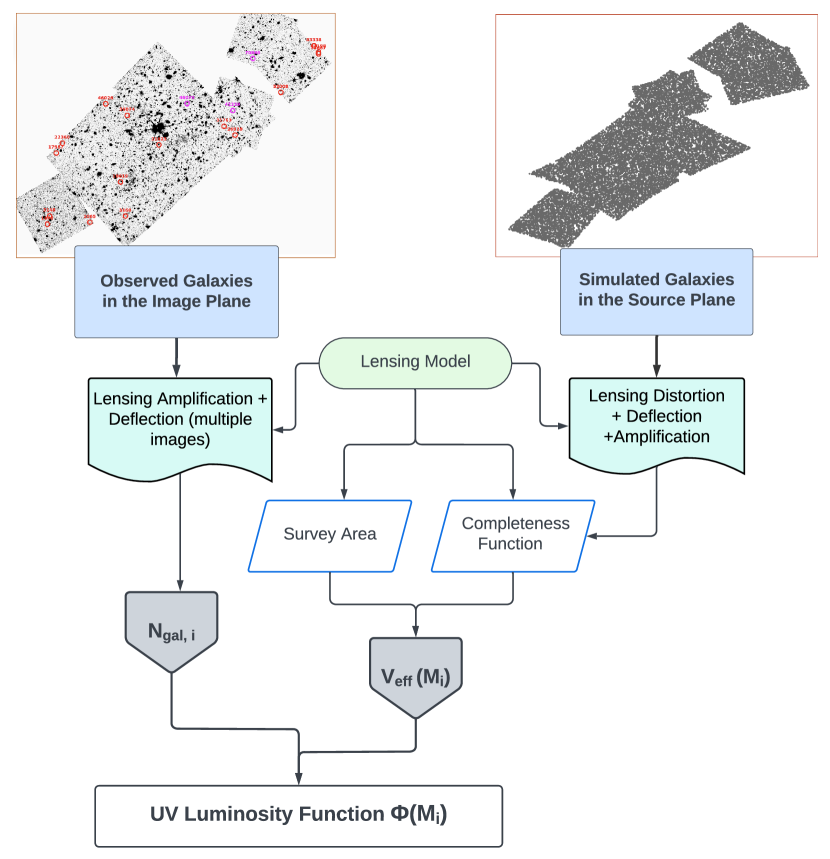
The second step consists of computing the survey completeness function through the lensing cluster alongside its uncertainties. Following the procedure adopted in Atek et al. (2018), we generated a set of 50,000 mock galaxies, which were randomly distributed directly in the source plane, which was constructed using the latest lensing model (see Section 3). The properties of these simulated objects were randomly allocated: the redshift in the range , with intrinsic absolute magnitudes from -23 to -15 mag. The input galaxy sizes follow a log-normal distribution and the size-luminosity relation derived for high-redshift galaxies, adopting the Yang et al. (2022) determination for faint objects () and Shibuya et al. (2015) for the bright sources.
A uniform distribution in the source plane, i.e. the physical plane, will undersample the regions of higher magnification in the image plane, leading to smaller statistics for the completeness function. For this reason, we decided to add a second layer of mock galaxies in the higher magnification area () within the source plane.
Overall, this forward modeling naturally accounts for the galaxy shape distortion following the lensing shear, which directly affects the completeness function. Most importantly, the completeness function depends on several parameters, some of which are interdependent, such as the magnification and the source position, and need to be simultaneously accounted for.
In order to compute the synthetic fluxes of the mock galaxies, we first generate SEDs models with BEAGLE (Chevallard & Charlot, 2016) according to their simulated physical properties. These templates, characterized by delayed star-formation histories , and an SMC extinction law (Pei, 1992), and a constant metallicity Z = 0.1Z⊙. Templates were redshifted and normalized to the observed magnitude within the F150W filter, corresponding to the rest-frame UV. In the end, we used GalSim (Rowe et al., 2015) to simulate the galaxies, which were in turn injected into the source plane of A2744, mapped into the image plane, and then inserted into the UNCOVER mosaics of A2744, placing 100 galaxies at a time. Then we follow the same procedure used for the observations to extract the sources and select dropout galaxies in the redshift range of 9 - 12.
5 The UV luminosity function at
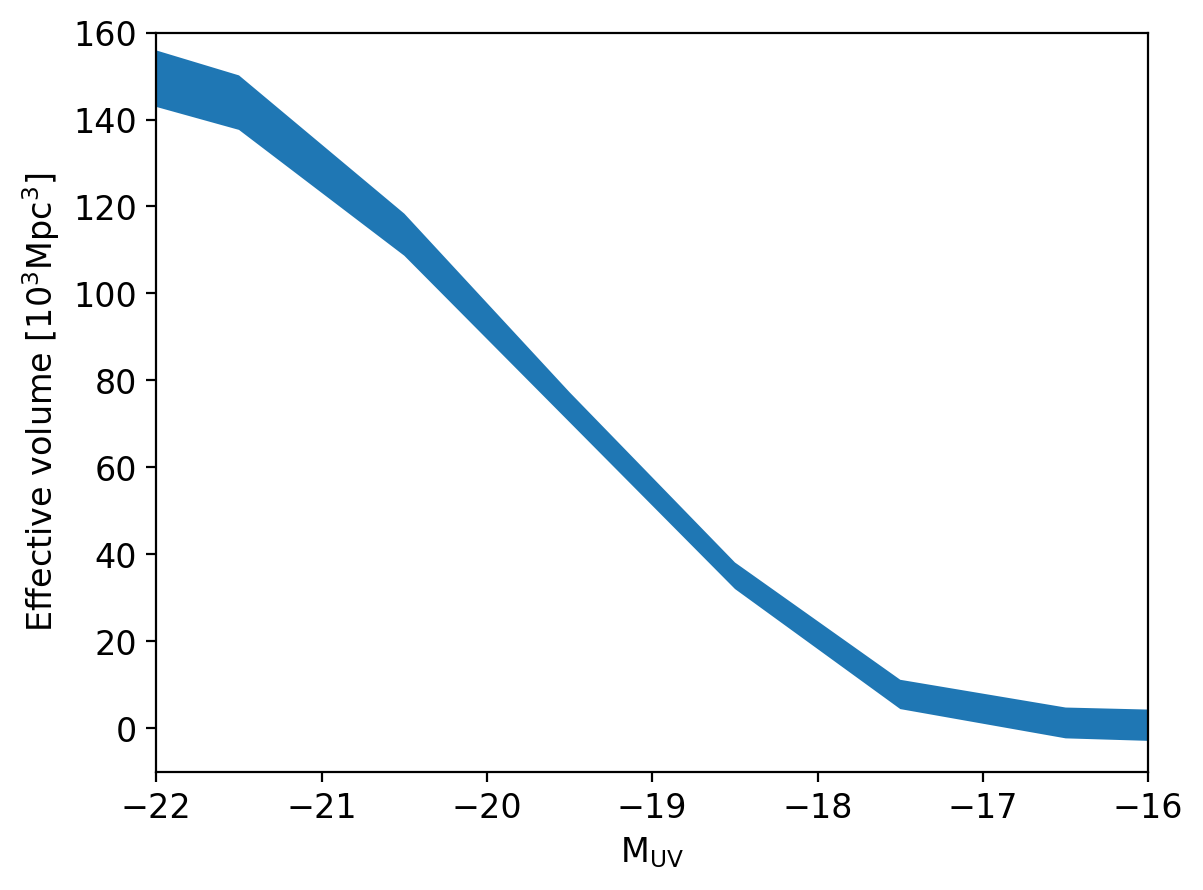
The observed galaxy number counts are computed in the uniform magnitude bins within the range of -22.5 M -17.5 mag, with the size bin of mag = 1.0, except for the faintest bin which has a size of mag = 1.5 .In our attempt to compute the UV LF, we also need to estimate the effective survey volume probed at each intrinsic magnitude (see Figure 1).
To compute the survey volume, we first determine the survey area as a function of magnification and the redshift selection function. The effective volume consists of the co-moving maximal volume, which is distorted by gravitational lensing multiplied by the completeness function. As a result, the effective survey volume for each galaxy is expressed as:
| (1) |
where, represents the completeness function, which is computed by comparing the output catalog with the original input one as a function of the intrinsic magnitude (), – the magnification factor at the given redshift and is the magnification value at which a galaxy with a magnitude can be detected, and represents the volume element available for the selection of a galaxy at a given redshift and amplification factor. The maximum volume depends mainly on the total surface area probed by the cluster, which is estimated to be arcmin2. The completeness function values vary between 85% on the bright-end and 10% on the faint-end. Using this effective survey volume, the intrinsic UV LF can be calculated as follows:
| (2) |
where is the number of galaxies within each magnitude bin, and represents the effective survey volume corresponding to the th bin of absolute magnitude . The effective survey volume of the Abell 2744 cluster is presented in Figure 2. We can see that the curve drops quickly at the bright-end, where the maximum volume depends mainly on the surface area with no magnification.
To estimate the uncertainties of the UV LF, we considered several sources such as small-number Poisson statistics (Gehrels, 1986)and cosmic variance, which was calculated following Trapp & Furlanetto (2020). More importantly, we took into account statistical uncertainties in the lensing model, which impact both the amplification factor, the survey area, and to some extent the completeness. To estimate the systematic uncertainties of the lensing models, we compared two independent models constructed by Furtak et al. (2023b) and Bergamini et al. (2023b). Overall, we did not find a significant difference between the two models, as the intrinsic uncertainties were in good agreement. Magnification uncertainties from the first lensing model were incorporated into the observed magnitude uncertainties in addition to the photometric errors. Then we used the Markov chain Monte Carlo (MCMC) simulations to explore the full error space for each galaxy, encompassing both photometric scatter and magnification factor uncertainties. For each of these iterations, we construct a luminosity function, which allows a galaxy to switch magnitude bins, hence changing the observed number counts. Regarding the effective survey volume, we include for each galaxy the survey area uncertainty as a function of magnification. All these uncertainties were included in the final UV LF, incorporating the completeness errors in the process.
| MUV | Nobj | |
|---|---|---|
| [mag-1Mpc-3] | ||
| -22 | 1 | -5.19 |
| -21 | 3 | -4.68 |
| -20 | 7 | -4.21 |
| -19 | 7 | -4.02 |
| -17.5 | 1 | -3.89 |
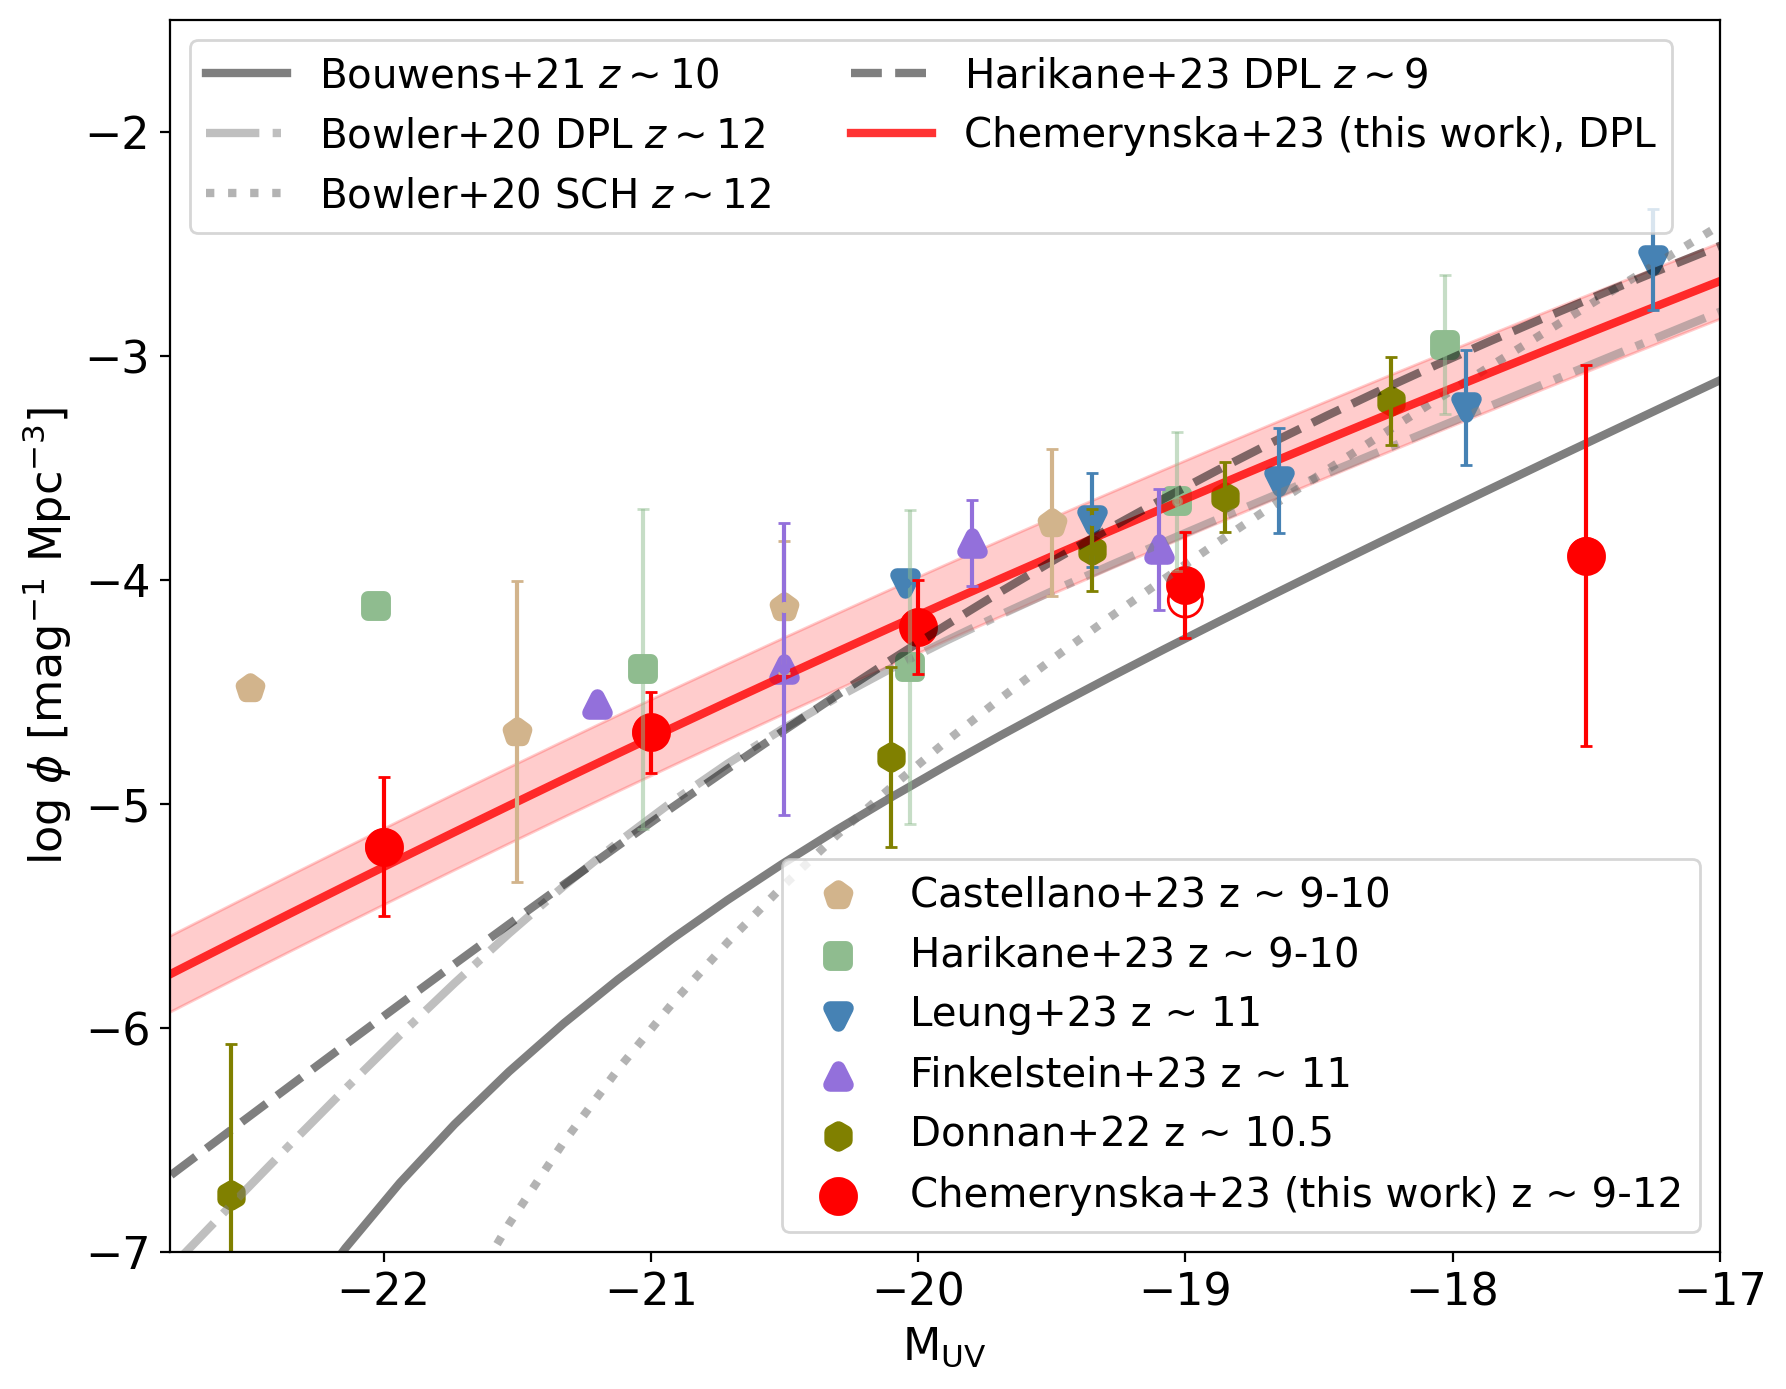
Our determination of the UV LF is shown in Figure 3, together with the recent results from other surveys in the same redshift range. The tabulated values of UV LF are presented in Table 3. In general, our sample consists of relatively bright galaxies (< -19), except for one faint galaxy at (< -17.5). The most important result of our study is the apparent overabundance of bright galaxies compared to theoretical expectations (Mason et al., 2015; Tacchella et al., 2018; Harikane et al., 2022; Mauerhofer & Dayal, 2023) or extrapolations from lower-redshift determinations. This excess is in broad agreement with the most recent JWST results that show a similar trend (Harikane et al., 2023b; Bouwens et al., 2023; Finkelstein et al., 2022b; McLeod et al., 2023; Adams et al., 2023).
We fit our LF data points with a double power-law function (e.g., Bowler et al., 2020; Finkelstein & Bagley, 2022; Donnan et al., 2023), which better describes the overall functional form of the LF at high redshifts compared to a classical Schechter (Schechter, 1976) function.
| (3) |
where is a normalization, represents characteristic magnitude, and are the faint-end slope and the bright-end slope, respectively. Because we mainly probe the bright-end of the LF, we chose to combine robust literature data points (Harikane et al., 2023b; Leung et al., 2023; Donnan et al., 2023) and for the faint-end with our results on the bright-end (< -19 mag). To determine the best-fit function, we applied the Levenberg-Marquardt (LM) approach using MCMC simulations. We fixed the parameters = -20.67 and = -2.1 in the fitting procedure, which is similar to the value adopted by recent JWST studies at similar redshift (Harikane et al., 2023b; Adams et al., 2023).
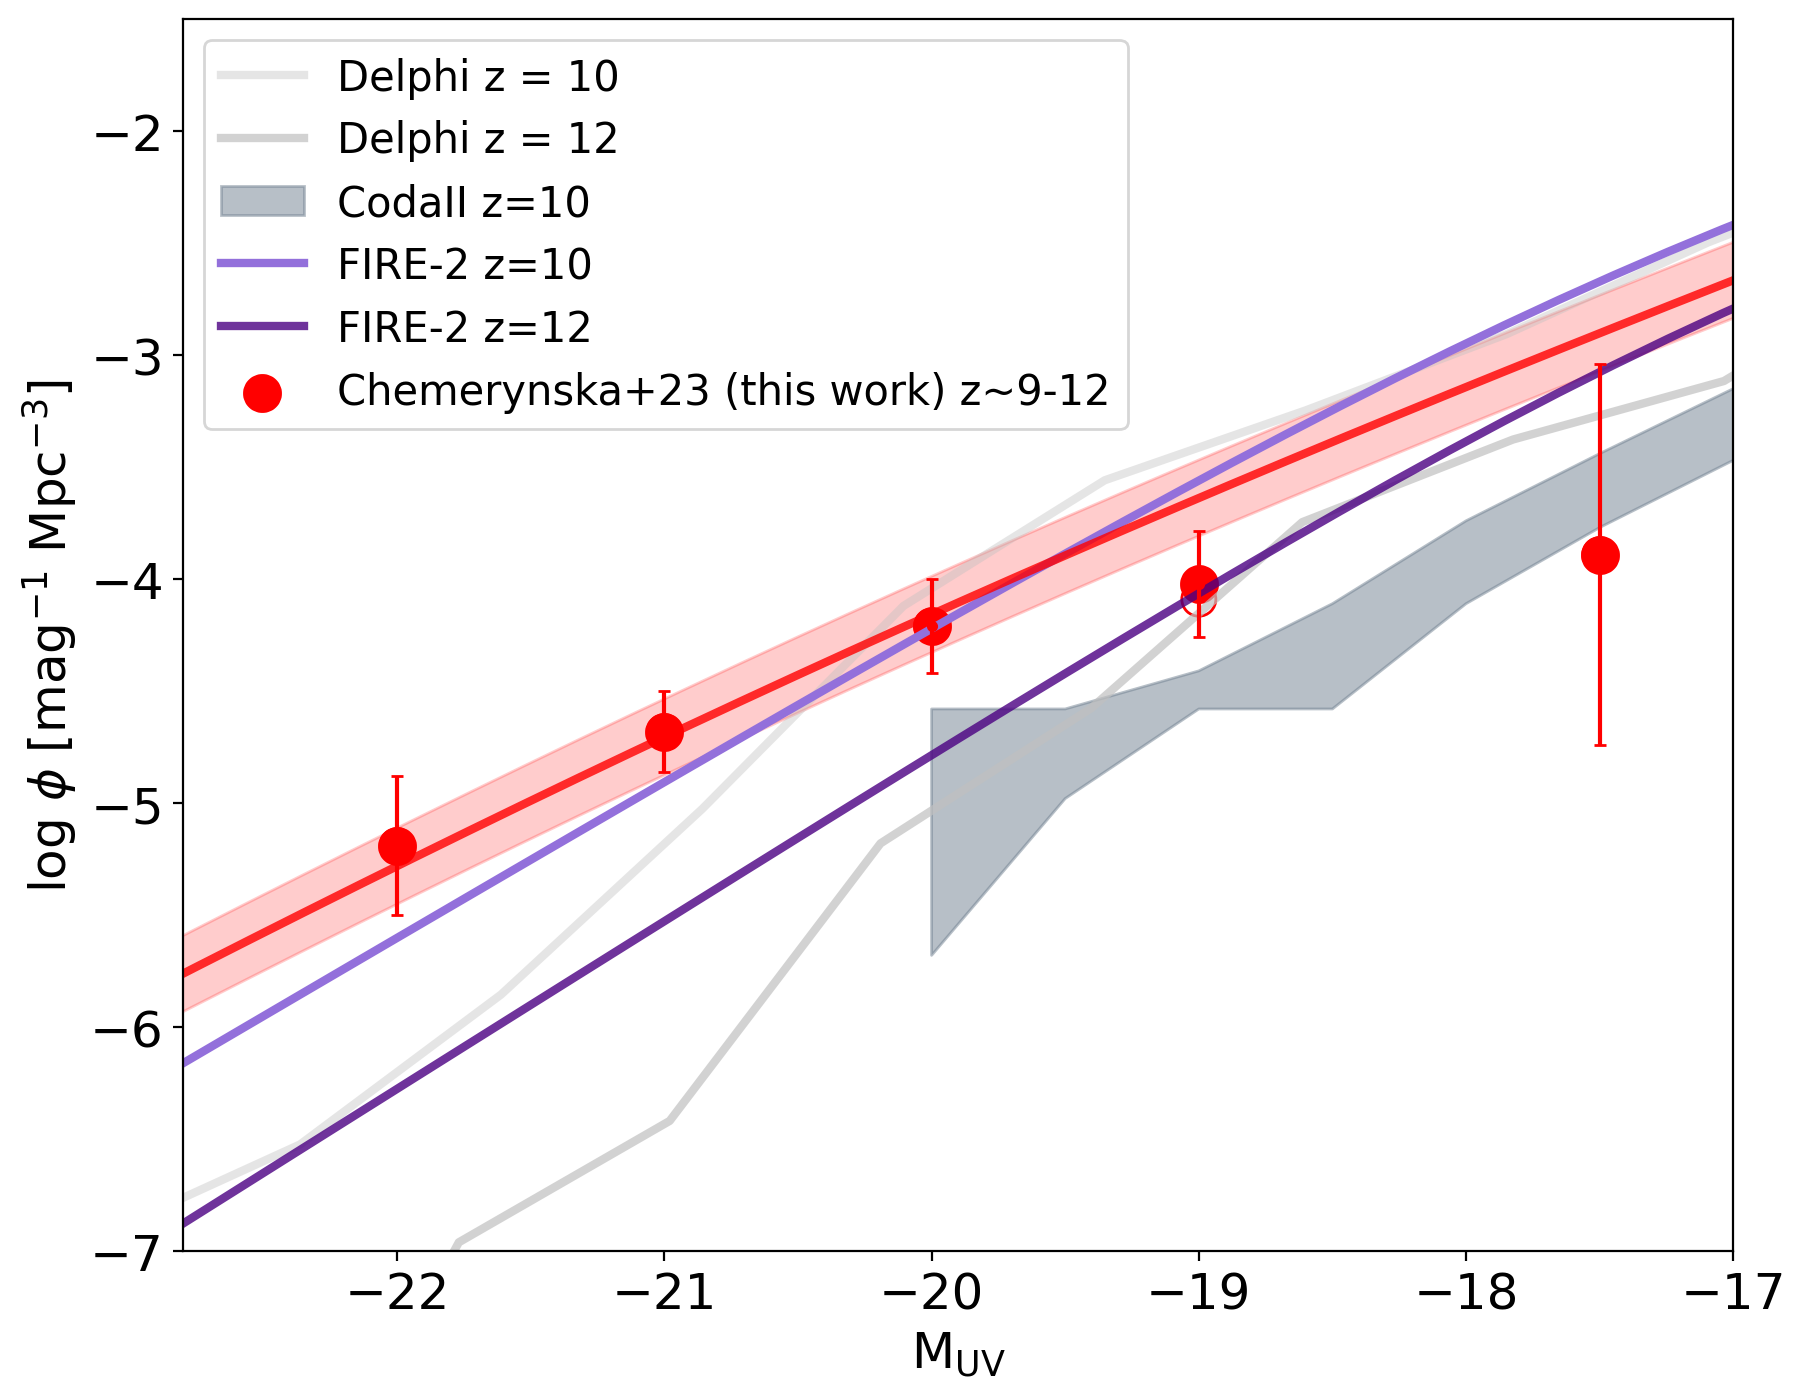
The results are presented in Table 4, together with the results of recent studies. The best-fit DPL function is represented by the red curve in Figure 3. We can see that the DPL fits reasonably well the bright-end of the LF, while our determinations at the faint-end (which are not included in the fit) are lower, with larger uncertainties. We find a shallower bright-end slope () compared to other studies, albeit with large uncertainties. Our results are in better agreement with (Castellano et al., 2022), whose galaxy sample has a significant overlap with our study, although they used a simple treatment of lensing effects. We also compare our results with the UV LF predicted by galaxy formation models in a similar redshift range. Our results are above most theoretical determinations from hydrodynamical simulations (Ocvirk et al., 2020; Sun et al., 2023) and semi-analytical models (Mauerhofer & Dayal, 2023). We note that the FIRE (Feedback In Realistic Environments) simulations reproduce better our results at .
6 The star formation rate density
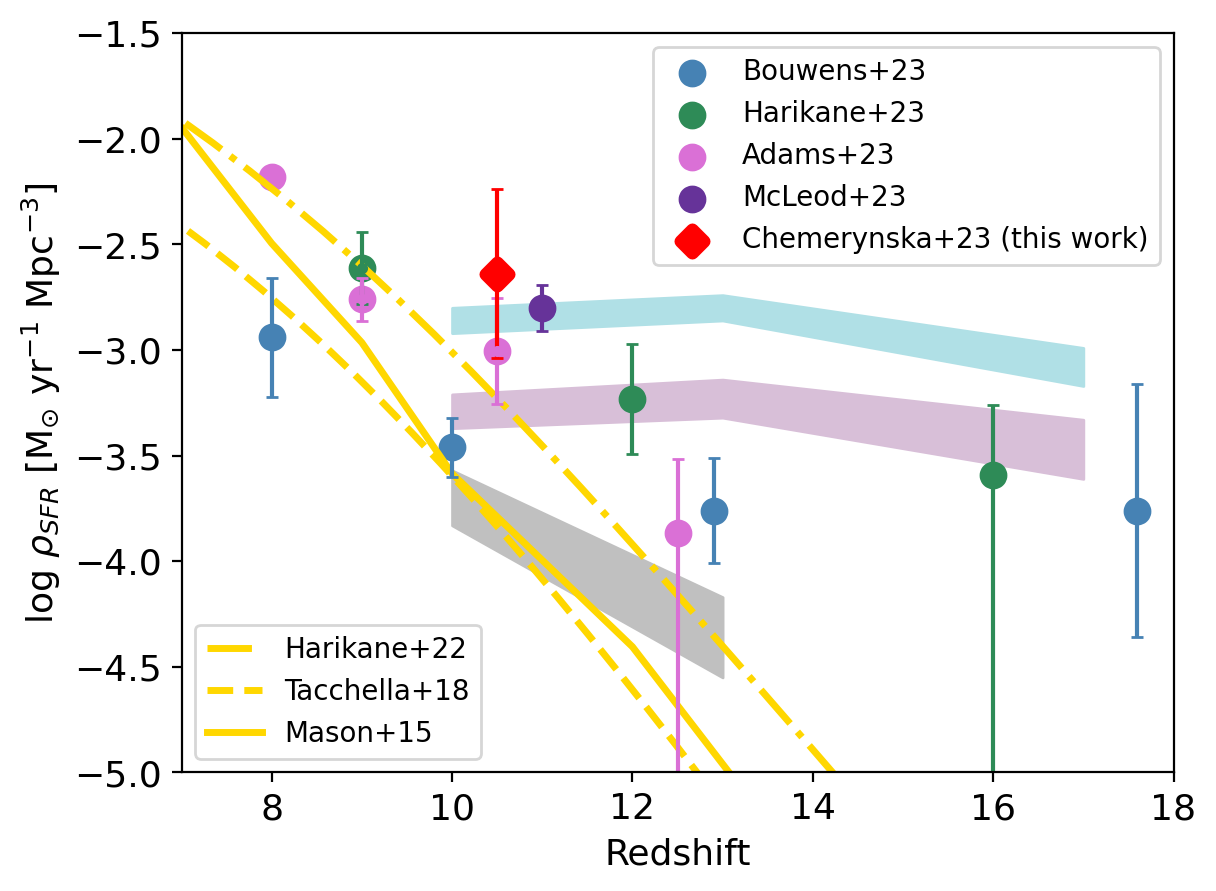
We compute the UV luminosity density by integrating the best-fit DPL of luminosity function down to a magnitude limit of = - 17 mag, following recent literature results. Adopting a fixed faint-end slope = -2.1, we obtain log(/ergs s-1 Hz-1 Mpc-3) = 25.3, which is slightly higher than recent JWST results. A full comparison with recent literature results is presented in Table 4, alongside the best-fit luminosity function parameters. Furthermore, we derive the star-formation rate density () using a canonical conversion factor = 1.1510-28 M⊙ yr-1/erg s-1 Hz-1 (Madau & Dickinson, 2014). In Figure 4, we show how our results compare with literature values and galaxy formation models. At similar redshifts, our value is slightly higher than values derived from the main JWST surveys (Adams et al., 2023; Harikane et al., 2023b). Within the uncertainties, our result is closer to the results of McLeod et al. (2023) and Bouwens et al. (2022b), when using their entire sample, including “possible” high candidates.
From the theoretical viewpoint, our results also appear at odds with galaxy formation models. There has been a long-standing debate about the redshift-evolution of the star formation efficiency (SFE) during the pre-JWST era. At redshifts higher than several models argued for a constant SFE, which were able to reproduce HST observations (e.g. Mason et al., 2015; Oesch et al., 2018). In Figure 4 we compare our results with predictions of a few examples of such models. Our derived SFRD value is 4 to 10 times higher than values predicted by constant-SFE models (Mason et al., 2015; Tacchella et al., 2018; Harikane et al., 2022). Together with literature results at other redshifts, this shows a clear excess relative to predictions of constant-SFE models. Given the reliability of our photometric selection, sample contamination from low-redshift sources is highly unlikely to explain this excess.
In a recent spectroscopic follow-up with NIRSpec, Fujimoto et al. (2023) has explored the AGN nature of 4 confirmed candidates in our sample. One candidate (ID 26185) is detected in the observed-frame 2–7 keV band in Chandra observations at a level (Bogdan et al., 2023; Goulding et al., 2023). Another candidate (ID 20466) shows a broad feature in the H emission line profile but it is not part of our sample. In order to assess the contribution of these potential AGN sources to the UV LF, and to what extent they can explain the overabundance of bright galaxies at , we recompute the SFRD without the AGN source. The result is shown with the red empty circle in Figure 3. The main results remain unchanged. The slightly lower value at the = -19 mag bin does not affect the best-fit DPL solution. Therefore, the estimated SFRD in Figure 4 remains virtually the same.
Many recent studies hint at the existence of a substantial population of AGNs at (Matthee et al., 2023; Larson et al., 2023; Kokorev et al., 2023), with a redder rest-frame optical than UV emission, and which appear more numerous than UV-selected AGNs. (Labbe et al., 2023; Furtak et al., 2023a; Greene et al., 2023). Other AGNs have also been identified at , based on their broad H emission line (Harikane et al., 2023a; Maiolino et al., 2023). The exact contribution of AGNs to the UV luminosity function remains unclear at this point, as their UV emission could originate from star formation as well as dust-scatted AGN light. Further SED modeling, observations in the infrared, and spectroscopic line diagnostics will be needed to obtain stronger constraints on the AGN contribution.
Other explanations for the UV LF enhancement at high redshift involve an evolution of the physical properties of galaxies and the star formation processes. A decrease in the dust attenuation at higher redshift as a result of strong outflows expelling gas and dust out of these early galaxies has been suggested in Ferrara et al. (2022). However, this strong redshift-evolution of the dust attenuation is currently not supported by the UV colors of galaxies across (Finkelstein et al., 2023). Alternatively, a modification of the stellar mass-to-light ratio can also explain the UV enhancement while the underlying mass function remains unchanged. One of the physical processes that can cause such variation is a stochastic star formation history. Rapid SFR variations can lead to significant deviations in the M/L ratio, making the UV luminosity an unreliable tracer of the stellar mass function. However, recent theoretical efforts have shown significant disagreements regarding the level of this UV luminosity variation. A model including variability in the physical processes (SFR, dust, metallicity) predicts the scatter of lower mass galaxies to brighter luminosity bins due to the steep slope of the LF. A UV luminosity scatter of is sufficient to reproduce the observed UV excess (Shen et al., 2023; Sun et al., 2023). On the other hand, hydrodynamical simulations that include stochasticity result in significantly lower values around , which remain below the levels required to match observations (Pallottini & Ferrara, 2023). Using SED modeling that includes stochastic SFHs, Ciesla et al. (2023) reach similar conclusions. Pacucci et al. (2022) show that AGN at high redshifts can also contribute to such UV excess. Finally, another possible cause for the M/L deviations is a different initial mass function (IMF) at early epochs. A different IMF, with a characteristic mass of M⊙, would decrease the M/L ratio by a factor of several (Raiter et al., 2010). Although changes in the IMF are expected at early epochs (e.g.; Steinhardt et al., 2023; Woodrum et al., 2023; Wang et al., 2023b), no observational evidence of such an evolution has been reported yet.
| Study | z | KUV | ||||||
|---|---|---|---|---|---|---|---|---|
| [mag-1Mpc-3] | [mag] | [ergs s-1 Hz-1 Mpc-3 ] | [M⊙yr-1Mpc-3] | [M⊙ yr-1erg-1 s Hz] | ||||
| Harikane+23 | 9 | -3.50 | -19.33 | -2.1∗ | -3.27 | 25.28 | -2.61 | 1.1510-28 |
| Bouwens+23 | 10 | -3.55 0.14 | -19.67∗ | -2.35∗ | -3.75∗ | 24.69 0.14 | -3.46 0.14 | 0.710-29 |
| Adams+23 | 10.5 | -4.47 0.65 | -20.72 0.97 | -2.1∗ | -4.06 0.94 | 24.95 0.41 | -3.01 0.41 | 1.1510-28 |
| Leung+23 | 11 | -4.75 | -20.99∗ | -2.22 | -4.19∗ | |||
| McLeod+23 | 11 | -4.70 0.45 | -20.87 0.62 | -2.35∗ | -4.18 0.71 | 25.14 | 2.80 | 1.1510-28 |
| This work | 10.5 | -4.22 0.71 | -20.67∗ | -2.1∗ | -2.66 1.09 | 25.30 0.36 | -2.64 0.36 | 1.1510-28 |
7 Conclusions
In the present paper, we used a sample of galaxies discovered in the UNCOVER survey to construct a robust UV luminosity function across . This high-redshift catalog consists of 16 galaxies observed behind the lensing cluster A2744 with intrinsic magnitudes between M -22 and -17 mag. Sources were selected using a combination of color-color dropout criteria and photometric redshift estimates derived from SED fitting (Atek et al., 2023a). Among these sources, four were followed-up with NIRSpec Prism observations as part of the UNCOVER survey. All four sources were confirmed around their photometric redshift (Fujimoto et al., 2023), achieving a 100% confirmation rate, which underscores the reliability of the present photometric sample.
To compute the most accurate UV luminosity function at through lensing clusters, we first conducted a forward modeling procedure to derive the effective survey volume. By operating directly in the source plane, we naturally take into account all lensing effects. Furthermore, in order to assess systematic uncertainties related to lensing, we compared two independent models derived by Furtak et al. (2023b) and Bergamini et al. (2023b). The most important result is the overabundance of UV-bright galaxies, which reach a factor of 10-100 higher than theoretical expectations, or previous HST observations. Our results confirm the emerging picture describing a strong redshift-evolution of the physical properties or the physical processes governing star formation in early galaxies (Harikane et al., 2023b; Finkelstein et al., 2023; Bouwens et al., 2023). At the same time, given the depth of these lensing-assisted observations and the supposedly steep faint-end slope of the LF at these redshifts, the lack of faint galaxies (>-17 mag) in our survey is surprising. It may lead to the dearth of the low luminosity objects and requires further investigation.
Our determination of the star formation rate density at lies above most theoretical models of galaxy formation (Mason et al., 2015; Ocvirk et al., 2020; Mauerhofer & Dayal, 2023). Among the variety of scenarios proposed to explain this excess, star formation stochasticity has been widely explored. For instance, by including variability in the conversion from dark matter halo mass to UV luminosity, a dispersion in the UV luminosity of = 1.5 to 2 is required to match the observations at these redshifts (e.g. Shen et al., 2023). At the same time, other theoretical efforts based on hydrodynamical simulations or stellar population modeling have measured an insufficient variability to explain such excess (Pallottini & Ferrara, 2023; Ciesla et al., 2023). While early studies indicate that high galaxies experience bursty star formation (Endsley et al., 2023; Looser et al., 2023), spectroscopic observations of a large sample of these sources will help constrain the stochastic SFH and the inferred UV luminosity dispersion. A combination of SED modeling associated with observational constraints of SFR indicators on different timescales is key to addressing this question. Such efforts will be largely complemented by wide-area surveys, such as Euclid, which will uncover thousands of galaxies brighter than = -21 mag at redshifts higher than . Large ground-based spectroscopic follow-up campaigns will be essential for their redshift confirmation.
Stellar feedback, which causes large variations in star formation history, predominantly affects low-mass galaxies. They are therefore the best sites to study the strength and the effects of stochasticity on the observed physical properties in general. Ultra-deep JWST imaging surveys such as GLIMPSE (PID 3293) are set to measure the prevalence of ultra-faint galaxies at and infer the constraints on the implementation of feedback in galaxy formation models. Such surveys will also probe the so far elusive, yet supposedly common, population of faint galaxies during the Dark Ages, to test whether this surprising redshift-evolution of bright galaxies also applies to low-mass galaxies, which are expected to be the dominant population at early epochs.
Acknowledgments
This work is based on observations obtained with the NASA/ESA/CSA JWST and the NASA/ESA Hubble Space Telescope (HST), retrieved from the Mikulski Archive for Space Telescopes (MAST) at the Space Telescope Science Institute (STScI). STScI is operated by the Association of Universities for Research in Astronomy, Inc. under NASA contract NAS 5-26555. This work was supported by CNES, focused on the JWST mission. This work was supported by the Programme National Cosmology and Galaxies (PNCG) of CNRS/INSU with INP and IN2P3, co-funded by CEA and CNES. This work has made use of the CANDIDE Cluster at the Institut d’Astrophysique de Paris (IAP), made possible by grants from the PNCG and the region of Île de France through the program DIM-ACAV+, and the Cosmic Dawn Center and maintained by S. Rouberol. AZ acknowledges support by grant No. 2020750 from the United States-Israel Binational Science Foundation (BSF) and grant No. 2109066 from the United States National Science Foundation (NSF); by the Israel Science Foundation grant No. 864/23; and by the Ministry of Science & Technology, Israel. PD acknowledges support from the NWO grant 016.VIDI.189.162 (“ODIN") and from the European Commission’s and University of Groningen’s CO-FUND Rosalind Franklin program.
Data Availability
The data underlying this article are publicly available on the Mikulski Archive for Space Telescopes222https://archive.stsci.edu/ (MAST), under program ID 2561. Reduced and calibrated mosaics, as well as lensing products, are available on the UNCOVER webpage: https://jwst-uncover.github.io/
References
- Adams et al. (2023) Adams N. J., et al., 2023, MNRAS, 518, 4755
- Arrabal Haro et al. (2023a) Arrabal Haro P., et al., 2023a, arXiv e-prints, p. arXiv:2303.15431
- Arrabal Haro et al. (2023b) Arrabal Haro P., et al., 2023b, ApJ, 951, L22
- Atek et al. (2018) Atek H., Richard J., Kneib J.-P., Schaerer D., 2018, MNRAS, 479, 5184
- Atek et al. (2023a) Atek H., et al., 2023a, MNRAS, 519, 1201
- Atek et al. (2023b) Atek H., et al., 2023b, MNRAS, 524, 5486
- Austin et al. (2023) Austin D., et al., 2023, arXiv e-prints, p. arXiv:2302.04270
- Bergamini et al. (2023a) Bergamini P., et al., 2023a, A&A, 670, A60
- Bergamini et al. (2023b) Bergamini P., et al., 2023b, ApJ, 952, 84
- Bertin & Arnouts (1996) Bertin E., Arnouts S., 1996, A&AS, 117, 393
- Bezanson et al. (2022) Bezanson R., et al., 2022, arXiv e-prints, p. arXiv:2212.04026
- Bogdan et al. (2023) Bogdan A., et al., 2023, arXiv e-prints, p. arXiv:2305.15458
- Bouwens et al. (2022a) Bouwens R. J., et al., 2022a, arXiv e-prints, p. arXiv:2211.02607
- Bouwens et al. (2022b) Bouwens R. J., et al., 2022b, ApJ, 931, 160
- Bouwens et al. (2023) Bouwens R., Illingworth G., Oesch P., Stefanon M., Naidu R., van Leeuwen I., Magee D., 2023, MNRAS, 523, 1009
- Bowler et al. (2020) Bowler R. A. A., Jarvis M. J., Dunlop J. S., McLure R. J., McLeod D. J., Adams N. J., Milvang-Jensen B., McCracken H. J., 2020, MNRAS, 493, 2059
- Brammer et al. (2022) Brammer G., Strait V., Matharu J., Momcheva I., 2022, grizli, Zenodo, doi:10.5281/zenodo.6672538
- Bunker et al. (2023a) Bunker A. J., et al., 2023a, arXiv e-prints, p. arXiv:2302.07256
- Bunker et al. (2023b) Bunker A. J., et al., 2023b, arXiv e-prints, p. arXiv:2306.02467
- Castellano et al. (2022) Castellano M., et al., 2022, arXiv e-prints, p. arXiv:2212.06666
- Chevallard & Charlot (2016) Chevallard J., Charlot S., 2016, MNRAS, 462, 1415
- Ciesla et al. (2023) Ciesla L., et al., 2023, arXiv e-prints, p. arXiv:2309.15720
- Curtis-Lake et al. (2022) Curtis-Lake E., et al., 2022, arXiv e-prints, p. arXiv:2212.04568
- Dayal et al. (2022) Dayal P., et al., 2022, MNRAS, 512, 989
- Dekel et al. (2023) Dekel A., Sarkar K. S., Birnboim Y., Mandelker N., Li Z., 2023, arXiv e-prints, p. arXiv:2303.04827
- Donnan et al. (2023) Donnan C. T., et al., 2023, MNRAS, 518, 6011
- Endsley et al. (2023) Endsley R., et al., 2023, arXiv e-prints, p. arXiv:2306.05295
- Ferrara et al. (2022) Ferrara A., Pallottini A., Dayal P., 2022, arXiv e-prints, p. arXiv:2208.00720
- Finkelstein & Bagley (2022) Finkelstein S. L., Bagley M. B., 2022, ApJ, 938, 25
- Finkelstein et al. (2022a) Finkelstein S. L., et al., 2022a, arXiv e-prints, p. arXiv:2211.05792
- Finkelstein et al. (2022b) Finkelstein S. L., et al., 2022b, ApJ, 940, L55
- Finkelstein et al. (2023) Finkelstein S. L., et al., 2023, arXiv e-prints, p. arXiv:2311.04279
- Fujimoto et al. (2023) Fujimoto S., et al., 2023, arXiv e-prints, p. arXiv:2308.11609
- Furtak et al. (2023a) Furtak L. J., et al., 2023a, arXiv e-prints, p. arXiv:2308.05735
- Furtak et al. (2023b) Furtak L. J., et al., 2023b, MNRAS, 523, 4568
- Furtak et al. (2023c) Furtak L. J., et al., 2023c, ApJ, 952, 142
- Gehrels (1986) Gehrels N., 1986, ApJ, 303, 336
- Goulding et al. (2023) Goulding A. D., et al., 2023, ApJ, 955, L24
- Greene et al. (2023) Greene J. E., et al., 2023, arXiv e-prints, p. arXiv:2309.05714
- Hainline et al. (2023) Hainline K. N., et al., 2023, arXiv e-prints, p. arXiv:2306.02468
- Harikane et al. (2022) Harikane Y., et al., 2022, ApJS, 259, 20
- Harikane et al. (2023a) Harikane Y., et al., 2023a, arXiv e-prints, p. arXiv:2303.11946
- Harikane et al. (2023b) Harikane Y., et al., 2023b, ApJS, 265, 5
- Hsiao et al. (2023) Hsiao T. Y.-Y., et al., 2023, arXiv e-prints, p. arXiv:2305.03042
- Hutter et al. (2021) Hutter A., Dayal P., Yepes G., Gottlöber S., Legrand L., Ucci G., 2021, MNRAS, 503, 3698
- Jakobsen et al. (2022) Jakobsen P., et al., 2022, A&A, 661, A80
- Kokorev et al. (2023) Kokorev V., et al., 2023, arXiv e-prints, p. arXiv:2308.11610
- Labbe et al. (2023) Labbe I., et al., 2023, arXiv e-prints, p. arXiv:2306.07320
- Larson et al. (2023) Larson R. L., et al., 2023, ApJ, 953, L29
- Leung et al. (2023) Leung G. C. K., et al., 2023, ApJ, 954, L46
- Looser et al. (2023) Looser T. J., et al., 2023, arXiv e-prints, p. arXiv:2306.02470
- Lotz et al. (2017) Lotz J. M., et al., 2017, ApJ, 837, 97
- Madau & Dickinson (2014) Madau P., Dickinson M., 2014, ARA&A, 52, 415
- Maiolino et al. (2023) Maiolino R., et al., 2023, arXiv e-prints, p. arXiv:2308.01230
- Mason et al. (2015) Mason C., Trenti M., Treu T., 2015, preprint, (arXiv:1508.01204)
- Mason et al. (2023) Mason C. A., Trenti M., Treu T., 2023, MNRAS, 521, 497
- Matthee et al. (2023) Matthee J., et al., 2023, arXiv e-prints, p. arXiv:2306.05448
- Mauerhofer & Dayal (2023) Mauerhofer V., Dayal P., 2023, MNRAS, 526, 2196
- McLeod et al. (2023) McLeod D. J., et al., 2023, arXiv e-prints, p. arXiv:2304.14469
- Morishita et al. (2023) Morishita T., et al., 2023, ApJ, 947, L24
- Muñoz et al. (2023) Muñoz J. B., Mirocha J., Furlanetto S., Sabti N., 2023, MNRAS, 526, L47
- Naidu et al. (2022a) Naidu R. P., et al., 2022a, arXiv e-prints, p. arXiv:2208.02794
- Naidu et al. (2022b) Naidu R. P., et al., 2022b, ApJ, 940, L14
- Ocvirk et al. (2020) Ocvirk P., et al., 2020, MNRAS, 496, 4087
- Oesch et al. (2018) Oesch P. A., Bouwens R. J., Illingworth G. D., Labbé I., Stefanon M., 2018, ApJ, 855, 105
- Ono et al. (2018) Ono Y., et al., 2018, PASJ, 70, S10
- Pacucci et al. (2022) Pacucci F., Dayal P., Harikane Y., Inoue A. K., Loeb A., 2022, MNRAS, 514, L6
- Pallottini & Ferrara (2023) Pallottini A., Ferrara A., 2023, A&A, 677, L4
- Pascale et al. (2022) Pascale M., et al., 2022, ApJ, 938, L6
- Pei (1992) Pei Y. C., 1992, ApJ, 395, 130
- Pontoppidan et al. (2022) Pontoppidan K. M., et al., 2022, ApJ, 936, L14
- Raiter et al. (2010) Raiter A., Schaerer D., Fosbury R. A. E., 2010, A&A, 523, A64
- Rieke et al. (2023) Rieke M. J., et al., 2023, PASP, 135, 028001
- Roberts-Borsani et al. (2022) Roberts-Borsani G., et al., 2022, ApJ, 938, L13
- Roberts-Borsani et al. (2023) Roberts-Borsani G., et al., 2023, Nature, 618, 480
- Robertson et al. (2023) Robertson B. E., et al., 2023, Nature Astronomy, 7, 611
- Rowe et al. (2015) Rowe B. T. P., et al., 2015, Astronomy and Computing, 10, 121
- Schechter (1976) Schechter P., 1976, ApJ, 203, 297
- Shen et al. (2023) Shen X., Vogelsberger M., Boylan-Kolchin M., Tacchella S., Kannan R., 2023, MNRAS, 525, 3254
- Shibuya et al. (2015) Shibuya T., Ouchi M., Harikane Y., 2015, ApJS, 219, 15
- Steinhardt et al. (2020) Steinhardt C. L., et al., 2020, ApJS, 247, 64
- Steinhardt et al. (2023) Steinhardt C. L., Kokorev V., Rusakov V., Garcia E., Sneppen A., 2023, ApJ, 951, L40
- Sun et al. (2023) Sun G., Faucher-Giguère C.-A., Hayward C. C., Shen X., Wetzel A., Cochrane R. K., 2023, ApJ, 955, L35
- Tacchella et al. (2018) Tacchella S., Bose S., Conroy C., Eisenstein D. J., Johnson B. D., 2018, ApJ, 868, 92
- Trapp & Furlanetto (2020) Trapp A. C., Furlanetto S. R., 2020, MNRAS, 499, 2401
- Treu et al. (2022) Treu T., et al., 2022, ApJ, 935, 110
- Ucci et al. (2021) Ucci G., et al., 2021, MNRAS, 506, 202
- Wang et al. (2023a) Wang B., et al., 2023a, arXiv e-prints, p. arXiv:2308.03745
- Wang et al. (2023b) Wang B., et al., 2023b, arXiv e-prints, p. arXiv:2310.06781
- Weaver et al. (2023) Weaver J. R., et al., 2023, arXiv e-prints, p. arXiv:2301.02671
- Whitler et al. (2023) Whitler L., Endsley R., Stark D. P., Topping M., Chen Z., Charlot S., 2023, MNRAS, 519, 157
- Woodrum et al. (2023) Woodrum C., et al., 2023, arXiv e-prints, p. arXiv:2310.18464
- Yang et al. (2022) Yang L., et al., 2022, AJL, 938, L17
- Zavala et al. (2023) Zavala J. A., et al., 2023, ApJ, 943, L9
- Zitrin et al. (2015) Zitrin A., et al., 2015, ApJ, 801, 44