A single-phonon directional coupler
Abstract
Integrated photonics has enabled countless technologies in telecommunications, spectroscopy, metrology, quantum optics, and quantum information processing. Using highly confined guided optical modes is the key that has made integrated circuits possible and has lead to scaling of complex designs, benefiting from their small footprint. At the same time, the field of quantum acoustics has recently gained significant attention due to its various potential advantages over its photonic counterparts, including smaller mode volume, lower energy, and orders of magnitude slower propagation speeds, as well as the potential for interconnecting distinct quantum systems. Developing analogous integrated phononic technology is critical for realizing the full potential of phonons and could lead to groundbreaking new applications, such as scalable quantum computing and hybrid quantum devices. In this work, we demonstrate for the first time a 4-port directional coupler for quantum mechanical excitations – a crucial component for integrated phononic circuits. Adjusting the length of the coupling region allows to realize phononic beam splitters with varying splitting ratios. By sending a single-phonon Fock state onto one of these phononic splitters, we demonstrate the capability of using the directional coupler directly in the quantum regime. Our work provides an essential step towards an integrated phononic platform for both classical and quantum technologies applications.
Introduction
Quantum technologies have seen rapid progress in the past few years, with great promise for testing fundamental science, as well as for commercial applications. The remarkable demonstrations of quantum computational advantage [1, 2] over classical processors and long-distance quantum teleportation using a satellite [3] have highlighted the fundamental need to create heterogeneous quantum systems [4] in order to realize advanced quantum technologies [5], such as quantum networks [6]. Phonons – quantized mechanical vibrations – are regarded as a critical resource to connect different quantum devices [7, 8], with applications in, for example, quantum transduction [9, 10, 11] and sensing [12]. Accordingly, routing and manipulating single mechanical vibrations on a chip is crucial to transfer quantum information between different quantum systems and unlock the potential of hybrid quantum systems.
To date, two main platforms have been developed for this purpose: surface acoustic waves (SAWs) [13, 14, 15] and highly confined one-dimensional phononic waveguides based on phononic crystals [16]. In particular, SAWs have been used to couple two qubits to one another over a distance of around 2 mm [13]. The propagation distance of these acoustic waves is however limited by the relatively short phononic lifetime in the range of tens of microseconds. At the same time, due to the two-dimensional, inherently open nature of SAWs, devices are characterized by a relatively large footprint, making scaling to more complex circuits challenging. Nevertheless, significant progress has recently culminated in a remarkable proof-of-principle demonstration of a phononic beam splitter for SAWs [17]. Highly confined GHz phonons in single-mode waveguides on the other hand are characterized by milliseconds-long lifetimes [18] and feature a relatively small footprint compared to SAWs, making them an ideal platform for on-chip quantum applications [19] and for integrated phononic circuits in general. In these structures, an opto-mechanical resonator is typically used for the generation, manipulation, and detection of highly confined phonons: from realizing single Fock states of phonons [20, 21], remote phonon-phonon quantum entanglement [22], and optomechanical Bell tests [23] to quantum teleportation [24]. More recently, single-phonon waveguides were successfully connected to such opto-mechanical resonators to route single phonon wavepackets on a chip [19].
In photonics, beam splitters form the fundamental cornerstone for a myriad of applications – they provide a classical platform to investigate the wave nature of light, are used as combiners and power distributors, are critical for quantum optics experiments, and are an essential resource for linear optical quantum computing and processing [25], to name a few examples. Importantly, the ability to miniaturize photonic components has been paramount for realizing novel technologies, as it enables photonic integrated circuits with thousands of components while still preserving a millimeter-scale footprint [26, 27, 28]. In close analogy, here we experimentally realize the phononic equivalent of this crucial component – an integrated phononic beam splitter – arguably the most critical element to perform advanced on-chip manipulation of mechanical excitations. Drawing inspiration from photonics, we design our beam splitter using a 4-port directional coupler architecture, where two identical single-mode waveguides are coupled together in an interaction region, creating symmetric and anti-symmetric supermodes which are delocalized in both waveguides. The splitting ratio can be adjusted by changing the length of this interaction region. We demonstrate the beam splitter behavior for both coherent and single-phonon Fock states. With a footprint of only about m, our device is easily scalable and represents a critical step towards the realization of integrated phononic circuits [29, 30, 31].
Device Design and Characterization
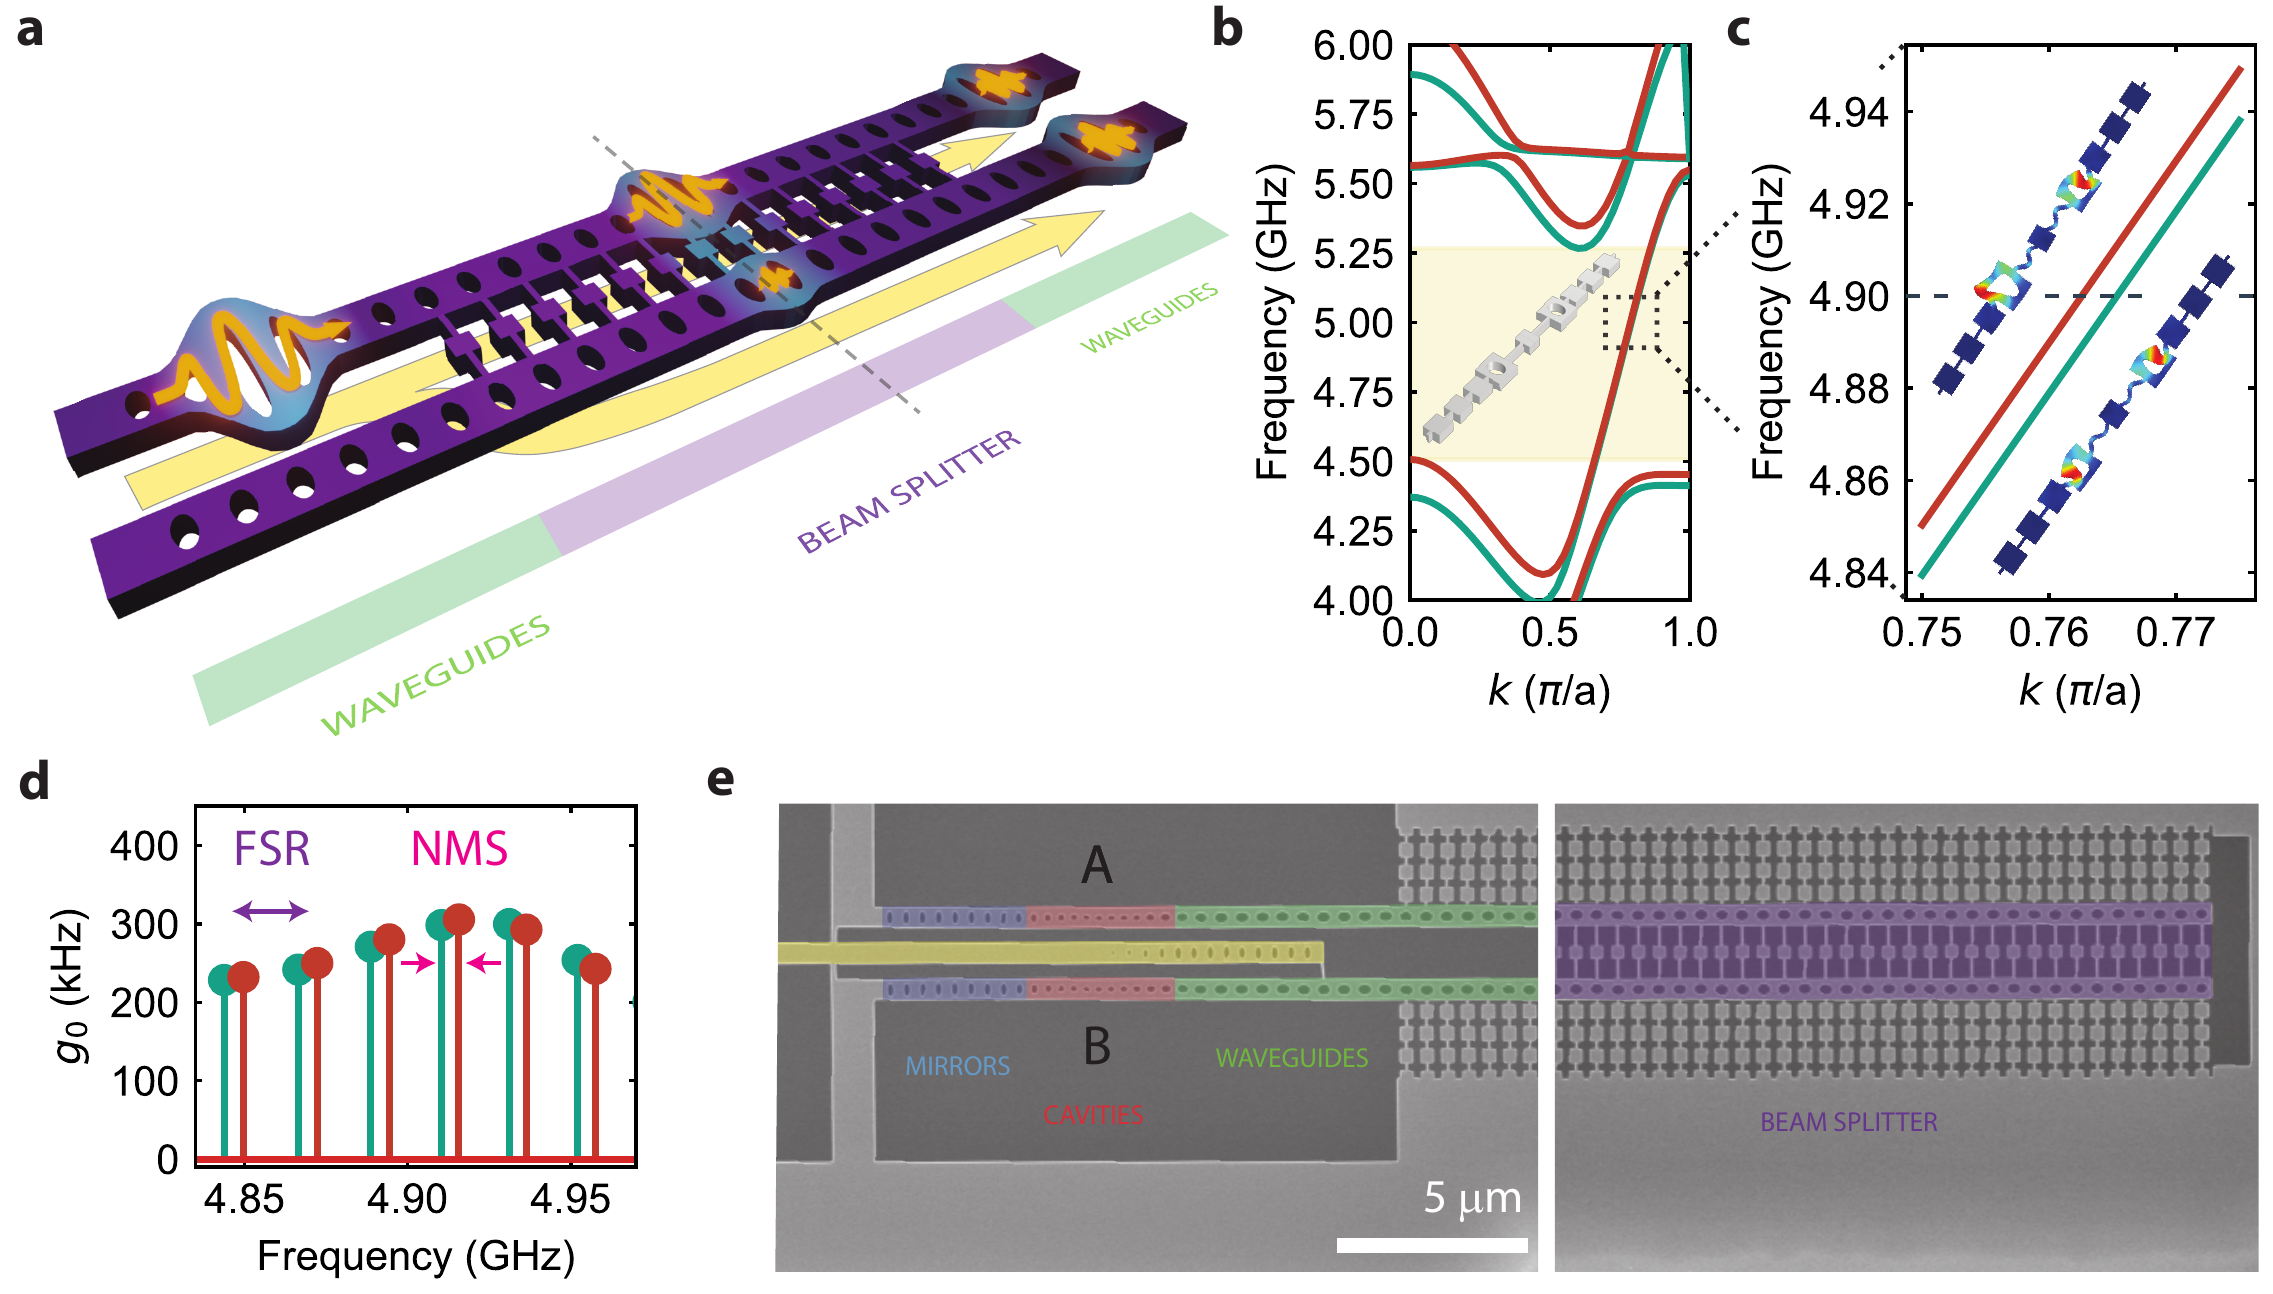
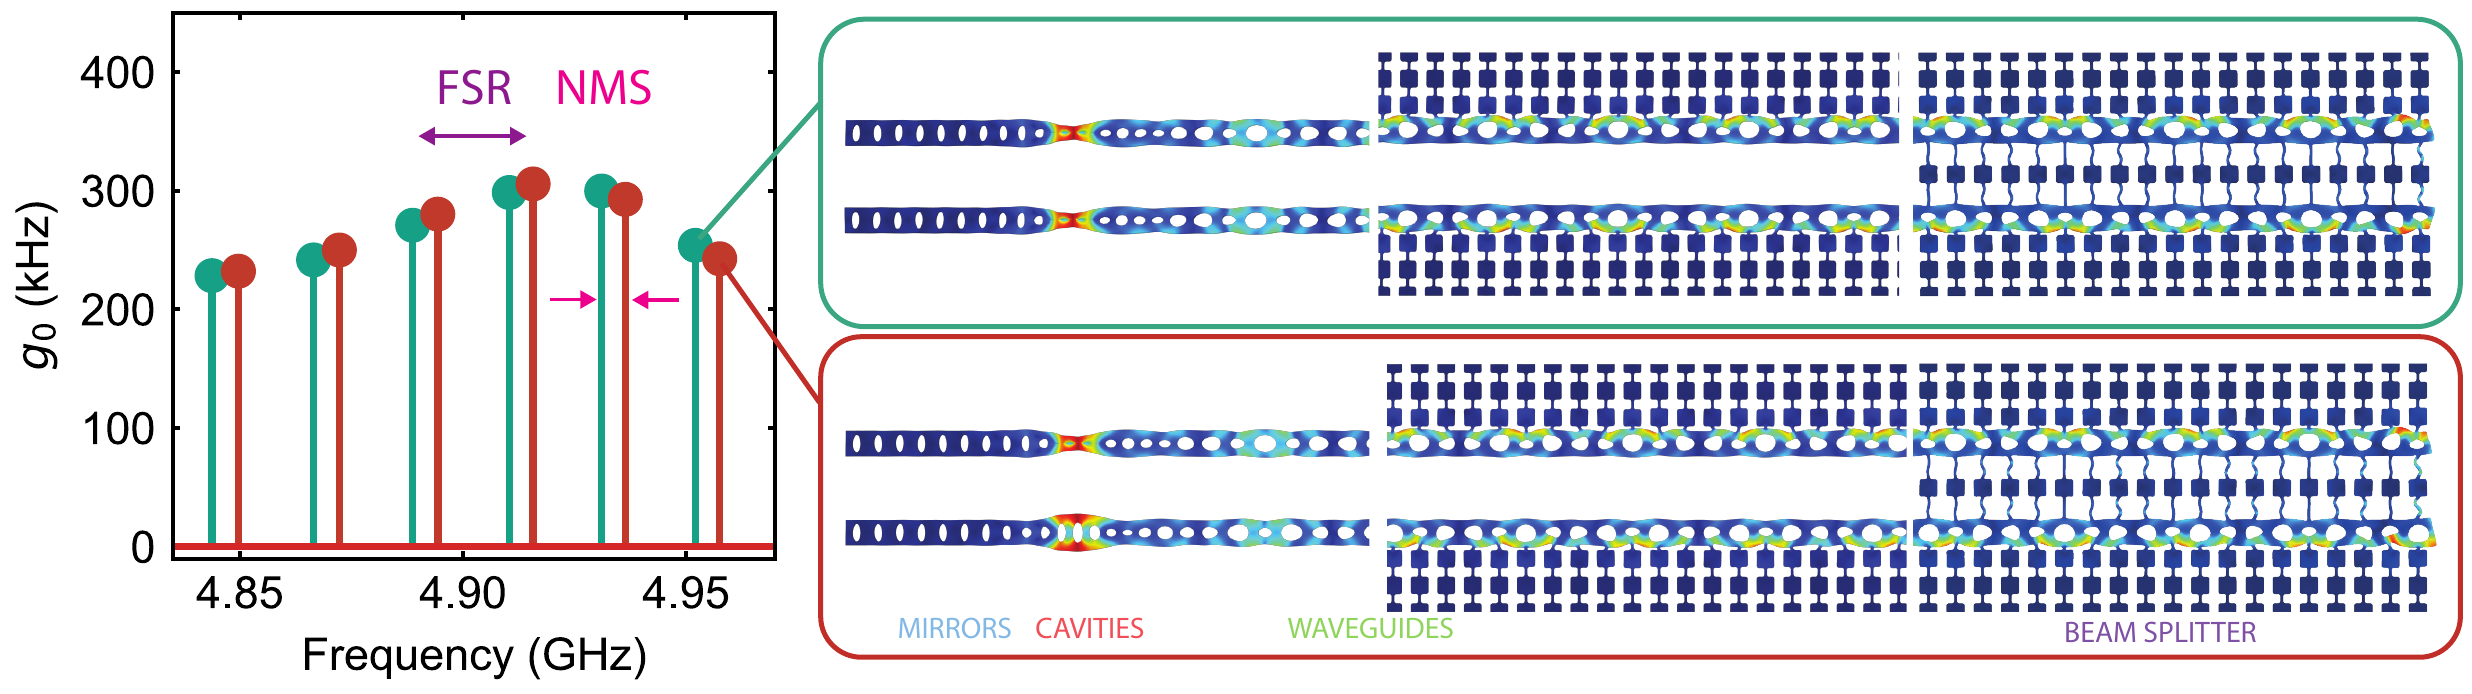
A conceptual sketch of our device is shown in Fig. 1a. The device is formed by two single-phonon sources (the optomechanical cavities), two single-mode waveguides, a beam splitter, and two single-phonon detectors. To realize the phononic beam splitter, we design an integrated directional coupler using a phononic crystal architecture. The corresponding unit cell of length is shown in the inset of Fig. 1b. It consists of two single-mode waveguides [16], connected together via a phononic bridge. This interaction region allows mechanical energy to be exchanged between the waveguides, resembling the evanescent coupling typically used in photonic directional couplers. In contrast to a conventional directional coupler, the two waveguides host both the two incoming, as well as the two outgoing ports, as detailed below. To verify the analogy to a photonic directional coupler, we perform finite element simulations of the unit cell using COMSOL and calculate the corresponding band structure. The results are shown in Fig. 1b, for the breathing mode in the in-plane direction. Within a frequency range of GHz, the band structure is dominated by the symmetric and anti-symmetric supermodes, which are the even and odd linear combinations of the uncoupled modes, respectively. A zoom-in around shown in Fig. 1c reveals that the two supermodes have different propagation constants , which relate to the coupling coefficient per unit length as , with the subscripts indicating the symmetric and anti-symmetric supermodes, respectively. As a result of the coupling, for each wave vector, the supermodes are frequency split by the normal mode splitting , as expected from two coupled degenerate harmonic oscillators. We use the extracted value of to estimate the coupling length (i.e. number of beam splitter unit cells) needed for different splitting ratio. To reduce the experimental complexity, we engineer a device with a (phononic) mirror at the center of Fig. 1a (represented by the dashed line, and realized by a free-standing end) [16, 19]. In this way the same two cavities can be used as transmitters and receivers. The output arms of the directional coupler are connected to two, uncoupled single-mode, waveguides, each terminated with a (nominally identical) optomechanical cavity. The cavities are used to generate and detect single phonons via the optomechanical interaction. Through finite element simulation of the full structure we can calculate the optomechanical coupling rates for different modes, plotted in Fig. 1d. The optomechanical response is dominated by a series of Fabry-Pérot modes, equally spaced by , which arise from the hybridization of the mechanical cavity mode with the series of modes supported by the free-ending waveguide. Furthermore, each Fabry-Pérot mode is split by into a doublet due to the mechanical coupling between the two devices (see SI .1 for more details). Scanning electron microscope (SEM) pictures of one of the fabricated devices, made from silicon [16, 19], are shown in Fig. 1e. For space reasons the waveguides are not fully shown and the total length of the device is about .
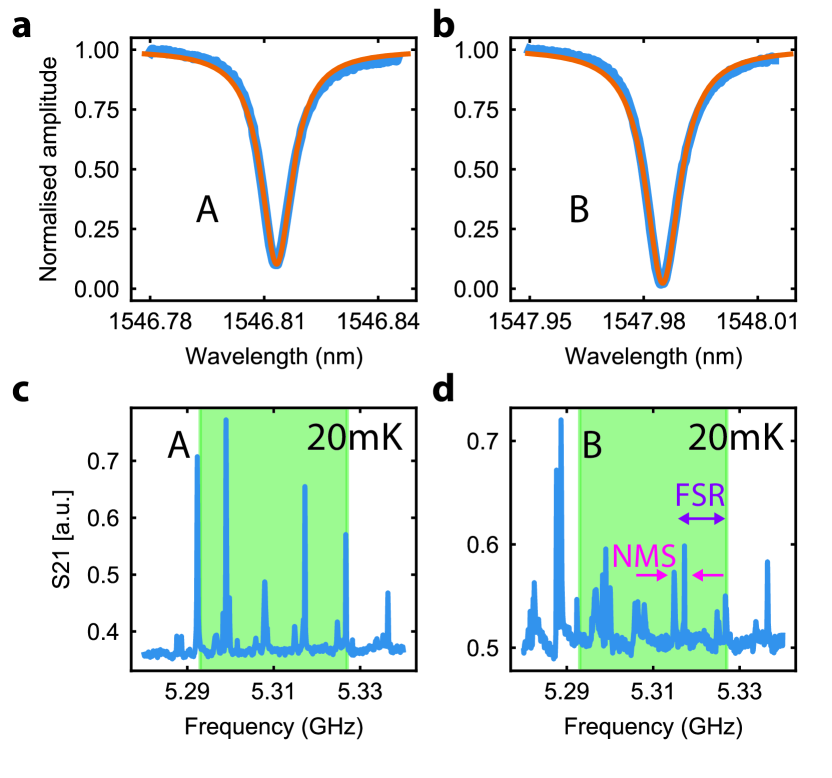
To minimize the thermal noise background, we cool our device to using a dilution refrigerator, initializing all mechanical modes of interest in their quantum ground states. We measure the optical characteristics of the two optomechanical cavities by scanning a continuous-wave laser through their resonances and measure the reflected signal on a photodiode. The reflection spectra are shown in Fig. 2a and b (for cavity A and B, respectively). Fitting the line shape with a Lorentzian, we determine the optical cavity resonance at (), and a full-width at half-maximum (FWHM) of (), with an intrinsic loss rate of (), for device A (B), respectively. The cavities are nominally identical, apart from fabrication imperfections. Since the difference between the optical resonances is much bigger than the linewidths and mechanical frequencies, we can address each cavity individually. This allows us to measure the mechanical spectrum of the structure using optomechanically induced transparency (OMIT) [32]. The results are plotted in Fig. 2c and d (for cavity A and B, respectively). Both devices, within a region of (highlighted in green shaded area) show a series of doublets with a normal mode splitting of , spaced almost evenly by . This clearly shows that, due to the precision in nanofabrication, the mechanical modes of the cavity-waveguide systems hybridize through the directional coupler. As will be shown later, for this particular device this corresponds to a directional coupler with splitting ratio of approximately 50:50. We further determine the equivalent single photon optomechanical coupling rate from the Stokes scattered photon rate by sending optical pulses to the devices. We measure values of and for device A and B, respectively, in good agreement with simulations.
Coherent drive measurement
In order to characterize the time-domain behavior of the beam splitter, we study the propagation of coherent phononic wavepackets. We detune the laser by from the optical cavity we aim to excite. By using this detuning the Stokes (and anti-Stokes) scattering rate are strongly suppressed and can be neglected. We then modulate sidebands at the mechanical frequency onto the laser using an electro-optical modulator (EOM). The sidebands create a beating tone at the mechanical frequency, which coherently drives the mechanical motion through radiation pressure. The optical pulses are created using an acousto-optical modulator and are long, such that we excite modes only within the spectral region shown in the green shaded area in Fig. 2c and d, for cavity A and B, respectively.
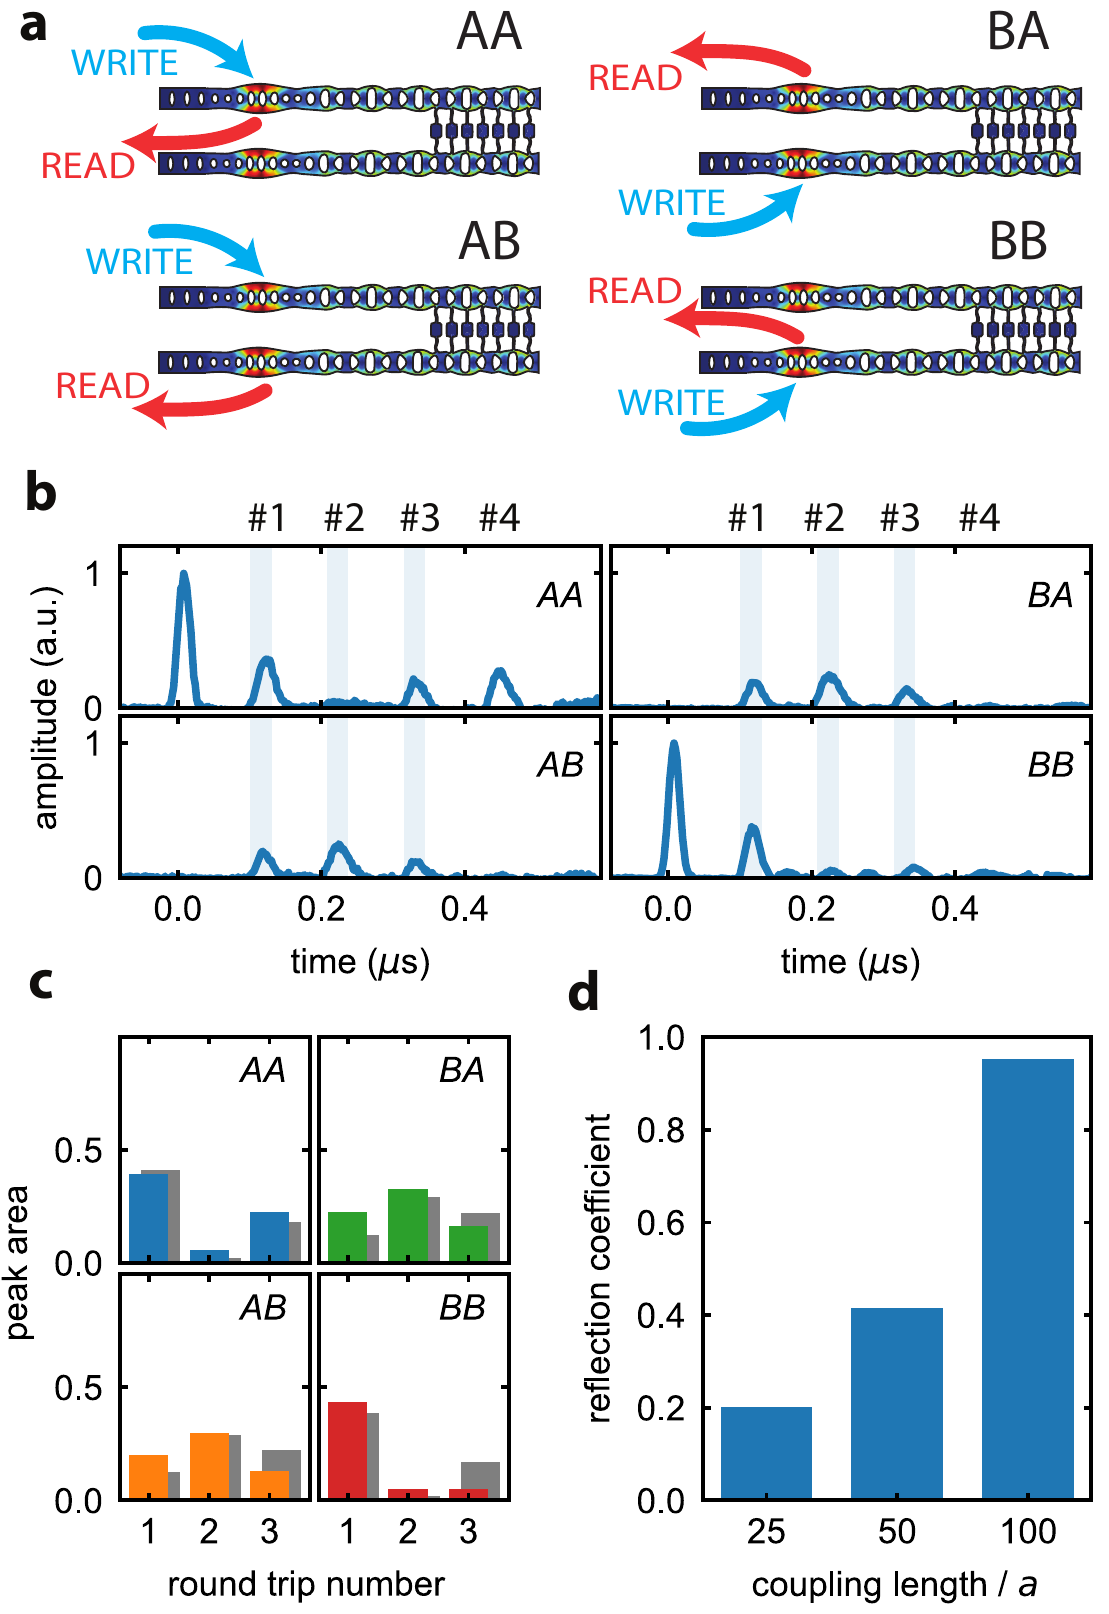
To measure the phonon occupancy inside the cavities A and B, we again use a continuous-wave laser, red-detuned by the mechanical frequency from the optical resonances. The results of the calibrated phononic population in the cavities over time are shown in Fig. 3b, for different combinations of exciting (first letter on the top right corner of each panel) and reading (second letter on the top right corner of each panel) cavities, as it is depicted in Fig. 3a – see SI .6 for more details. This device has a coupler length of 50 beam splitter unit cells, which from simulations corresponds to an approx. 50:50 beam splitter. As a result of the directional coupler, the excitation is then split between the two waveguides and reaches the cavities A and B after the first round trip, with a phase difference between the arms. Subsequently, at the second recombination on the beam splitter (second round-trip), the excitation travels to the opposite port with respect to the one excited initially. This is due to the fact that the phase difference between our phononic packets in the two arms remains constant while they travel through the waveguides [19]. Due the slight mismatch of the two waveguide-cavity systems and dispersions in the coupler region caused from the fabrication disorders, the amount of energy populating the opposite cavities is slightly different.
To extract the splitting ratio of the directional coupler, we calculate the (normalized) area under the mechanical wavepacket around the first, second, and third round-trip time, corresponding to the light-blue shaded area in Fig. 3b, for the indicated excitation and detection combinations (see SI .6 for more details). The corresponding integrated counts are shown in blue, orange, green and red color bars in Fig. 3c. To model these data, we use a transfer matrix approach, where the action of the directional coupler is described by a lossless beam splitter matrix , written in terms of a reflection coefficient and a transmission coefficient . Phonon losses are negligible to first order since the phononic lifetime is much longer than the round-trip time (see SI .3). The phonon population after passes through the directional coupler is then proportional to , where the factor , with , takes into account losses and dispersion mismatch. A more accurate description of these terms would require modeling of the time dynamics with a multi-mode coupled-mode theory, which goes beyond the scope of this work. We then perform a global fitting procedure, where we impose to satisfy the reciprocity condition. The result of the fit is shown in grey color bars in Fig. 3c, from which we extract a reflection coefficient . We repeat the same measurements for two different lengths of the coupling region (see SI S5) and extract the corresponding reflection coefficient. The results are shown in Fig. 3d, which clearly shows an increase of the reflection as the coupling length is increased. Importantly, these results show that our design allows to engineer phononic beam splitters with arbitrary splitting ratios.
Single phonon splitting
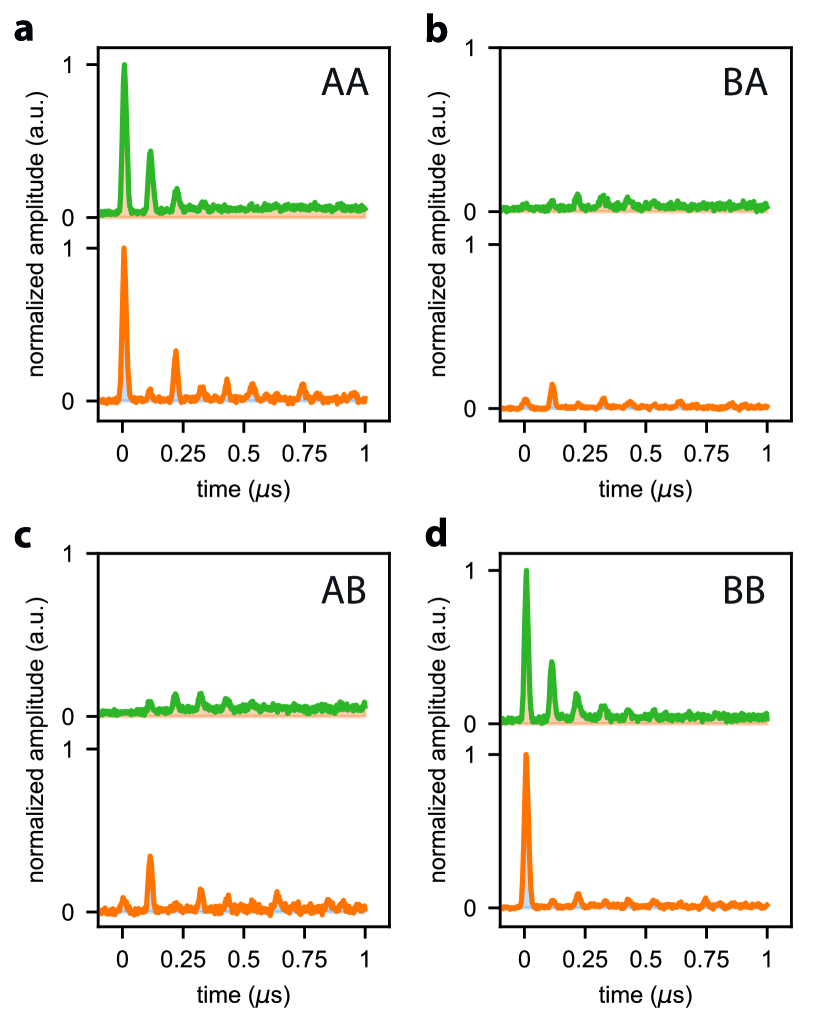
Testing the response of our directional coupler to quantized excitations with single phonon wavepackets is a critical demonstration of its potential use for quantum applications. In order to create a single phonon, we use “write” laser pulses, blue-detuned by the central mechanical frequency () from the optical resonances. This process can be described by a two-mode squeezed optomechanical interaction and detecting the Stokes scattered photon with a superconducting nanowire single photon detector (SNSPD), allows us to project the mechanical state of the optomechanical cavity onto a single phonon state [20]. This single phonon travels through the waveguide and either returns to the same cavity upon reflection, or goes to the opposite cavity after transmission in the coupling region. We then convert the mechanical state of each cavity to an optical photon, by sending “read” laser pulses red-detuned by the same mechanical frequency from the optical cavities. This addresses a state swap optomechanical interaction resulting into anti-Stokes scattered photons. The time delay between the write and read pulses is set around the first round trip of the phononic wavepacket. We calculate the second order cross-correlation between the Stokes and anti-Stokes scattered photons for different combinations of exciting and reading cavities A and B, similarly to [20].
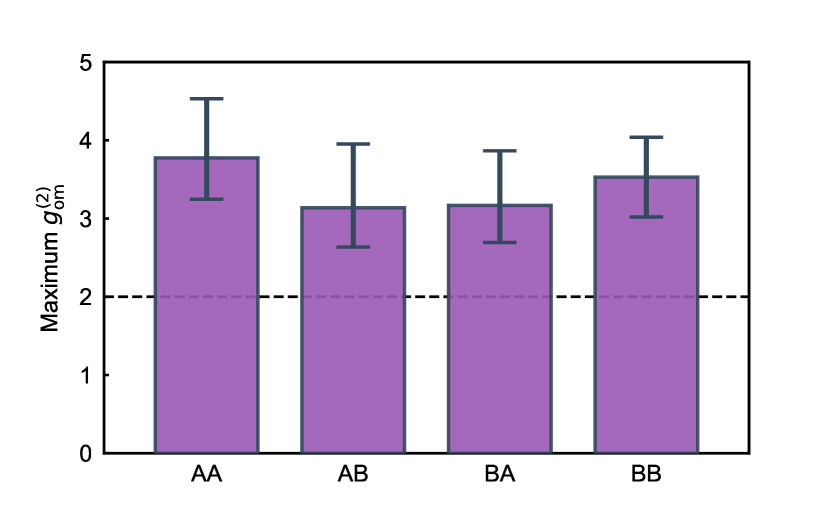
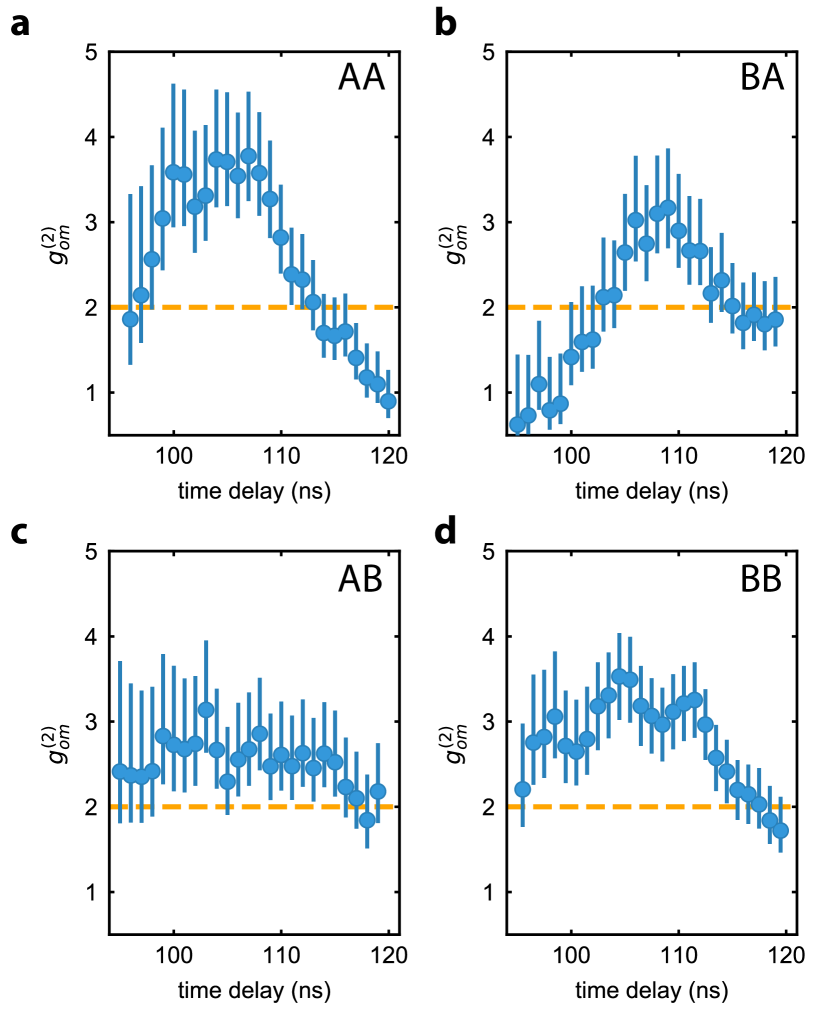
We use pulse energies of for write (Stokes) and for read (anti-Stokes) process, corresponding to a Stokes scattering probability of () and an anti-Stokes scattering probability of () for cavity A (B). At these low pulse energies, the thermal occupation of the cavities caused by heating of the lasers is negligible ( for all measurements configuration, see SI .4). We measure values of , , and (first index indicating the write cavity and second index the read cavity), which is plotted in Fig. 4. For each configuration the value is more than two standard deviations above the classical threshold of 2, unambiguously showing the non-classical behavior of the single phonon states measured in the different cavities after the excitations passed through the phononic beam splitter and either return back to the same cavity or travel to the opposite one. For more details on the experimental setup we refer to SI .7 and SI .5.
Conclusion
In conclusion, we have demonstrated an integrated directional coupler for GHz phonons – a crucial component for phononic integrated circuits [33]. Our demonstration is based on the development of the first integrated circuit involving single-phonon sources, detectors and single-mode waveguides, and we use it to demonstrate a beam splitter for both classical and quantum mechanical states. Due to the millisecond-long lifetime of phonons in these structures, as well as the ease of scalability, our device can be readily extended to build multi-mode interferometers of large dimensions, suitable for mechanical boson sampling and, more generally, for linear mechanical quantum computing [2, 17].
Through further development, piezo-electric materials can be included in our mechanical structure [34, 11], enabling electro-mechanical integrated devices such as, for example, phononic phase shifters [35]. With this powerful new tool at hand, a new paradigm of phononic devices can be realized, including mechanical Mach-Zender interferometers for sensing, switches for routing, and power multiplexers, to name a few, in addition to other more versatile mechanical counterparts of existing photonic technologies [36].
Additionally, using piezo-electric resonators, strong interactions between highly-confined GHz phonons and superconducting qubits can be engineered [9]. Moreover, the small mode-volume of highly confined phonons achieved with our design, allows engineering interactions with nanometer-scale quantum system, such as quantum dots [37] and color centers. Therefore, our directional coupler opens up exciting perspectives for hybrid quantum networks, enabling direct entanglement generation between distinct quantum systems without requiring entanglement swapping. We envision a platform with several quantum resources linked and combined together through mechanical quantum channels, taking advantage of the best performances of each individual technology. The strong lateral confinement of the propagating modes, allows our devices to establish a direct analogy with photonic integrated circuits, and therefore paves the way towards the new field of integrated quantum phononics.
Acknowledgments
Acknowledgements.
We would like to thank the Kavli Nanolab Delft for nanofabrication assistance. This work is financially supported by the European Research Council (ERC CoG Q-ECHOS, 101001005) and is part of the research program of the Netherlands Organization for Scientific Research (NWO), supported by the NWO Frontiers of Nanoscience program, as well as through a Vrij Programma (680-92-18-04) grant.Conflict of interests: The authors declare no competing interests.
Author contributions: A.Z., L.S., N.F. and S.G. devised and planned the experiment. A.Z., N.F, M.J., R.B. simulated and designed the device. A.Z. and L.S. fabricated the sample, A.Z., L.S. and N.F. built the setup and performed the measurements. A.Z., L.S., and S.G. analyzed the data and wrote the manuscript with input from all authors. E.V. and S.G. supervised the project.
Data Availability: Source data for the plots will be made available on Zenodo.
References
- F. Arute et al. [2019] F. Arute et al., Quantum supremacy using a programmable superconducting processor, Nature 574, 505 (2019).
- Zhong et al. [2020] H.-S. Zhong, H. Wang, Y.-H. Deng, M.-C. Chen, L.-C. Peng, Y.-H. Luo, J. Qin, D. Wu, X. Ding, Y. Hu, P. Hu, X.-Y. Yang, W.-J. Zhang, H. Li, Y. Li, X. Jiang, L. Gan, G. Yang, L. You, Z. Wang, L. Li, N.-L. Liu, C.-Y. Lu, and J.-W. Pan, Quantum computational advantage using photons, Science 370, 1460 (2020).
- Ren et al. [2017] J.-G. Ren, P. Xu, H.-L. Yong, L. Zhang, S.-K. Liao, J. Yin, W.-Y. Liu, W.-Q. Cai, M. Yang, L. Li, K.-X. Yang, X. Han, Y.-Q. Yao, J. Li, H.-Y. Wu, S. Wan, L. Liu, D.-Q. Liu, Y.-W. Kuang, Z.-P. He, P. Shang, C. Guo, R.-H. Zheng, K. Tian, Z.-C. Zhu, N.-L. Liu, C.-Y. Lu, R. Shu, Y.-A. Chen, C.-Z. Peng, J.-Y. Wang, and J.-W. Pan, Ground-to-satellite quantum teleportation, Nature 549, 70 (2017).
- Wallquist et al. [2009] M. Wallquist, K. Hammerer, P. Rabl, M. Lukin, and P. Zoller, Hybrid quantum devices and quantum engineering, Phys. Scr. T137, 014001 (2009).
- Kurizki et al. [2015] G. Kurizki, P. Bertet, Y. Kubo, K. Mølmer, D. Petrosyan, P. Rabl, and J. Schmiedmayer, Quantum technologies with hybrid systems, Proc. Natl. Acad. Sci. 112, 3866 (2015).
- Kimble [2008] H. J. Kimble, The quantum internet, Nature 453, 1023 (2008).
- Delsing et al. [2019] P. Delsing et al., The 2019 surface acoustic waves roadmap, J. Phys. D: Appl. Phys. 52, 353001 (2019).
- Barzanjeh et al. [2022] S. Barzanjeh, A. Xuereb, S. Gröblacher, M. Paternostro, C. A. Regal, and E. M. Weig, Optomechanics for quantum technologies, Nature Physics 18, 15 (2022).
- Mirhosseini et al. [2020] M. Mirhosseini, A. Sipahigil, M. Kalaee, and O. Painter, Superconducting qubit to optical photon transduction, Nature 588, 599 (2020).
- Jiang et al. [2020] W. Jiang, C. J. Sarabalis, Y. D. Dahmani, R. N. Patel, F. M. Mayor, T. P. McKenna, R. Van Laer, and A. H. Safavi-Naeini, Efficient bidirectional piezo-optomechanical transduction between microwave and optical frequency, Nature Commun. 11, 1166 (2020).
- Weaver et al. [2023] M. J. Weaver, P. Duivestein, A. C. Bernasconi, S. Scharmer, M. Lemang, T. C. v. Thiel, F. Hijazi, B. Hensen, S. Gröblacher, and R. Stockill, An integrated microwave-to-optics interface for scalable quantum computing, Nature Nanotechnol. 10.1038/s41565-023-01515-y (2023).
- Fogliano et al. [2021] F. Fogliano, B. Besga, A. Reigue, L. Mercier de Lépinay, P. Heringlake, C. Gouriou, E. Eyraud, W. Wernsdorfer, B. Pigeau, and O. Arcizet, Ultrasensitive nano-optomechanical force sensor operated at dilution temperatures, Nature Commun. 12, 4124 (2021).
- Bienfait et al. [2019] A. Bienfait, K. J. Satzinger, Y. P. Zhong, H.-S. Chang, M.-H. Chou, C. R. Conner, E. Dumur, J. Grebel, G. A. Peairs, R. G. Povey, and A. N. Cleland, Phonon-mediated quantum state transfer and remote qubit entanglement, Science 364, 368 (2019).
- Bienfait et al. [2020] A. Bienfait, Y. P. Zhong, H. S. Chang, M. H. Chou, C. R. Conner, Dumur, J. Grebel, G. A. Peairs, R. G. Povey, K. J. Satzinger, and A. N. Cleland, Quantum Erasure Using Entangled Surface Acoustic Phonons, Phys. Rev. X 10, 21055 (2020).
- McNeil et al. [2011] R. P. G. McNeil, M. Kataoka, C. J. B. Ford, C. H. W. Barnes, D. Anderson, G. A. C. Jones, I. Farrer, and D. A. Ritchie, On-demand single-electron transfer between distant quantum dots, Nature 477, 439 (2011).
- Zivari et al. [2022a] A. Zivari, R. Stockill, N. Fiaschi, and S. Gröblacher, Non-classical mechanical states guided in a phononic waveguide, Nature Phys. 18, 789 (2022a).
- Qiao et al. [2023] H. Qiao, É. Dumur, G. Andersson, H. Yan, M.-H. Chou, J. Grebel, C. Conner, Y. Joshi, J. Miller, R. Povey, et al., Splitting phonons: Building a platform for linear mechanical quantum computing, Science 380, 1030 (2023).
- Wallucks et al. [2020] A. Wallucks, I. Marinković, B. Hensen, R. Stockill, and S. Gröblacher, A quantum memory at telecom wavelengths, Nat. Phys. 16, 772 (2020).
- Zivari et al. [2022b] A. Zivari, N. Fiaschi, R. Burgwal, E. Verhagen, R. Stockill, and S. Gröblacher, On-chip distribution of quantum information using traveling phonons, Sci. Adv. 8, eadd2811 (2022b).
- Riedinger et al. [2016] R. Riedinger, S. Hong, R. A. Norte, J. A. Slater, J. Shang, A. G. Krause, V. Anant, M. Aspelmeyer, and S. Gröblacher, Non-classical correlations between single photons and phonons from a mechanical oscillator, Nature 530, 313 (2016).
- Hong et al. [2017] S. Hong, R. Riedinger, I. Marinković, A. Wallucks, S. G. Hofer, R. A. Norte, M. Aspelmeyer, and S. Gröblacher, Hanbury Brown and Twiss interferometry of single phonons from an optomechanical resonator, Science 358, 203 (2017).
- Riedinger et al. [2018] R. Riedinger, A. Wallucks, I. Marinković, C. Löschnauer, M. Aspelmeyer, S. Hong, and S. Gröblacher, Remote quantum entanglement between two micromechanical oscillators, Nature 556, 473 (2018).
- Marinković et al. [2018] I. Marinković, A. Wallucks, R. Riedinger, S. Hong, M. Aspelmeyer, and S. Gröblacher, An optomechanical Bell test, Phys. Rev. Lett. 121, 220404 (2018).
- Fiaschi et al. [2021] N. Fiaschi, B. Hensen, A. Wallucks, R. Benevides, J. Li, T. P. M. Alegre, and S. Gröblacher, Optomechanical quantum teleportation, Nature Photon. 15, 817 (2021).
- Knill et al. [2001] E. Knill, R. Laflamme, and G. J. Milburn, A scheme for efficient quantum computation with linear optics, Nature 409, 46 (2001).
- Wang et al. [2020] J. Wang, F. Sciarrino, A. Laing, and M. G. Thompson, Integrated photonic quantum technologies, Nat. Photonics 14, 273 (2020).
- Liu et al. [2023] X. Liu, A. W. Bruch, and H. X. Tang, Aluminum nitride photonic integrated circuits: from piezo-optomechanics to nonlinear optics, Adv. Opt. Photonics 15, 236 (2023).
- Wang et al. [2023] Y. Wang, J. A. Holguín-Lerma, M. Vezzoli, Y. Guo, and H. X. Tang, Photonic-circuit-integrated titanium: sapphire laser, Nat. Photonics 17, 338 (2023).
- Fang et al. [2016] K. Fang, M. H. Matheny, X. Luan, and O. Painter, Optical transduction and routing of microwave phonons in cavity-optomechanical circuits, Nature Photon. 10, 489 (2016).
- Patel et al. [2018] R. N. Patel, Z. Wang, W. Jiang, C. J. Sarabalis, J. T. Hill, and A. H. Safavi-Naeini, Single-mode phononic wire, Phys. Rev. Lett. 121, 040501 (2018).
- Madiot et al. [2023] G. Madiot, R. C. Ng, G. Arregui, O. Florez, M. Albrechtsen, S. Stobbe, P. D. García, and C. M. Sotomayor-Torres, Optomechanical generation of coherent GHz vibrations in a phononic waveguide, Phys. Rev. Lett. 130, 106903 (2023).
- Weis et al. [2010] S. Weis, R. Rivière, S. Deléglise, E. Gavartin, O. Arcizet, A. Schliesser, and T. J. Kippenberg, Optomechanically Induced Transparency, Science 330, 1520 (2010).
- Fu et al. [2019] W. Fu, Z. Shen, Y. Xu, C.-L. Zou, R. Cheng, X. Han, and H. X. Tang, Phononic integrated circuitry and spin–orbit interaction of phonons, Nature Commun. 10, 2743 (2019).
- Jiang et al. [2023] W. Jiang, F. M. Mayor, S. Malik, R. Van Laer, T. P. McKenna, R. N. Patel, J. D. Witmer, and A. H. Safavi-Naeini, Optically heralded microwave photon addition, Nature Phys. 19, 1423 (2023).
- Taylor et al. [2022] J. C. Taylor, E. Chatterjee, W. F. Kindel, D. Soh, and M. Eichenfield, Reconfigurable quantum phononic circuits via piezo-acoustomechanical interactions, npj Quantum Inf. 8, 19 (2022).
- Tian et al. [2021] H. Tian, J. Liu, A. Siddharth, R. N. Wang, T. Blésin, J. He, T. J. Kippenberg, and S. A. Bhave, Magnetic-free silicon nitride integrated optical isolator, Nat. Photon. 15, 828 (2021).
- Spinnler et al. [2023] C. Spinnler, G. N. Nguyen, Y. Wang, M. Erbe, A. Javadi, L. Zhai, S. Scholz, A. D. Wieck, A. Ludwig, P. Lodahl, L. Midolo, and R. J. Warburton, A quantum dot coupled to a suspended-beam mechanical resonator: from the unresolved- to the resolved-sideband regime, arXiv:2311.05353 (2023).
- Chan et al. [2012] J. Chan, A. H. Safavi-Naeini, J. T. Hill, S. Meenehan, and O. Painter, Optimized optomechanical crystal cavity with acoustic radiation shield, App. Phys. Lett. 101, 081115 (2012).
Supplementary Information
.1 Simulation
In Fig. S1, we show the mechanical simulation of the whole structure and the calculated optomechanical single photon coupling rate for different symmetric and anti-symmetric supermodes. The mechanical spectrum is a series of Fabry-Pérot modes, equally spaced by , given by the hybridization of the single mode of the cavity with the series of modes supported by the free-ending waveguide. Each Fabry-Pérot mode is split by into a doublet due to the mechanical coupling between the two waveguides. The mode profiles corresponding to one of the doublets are shown in green and red boxes in Fig. S1. Note that these simulations use a shorter device length compared to the measured device, for faster computational run-times, which results in different and .
.2 Fabrication
The device is fabricated from a silicon-on-insulator (SOI) wafer with a thick silicon device layer on top of of buried oxide. We use electron beam lithography to pattern the structure and transfer the mask with a dry HBr/Ar plasma etch. After processing, the chip is diced in order to access the device’s optical waveguide with a lensed fiber in the dilution refrigerator. We then remove any remaining resist using Dimethylformamide. Finally, the device is cleaned with a piranha solution and released using a 40% hydrofluoric acid (HF) wet etch to remove the buried oxide layer [20]. In order to minimize oxidation, the device is immediately transferred into the dilution refrigerator.
Since we use a wet etch process to undercut the samples, we need to have very robust nanostructure. To achieve this, we use a thin (50 nm wide) tether to connect the central optical waveguide (shared between the two cavities) and the optomechanical resonators. We report that using two sets of clamps on the optical waveguide (spaced by ) without the tether gives a yield of 70%. We report no significant changes in the mechanical spectrum with or without the thin tether.
.3 Lifetime
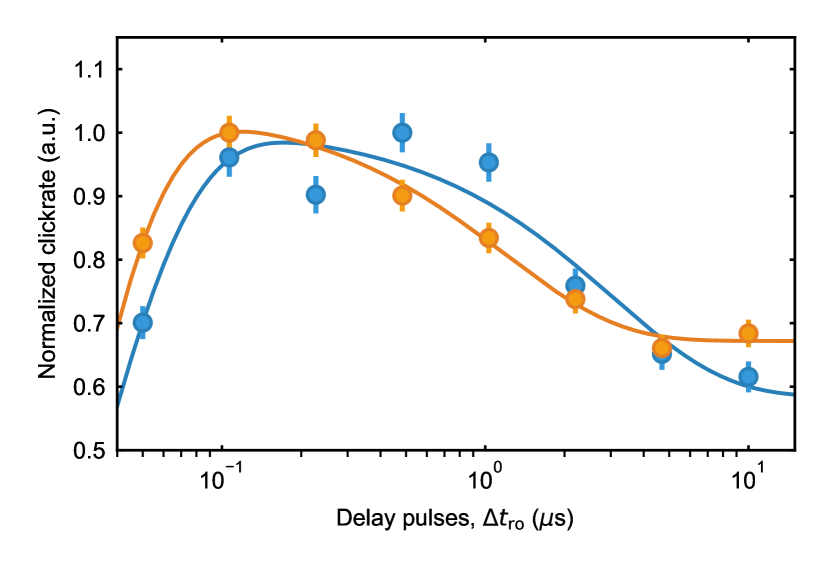
In order to measure the mechanical lifetime of our devices, we send a sequence of two red-detuned pulses with varying delays . The first one is a strong pulse, used to heat our device through residual optical absorption, creating a large thermal population in the mechanical mode. The second pulse is weaker, allowing us to read the mechanical population after a variable delay from the first pulse. The results are shown in Fig. S2 for both devices (A in blue and B in orange). As previously studied, the curves follow a double exponential decay [18]. We measure values of and for cavity A and B, respectively. These values are much longer than the typical round-trip time of the phononic wavepackets. They can be increased to several ms by adding additional phononic shield periods both at the waveguides’ support part and the left end of the mirror side (blue part in Fig. 1e), and values up to have been reported previously [38, 16, 19]. We intentionally design and choose a device with short mechanical lifetime to increase the repetition rate of the experiment. The rise in the thermal population for short delays () is given by the delayed absorption [20].
.4 Thermal occupation of mechanical state
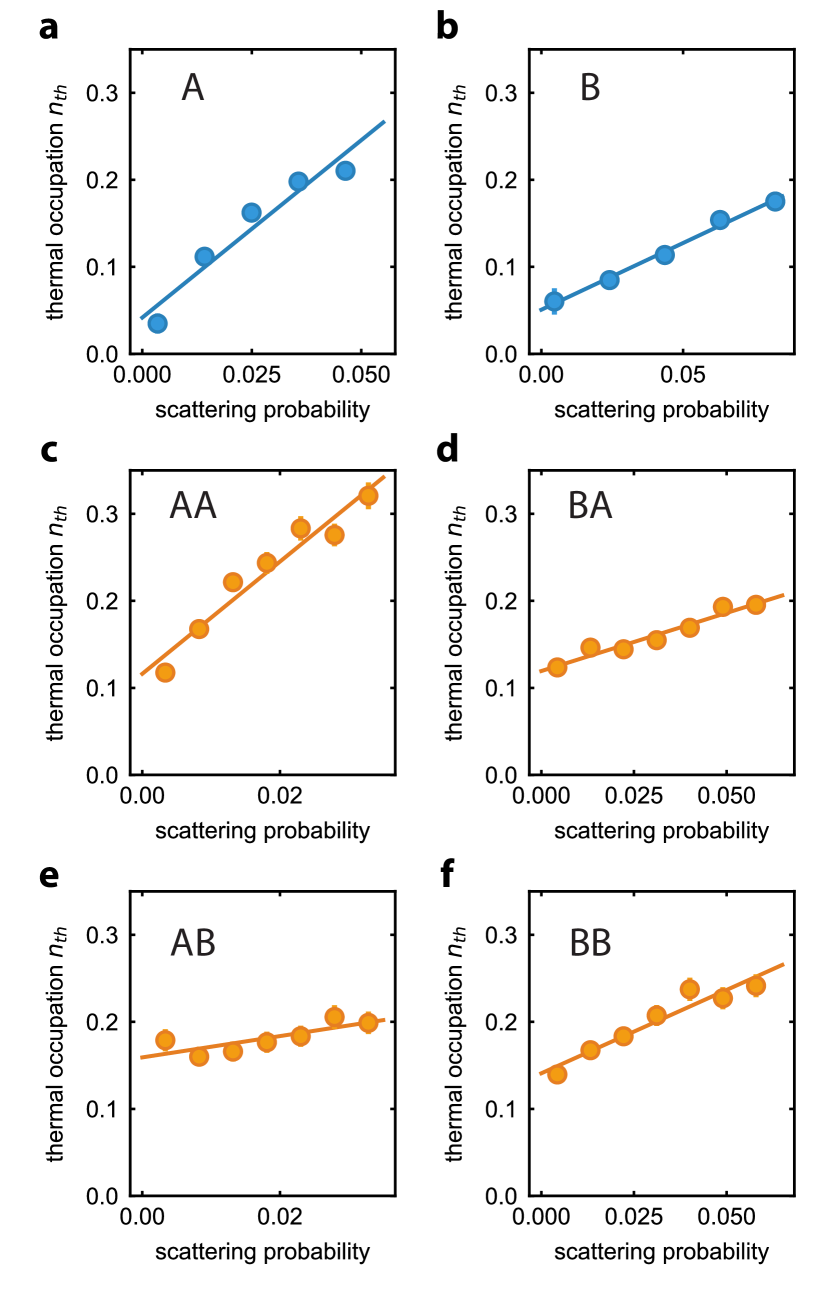
The GHz mechanical excitations have in principle a thermal occupation of at mK temperatures. However, due to optical absorption of the pump laser in the device, a thermal mechanical population inside the cavity is created, and thus the thermal occupation of the mechanical mode is typically significantly higher. We measure the equivalent thermal occupation of the mechanical mode using the sideband thermometry technique [20, 19, 16]. In particular, we send alternating blue-detuned and red-detuned pulses with equal energies (equal scattering probability), and use the click rates measured from both pulses to obtain the thermal occupation at the mode of interest [20]. We repeat this measurement with different pulse energies (varying the scattering probability). In this way we measure the amount of heating and thermal occupation induced by one single pulse in different cavities. The results are shown in Fig. S3a for device A and Fig. S3b for device B. Furthermore, we measure the thermal occupation in a two pulse sequence scheme, as it is used in our final experiment (see Fig. 4), using the same technique with an additional red-detuned pre-pulse, before the pulses used to measure the thermal occupation. This red-detuned pre-pulse is used to mimic the heating of the blue pulse in the experiment. In this measurement we keep the energy of the sideband asymmetry pulses constant and equal to the value that we use in the actual experiment (, scattering probabilities () for cavity A (B)), and only vary the energy of the pre-pulse. We repeat this measurement in different combinations of sending the pre-pulse to a cavity (A or B) and measure the thermal occupation of one of the cavities (A or B). The results for different combinations are shown in Fig. S3c-f. These measurements show that by sending a pulse to one cavity, not only do we heat that cavity, but some of the thermal energy also heats the other cavity through the beam splitter. This is clearly visible from the linear increase of the thermal population with the scattering probability of the pre-pulse and by the higher thermal population compared to the single pulse case (as in Fig. S3a and b). Note that, since the cavities have optical resonances spaced by much more than the optical linewidth and the mechanical frequencies of interested, the optical pulses that address one cavity does not interact at all with the other, causing no direct heating. For the pulse energies used in the actual experiment, we measure , , and .
.5 Setup
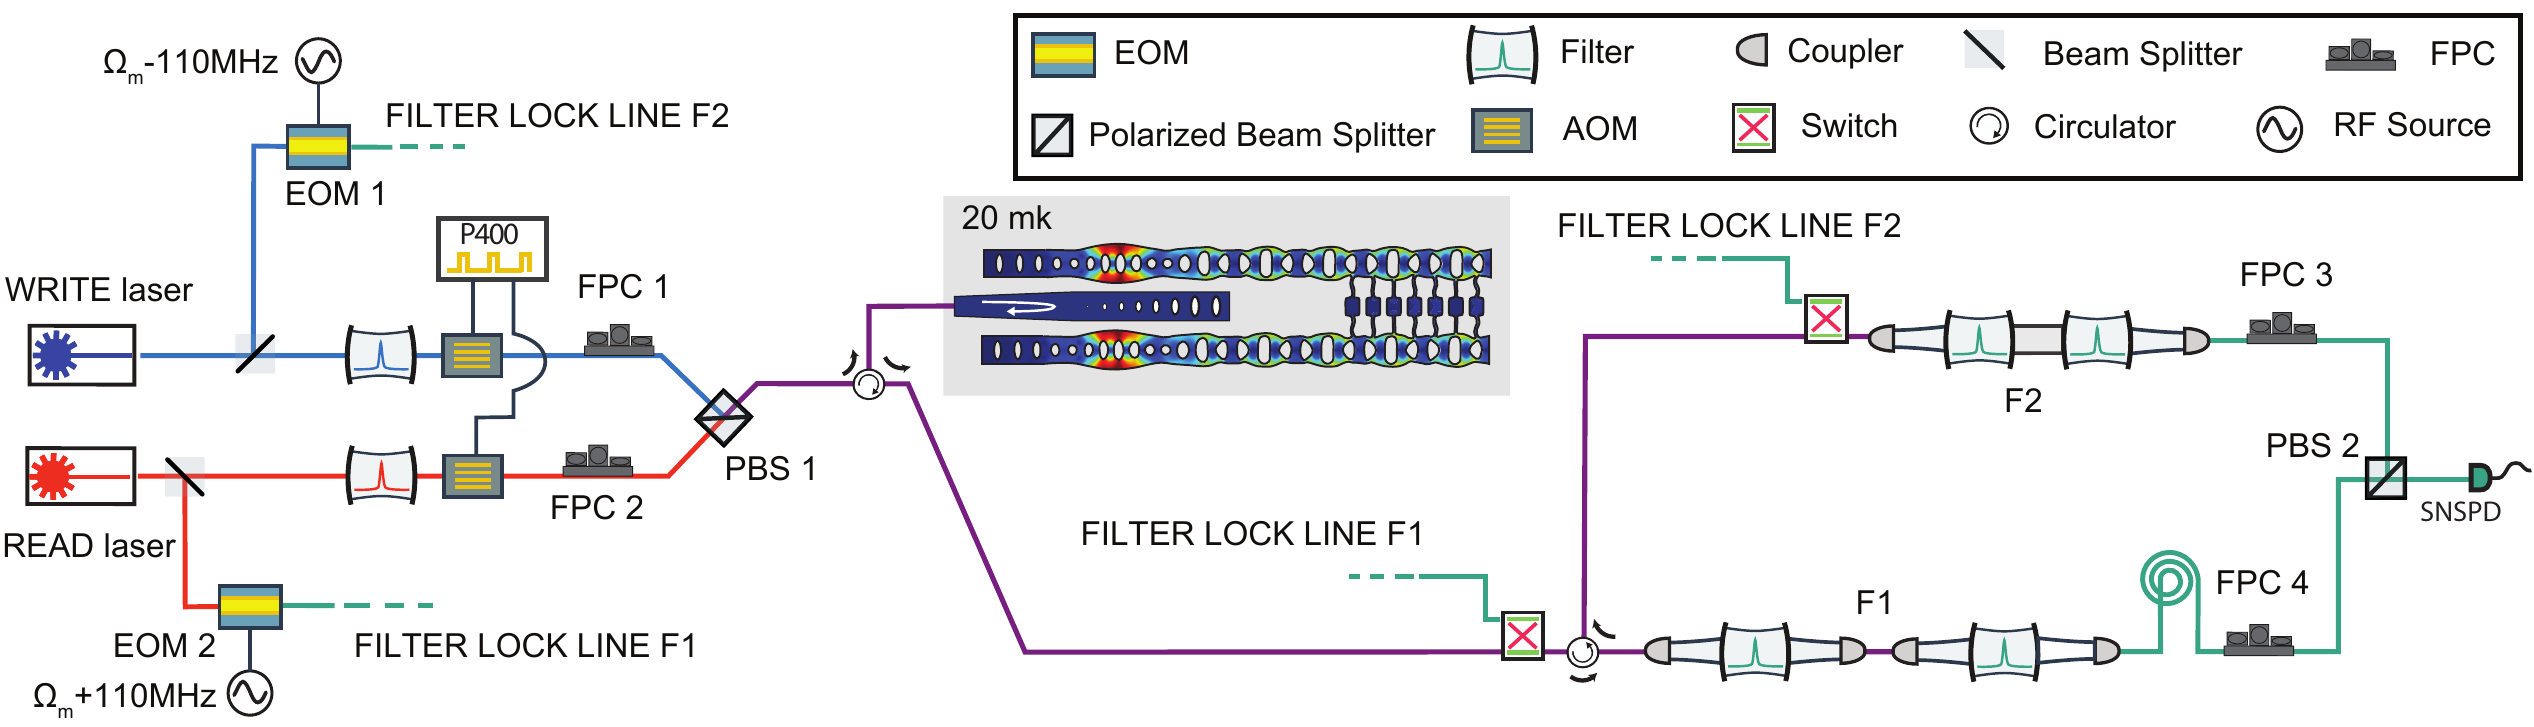
A sketch of the experimental setup is depicted in Fig. S4. We use two continuous-wave lasers for write and read operations, whose frequencies are locked using feedback from a wavelength meter. We then filter the GHz noise of the lasers using fiber filters. Both lasers are pulsed by gating acousto-optic modulators (AOMs) with a digital pulse generator (P400). The two lines are combined on a polarized beam splitter (PBS1), and we use fiber polarization controllers (FPCs) on each line to maximize transmission through PBS1. After combination, the pulses are sent into a lensed fiber at the mixing chamber of the dilution refrigerator, coupling the optical fields into the device. The coupling efficiency from the fiber to the central optical waveguide (yellow part in Fig. 1e) is . The reflected light from the device is routed to free-space filter cavities (F1 and F2) using a circulator, in order to filter the write and read pump pulses with suppression ratio of for F1 and for F2. The efficiency of the filter setup for the Stokes and anti-Stokes scattered photons is . When we write on one device and read the same (AA or BB combinations), using one filter cavity (F1) suffices for our detection. However, when we write on one device and read the opposite device (AB or BA combinations), we need to use both filter setups (F1 and F2), since the devices have resonances at different wavelengths. In this scheme, F1 is locked on resonance of one device (A or B) while F2 is locked to the other resonance (B or A). The anti-Stokes optomechanically scattered photon from the read pulse passes through F1, while all the pumps and the Stokes photon are reflected back into fiber. The light is routed to F2 using a circulator which suppresses all pump fields and only allows the Stokes photon to pass. Every the measurement is paused and locking lasers are sent to the cavities to lock them simultaneously. We use two EOMs to create sidebands at the resonances wavelengths using light from the read laser and from the write laser to lock F1 and F2, respectively. We merge both signals from F1 and F2 on a polarizing beam splitter (PBS), and use FPCs to maximize transmission of each signal through the PBS. We send the output of PBS to a SNSPD installed on the quasi stage of our dilution refrigerator. Since the filters are being locked to two different wavelengths, we observe relatively high leakage from the pump lasers of opposite wavelength – the write laser pump leaks through F1 and the read laser pump leaks through F2. This is because the suppression of the filter setup depends heavily on the detuning between the filter resonances and the laser wavelength. Given the (fixed) free spectral range of the filter cavities, the opposite laser can have a smaller detuning and so smaller suppression compared to the laser used to lock the cavity. We found that, for the cavities and wavelengths used in the experiments, the leakage through F1 of the write laser is clicks on repetition (approximately 3 times higher than the clickrate from the write pulse passing through F2), and the ones from F2 of the read laser are clicks on repetition (approximately 1/3 of the clickrate from the read pulse passing through F1). In order to temporally distinguish between the leakage of the pump lasers and the actual Stokes and anti-Stokes scattered photons coming out of the filter setup outputs, we delay the signal of F1 (the one we use for reading) by . In this way, the leakages are spaced in time from the Stokes and anti-Stokes photons more than the recovery time of the SNSPDs, and they do not affect the measurement results.
.6 Coherent drive measurement
For the coherent drive measurement, we first gather the click rates given by our quasi-continuous red-detuned read laser. Because of the optical absorption of the device, the reading laser creates some thermal occupation in the cavity as well. To independently calibrate this background and measure only the coherent population of our cavities, we run a measurement with the same reading power on both cavities, without the coherent excitation pulse. This gives us the thermal background induced by the reading laser, which we then subtract from the original data. In order to calculate the normalized phononic population, we first normalize the click rates by the maximum click rates we get from the excitation pulse (the peak at zero time delay). We also normalize the click rates with the optomechanical coupling rate , as well as the extrinsic optical couplings of each cavity. In this way, we normalize the phononic population with the phononic excitation and read-out efficiency.
The measurements for devices with 25 and 100 unit cells in the beam splitter are shown in Fig. S5 for different exciting and reading combinations. As can be clearly seen, the 25 unit cell device (green) shows behavior of a transmissive beam splitter, whereas the 100 unit cell device (orange) of a beam splitter with almost reflectivity. This behavior follows our simulations very closely. The decay in the overall population is mainly caused by dispersion of the waveguides and beam splitters, coming from fabrication disorders, as well as residual phononic dissipation.
.7 Two photon cross correlation versus time
In order to measure the two photon cross correlation of the phononic wavepackets, we use a technique similar to [16] to filter out coincidences in time with finer resolution. This allows us to obtain the time domain behavior of the phononic packet. The results for different combinations of the excite and read cavities are shown in Fig. S6. The correlation value increases from uncorrelated (1) or classical correlation (2) to non-classical (2) value as the phononic wavepacket returns back to the optomechanical cavity, and again drops down to classical correlation (2) and eventually uncorrelated values as the packet leave the cavity to the phononic waveguide again.