Collaboration or Corporate Capture? Quantifying NLP’s Reliance on Industry Artifacts and Contributions
Abstract
The advent of transformers, higher computational budgets, and big data has engendered remarkable progress in Natural Language Processing (NLP). Impressive performance of industry pre-trained models has garnered public attention in recent years and made news headlines. That these are industry models is noteworthy. Rarely, if ever, are academic institutes producing exciting new NLP models. Using these models is critical for competing on NLP benchmarks and correspondingly to stay relevant in NLP research. We surveyed 100 papers published at EMNLP 2022 to determine whether this phenomenon constitutes a reliance on industry for NLP publications.
We find that there is indeed a substantial reliance. Citations of industry artifacts and contributions across categories is at least three times greater than industry publication rates per year. Quantifying this reliance does not settle how we ought to interpret the results. We discuss two possible perspectives in our discussion: 1) Is collaboration with industry still collaboration in the absence of an alternative? Or 2) has free NLP inquiry been captured by the motivations and research direction of private corporations?
1 Introduction
Natural Language Processing (NLP) has seen rapid growth in recent years, attracting interest from large technology companies. Expediting the exploitation of emergent technologies is critical to industry success and this strategy has been applied to NLP, as is evident with the current influx of large language models (LLM), chatbots, and evaluation tools. These newfound business opportunities have brought industry to the forefront of NLP research. Industry presence in the Association of Computational Linguistics (ACL) Anthology has correspondingly increased 180% from 2017 to 2022 (Abdalla et al., 2023). The research community has taken notice: "industry races ahead of academia" was the top takeaway of the 2023 AI Index Report (Maslej et al., 2023) and 82% of NLP community survey respondents agreed with the statement "Industry will produce the most widely-cited research" (Michael et al., 2023). Public investment in AI has failed to keep up with industry. In 2021, Google’s funding of their subsidiary, DeepMind, alone surpassed the entirety of US non-military AI funding (Ahmed et al., 2023).
In parallel to increased industry presence, concerns have surfaced regarding the efficacy of research grounded on general purpose benchmark evaluation. Raji et al. (2021) note that widely-cited Natural Language Understanding (NLU) datasets used to verify general understanding of language models are subject to scope and subjectivity limitations. Despite these documented flaws, performance on held-out benchmark test sets is still the de facto standard used to establish publication validity (72% of our surveyed papers relied on them — § 3.2). Benchmark test sets favour institutes with higher computational budgets, since higher scores can sometimes be achieved via sheer computational power (Dodge et al., 2019).
If the NLP community requires state-of-the-art (SOTA) benchmark performance to publish in top venues and if competing on such benchmarks favours those with more computing power (Dodge et al., 2019; Rogers, 2020), those with smaller budgets may find little room for contribution without relying on industry. This study explores to what extent collaboration has become a necessity, and at what point these collaborative relationships signify coroporate capture.
We surveyed and collected metadata on 100 EMNLP 2022 papers to quantify the NLP community’s reliance on industry artifacts and contributions. We find that across types of cited artifacts and contributions, the percentage of them that are industry affiliated is substantially higher than what would be expected relative to the collective ACL Anthology (Figure 1, § 4.1). Furthermore, the trend of industry affiliation has increased in recent years, culminating in the majority of all types of citations we recorded from 2022 being industry affiliated despite only 13.3% of papers published that year having industry affiliation.
Our goal with this paper is to inform and disseminate resources to facilitate discourse regarding industry presence in NLP, and to discuss how viewpoints expressed in the existing literature might frame our findings with respect to the health of the AI research ecosystem.
Along with determining the degree of reliance on industry we designed our EMNLP 2022 survey to address the following research questions:
-
1.
What proportion of papers have industry affiliation? (§ 3.1)
-
2.
Are benchmark-pushing papers dominant? What other types of papers are being published and are their distributions different between academia and industry? (§ 3.2)
-
3.
Do industry and academia follow best publishing practices to the same degree (i.e., statistical significance testing and publishing code)? (§ 3.4)
-
4.
To what degree are publications reliant on citations from industry? (§ 4.1)
-
5.
For new SOTA papers, by how much are industry and academia improving over the prior best? (§ 4.2)
-
6.
Are academia and industry predisposed to citing papers from their own institute type? (§ 4.3)
The remainder of this paper is divided into related works (§ 2), survey methods (§ 3), results from analyzing the survey data (§ 4), and a corresponding discussion (§ 5). The survey and analysis code are available (for research purposes only) at https://github.com/Will-C-Aitken/collaboration-or-corporate-capture.
2 Related Works
2.1 Industry & Scientific Research
Undoubtedly, there are benefits to the presence of and increased collaboration with industry sponsors. Gulbrandsen and Smeby (2005) found that industry-funded academics have higher publication productivity and that their funding sources enable them to examine both more novel and more interesting research topics. The outputs of industry-funded science are often more application focused and the well-defined design rules associated with this line of research need not be considered any less epistemically virtuous than a more theoretical approach (Wilholt, 2006). In general, Holman (2021) remarks that policy research tends to favour academia-industry ties while philosophy of science literature is more likely to condemn them.
The ideal of value-free science is largely considered unrealistic in the philosophy of science community; some degree of bias is inevitable (Wilholt, 2009). Nevertheless, some works propound that certain types of bias resulting from industry-influence are distinguishable and epistemically deficient, namely preference bias constrained within the context of research community conventions (Wilholt, 2009) and sponsorship bias manifesting from using insufficient evidence to support dubious scientific claims (Reutlinger, 2020).
The proliferation of industry presence in AI research has also garnered internal criticism. Concerns regarding academic independence and integrity have been voiced by Abdalla and Abdalla (2021) and Whittaker (2021) by drawing parallels to tactics used by "Big Tobacco" and the US Military respectively to support their financial and political interests at the expense of public health and scientific transparency and soundness.
Supporting AI Ethics research has been described as a tactic used by tech firms to gain social capital and foster a favourable public image (Phan et al., 2022; Seele and Schultz, 2022). While this research can be beneficial this practice can also have negative consequences. Some examples are how industry funding of digital rights civil society organizations can result in misrepresentation of public interests (Goldenfein and Mann, 2023) and how corporate capture of the ACM Fairness, Accountability, and Transparency (FAccT) conference led to conflicts of interest in the peer-review process (Young et al., 2022).
2.2 Benchmark Critiques
The acceptance of a paper titled "What Will it Take to Fix Benchmarking in Natural Language Understanding" (Bowman and Dahl, 2021) to NAACL 2020 is strongly indicative of widespread benchmark dissent. The authors provide criteria that they believe future benchmarks should strive for. Raji et al. (2021) emphasize representative shortcomings of current benchmarks that are a product of illogical assumptions. Through a microeconomics lens, Ethayarajh and Jurafsky (2020) argue that benchmark leaderboards fail to adequately capture model utility. Despite its shortcomings, benchmarking remains pervasive because it makes model comparison, evaluation of results, and quantification of progress straightforward.
2.3 Computing Power
The resurgence of NLP in recent years can in part be attributed to increased computing power. Sharir et al. (2020) estimate the cost of training an 11B-parameter model (a modest size by today’s standards) to be well above $1.3 Million USD, a cost likely prohibitive in most academic settings. As a result, from 2010 to 2021, industry’s share of large AI models has increased from 11% to 96% (Ahmed et al., 2023).
The relationship of computing power to success in NLP has raised concerns regarding the de-democritization and monopolization of AI (Ahmed and Wahed, 2020; Luitse and Denkena, 2021). Via case studies, Dodge et al. (2019) critique benchmark reporting metrics for unfairly favouring those who have the capacity to run more experiments. The greater resources available in industry labs may give them this advantage. Our survey analyzes whether this advantage leads to more substantial benchmark improvements.
3 Survey
3.1 Affiliation
We randomly sampled 100 EMNLP 2022 papers from the main conference proceedings and classified their authors’ affiliations as either academia, non-profit, or industry. Government institutes were grouped with academia as both tend to serve the general public. Non-profits were self-reported as such and typically serve a subset of the public. Lastly, any for-profit institute that primarily serves private interests and shareholders was labelled as industry.
We then compressed the group of author’s affiliations into a single class. If all were from academia, the paper was labelled as such. If at least one affiliation was non-profit, the paper label was updated to non-profit. The same heuristic was used for industry with industry taking precedence over non-profit. Our rationale was that if even one author was from industry or a non-profit, the entire team would likely have access to the resources of that institute.
It should be noted that even when an author’s affiliation is academic this does not preclude them from having industry funding. We limited our analysis to affiliations explicitly stated in the paper’s authorship section and did not delve into acknowledgements or external CVs. Our analysis is therefore a lower bound on industry presence. The affiliation distribution of the surveyed papers is in Table 1.
| Academia | Non-Profit | Industry | Total | |
|---|---|---|---|---|
| Long | 45 | 5 | 37 | 87 |
| Short | 5 | 1 | 7 | 13 |
| Total | 50 | 6 | 44 | 100 |
Corroborating the trend in (Abdalla et al., 2023), 44% of the surveyed EMNLP 2022 papers have industry affiliations, up from 22% the previous year.
3.2 Type
We assigned each paper one or more type(s), most of which are self-explanatory. The type of paper can alternatively be thought of as the contribution(s) the authors are using to argue that their work is worthy of publication. Unique Setting SOTA is distinct from All-Time in that the authors are only looking at a constrained version of a dataset/benchmark. Examples include zero/few-shot, parameter-efficient tuning, and out-of-distribution robustness. Interpretability & Analysis papers dissect a pre-existing work or method to uncover additional insights. Split by institute type, Table 2 presents the types of papers surveyed.
| Type | Academia | Non-Profit | Industry | Total |
|---|---|---|---|---|
| Unique Setting SOTA | 18 | 4 | 16 | 38 |
| All-Time SOTA | 18 | 0 | 16 | 34 |
| New Dataset | 10 | 1 | 15 | 26 |
| Interpretability & Analysis | 11 | 1 | 5 | 17 |
| New Pre-Trained Model | 2 | 0 | 5 | 7 |
| New Metric | 1 | 0 | 5 | 6 |
| Ethics | 2 | 0 | 1 | 3 |
Despite widespread criticism, performance on benchmarks remains critical to publishing in top venues with 72 of the 100 papers claiming SOTA results. Academia slightly favours Interpretability & Analysis over New Datasets and the converse is true for industry. Bowman and Dahl (2021) detail the prohibitive cost of compiling and annotating an NLP dataset, likely making it a more viable endeavour for an industry budget. Likewise, industry produced over twice as many new Pre-Trained Models (PTMs). Academia focuses more on Interpetability & Analysis work—an inherently computationally conservative research direction.
Despite resource constraints, academia and industry published near identical quantities of both types of SOTA papers. One might expect the restricted environment of the Unique Setting to favour academia, both by limiting competition and possibly reducing computational requirements (e.g., parameter-efficient tuning), but this was not the case in our sample. A distinction between industry and academic SOTA advancements is, however, identifiable in terms of relative score improvement (see § 4.2).
3.3 Citations
Research is an iterative collaborative effort that continually builds upon prior work. We recorded the cited works within each surveyed paper that have the most bearing on research direction and publication validity: PTMs, Datasets, Prior Best (for both All-Time and Unique Setting SOTA), and Full Setting (distinct to Unique Setting SOTA). For example, if a paper used the GLUE benchmark (Wang et al., 2018), we appended it to the list of that paper’s cited datasets. For each of these citations, we used the same heuristic as in § 3.1 to assign an affiliation label. Citations in the appendix were excluded.
In addition to directly cited PTMs, if a PTM’s weights were initialized from an ancillary PTM, its citation was included as well. This recursive pattern was repeated until a PTM with weights initialized from scratch was identified. We ignored citations for model architectures since the architecture itself may not be computationally prohibitive while pre-training it often is. We did so to focus the survey on works that are not necessarily computationally feasible for all researchers.
All datasets, whether used for pre-training, fine-tuning, and/or scoring were recorded. When there was a resultant metric from training on and/or testing on a dataset, a Prior Best (and possible Full Setting) citation (if it existed) was associated with that specific metric. Multiple metrics may have been reported on a single dataset sometimes resulting in different Prior Bests being associated with the same dataset.
For Unique Setting SOTA papers, the Full Setting is often included in the results section to provide an upper bound for comparison and we recorded these as well (e.g. the baseline of 100% parameters tuned in parameter-efficient tuning). Our goal was to determine which institute type usually owns this upper bound. For both Prior Best and Full Setting citations, we recorded the reported score associated with them. We use them to determine degree of improvement for SOTA claims (see § 4.2).
3.4 Miscellaneous
To round out our survey, we recorded two Boolean variables for statistical significance testing (SST) and public code release.
Interpreting results from stochastic experiments can be aided by SST, an evaluation framework often ignored in deep learning publications (Ulmer et al., 2022). While SST can be misleading and used to draw invalid conclusions (Reimers and Gurevych, 2018), entirely disregarding SST can be equally harmful (Card et al., 2020; Marie et al., 2021). We checked whether a paper made an attempt at performing SST. We did not do any additional validity analysis of the test itself. If an attempt was made, the variable was assigned a True value. Our criteria was intentionally relaxed since any recognition of the pitfalls of NLP evaluation and a corresponding attempt to reconcile them signifies an attention to nuance in interpreting results.
Reproducibility is another common but unevenly applied criterion for credibility in NLP and scientific research as a whole. Gundersen and Kjensmo (2018) grouped factors that assist in reproducing AI results into three categories and from surveying 400 research papers, determined that only 20–30% of them document such factors. One of these factors is the release of implementation code and data, a recommendation supported by Dodge et al. (2019) and included in the EMNLP 2022 Reproducibility Criteria. If a paper provided a link to their code and/or data (typically as a GitHub repository) the public code release variable was set to True.
In parallel to the citation recording process, we calculated the number of reported metrics per paper to determine whether industry’s increased computing capabilities would allow them to disseminate more results. This variable, along with the other miscellaneous variables are averaged over each institute type and presented in Table 3.
Statistical significance testing in any form is still a rarity in all papers but more common in the industry setting. The percentage of publicly released code linearly decreases with increased privatization. Given that reviewers were instructed to take into consideration a submission’s ability to meet Reproducibility Criteria, the acceptance of 15 papers with private implementations indicates that either these papers contribute exceptional methods that outweigh the negative consequences of their privacy or that the value placed on reproducibility is not uniform across reviewers. The usefulness of scientific results reported on closed models has been called into question Rogers et al. (2023) and whether research on private models is suitable for a public venue such as EMNLP is therefore worthy of debate. Academics and industry practitioners report nearly the same number of metrics per paper. This could be a result of limiting our survey to the main bodies of papers which have a fixed length and subsequently a relatively standard number of tables and figures. A future analysis including appendices may be more revealing.
| Academia | Non-Profit | Industry | All | |
|---|---|---|---|---|
| SST Attempt | 20.0% | 16.7% | 36.4% | 27.0% |
| Public Code | 94.0% | 83.3% | 75.0% | 85.0% |
| Num. Metrics | 14.0 | 4.5 | 15.5 | 14.0 |
4 Analysis
Some research questions were not immediately answerable from the raw survey data and are addressed in this section via additional analysis.
4.1 Reliance on Industry Artifacts and Contributions
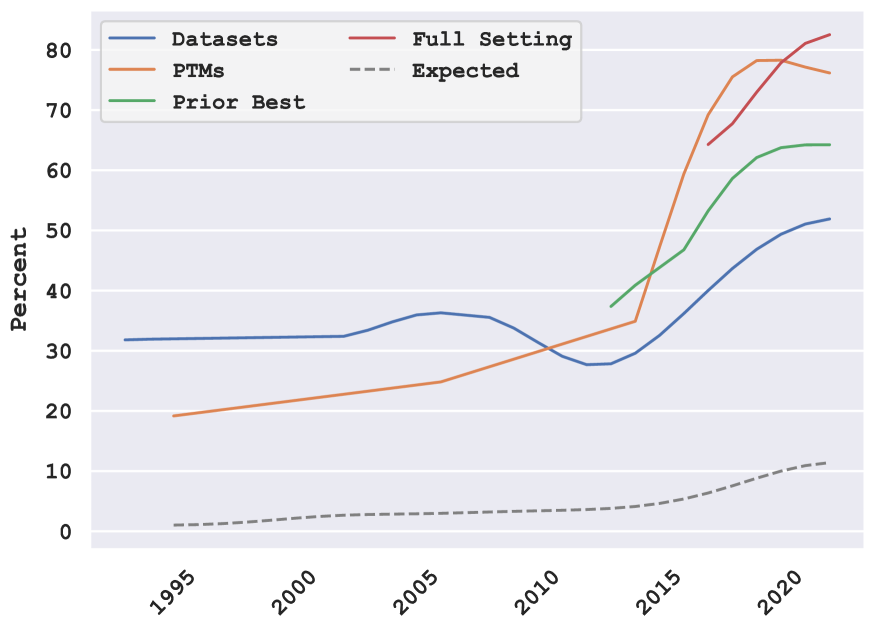
Having recorded the affiliations of each paper’s most important citations split by type (§ 3.3), we processed the data by binning citations by publication year. We did not split publications by the EMNLP 2022 paper’s affiliation for this analysis. We wanted to quantify reliance on industry for the entire NLP community. For each year with at least one citation, we determined what percentage of the citations were industry. Some years—especially the earlier ones—had no or few citations and the sparsity resulted in jagged impulses. We applied a 1D Gaussian filter111SciPy Implementation (v1.10.1): https://docs.scipy.org/doc/scipy-1.10.1/reference/generated/scipy.ndimage.gaussian_filter1d.html with its standard deviation, set to to smooth the data and isolate a long-term trend.
From Abdalla et al. (2023) we have access to the actual ACL Anthology industry affiliation rate over time and we plot it alongside the citation data. We label this line "expected" since one would expect the citations from each year to follow the same trend. Note that the ACL Anthology is not the publisher of every citation in EMNLP 2022. Image PTMs for example are typically published at other venues. However, the trend of increased industry presence at ACL generalizes to other major AI conferences (Ahmed and Wahed, 2020) and given that most NLP publications cite within the NLP community we believe it to be an adequate proxy of expectation.
The plot of both our citation data and expected industry presence is in Figure 1. Two observations are immediately clear: The citation of industry papers is well above expected for every year and the proportion is increasing. In fact, for Datasets, PTMs, Prior Bests, and Full Setting citations as of 2022, the majority are industry. This trend indicates a reliance on industry artifacts and contributions. While only 13.3% of published ACL Anthology papers were from industry, over three times that were used as important citations.
In terms of artifacts, having the most used Datasets and PTMs coming from industry may limit the broader NLP community’s research directions to align with the publishing industry. Industry’s majority claim on Prior Bests suggests that although they published less in the past, their publications are more likely to achieve and retain SOTA. The situation for Full Setting citations also supports a trend of industry reliance where the majority of Unique Setting works are at their onset looking up to industry as an unobtainable upper bound.
4.2 Degree of SOTA Improvement
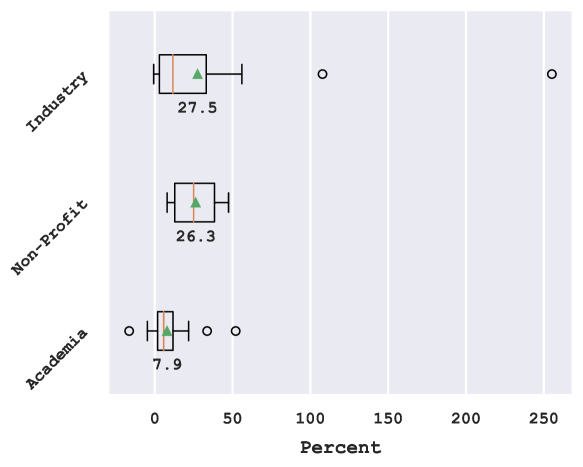
There was no clear distinction between quantities of SOTA papers published by industry and academia (§ 3.2). However, by analyzing the distribution of score increases over prior bests, a difference between institution types became evident. To do so, we averaged the relative improvements of individual metrics first over the dataset they were scored on, and then again over all datasets evaluated per paper. We pooled both types of SOTA papers, Unique Setting and All-Time, to increase the statistical power of our analysis (for split see Appendix A.1). Equation 1 formalizes our approach:
| (1) |
where is the number of datasets a paper evaluated on, is the number of metrics per dataset, , is the paper’s new score reported on and metric, , and is the Prior Best score on the same metric and dataset. Metrics with an old score of zero were automatically set to a relative increase of regardless of new score. The papers’ average relative score increase were then grouped by institute. Outliers outside two times the standard deviation of each group were removed (see Appendix A.2) and the remaining points are plotted in Figure 2.
The means of industry SOTA improvements are over three times times higher than academia’s. Academia’s lower whisker extending into the negatives along with the negative flier indicate that some academics are claiming SOTA despite failing to achieve a net score increase. Requirements to claim SOTA are not strictly defined and some metrics may be weighted higher than others in a paper, but this pattern, along with the overall lower mean, suggests that academia’s SOTA claims are not as strong as industry’s. Although there were equal numbers of SOTA claims between the institution types this year, this trend as well as the disproportion of prior bests being from industry (§ 4.1) could result in a gradual boxing out of academia from future SOTA claims.
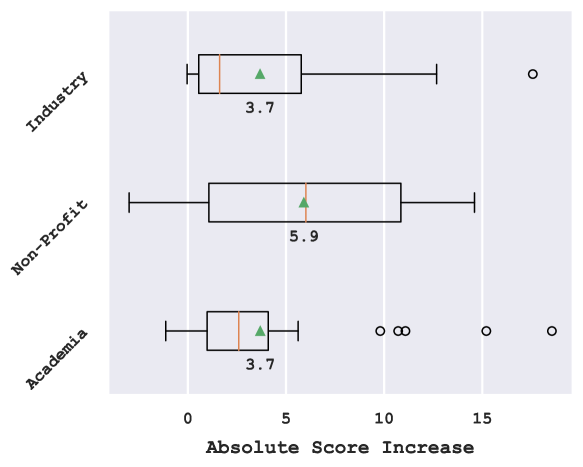
Relative score is biased toward increases where the old score is relatively low; a phenomenon more common to the Unique Setting that is evident when splitting relative score increase by SOTA type (Appendix A.1). To contrast relative increase’s inherent bias we also plot absolute score increase in Appendix A.3. In this case, academia captures SOTA equally as effectively as industry. Without the benefit of improving over small prior scores, industry’s apparent advantage disappears. Such a pattern could suggest that industry prefers or is more capable of addressing novel tasks (i.e. ones without much prior success, and hence low old scores) while academia sticks to datasets and benchmarks with pre-existing high scores.
4.3 Citation Predisposition
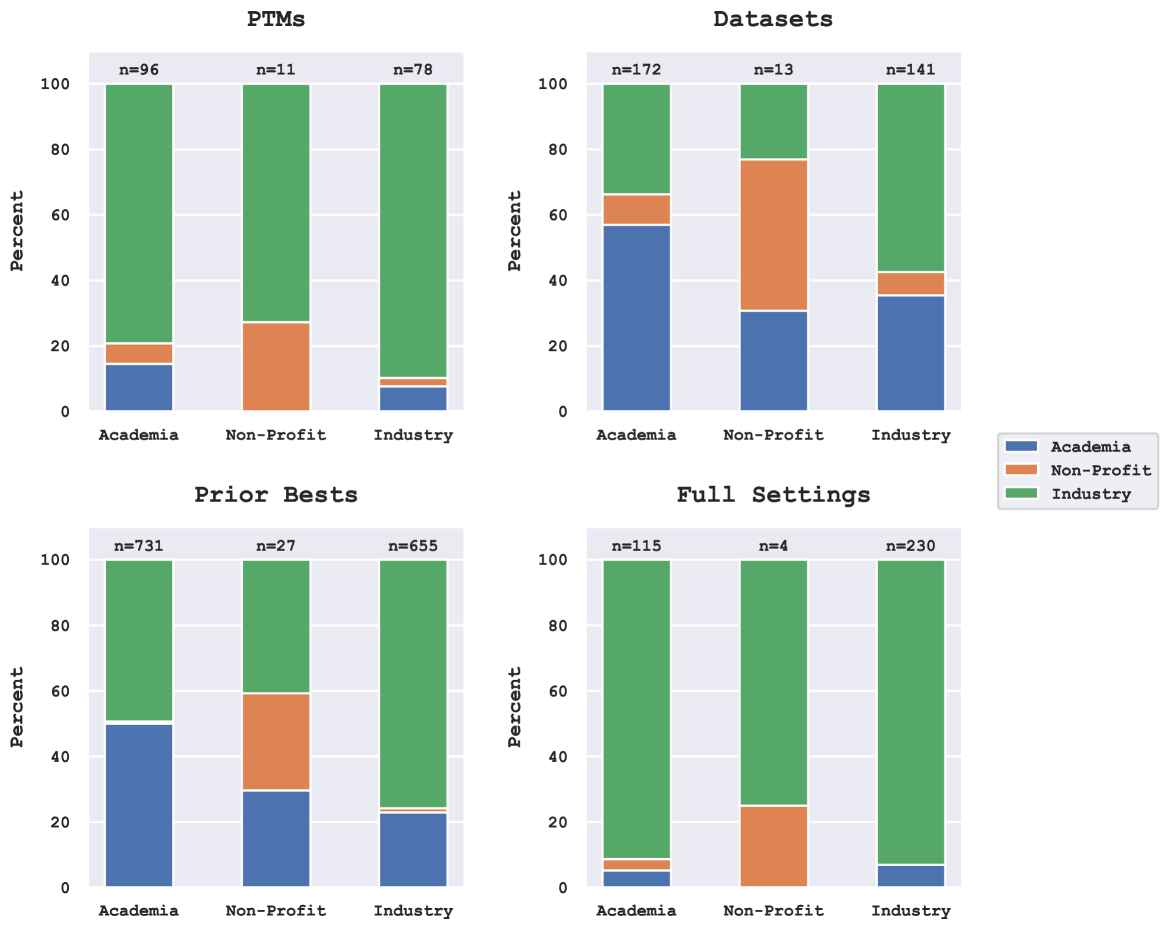
We have established that there is an overall reliance on industry across publications, but still wanted to determine whether the reliance is equal across academia and industry. Figure 3 plots the same data as in Figure 1 but split by publishing institute type instead of citation year.
| PTM | Academia | Non-Profit | Industry | Total |
|---|---|---|---|---|
| Yes | 43 | 6 | 38 | 87 |
| No | 7 | 0 | 6 | 13 |
| Percent | 86 | 100 | 86 | 87 |
With the exception of academic citations of Full Settings, for PTMs, Datasets, Prior Bests, and Full Settings, authors are predisposed to citing their own institute type (i.e. for each of those subplots, the largest bar for each cited institute type falls within that same publishing institute type). This result is unsurprising. Researchers are more likely to address problems relevant to their institute and use a similar subset of artifacts to model and evaluate.
Regardless of predisposition, all groups are still overwhelmingly reliant on industry PTMs. Table 4 shows that the alternative of not using any PTM at all is largely infeasible with only 13 papers publishing without them. Even in this scenario, there may still be a dependency on computing power if the authors are training a large model from scratch.
5 Discussion
Industry presence in NLP artifacts and contributions is common and well-above the expected margin. From the perspective of policy research and those who favour research productivity, this relationship may be seen as a purely positive collaboration (Gulbrandsen and Smeby, 2005; Holman, 2021). Industry has committed substantial financial resources to NLP and the entire research community benefits from more funding and greater professional demand (Maslej et al., 2023). It could be argued that the progress achieved in recent years would not have been possible without a high degree of industry involvement.
In contrast, those who consider objectivity as an important epistemic virtue of scientific research may be concerned with this trend. Abdalla and Abdalla (2021) compare the state of AI to the tobacco industry at its peak, a situation which in retrospect is usually cast in a negative light. In a few decades time, will we look back at NLP and AI research with similar collective disdain? Will our present efforts be overshadowed by a narrative of objectivity tainted by corporate capture? At the very least, whether for good or bad, publishing in top NLP venues such as EMNLP without using industry artifacts and contributions is becoming increasingly infeasible.
Regardless of viewpoint, all stakeholders relevant to this discussion benefit from increased exposure to information and transparency. Throughout our survey we noticed several norms of our research community that limit transparency and subsequently the accuracy of quantifying industry presence. We propose the following suggestions to assist with future studies of this kind:
-
•
Authors should be required to list exact sources of funding for their work. Without specifics, we had to rely on author affiliation to quantify industry presence. This is an imprecise method given that academia, non-profits, and for-profits all receive some proportion of public funding. Requiring an acknowledgement section listing all sources of funding would alleviate this issue without excessive overhead.
-
•
In line with the above suggestion, tagging papers according to public, private, and/or a split of funding beside its link in the ACL Anthology would foster transparency. The tag could look similar to dataset, software, and best paper tags as in EACL 2023333https://aclanthology.org/events/eacl-2023/ and link to descriptions of each category of funding. Sorting by funding source would enable readers to pick out papers funded by sources they are in favour of or prefer citing.
-
•
Reserving a fixed proportion of publication slots for various hierarchies of computing capabilities could serve as an initial idea to equitably address the compute divide (Ahmed and Wahed, 2020). Coincidentally, doing so would help address the transparency concerns of evaluating on single scores (Dodge et al., 2019). How to disclose computing capabilities is not immediately obvious and we leave that to future work.
These suggestions each share the common goal of increasing transparency regarding funding sources and computing capabilities. As of now, the compute divide is a well-understood phenomenon and yet it continues to be ignored when submitting and reviewing publications. Researchers with less funding are automatically excluded from a subset of problems due to insufficient computing and can only gain access by collaborating with industry which may not align with their values or abilities. Our main concern is ensuring that a space always exists for all NLP practitioners to contribute their work. Preserving diversity in NLP will strengthen our collective research by ensuring that perspectives from stakeholders without conflicts of interest with industry are still heard.
6 Conclusion
Industry has increased investment in AI research and specifically NLP in recent years. Our survey of 100 EMNLP 2022 papers found that the citation of industry artifacts and contributions is far greater than what would be expected based on yearly industry publication rates. This relationship indicates a reliance on industry due to the absence of alternative sources of citation material. We conclude with a brief discussion highlighting possible positive and negative impacts of industry reliance and provide suggestions for navigating transparency and computing equity issues in NLP.
Limitations
Sample Size
The most obvious limitation of our analysis is sample size. We studied 100 of a possible 829 papers. Reading each paper and manually extracting the relevant citations (and possibly reading those papers as well) was time consuming. We considered performing the data collection automatically with NLP solutions, but doing so would have likely required a pre-existing labelled dataset. Using our released data for training an NLP model to do this type of analysis is an interesting line of future work.
Once split by institution type, the number of papers with SOTA advancements was too small to split again by SOTA type and maintain statistically significant findings. We alleviate this issue by keeping them combined for the analysis in the main body of the paper and reserving the statistically insignificant, yet still valuable as an initial undertaking, fine-grained analysis to the appendix.
Defining Institution Types
It is difficult to bin authors into clearly defined institute types from affiliation alone. Academics receive funding from industry scholarships and grants and conversely industry can be the beneficiary of public funding (in the forms of grants, tax rebates, credits, etc.). Additionally, some academic institutes are classified as private entities. The blurred line between public and private research makes disentangling them nearly impossible. Our analysis is therefore only an estimate based on information clearly presented in the authorship sections of papers. The implementation of our suggestion in § 5 regarding reporting funding sources explicitly in the Acknowledgements section of papers or something similar will improve precision in future studies.
Ethics Statement
The information we collect and release in our survey is publicly available in the EMNLP 2022 Conference Proceedings444https://aclanthology.org/events/emnlp-2022/ under a Creative Commons Attribution 4.0 International License and therefore did not qualify for internal ethics review. Furthermore, we do not identify specific papers in our work. Our intention was to analyze the interactions between broad institution types and not to call into question the contributions of individual scientists.
References
- Abdalla and Abdalla (2021) Mohamed Abdalla and Moustafa Abdalla. 2021. The grey hoodie project: Big tobacco, big tech, and the threat on academic integrity. In Proceedings of the 2021 AAAI/ACM Conference on AI, Ethics, and Society, AIES ’21, page 287–297, New York, NY, USA. Association for Computing Machinery.
- Abdalla et al. (2023) Mohamed Abdalla, Jan Philip Wahle, Terry Lima Ruas, Aurélie Névéol, Fanny Ducel, Saif Mohammad, and Karen Fort. 2023. The elephant in the room: Analyzing the presence of big tech in natural language processing research. In Proceedings of the 61st Annual Meeting of the Association for Computational Linguistics (Volume 1: Long Papers), pages 13141–13160, Toronto, Canada. Association for Computational Linguistics.
- Ahmed and Wahed (2020) Nur Ahmed and Muntasir Wahed. 2020. The de-democratization of AI: deep learning and the compute divide in artificial intelligence research. CoRR, abs/2010.15581.
- Ahmed et al. (2023) Nur Ahmed, Muntasir Wahed, and Neil C. Thompson. 2023. The growing influence of industry in ai research. Science, 379(6635):884–886.
- Bowman and Dahl (2021) Samuel R. Bowman and George Dahl. 2021. What will it take to fix benchmarking in natural language understanding? In Proceedings of the 2021 Conference of the North American Chapter of the Association for Computational Linguistics: Human Language Technologies, pages 4843–4855, Online. Association for Computational Linguistics.
- Card et al. (2020) Dallas Card, Peter Henderson, Urvashi Khandelwal, Robin Jia, Kyle Mahowald, and Dan Jurafsky. 2020. With little power comes great responsibility. In Proceedings of the 2020 Conference on Empirical Methods in Natural Language Processing (EMNLP), pages 9263–9274, Online. Association for Computational Linguistics.
- Dodge et al. (2019) Jesse Dodge, Suchin Gururangan, Dallas Card, Roy Schwartz, and Noah A. Smith. 2019. Show your work: Improved reporting of experimental results. In Proceedings of the 2019 Conference on Empirical Methods in Natural Language Processing and the 9th International Joint Conference on Natural Language Processing (EMNLP-IJCNLP), pages 2185–2194, Hong Kong, China. Association for Computational Linguistics.
- Ethayarajh and Jurafsky (2020) Kawin Ethayarajh and Dan Jurafsky. 2020. Utility is in the eye of the user: A critique of NLP leaderboards. In Proceedings of the 2020 Conference on Empirical Methods in Natural Language Processing (EMNLP), pages 4846–4853, Online. Association for Computational Linguistics.
- Goldenfein and Mann (2023) Jake Goldenfein and Monique Mann. 2023. Tech money in civil society: whose interests do digital rights organisations represent? Cultural Studies, 37(1):88–122.
- Gulbrandsen and Smeby (2005) Magnus Gulbrandsen and Jens-Christian Smeby. 2005. Industry funding and university professors’ research performance. Research Policy, 34(6):932–950.
- Gundersen and Kjensmo (2018) Odd Erik Gundersen and Sigbjørn Kjensmo. 2018. State of the art: Reproducibility in artificial intelligence. Proceedings of the AAAI Conference on Artificial Intelligence, 32(1).
- Holman (2021) Bennett Holman. 2021. What, me worry? research policy and the open embrace of industry-academic relations. Frontiers in Research Metrics and Analytics, 6.
- Luitse and Denkena (2021) Dieuwertje Luitse and Wiebke Denkena. 2021. The great transformer: Examining the role of large language models in the political economy of ai. Big Data & Society, 8(2):20539517211047734.
- Marie et al. (2021) Benjamin Marie, Atsushi Fujita, and Raphael Rubino. 2021. Scientific credibility of machine translation research: A meta-evaluation of 769 papers. In Proceedings of the 59th Annual Meeting of the Association for Computational Linguistics and the 11th International Joint Conference on Natural Language Processing (Volume 1: Long Papers), pages 7297–7306, Online. Association for Computational Linguistics.
- Maslej et al. (2023) Nestor Maslej, Loredana Fattorini, Erik Brynjolfsson, John Etchemendy, Katrina Ligett, Terah Lyons, James Manyika, Helen Ngo, Juan Carlos Niebles, Vanessa Parli, Yoav Shoham, Russell Wald, Jack clark, and Raymond Perrault. 2023. The ai index 2023 annual report. Technical report, Stanford University, Stanford, CA.
- Michael et al. (2023) Julian Michael, Ari Holtzman, Alicia Parrish, Aaron Mueller, Alex Wang, Angelica Chen, Divyam Madaan, Nikita Nangia, Richard Yuanzhe Pang, Jason Phang, and Samuel R. Bowman. 2023. What do NLP researchers believe? results of the NLP community metasurvey. In Proceedings of the 61st Annual Meeting of the Association for Computational Linguistics (Volume 1: Long Papers), pages 16334–16368, Toronto, Canada. Association for Computational Linguistics.
- Phan et al. (2022) Thao Phan, Jake Goldenfein, Monique Mann, and Declan Kuch. 2022. Economies of virtue: The circulation of in big tech. Science as Culture, 31(1):121–135.
- Raji et al. (2021) Deborah Raji, Emily Denton, Emily M. Bender, Alex Hanna, and Amandalynne Paullada. 2021. Ai and the everything in the whole wide world benchmark. In Proceedings of the Neural Information Processing Systems Track on Datasets and Benchmarks, volume 1. Curran.
- Reimers and Gurevych (2018) Nils Reimers and Iryna Gurevych. 2018. Why comparing single performance scores does not allow to draw conclusions about machine learning approaches.
- Reutlinger (2020) Alexander Reutlinger. 2020. What is epistemically wrong with research affected by sponsorship bias? the evidential account. Forthcoming in the European Journal for Philosophy of Science.
- Rogers (2020) Anna Rogers. 2020. Peer review in nlp: reject-if-not-sota.
- Rogers et al. (2023) Anna Rogers, Niranjan Balasubramanian, Leon Derczynski, Jesse Dodge, Alexander Koller, Sasha Luccioni, Maarten Sap, Roy Schwartz, Noah A. Smith, and Emma Strubell. 2023. Closed ai models make bad baselines.
- Seele and Schultz (2022) Peter Seele and Mario D. Schultz. 2022. From greenwashing to machinewashing: A model and future directions derived from reasoning by analogy. Journal of Business Ethics, 178(4):1063–1089.
- Sharir et al. (2020) Or Sharir, Barak Peleg, and Yoav Shoham. 2020. The cost of training NLP models: A concise overview. CoRR, abs/2004.08900.
- Ulmer et al. (2022) Dennis Ulmer, Christian Hardmeier, and Jes Frellsen. 2022. deep-significance - easy and meaningful statistical significance testing in the age of neural networks.
- Wang et al. (2018) Alex Wang, Amanpreet Singh, Julian Michael, Felix Hill, Omer Levy, and Samuel Bowman. 2018. GLUE: A multi-task benchmark and analysis platform for natural language understanding. In Proceedings of the 2018 EMNLP Workshop BlackboxNLP: Analyzing and Interpreting Neural Networks for NLP, pages 353–355, Brussels, Belgium. Association for Computational Linguistics.
- Whittaker (2021) Meredith Whittaker. 2021. The steep cost of capture. Interactions, 28(6):50–55.
- Wilholt (2006) Torsten Wilholt. 2006. Design rules: Industrial research and epistemic merit. Philosophy of Science, 73(1):66–89.
- Wilholt (2009) Torsten Wilholt. 2009. Bias and values in scientific research. Studies in History and Philosophy of Science Part A, 40(1):92–101.
- Young et al. (2022) Meg Young, Michael Katell, and P.M. Krafft. 2022. Confronting power and corporate capture at the facct conference. In Proceedings of the 2022 ACM Conference on Fairness, Accountability, and Transparency, FAccT ’22, page 1375–1386, New York, NY, USA. Association for Computing Machinery.
Appendix A Additional Score Analysis
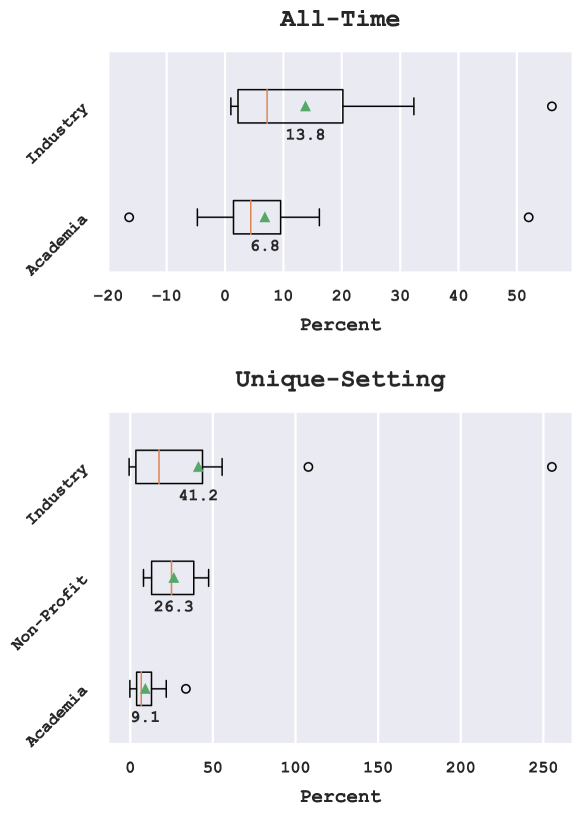
A.1 Relative Score Improvement Split by SOTA Type
We split relative score increase by SOTA type and present the resultant subplots in Figure 4. Neither difference in means between industry and academia are statistically significant ( and from simple t-test for All-Time and Unique Setting respectively).
The observation that Unique Setting claims are more substantial than All-Time is still worthy of discussion. By narrowing the problem to a Unique Setting, competition is automatically removed and it logically follows that higher score increases would be achievable. This pattern is noticeable for both academia and industry. The smaller advancements for All-Time claims supports the theory that benchmarks are saturated (Bowman and Dahl, 2021). There is less room for researchers to maneuver at the top of the leaderboards, decreasing the strength of new SOTA claims.
A.2 Outliers
Two papers were excluded from the relative score analysis in § 4.2 with increases of and . One was from industry and the other was from academia. The first result was due to a comparison of a baseline that performed close to zero for few-shot and zero-setting, a scenario that naturally inflates relative score increase. The second score was boosted from comparing unsupervised setting results to a method that was not designed for that setting and correspondingly performed poorly. Neither were outliers in the absolute score analysis, emphasizing the balancing effect of using both analyses.
A.3 Absolute Score Improvement
To contrast the bias relative score increase assigns to improvements over near-zero scores, we also plotted absolute score increase split by institution type which can be seen in Figure 5. In this scenario, industry and academia improvements are near identical. The distinction between the two is only noticeable in terms of relative improvement.