Post-starburst galaxies in SDSS-IV MaNGA: Two broad categories of evolutionary pathways
Abstract
We study the size-mass relation (SMR) and recent star formation history (SFH) of post-starburst (PSB) galaxies in the local Universe, using spatially resolved spectroscopy from the final data release of MaNGA. Our sample includes 489 PSB galaxies: 94 cPSB galaxies with central PSB regions, 85 rPSB galaxies with ring-like PSB regions and 310 iPSB galaxies with irregular PSB regions. When compared to control galaxies of similar SFR, redshift and mass, a similar SMR is found for all types of PSB samples except the cPSB galaxies which have smaller sizes at intermediate masses (). The iPSB galaxies in the star-forming sequence (iPSB-SF) show no/weak gradients in , and , consistent with the global star-forming status of this type of galaxies, while the quiescent iPSB (iPSB-Q) sample shows negative gradients in and positive gradients in , indicating older stellar populations in the inner regions. Both cPSB and rPSB samples show positive gradients in and negative gradients in , indicating younger stellar populations in the inner regions. These results imply that the four types of PSB galaxies can be broadly divided into two distinct categories in terms of evolutionary pathway: (1) iPSB-SF and iPSB-Q which have SMRs and SFHs similar to control galaxies, preferring an inside-out quenching process, (2) rPSB and cPSB which appear to be different stages of the same event, likely to follow the outside-in quenching process driven by disruption events such as mergers that result in a more compact structure as quenching proceeds.
1 Introduction
Post-starburst (PSB) galaxies, also known as “E+A” or “K+A” galaxies, are identified by strong Balmer absorption lines but no/weak or [O ii] emission lines in their optical spectrum (e.g. Dressler & Gunn, 1983; Poggianti et al., 1999; Goto, 2005). The lack of strong [O ii] or emission indicates no or weak ongoing star formation, while strong Balmer absorption lines indicate a starburst within the past 1Gyr. Thus the two spectral features combine to indicate a burst of star formation followed by a rapid cessation process of the star formation with a timescale of Gyr. The PSB galaxies account for only about 1% of the galaxy population in the local Universe (e.g. Goto et al., 2008; Wong et al., 2012; Meusinger et al., 2017; Pawlik et al., 2018). Many of them fall in the “green valley” of color-mass diagrams (e.g. Wong et al., 2012), a relatively rare population located in between the two major populations of galaxies: the star-forming blue cloud and the quiescent red sequence (e.g. Strateva et al., 2001; Kauffmann et al., 2003; Baldry et al., 2004; Bell et al., 2004; Bundy et al., 2005; Arnouts et al., 2007; Faber et al., 2007). Therefore, PSB galaxies are widely believed to be transitioning from the blue cloud to the red sequence, thus playing an important role in galaxy evolution, although the exact fraction of quiescent galaxies that have undergone a PSB phase remains elusive (e.g. Tran et al., 2003, 2004; Yang et al., 2008; Wild et al., 2009; Vergani et al., 2010; Swinbank et al., 2012; Whitaker et al., 2012; Wong et al., 2012; Pawlik et al., 2016; Yesuf, 2022).
Despite a rich history of studies in the past four decades, the physical origin of the fast quenching in PSB galaxies is still under debate. In early studies, since these galaxies were preferentially found in galaxy clusters (e.g. Dressler & Gunn, 1983; Poggianti et al., 1999; Tran et al., 2003), mechanisms occurring in dense environments such as perturbations by the cluster tidal field (Byrd & Valtonen, 1990) and repeated encounters with companion galaxies known as “harassment” (Moore et al., 1996, 1998) were considered. In more recent studies ram-pressure stripping of the cold interstellar medium (Gunn & Gott, 1972) has also been considered (e.g. Paccagnella et al., 2017; Vulcani et al., 2020; Wilkinson et al., 2021). However, Yesuf (2022) found that the satellite-quenching mechanisms operating in high-density environments cannot account for most of their PSB galaxies selected from the Sloan Digital Sky Survey (SDSS; York et al., 2000).
Gas removal driven by active galactic nuclear (AGN) activity has been suggested as an alternative mechanism to quickly shut down the star formation during the PSB phase (e.g. Goto, 2006; Yan et al., 2006; Wild et al., 2007; Sell et al., 2014; Yesuf et al., 2014). However, A recent study of Chandra observations by Lanz et al. (2022) showed that PSB galaxies can contain only low-luminosity AGN, which are unable to radiatively drive out the cold gas in low PSB galaxies, as detected by many studies (e.g. Chang et al., 2001; Buyle et al., 2006; Zwaan et al., 2013; French et al., 2015; Yesuf et al., 2017; Bezanson et al., 2022; French et al., 2022).
In fact, it has been well-established that PSB galaxies generally reside in the field and loose groups rather than dense environments based on large spectroscopic surveys, both at low redshift such as the Las Campanas Redshift Survey (e.g. Zabludoff et al., 1996), the 2dF Galaxy Redshift Survey (e.g. Blake et al., 2004) and the SDSS (e.g. Hogg et al., 2006; Goto, 2007; Pawlik et al., 2018), and at such as the DEEP2 Galaxy Redshift Survey (e.g. Yan et al., 2009). In addition, imaging observations have revealed that a significant fraction of PSB galaxies present morphological disturbance in their optical images signifying an ongoing or past merger, although the merger fractions of PSB galaxies in different studies span a wide range depending on the merger identification method, PSB sample selection and imaging data depth and resolution (e.g. Couch et al., 1994; Dressler et al., 1994; Zabludoff et al., 1996; Caldwell & Rose, 1997; Oemler et al., 1997; Couch et al., 1998; Tran et al., 2004; Goto, 2005; Yang et al., 2008; Pracy et al., 2009; Trouille et al., 2013; Pawlik et al., 2018; Sazonova et al., 2021; Wilkinson et al., 2022; Verrico et al., 2022).
Studies of galaxy structure have found that PSB galaxies at intermediate-to-high redshifts () are more compact than both star-forming and quiescent galaxies (e.g. Newman et al., 2012; Yano et al., 2016; Almaini et al., 2017; Maltby et al., 2018; Wu et al., 2018; Suess et al., 2020; Setton et al., 2022). For instance, Setton et al. (2022) found the PSB galaxies at systematically lie dex below the size-mass relation of quiescent galaxies. For local galaxies, Chen et al. (2022) have recently examined the size-relation of the SDSS-based PSB galaxy sample, finding the PSB galaxies to be smaller than quiescent galaxies of similar mass and star formation rate (SFR), especially in the stellar mass range of . These results are consistent with the picture of fast quenching as induced by major mergers. It has been suggested that, mergers may drive gas inward and centralized star formation, thus leading to a more compact light distribution and resulting in both quenching and structural transformation (e.g. Wellons et al., 2015; Zheng et al., 2020).
Although many studies have provided strong evidence for a merger origin of PSB galaxies, the fact that a considerable fraction of PSB galaxies show regular morphologies appear to require other mechanisms in addition to mergers in order to fully explain the PSB galaxy population. As pointed out in Sazonova et al. (2021) and Wilkinson et al. (2022), however, features of morphology disturbance fade on timescales of Myr according to hydrodynamic simulations, and so a possible merger origin for all the PSB galaxies cannot be simply ruled out based on the merger fractions estimated from galaxy images.
Previous studies mostly used either single-fiber or slitless spectroscopy which probes only a small region in the galactic center of low- galaxies (e.g. the central 1-2 kpc in SDSS galaxies). Integral field spectroscopy available in recent years has allowed the PSB features to be detected in off-center regions of many galaxies (e.g. Chen et al., 2019; Zheng et al., 2020; Greene et al., 2021; Wu, 2021; Otter et al., 2022; Werle et al., 2022). Using an early sample of the Mapping Nearby Galaxies at Apache Point Observatory (MaNGA Bundy et al., 2015) survey, Chen et al. (2019) identified 360 PSB galaxies, of which only 31 galaxies present the PSB feature in their center (hereafter central PSB galaxies, or cPSB galaxies in short). In their sample, 37 galaxies show a ring-like PSB region (hereafter rPSB galaxies), and the PSB regions of the remaining 292 galaxies have irregular shapes and locations. Both cPSB and rPSB galaxies in their sample presented positive gradients in (the spectral break at around 4000Å) indicative of younger stellar populations in the inner regions. This result implied that the star formation in PSB galaxies get shut down from outside in, opposite to the “inside-out” quenching process as found for massive galaxies in the general population (e.g. Li et al., 2015; Wang et al., 2018). The outside-in quenching was also seen by Wu (2021) in a small sample of MaNGA-based PSB galaxies, and by Werle et al. (2022) in the PSB galaxies at the centers of eight clusters from to as observed with the Multi Unit Spectroscopic Explorer (MUSE).
In this work, we make full use of the final data release of the MaNGA survey, which provides integral field spectroscopy for 10,000 nearby galaxies, to study both the size-mass relation and the recent star formation history (SFH) of PSB galaxies in the local Universe. We consider not only the cPSB and rPSB types of PSB galaxies as in previous MaNGA-based studies, but also those with irregular PSB regions (hereafter iPSB galaxies), which dominate the PSB galaxy population. We use three spectral indices to indicate the recent SFH of the PSB regions: the equivalent width (EW) of the emission line (, indicator of ongoing star formation), the EW of the H absorption line (, sensitive to young population formed in the past 0.1-1 Gyr; Bruzual & Charlot 2003), and (a good proxy for the luminosity-weighted stellar age; Kauffmann et al. 2003). We make comparisons between each of the PSB samples and a carefully-selected control sample, closely matched in redshift, stellar mass and star formation rate. As we will show, the different PSB samples behave differently in both the size-mass relation and the SFH diagnostic parameters, indicating different evolutionary pathways for different types of PSB galaxies.
This paper is organized as follows. In section 2, we describe the MaNGA data and the identification of the PSB galaxies. In section 3, we present the analysis of the size-mass relation and recent SFH. We discuss our results in section 4 and summarize in section 5. Throughout the paper, we assume a CDM cosmology with and , and a Hubble constant of 70 km .
2 Data
2.1 MaNGA
MaNGA is one of the three major projects of the fourth-generation Sloan Digital Sky Survey (SDSS-IV; Blanton et al., 2017). During its six-year operation from July 2014 through August 2020, MaNGA has successfully obtained high-quality integral field spectroscopy (IFS) for 10,010 galaxies with redshift and stellar mass (Bundy et al., 2015; Abdurro’uf et al., 2021). MaNGA target galaxies are selected from the SDSS spectroscopic galaxy sample and are included in three samples (Yan et al., 2016a; Wake et al., 2017): Primary, Secondary and Color-Ehanced samples. Targets in the Primary and Secondary samples are each observed out to 1.5 or 2.5 times effective radius (), and the two samples together have a flat distribution of the -corrected band absolute magnitude (). The Color-Enhanced sample further selects low-mass red galaxies and high-mass blue galaxies on the plane of NUV color index versus , which are not well sampled by the Primary/Secondary samples (Wake et al., 2017).
The IFS data of MaNGA are obtained using 17 pluggable Integral Field Units (IFUs) with a field of view ranging from to , and each IFU is a hexagonal-formatted fiber bundle made from -core-diameter fibers with a gap between adjacent fibers, thus producing datacubes with an effective spatial resolution of (Drory et al., 2015; Law et al., 2015). The fibers are fed to two dual-channel BOSS spectrographs (Smee et al., 2013) at the 2.5-meter Sloan Telescope (Gunn et al., 2006), producing spectra with a spectral resolution of 2000 in the wavelength range from 3622 to 10354Å. A typical exposure time of 3 hours ensures a -band continuum S/N of 48 (per-fiber per pixel) at 12 (Drory et al., 2015). MaNGA raw data are reduced with the Data Reduction Pipeline (DRP; Law et al., 2016) to produce sky-subtracted and spectrophotometrically-calibrated spectra for scientific studies. Details of the flux calibration, MaNGA survey strategy, and data quality tests can be found in Yan et al. (2016a, b). All the MaNGA data products are released as part of the final data release of SDSS-IV (Abdurro’uf et al., 2021).
2.2 Identification of post-starburst galaxies
PSB galaxies are commonly identified by two spectral features jointly: strong equivalent width (EW) of high-order Balmer absorption lines produced by massive young stars, and weak/no H emission indicative of weak/no ongoing star formation. We identify our PSB galaxies by searching for continuous regions in MaNGA datacubes that present both features. This is done in two successive steps: we first select “H-strong regions” in each galaxy that have strong H absorption, from which we then identify PSB regions by examining both H emission and H absorption lines in the stacked spectrum of each region. This procedure is similar to the procedure of identifying Wolf-Rayet galaxies in Liang et al. (2020) where the authors firstly search for Hii regions in the MaNGA datacubes and then examine the stacked spectra of those regions to further identify Wolf-Rayet regions. The reason to use stacked spectra rather than original spaxels is two-fold. On the one hand, as shown in Liang et al. (2020), by stacking the spectra of all the original spaxels in a region, we can significantly increase the spectral S/N, thus ensuring robust identification for regions with relatively weak spectral features. On the other hand, the limited spatial resolution of MaNGA (, or kpc at the median redshift of MaNGA) means that our data cannot resolve individual PSB regions, which are smaller than pc if assumed to have sizes comparable to Hii regions. Therefore, following Liang et al. (2020), we adopt a maximum radius for our PSB regions to be , which is comparable to half of the MaNGA resolution, and is a trade-off between higher S/Ns from stacking more spectra and stronger dilution to PSB features.
In practice, for a given galaxy we first perform full spectral fitting to the MaNGA spectrum of every spaxel in the datacube using the spectral fitting code described in detail in Li et al. (2020). The code uses stellar templates constructed by a Principle Component Analysis of the single stellar population (SSP) models of Bruzual & Charlot (2003) and assumes a Chabrier initial mass function (Chabrier, 2003). We measure the EW of H absorption line from the best-fit model spectrum of the stellar component, and the EW of H emission line from the starlight-subtracted spectrum. We then search for H-strong regions on the two-dimensional map of . For this purpose, we have modified HIIEXPLORER, a pipeline developed by Sánchez et al. (2012) for the identification of Hii regions on maps of H surface density. The modified code starts by picking up the spaxel with the highest (Å) over the map as the center of a potential “H-strong region”. Adjacent spaxels in the vicinity of the central spaxel are appended to the region if their distances from the central spaxel are less than . The region is removed from the map and the above procedure is repeatedly applied to the remaining map until every spaxel is assigned to a region, or rejected.
For each of the H-strong regions, we stack the spectra of its spaxels in the same way as in Liang et al. (2020). In short, the spaxel spectra are corrected to the rest frame using both the galaxy redshift and the stellar velocity of each spaxel relative to the galaxy, and are weighted by the inverse variance of flux errors provided by the MaNGA DRP (Law et al., 2016) to produce a stacked spectrum of the region. Flux errors of the stacked spectrum are firstly calculated by the standard formula in weighted mean statistics, and then corrected for the effect of covariance following the formula in Law et al. (2016, see their Figure 16). We ignore regions with the stacked spectrum of S/N in what follows. The code of Li et al. (2020) is used again to fit each of the stacked spectra (with S/N), from which we measure all emission line parameters and stellar indices that may be used in our work. We identify PSB regions from the H-strong regions, following the same selection criteria as in Chen et al. (2019, see their §2.3): (i) EW(H) 3Å, (ii) EW(H) 10Å, and (iii) [EW(H)] 0.23 EW(H) . We note that we have adopted selection criteria from other studies (e.g. Goto et al., 2008; Chen et al., 2022) and repeated the whole analysis, finding our scientific conclusions to be robust to the different selection criteria.
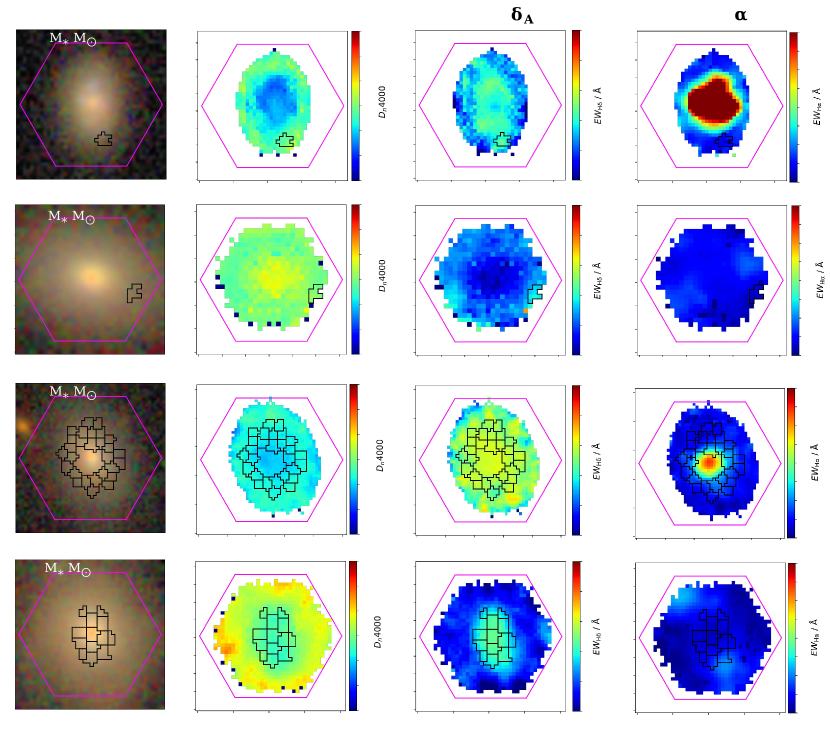
A galaxy is identified to be a PSB galaxy if it contains one or more PSB regions. In total, we have identified 3204 PSB regions, distributed in 489 PSB galaxies. Following Chen et al. (2019), we visually examine the maps of EW(H) and EW(H) and classify our PSB galaxies into three types according to the location of their PSB regions: (i) cPSB with the PSB regions located at the galactic center, (ii) rPSB with a ring-like distribution of multiple PSB regions, and (iii) iPSB with the PSB regions distributed in an irregular manner. The numbers of the three types of galaxies are 310 (iPSB), 85 (rPSB) and 94 (cPSB). Thus the majority of PSB galaxies are iPSB, which have been rarely studied, however. In Figure 1 we show four example PSB galaxies in our sample: two iPSB galaxies in the top two rows (one star-forming galaxy and one quiescent galaxy according to their global star formation rate), followed by a rPSB galaxy and a cPSB galaxy. The four panels (from left to right) show the SDSS composite image and maps of (the narrow version of the spectral break at around 4000Å, as originally defined in Balogh et al. 1999), and . The latter three parameters are sensitive to young stellar populations of different ages, thus can be used as good diagnostics for the recent star formation history (SFH) of given region (e.g. Li et al., 2015; Wang et al., 2018). The different types of PSB galaxies differ from each other in these diagnostic parameters, indicating diverse SFHs in PSB galaxies. We will study the recent SFHs of our PSB galaxies in the next section.
3 Results
3.1 Global properties of PSB galaxies
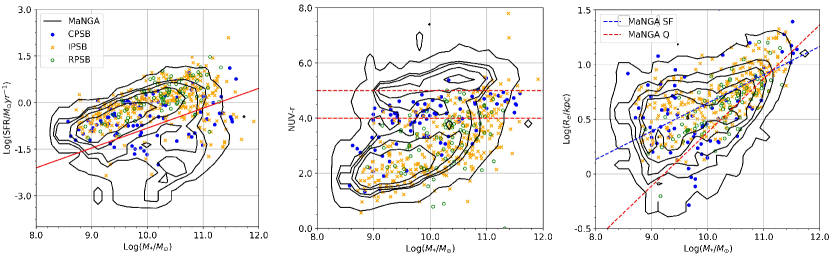
Figure 2 examines the global properties of our PSB galaxy sample by displaying all the PSB galaxies in three diagrams: the SFR-mass diagram (left), the color-mass diagram (middle) and the size-mass relation (right), with different colors/symbols for the three PSB types. For comparison, the distribution of the parent MaNGA sample is plotted as black contours, for which we have corrected the effect of sample incompleteness using the -weighting scheme following Wake et al. (2017). Stellar masses () and star formation rates (SFR) of our galaxies are taken from the GSWLC catalog111https://salims.pages.iu.edu/gswlc/ (Salim et al., 2016), and effective radii () are provided in the NSA, measured through two-dimensional Sersic profile fits to SDSS -band images (Blanton et al., 2011). The NUV color indices, from NSA catalog, are based on the NUV image from GALEX and the -band image from SDSS. The red solid line in the SFR-mass diagram is the empirical divider from Woo et al. (2013), SFR( ) = 0.64 log , which separates star-forming (SF) galaxies from quiescent (Q) galaxies. The two horizontal dashed lines in the color-mass diagram represent the commonly-used cuts of NUV=4 and NUV=5 which divide the galaxies into red, green and blue populations. The dashed lines in blue and red in the right panel are linear fits to the - relation of star-forming galaxies and quiescent galaxies, as selected from the parent MaNGA sample on the SFR-mass diagram.
Overall, to our surprise, the PSB galaxies in our sample are rarely red or quenched. Rather, they are mostly blue or green with NUV in the color-mass diagram, and are mostly located in the star-forming sequence or the transition region above the quiescent sequence in the SFR-mass diagram. This is in contrast to the traditional view of PSB galaxies which have long been assumed to be quenched after having experienced a recent starburst. When divided into the three types, the PSB galaxies present different distributions in these diagrams. First, the majority of the cPSB galaxies are found in the transition region between red/blue or SF/Q populations, thus consistent with the traditional expectation. Quantitatively, out of the 94 cPSB galaxies in our sample, 48 (51.1%) fall in the green valley with NUV, and 27 (28.7%) are located just below the star-forming sequence with only a few scattering to the sequence of quiescent galaxies. This result is similar to previous findings from SDSS-based studies where the PSB galaxies were identified based on spectroscopy of the central 1-2 kpc (e.g. Wong et al., 2012; Chen et al., 2022), and it is broadly consistent with the standard conjecture that PSB galaxies are in the transition phase between star-forming and quenched galaxies. On the other hand, however, the spatially resolved spectroscopy from MaNGA reveals that more than two third of the cPSB galaxies are still globally star-forming and blue, although the star formation in their central region has recently shutdown. Obviously, even when limited to galactic centers, a significant fraction of PSB galaxies are not fully quenched.
Next, different from cPSB galaxies, the rPSB galaxies are mostly located in the SF sequence and the blue cloud, with only 3.5% (3/85) falling below the SF sequence and 25.9% (22/85) having NUV. In an earlier MaNGA-based study by Chen et al. (2019), cPSB galaxies are found in the transition region in the plane of versus , and rPSB galaxies fall slightly below the cPSB population but above the sequence of the young galaxy population (see the bottom-left panel of their Figure 5). Our result is not inconsistent with theirs, considering that the examined in their work, the SFR we used and NUV examined here are sensitive to stellar populations formed at different times. We will examine the of our galaxies in subsection 3.3. Finally, different from both cPSB and rPSB galaxies which are limited to narrow ranges of SFR and NUV, the iPSB galaxies cover a wide range in both parameters, though with a relatively large fraction falling in the star-forming sequence () and the blue cloud with NUV ().
As estimated by applying the SED fitting technique to multiband photometry, the SFRs from GSWLC are averaged over the past 30-100 Myr and so they may be higher than the current SFRs for PSB galaxies for which the SFRs are expected to have rapidly declined. We have attempted to estimate the global SFRs for our galaxies using the total H luminosity within 1.5 from the MaNGA data and compared the measurements with those from GSWLC. This comparison has to be limited to a fraction of the MaNGA galaxies that have substantially high SNR in most of the spaxels. Basically, we found consistent SFR measurements with the GSWLC with no systematics over the full SFR range, though with a median offset of 0.11 dex in due to the limited spatial coverage of the MaNGA datacubes. More importantly, the PSB galaxies show similiar results to the parent MaNGA sample in this comparison, demonstrating that the different timescales for SFR between SEDs and H luminosities make little difference in our analyses of the PSB galaxies. This can be understood from the fact that, PSB regions happen only in parts of the host galaxies, thus contributing only to a fraction of the global SFR.
In the size-mass diagram as shown in the rightmost panel of Figure 2, the parent sample shows a broad distribution, and at fixed mass the populations with larger and smaller sizes roughly correspond to the star-forming and quiescent galaxy populations. This result echoes early studies of the size-mass relation of local galaxies (e.g. Shen et al., 2003), where galaxies with early-type and late-type morphologies showed distinct size-mass relations. As one can see, the PSB galaxies in our sample cover the full area of the parent MaNGA sample except the regime of smallest at fixed stellar mass, which are dominated by quiescent galaxies with smaller-than-average sizes. This is consistent with the left two diagrams where the PSB sample as a whole lacks the most quiescent or the reddest galaxies. When divided into different types, cPSB galaxies with intermediate masses () appear to be smaller than other types of PSB galaxies which follow more closely the parent sample. At lower masses, all types of PSB galaxies show similar distributions to the parent sample. We will further study the size-mass relation for the different types of PSB galaxies in the following subsection.
3.2 The size-mass relation
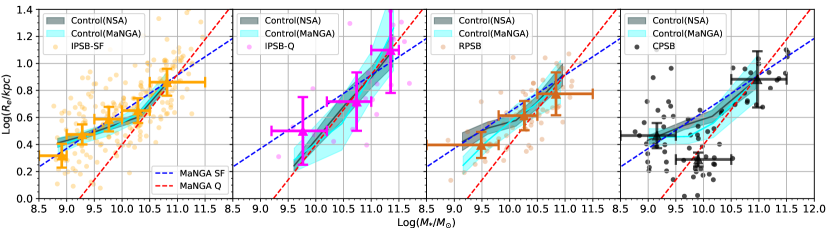
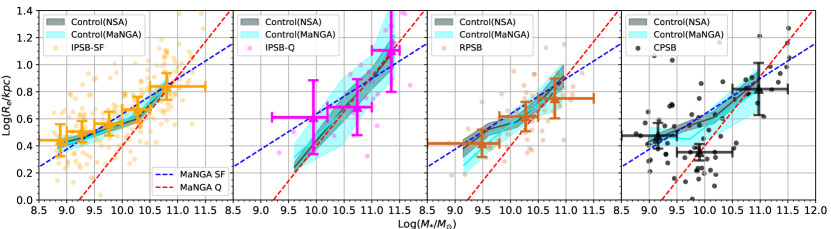
In Figure 3 we show the size-mass relation again, but for the different types of PSB galaxies separately (panels from left to right) and for sizes measured in three different photometric bands (panels from top to bottom). As we have seen from Figure 2, the size-mass relation strongly depends on the global star formation rate. Considering the wide coverage of the iPSB galaxies in the SFR-mass diagram, we divide them into two subsets according to their location in the diagram. This division results in 269 “iPSB-SF” galaxies located above the dividing line (solid red line in the left panel of Figure 2) and 41 “iPSB-Q” galaxies located below that line. For cPSB and rPSB samples we don’t attempt to further select subsamples considering both the limited sample sizes and the fact that they occupy relatively narrow ranges in SFR and color at fixed stellar mass. To take into account the dependence on mass and SFR and to make fair comparisons with normal galaxies, for each of the PSB samples we follow Chen et al. (2022) to select a “control” sample of galaxies from the MaNGA sample that is closely matched with the PSB galaxies in redshift, and SFR. In practice, we require the control sample to contain at most three nearest-matched galaxies for each PSB galaxy, with matching tolerances of , and . This gives rise to sufficient matches for 80% of the PSB galaxies in our sample. For the remaining 20% galaxies, we relax the tolerances to be , and in order to have at least one match for each PSB galaxy.
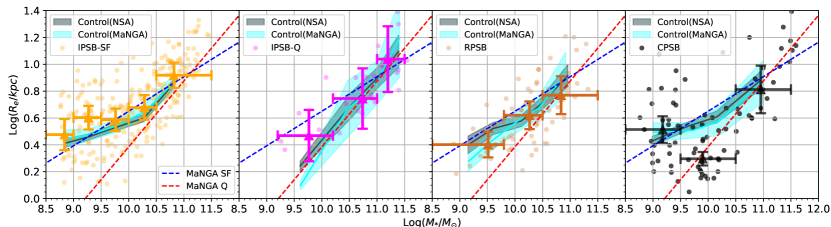
In Figure 3, panels from left to right compare the size-mass relation for PSB galaxies of type iPSB-SF, iPSB-Q, rPSB and cPSB with that of the corresponding control samples. Panels from top to bottom show the results for measured in SDSS , and band. For PSB samples, we show both individual galaxies in each sample (as the colored dots) and the median and scatter (as the big crosses), while for the control samples we only show the median and scatter for clarity (as the cyan band). The dashed lines in blue and red present the result for the star-forming and quiescent galaxies in the parent sample, and are repeated in every panel for reference. We find that, when divided by the PSB type, the PSB galaxies in our sample show different size-mass relations. The iPSB-SF and iPSB-Q types respectively follow the relations of the star-forming population (the blue dashed line in each panel) and the quiescent population (the red dashed line in each panel), while the rPSB type appears to fall in between. The cPSB galaxies follow the star-forming population at both high and low masses, but have relatively smaller sizes at intermediate masses () which are comparable to the sizes of the quiescent population. When compared to control galaxies selected from the parent MaNGA sample, the iPSB-SF, iPSB-Q and rPSB samples closely follow the relations of their control samples, while the cPSB galaxies with intermediate masses have a median size that is systematically smaller than that of the control sample. This result of the cPSB sample is well consistent with Chen et al. (2022, see their Figure 4)222We notice that the stellar masses and SFRs used in Chen et al. (2022) were from the MPA-JHU SDSS catalog. We have repeated our analysis using the same catalog and find similar results., where the SDSS-based PSB galaxies (thus similar to our cPSB galaxies in definition) are found to be smaller than control galaxies, also at .
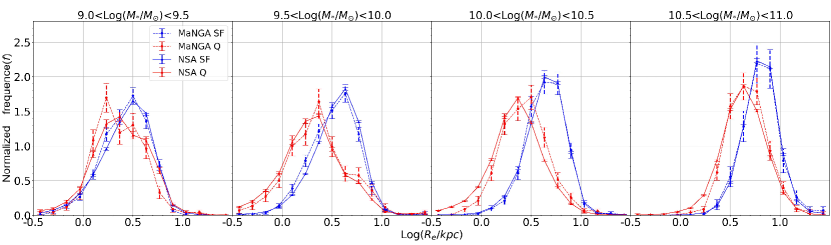
Although the MaNGA target galaxies are selected only by redshift and -band luminosity, the limited IFU sizes and the requirement for the galaxies to be covered by the IFUs out to a fixed radius (1.5 or 2.5) may have introduced size-related biases in the MaNGA sample. In Figure 4 we check this out by comparing the distribution of of the MaNGA galaxies in narrow bins of with the distribution of galaxies in a volume-limited sample, which is selected from NSA to have and . For MaNGA galaxies, the distributions are corrected for sample incompleteness with the -weighting method as mentioned above. At all masses, we see no significant differences in the size distributions, indicating that the MaNGA sample is unbiased in terms of galaxy size, and so our results on the size-mass relations presented above should be statistically robust and reliable. In addition, we have constructed another control sample from the NSA using the same tolerances, and we show the size-mass relations of this sample in Figure 3 as grey-shaded region. As can be seen, the two control samples agree well with each other, indicating again that the MaNGA sample provides unbiased results. Finally, size measurements from different bands lead to very similar size-mass relations for any given sample as can be seen in Figure 3, demonstrating that our results are robust to the adopted photometric band.
3.3 Recent star formation histories
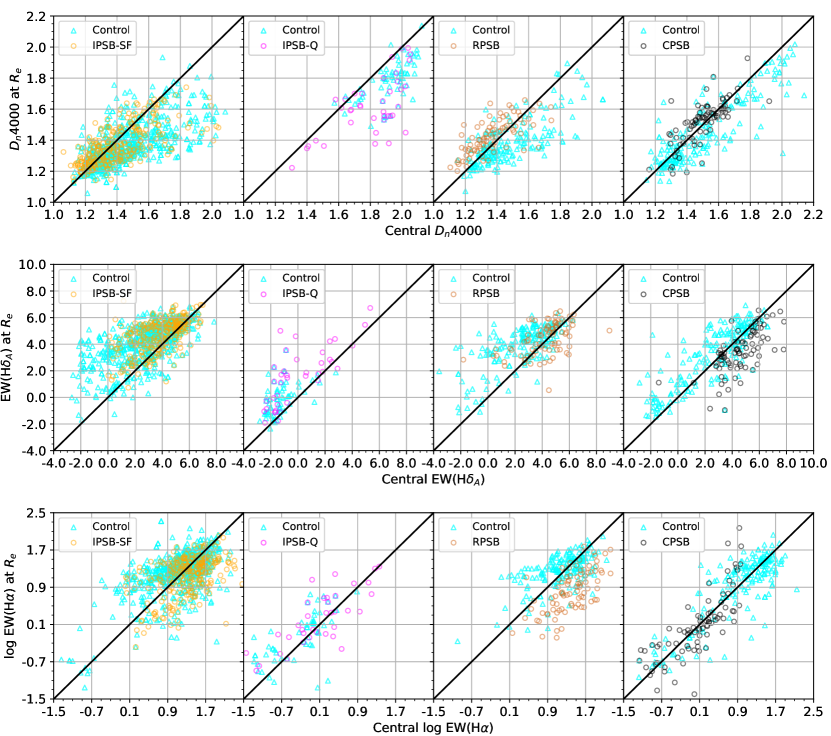
Following Li et al. (2015) and Wang et al. (2018), we use , and to indicate the recent star formation history (SFH) of the PSB galaxies and the control galaxies. It is well known that and are sensitive to young stellar populations formed in the past 1-2 Gyr and 0.1-1 Gyr, respectively, and that indicates the ongoing star formation. Therefore, the three parameters combine to provide a powerful diagnostic of the recent SFH. By comparing the three parameters in the center and outskirt of MaNGA galaxies, Li et al. (2015) and Wang et al. (2018) found massive galaxies with to present significant gradients in these parameters, indicative of an “inside-out” process for the star formation cessation, while less massive galaxies show weak or no gradients. In Figure 5, we compare the three parameters as measured at and in the central region for the four types of PSB galaxies. Panels from left to right correspond to samples of iPSB-SF, iPSB-Q, rPSB and cPSB, and panels from top to bottom are the results for , and . The corresponding control galaxies are also shown in each panel for comparison.
Overall, the different types of PSB galaxies behave differently. Most of the iPSB-SF galaxies present no or weak gradients in all the three parameters, with the central and outer regions showing similar values in all three parameters, which are consistent with the global star-forming status of the galaxies. Differently, most of the iPSB-Q galaxies present significant gradients in and , with larger and smaller (thus older stellar populations) in their center than in the outskirt, and their are comparably low (Å) in both central and outer regions. This result is consistent with the global quiescence of the iPSB-Q galaxies, and also consistent with the inside-out quenching picture as found previously for the general population of massive galaxies, in which the star formation cessation occurs first in the galactic center before extending to larger radii. We note that a small fraction of the iPSB-SF galaxies with relatively large and relatively small appear to deviate from the 1:1 relations, with the central region showing larger and smaller than the outskirt. Although still forming stars globally, these galaxies are likely to have just started the star formation cessation process, expected to further deviate from the 1:1 relation and follow up the iPSB-Q galaxies in the future. Eventually, both iPSB-SF and iPSB-Q galaxies will be fully quiescent, moving back to the 1:1 relation but with largest and smallest and . This result implies that the two types of iPSB galaxies follow a similar evolutionary pathway (i.e. the inside-out quenching process), but they are currently at different stages.
The rPSB and cPSB types appear to follow an evolutionary pathway different from the iPSB galaxies. In most cases, rPSB galaxies have small () and large (Å) in both central and outer regions, as well as large (Å) in the central region. This is consistent with the fact that this type of PSB galaxies mostly fall in the star-forming sequence in the SFR-mass diagram (see Figure 2). It is interesting that rPSB galaxies show smaller and larger in the center than in the outskirt, an effect that is opposite to any other type of galaxies. This indicates older populations and weaker star formation in the outskirt, and thus implies an “outside-in” quenching mode, if we assume these galaxies are starting to cease star formation as indicated by the presence of PSB regions in their outskirt. cPSB galaxies have small () and small (Å) in both central and outer regions, implying that these galaxies have ceased star formation in the recent past (within 1-2 Gyr). Their central regions have larger (Å) than the outer regions, implying that the star formation cessation occurs later in the central region than in the outskirt. These behaviors are also consistent with the “outside-in” quenching picture. Given the global star-forming status of the rPSB galaxies and the quiescent status of the cPSB galaxies, it is natural to conclude that the two types of PSB galaxies follow the outside-in mode of quenching, but are currently at different stages.
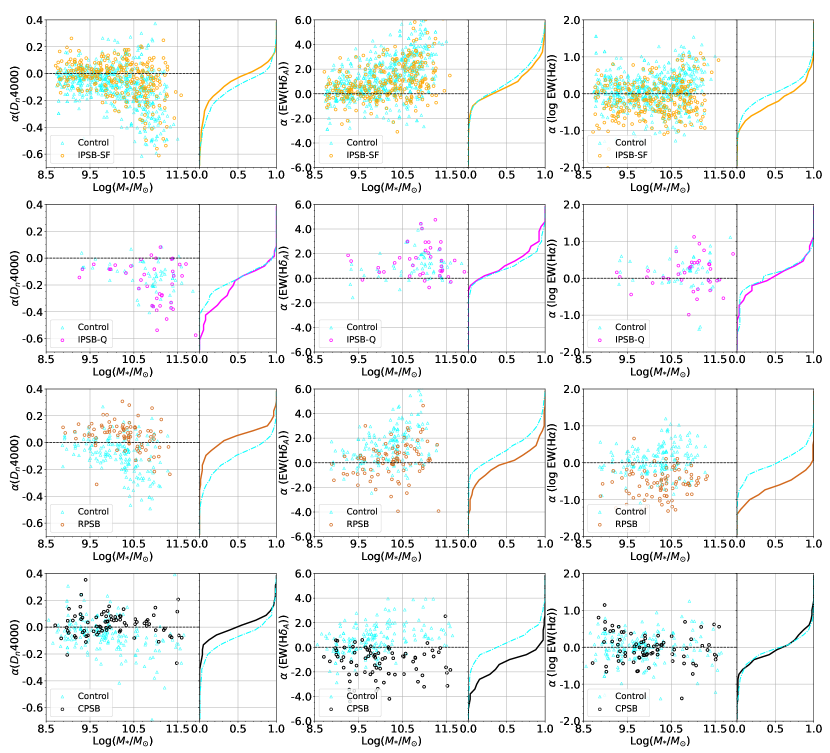
The distribution of the control galaxies varies from panel to panel, which can be understood by the dependence on stellar mass as found in Wang et al. (2018). When compared to the control samples, both iPSB-SF and iPSB-Q galaxies are similar to (though not exactly the same as) the corresponding control galaxies, while rPSB and cPSB galaxies are quite different from their control samples. This is more clearly seen in Figure 6, where we plot the gradient of the three diagnostic parameters as a function of for both the PSB samples and the control samples. The gradient of a parameter is defined as the difference of its value at from that in the center. On the right side of each panel, we also show the cumulative distributions of the diagnostic parameters. As can be seen, for a given parameter all the control samples show similar trends between the parameter gradient and the stellar mass, with a weak dependence on the type of the PSB galaxies. Consistent with Wang et al. (2018), control galaxies at present significant gradients in and , and no/weak gradients at lower masses. Compared to the control samples, both iPSB-SF and iPSB-Q galaxies show high similarities. In contrast, both rPSB and cPSB galaxies show different gradients in all parameters except in case of the cPSB sample. These results suggest again that the PSB galaxies in our sample can be divided into two broad categories according to their evolutionary pathway: (i) iPSB-SF and iPSB-Q to follow the inside-out quenching mode as found for the majority of the general population galaxies, and (ii) rPSB and cPSB to follow the outside-in quenching mode.
3.4 The fraction of PSB regions
In this subsection, we further consider the potential dependence of the size-mass relation and recent SFH on the fraction of PSB regions in our galaxies. The fraction of PSB regions, , is defined by the mass-weighted fraction of spaxels that belong to the PSB regions within a given galactic radius ,
| (1) |
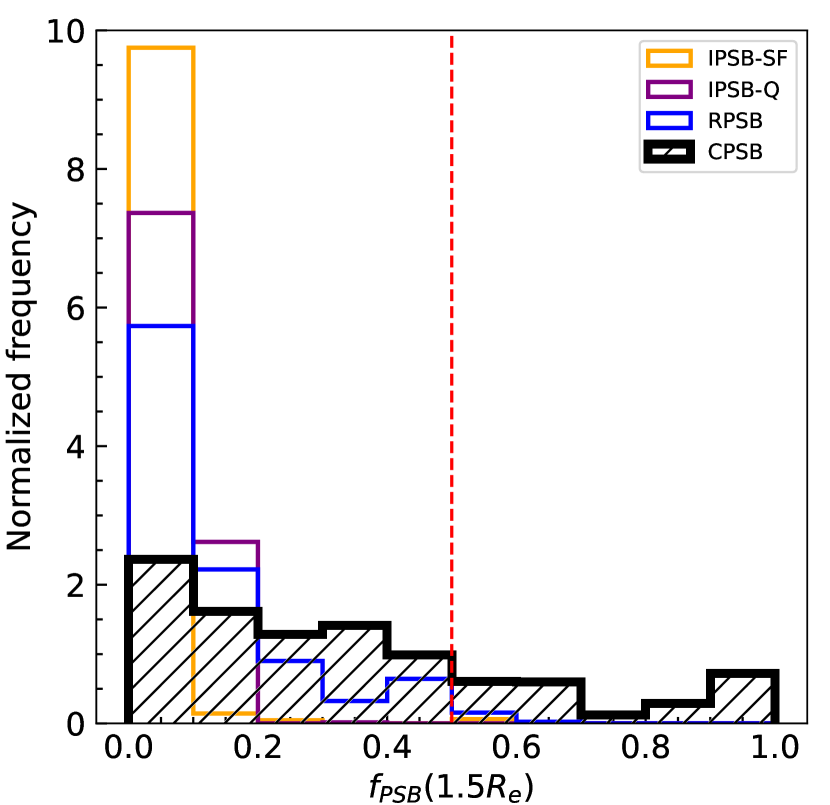
Here is the stellar mass of the th spaxel, or depending on whether the th spaxel belongs to any PSB region, and . Figure 7 shows the histograms of for the different PSB samples. We see that both iPSB and rPSB galaxies exclusively have relatively small fractions of PSB regions with , while the cPSB galaxies span a full range of . We find 23.3% of the cPSB sample to have , after the -weighting scheme is applied to correct for sample incompleteness.
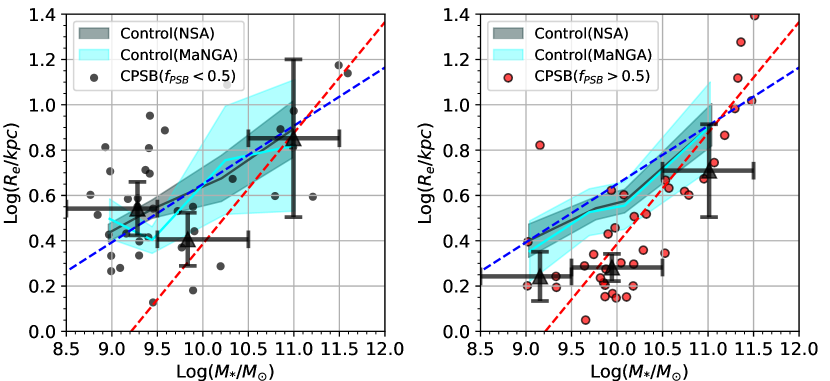
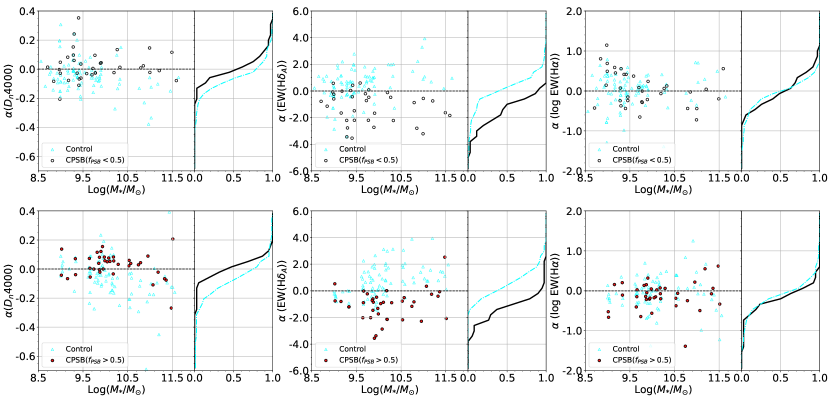
We divide the cPSB sample into two subsamples at , and for each subsample we repeat the analysis of the size-mass relation and recent SFH in the same way as above. Figure 8 shows the size-mass relations, and Figure 9 shows the slope indices of the three SFH diagnostics as a function of stellar mass. Overall, the size-mass relations and recent SFHs of the two subsamples are similar to what we found above for the cPSB galaxies as a whole, implying that our main results are not dependent on the PSB fraction of the galaxies. It is interesting to note that the cPSB galaxies with have higher masses as well as smaller sizes at fixed mass when compared to those with .
4 Discussion
4.1 Implications of the size-mass relation
A number of previous studies have investigated the structure and/or the size-mass relation of PSB galaxies at different redshifts, and consistently concluded that the PSB galaxies are more compact relative to coeval star-forming and quiescent galaxies (e.g. Whitaker et al., 2012; Yano et al., 2016; Wu et al., 2018, 2020; Chen et al., 2022; Setton et al., 2022). For instance, using the NEWFIRM Medium-Band Survey (NMBS), Whitaker et al. (2012) found a large population of PSB galaxies at , which had smaller sizes than older galaxies at those redshifts. With the same survey, Yano et al. (2016) examined the structure of galaxies at with different spectral types as classified using the UV-to-NIR spectral energy distributions (SEDs), and found the PSB galaxies at to be significantly smaller than any other types of galaxies at the same redshift. Wu et al. (2018) analyzed the spectroscopically selected PSB galaxies at from the LEGA-C survey, and found these galaxies are much smaller than expected from the global relation of normal quiescent galaxies. A similar result has been recently obtained by Setton et al. (2022) for the PSB galaxies from the SQuIGGLE sample, also at , which lie 0.1dex below the size-mass relation of quiescent galaxies. For the local universe, Chen et al. (2022) have recently studied the size-mass relation of the PSB galaxies in the SDSS, which are similar to the cPSB galaxies in our sample in the sense that the PSB feature is limited to the central 1-2 kpc of these galaxies. Consistent with their result, our cPSB galaxies at intermediate masses () present smaller half-light radii than control galaxies of similar mass and SFR. The smaller size of the PSB galaxies at fixed mass as consistently found in previous studies and for different redshifts have been usually attributed to mergers or other violent events, which can drive gas inward and trigger or enhance the star formation in the inner region of galaxies. Obviously, this is consistent with galaxy mergers as the origin of PSB galaxies, as discussed in section 1.
Thanks to the spatially resolved spectroscopy from MaNGA, our sample additionally includes other types of PSB galaxies in which the PSB regions are located beyond the galactic center. We find the different types of PSB galaxies to show different size-mass relations. In particular, the smaller size at fixed mass as previously found for intermediate-mass galaxies holds only for cPSB galaxies in our sample. Differently, the iPSB and rPSB closely follow the size-mass relation of the control galaxies. Our result of the size-mass relation further complicates the evolution picture of PSB galaxies, which cannot be purely attributed to galaxy mergers. Rather, PSB galaxies as a whole must follow diverse evolutionary pathways, depending on both stellar mass and the location of the PSB regions.
4.2 Two broad categories of evolution pathways
PSB galaxies are widely thought to be in a transition phase between star-forming galaxies and quiescent galaxies. The paucity of both the “green-valley” galaxies and the PSB galaxies imply that the time-scale of the transition phase must be very short. However, the importance of the PSB phase in galaxy evolution has been questioned by some observational studies. For instance, the large reservoirs of cold gas detected in many low- PSB galaxies (e.g. Chang et al., 2001; Buyle et al., 2006; Zwaan et al., 2013; French et al., 2015) are in conflict with the gas-poor nature of quenched galaxies, and the low incidence of PSB galaxies in some galaxy clusters at intermediate redshifts is insufficient to explain the quiescent galaxy population in those clusters (e.g. De Lucia et al., 2009; Dressler et al., 2013). Dressler et al. (2013) suggested that the PSB galaxies in both clusters and the field are already quiescent, but passing through a brief PSB phase of the evolutionary cycle within the quiescent sequence, which could be triggered by tidal interactions or mergers with low-mass gas-rich companions. More recently, in a comprehensive study of the PSB galaxies in the SDSS, Pawlik et al. (2018) found evidence for three different pathways of galaxies that can lead to a PSB phase, all triggered by violent events such as galaxy mergers: (1) gas-rich major mergers causing the transformation of blue-cloud galaxies (via the PSB phase) to the red sequence, accounting for 60-70% of the PSB galaxies in their sample, (2) less violent events causing the cyclic evolution of low-mass star-forming galaxies within the blue cloud (the blue-PSB-blue cycle), and (3) less violent events causing the cyclic evolution of massive quiescent galaxies within the red sequence (the red-PSB-red cycle). The three different pathways of PSB galaxies and their merger origin are nicely illustrated by Pawlik et al. (2019) based on the Evolution and Assembly of GaLaxies and their Environments (EAGLE) cosmological simulation. It is interesting that the same simulation additionally presents a fourth pathway of a PSB phase, in which the rapid decline in the star formation of a galaxy is caused by environmental effects such as ram-pressure stripping, without leading to morphological transformation (Pawlik et al., 2019).
Since the PSB galaxies in Pawlik et al. (2018) were selected with the SDSS single-fiber spectroscopy, the PSB feature is limited to the central 1-2 kpc of their galaxies, similar to the case of cPSB galaxies in our work. Therefore, the three evolutionary pathways suggested by those authors should be relevant only to the cPSB type. Although the situation becomes more complex when the other types are included, our results indicate that the PSB galaxies as a whole can be divided into two broad categories according to their recent SFH. The first category consists of the iPSB-SF and iPSB-Q types, which present high similarities to the corresponding control samples in all the three SFH diagnostic parameters, likely to follow an inside-out quenching process as previously found for the general galaxy population. The other category consists of the cPSB and rPSB types of galaxies, which present younger stellar populations in the center than in the outskirt, thus likely to follow an outside-in quenching process. The three evolutionary pathways suggested by Pawlik et al. (2018) should be applied only to the cPSB type, and so they all belong to the second category. The limited size of our sample doesn’t allow us to distinguish the three pathways of the cPSB type as done in Pawlik et al. (2018), but one can well expect so if a sufficiently large sample becomes available considering the (almost) same selection criteria of our cPSB galaxies and the SDSS-based PSB galaxies.
We note that, when discussing the quenching pathways we haven’t considered the quenching of an already quenched but recently “rejuvenated” galaxy (e.g. caused by a merger-induced central starburst), which is not the same as the original quenching prior to rejuvenation. For a given spaxel, to distinguish these two quenching processes would need careful stellar population synthesis modeling. For a galaxy in which the onset of quenching varies radially as indicated by radial gradients of the recent SFH in relatively massive galaxies (e.g. Wang et al., 2018), the original quenching and the quenching after rejuvenation can be distinguished according to the radial variation of the three SFH diagnostic parameters. For instance, we can certainly rule out the case of quenching after a central starburst for most of our galaxies. In this case, one would expect small in the central region due to the recent starburst as well as large in the originally quenched outerskirt. As can be seen from the first row of Figure 5, however, we find almost no spaxels to be located in the upper-left corner of the diagram for all the PSB types. All the galaxies are found at either the lower-left corner with relatively low or the upper-right corner (below the 1:1 relation) with large , in both the center and the outskirt. This fact suggests the original quenching to be the dominant quenching process for the galaxies in our sample. One exception may happen if the central starburst occurs very recently. In this case, the in the central region doesn’t have time to substantially decrease, and as a result the galaxy would have similarly large at both the center and outskirt and meanwhile have large central and weak at the outerskirt. Such cases are not observed in Figure 5, too. This imply that, it rarely happens that a fully-quenched galaxy becomes rejuvenated and restarts quenching only in their central region; rather, it is more likely that star formation rejuvenation happens over a wide range of galactic radii (although the central region may be more enhanced in star formation due to the merger-driven gas inflow), and the consequent quenching happens earlier at larger radii and propagates inward (thus still in an outside-in manner). In any case, the outside-in quenching inferred from our data for the cPSB and rPSB galaxies cannot be a consequence of a central starburst.
4.3 The evolutionary relation between rPSB and cPSB types
The rPSB and cPSB types are similar in and , but different in , with the rPSB galaxies showing larger in their centers. As a result, the rPSB galaxies mostly fall in the star-forming sequence and the blue cloud, while the cPSB galaxies mostly fall below the star-forming sequence and in the green valley. These similarities and differences appear to suggest that the rPSB and cPSB may have the same origin (e.g. mergers or environmental effects) but at different evolutionary stages. In the outside-in quenching process as inferred for both types, the cessation of the star formation in a galaxy in this category will first happen in its outskirt, and then extends to smaller radii. During this process, the galaxy will be observed as a rPSB galaxy at an early stage, and then a cPSB galaxy later on.
The two types also differ in the size-mass relation. The rPSB type follows the same relation as the control sample and the average relation of star-forming galaxies, while the cPSB galaxies have smaller half-light radii at intermediate-to-low masses. This result is also consistent with the rPSB galaxies being progenitors of cPSB galaxies. In a recent study of PSB galaxies at , Setton et al. (2022) studied the evolution of the PSB galaxy properties as a function of the time since the star formation was quenched. The sizes of PSB galaxies were found to show a negative or no correlation with the time since quenching. If the outside-in process is taken into account, one would expect a PSB galaxy to become smaller or similarly sized when it evolves to a later stage as a cPSB galaxy. This conjecture can be tested using current hydrodynamic simulations of galaxy formation.
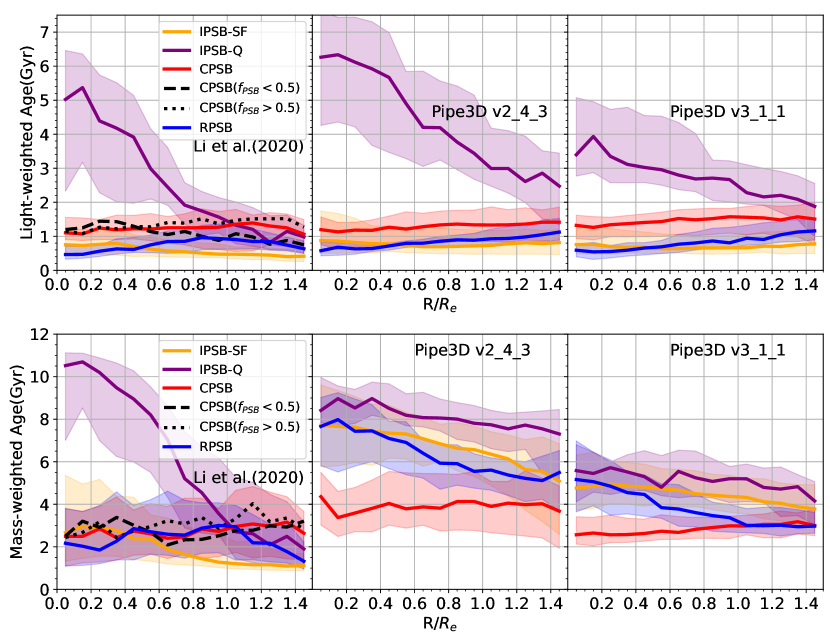
We note that, in an earlier study of the MaNGA-based PSB galaxy sample, Chen et al. (2019) found the rPSB and cPSB galaxies are quite different in the radial gradient in mass-weighted stellar age, based on data products produced by the spectral fitting code Pipe3D (Sánchez et al., 2016). This result indicated that cPSB and rPSB are not simply different evolutionary stages of the same event. Instead of using stellar population properties derived from the technique of stellar population synthesis such as Pipe3D, in our work we opt for the three SFH indicators which are directly measured from the stacked spectrum of each region and thus are model-independent. In fact, the spectral fitting code used in this work also provides measurements of stellar population properties. In Figure 10, we compare the radial gradients in both light-weighted (upper panels) and mass-weighted (lower panels) age for the four types of PSB samples, as obtained by applying our code (the left panels) and the Pipe3D (version 2.4.3; the middle panels) which is the same version as used in Chen et al. (2019). In addition, in the rightmost panels, we show the results based on the new version of Pipe3D (version 3.1.1) which has replaced the stellar library of MILES by the recently available library of MaStar (Yan et al., 2019). As can be seen, the different codes produce similar results for light-weighted age, but the mass-weighted profiles are quite different, particularly for the rPSB sample (the blue lines) and the iPSB-SF sample (the yellow lines). The strong (negative) gradients in mass-weighted age for the rPSB type and the flat profile for the cPSB as reported in Chen et al. (2019) are also seen in our figure (the middle lower panel). However, the gradient in the rPSB galaxies becomes rather weak when the new version of Pipe3D is applied, a result which is close to (though not exactly the same as) the result of our code where we see little difference between the cPSB and rPSB samples. The discrepancies between the different codes reflect the known issue of stellar population modeling which suffers from strong degeneracies between model parameters such as age, metallicity, dust attenuation, etc.
In the left-hand panels of Figure 10, we also show the stellar age profiles for the two subsamples of cPSB galaxies, with and as analyzed in subsection 3.4. It is seen that the two subsamples show very similar profiles, implying that the cPSB galaxies of different fall in the same category as mentioned above. The broad range of found for the cPSB galaxies may reflect the galaxy-to-galaxy variation of the relative timescales between the PSB phase and the overall quenching procedure of the host galaxy. If so, the quenching timescale must be somehow dependent on the stellar mass of galaxies, as indicated by the correlation of with (see subsection 3.4).
Otter et al. (2022) have recently analyzed ALMA observations of the 12CO(0-1) distribution in 13 cPSB and rPSB galaxies selected from the MaNGA survey. Their results show stellar disturbances as well as centrally concentrated and highly disturbed molecular gas in both cPSB and rPSB galaxies, indicating a common merger origin. If the two types of galaxies have distinct origins and are not sequential evolutionary phases, as pointed out by Otter et al. (2022), a natural question would arise: why do some mergers lead to a cPSB phase whereas others lead to a rPSB phase? The authors suggested that outflows could be an alternative process primarily impacting cPSB galaxies, considering the fact that this type of galaxies are more disturbed in both ionized and molecular gas when compared to rPSB galaxies. Using integral-field spectroscopy from the SAMI Galaxy Survey, Owers et al. (2019) found that the PSB galaxies in galaxy clusters mostly present PSB regions in their outskirt, and concluded that these galaxies follow an outside-in quenching driven by ram pressure stripping.
In summary, the rPSB type of galaxies appear to have multiple origins depending on environment. The majority of rPSB galaxies, which are located in the field and loose groups with dynamical conditions more favorable for galaxy interactions and mergers, are likely to have the same merger origin and experience the same sequential evolutionary pathway as the cPSB type. For those located in dense environments such as galaxy clusters, ram-pressure stripping may play a more important role. Both mergers and ram-pressure stripping lead to outside-in quenching.
4.4 The evolutionary relation between iPSB-SF and iPSB-Q types
The majority of the PSB galaxies in our sample are classified as iPSB, either iPSB-SF or iPSB-Q according to their global SFR, and these two types behave similarly in many aspects including the size-mass relation and the SFH indicators. They differ mainly by the global SFR, by definition, with one in the star-forming sequence and one in the quiescent sequence. Thus, it is natural to speculate that they are different evolutionary stages of the same evolutionary pathway, with the iPSB-SF type being progenitors of the iPSB-Q type. However, we would like to caution that this conjecture may be true only for a portion of the iPSB galaxies; for some galaxies, the iPSB-SF and iPSB-Q types may be induced by distinct events. For instance, “rejuvenated” star formation in the outskirt of an already quiescent galaxy due to recent gas accretion can lead to an iPSB phase, after which the galaxy returns to the quiescent sequence. This is similar to the red-PSB-red cycle as proposed in previous studies (e.g. Dressler et al., 2013; Pawlik et al., 2018). More detailed studies of the stellar populations and environment for these types of galaxies, both observational and theoretical, would be needed in future when larger samples and more reliable techniques of stellar population synthesis become available.
5 Summary
In this work, we use the spatially resolved spectroscopy from the final data release of the MaNGA survey to identify post-starburst galaxies (PSB) in the local Universe. The PSB galaxies are identified in a two-step method. For each galaxy from MaNGA, we first select regions with a size of kpc and strong H absorption, from which we then select PSB regions that have relatively weak H emission. For each region, we have stacked the original spectra of its spaxels to obtain a spectrum of high S/N, and we perform full spectral fitting to the stacked spectrum to measure emission line parameters and stellar indices that are used for the identification and scientific analysis in this work. Out of the 10,010 galaxies from MaNGA, we have identified a sample of 489 PSB galaxies, each with at least one PSB region. These galaxies are then classified into three different types according to the location of their PSB regions: 94 cPSB galaxies in which the PSB regions are found at the galactic center, 85 rPSB galaxies in which the PSB regions are off-center and form a ring-like shape, and 310 iPSB galaxies in which the PSB regions present irregular locations and shapes. Each of the iPSB galaxies is further classified as either iPSB-SF if located in the star-forming sequence in the diagram of star formation rate (SFR) versus stellar mass, or iPSB-Q if located in the quiescent sequence in the same diagram.
We first compare the size-mass relation of the four types of PSB galaxies with control samples of normal galaxies that are closely matched in redshift, stellar mass and SFR. We then study the recent star formation history (SFH) of the PSB samples and the corresponding control samples, using three spectral indices to indicate the recent SFH: (equivalent width of the H emission line), (equivalent width of the H absorption line), and (depth of the break at 4000Å). In addition, we examine the potential dependence on the fraction of PSB regions in our galaxies.
Our conclusions can be summarized as follows.
-
•
Different types of PSB galaxies show different size-mass relations: iPSB-SF galaxies closely follow the size-mass relation of normal star-forming galaxies, iPSB-Q galaxies follow the relation of quiescent galaxies, rPSB galaxies appear to fall in between, and cPSB galaxies follow the relation of star-forming galaxies at both high and low masses and that of quiescent galaxies at intermediate masses.
-
•
When compared to control galaxies of similar SFR, redshift, and mass, the cPSB galaxies have smaller sizes at , while the other types of PSB galaxies show similar sizes to their control galaxies at a given mass.
-
•
The iPSB-SF sample shows no/weak gradients in , and , consistent with the global star-forming status of this type of galaxies.
-
•
The iPSB-Q sample shows negative gradients in , positive gradients in , and no gradients in . This result indicates older stellar populations in the inner regions, consistent with an “inside-out” quenching process.
-
•
The cPSB sample shows positive gradients in , negative gradients in , and no gradients in , indicating younger stellar populations in the inner regions and an “outside-in” quenching process.
-
•
The rPSB sample is similar to the cPSB sample in the gradients in both and , but shows negative gradients in . This result implies that rPSB and cPSB galaxies are different stages of the same evolutionary pathway.
-
•
Both rPSB and iPSB galaxies have relatively small fractions of PSB regions, with within 1.5, while cPSB galaxies spand a full range in . The size-mass relation and recent SFHs of cPSB galaxies show no dependence on .
-
•
The four types of PSB galaxies can be broadly divided into two categories in terms of evolutionary pathway: (1) iPSB-SF and iPSB-Q in the first category which have similar SFH to normal galaxies and appear to prefer an inside-out quenching process, and (2) cPSB and rPSB in the other category which prefer an outside-in quenching process, likely driven by disruption events such as mergers which make the galaxies more compact than the average quiescent galaxies.
Acknowledgments
We’re grateful to the anonymous referee for the helpful comments on our paper. This work is supported by the National Key R&D Program of China (grant No. 2022YFA1602902), and the National Natural Science Foundation of China (grant Nos. 11821303, 11733002, 11973030, 11673015, 11733004, 11761131004, 11761141012).
Funding for the Sloan Digital Sky Survey IV has been provided by the Alfred P. Sloan Foundation, the U.S. Department of Energy Office of Science, and the Participating Institutions.
SDSS-IV acknowledges support and resources from the Center for High Performance Computing at the University of Utah. The SDSS website is www.sdss.org.
SDSS-IV is managed by the Astrophysical Research Consortium for the Participating Institutions of the SDSS Collaboration including the Brazilian Participation Group, the Carnegie Institution for Science, Carnegie Mellon University, Center for Astrophysics — Harvard & Smithsonian, the Chilean Participation Group, the French Participation Group, Instituto de Astrofísica de Canarias, The Johns Hopkins University, Kavli Institute for the Physics and Mathematics of the Universe (IPMU) / University of Tokyo, the Korean Participation Group, Lawrence Berkeley National Laboratory, Leibniz Institut für Astrophysik Potsdam (AIP), Max-Planck-Institut für Astronomie (MPIA Heidelberg), Max-Planck-Institut für Astrophysik (MPA Garching), Max-Planck-Institut für Extraterrestrische Physik (MPE), National Astronomical Observatories of China, New Mexico State University, New York University, University of Notre Dame, Observatário Nacional / MCTI, The Ohio State University, Pennsylvania State University, Shanghai Astronomical Observatory, United Kingdom Participation Group, Universidad Nacional Autónoma de México, University of Arizona, University of Colorado Boulder, University of Oxford, University of Portsmouth, University of Utah, University of Virginia, University of Washington, University of Wisconsin, Vanderbilt University, and Yale University.
References
- Abdurro’uf et al. (2021) Abdurro’uf, Accetta, K., Aerts, C., et al. 2021, arXiv e-prints, arXiv:2112.02026. https://arxiv.org/abs/2112.02026
- Almaini et al. (2017) Almaini, O., Wild, V., Maltby, D. T., et al. 2017, MNRAS, 472, 1401, doi: 10.1093/mnras/stx1957
- Arnouts et al. (2007) Arnouts, S., Walcher, C. J., Le Fèvre, O., et al. 2007, A&A, 476, 137, doi: 10.1051/0004-6361:20077632
- Baldry et al. (2004) Baldry, I. K., Glazebrook, K., Brinkmann, J., et al. 2004, ApJ, 600, 681, doi: 10.1086/380092
- Balogh et al. (1999) Balogh, M. L., Morris, S. L., Yee, H. K. C., Carlberg, R. G., & Ellingson, E. 1999, ApJ, 527, 54, doi: 10.1086/308056
- Bell et al. (2004) Bell, E. F., Wolf, C., Meisenheimer, K., et al. 2004, ApJ, 608, 752, doi: 10.1086/420778
- Bezanson et al. (2022) Bezanson, R., Spilker, J. S., Suess, K. A., et al. 2022, ApJ, 925, 153, doi: 10.3847/1538-4357/ac3dfa
- Blake et al. (2004) Blake, C., Pracy, M. B., Couch, W. J., et al. 2004, MNRAS, 355, 713, doi: 10.1111/j.1365-2966.2004.08351.x
- Blanton et al. (2011) Blanton, M. R., Kazin, E., Muna, D., Weaver, B. A., & Price-Whelan, A. 2011, AJ, 142, 31, doi: 10.1088/0004-6256/142/1/31
- Blanton et al. (2017) Blanton, M. R., Bershady, M. A., Abolfathi, B., et al. 2017, AJ, 154, 28, doi: 10.3847/1538-3881/aa7567
- Bruzual & Charlot (2003) Bruzual, G., & Charlot, S. 2003, MNRAS, 344, 1000, doi: 10.1046/j.1365-8711.2003.06897.x
- Bundy et al. (2005) Bundy, K., Ellis, R. S., & Conselice, C. J. 2005, ApJ, 625, 621, doi: 10.1086/429549
- Bundy et al. (2015) Bundy, K., Bershady, M. A., Law, D. R., et al. 2015, ApJ, 798, 7, doi: 10.1088/0004-637X/798/1/7
- Buyle et al. (2006) Buyle, P., Michielsen, D., De Rijcke, S., et al. 2006, ApJ, 649, 163, doi: 10.1086/505633
- Byrd & Valtonen (1990) Byrd, G., & Valtonen, M. 1990, ApJ, 350, 89, doi: 10.1086/168362
- Caldwell & Rose (1997) Caldwell, N., & Rose, J. A. 1997, AJ, 113, 492, doi: 10.1086/118271
- Chabrier (2003) Chabrier, G. 2003, PASP, 115, 763, doi: 10.1086/376392
- Chang et al. (2001) Chang, T.-C., van Gorkom, J. H., Zabludoff, A. I., Zaritsky, D., & Mihos, J. C. 2001, AJ, 121, 1965, doi: 10.1086/319959
- Chen et al. (2022) Chen, X., Lin, Z., Kong, X., et al. 2022, arXiv e-prints, arXiv:2206.00662. https://arxiv.org/abs/2206.00662
- Chen et al. (2019) Chen, Y.-M., Shi, Y., Wild, V., et al. 2019, MNRAS, 489, 5709, doi: 10.1093/mnras/stz2494
- Couch et al. (1998) Couch, W. J., Barger, A. J., Smail, I., Ellis, R. S., & Sharples, R. M. 1998, ApJ, 497, 188, doi: 10.1086/305462
- Couch et al. (1994) Couch, W. J., Ellis, R. S., Sharples, R. M., & Smail, I. 1994, ApJ, 430, 121, doi: 10.1086/174387
- De Lucia et al. (2009) De Lucia, G., Poggianti, B. M., Halliday, C., et al. 2009, MNRAS, 400, 68, doi: 10.1111/j.1365-2966.2009.15435.x
- Domínguez Sánchez et al. (2022) Domínguez Sánchez, H., Margalef, B., Bernardi, M., & Huertas-Company, M. 2022, MNRAS, 509, 4024, doi: 10.1093/mnras/stab3089
- Dressler & Gunn (1983) Dressler, A., & Gunn, J. E. 1983, ApJ, 270, 7, doi: 10.1086/161093
- Dressler et al. (1994) Dressler, A., Oemler, Augustus, J., Butcher, H. R., & Gunn, J. E. 1994, ApJ, 430, 107, doi: 10.1086/174386
- Dressler et al. (2013) Dressler, A., Oemler, Augustus, J., Poggianti, B. M., et al. 2013, ApJ, 770, 62, doi: 10.1088/0004-637X/770/1/62
- Drory et al. (2015) Drory, N., MacDonald, N., Bershady, M. A., et al. 2015, AJ, 149, 77, doi: 10.1088/0004-6256/149/2/77
- Faber et al. (2007) Faber, S. M., Willmer, C. N. A., Wolf, C., et al. 2007, ApJ, 665, 265, doi: 10.1086/519294
- French et al. (2015) French, K. D., Yang, Y., Zabludoff, A., et al. 2015, ApJ, 801, 1, doi: 10.1088/0004-637X/801/1/1
- French et al. (2022) French, K. D., Smercina, A., Rowlands, K., et al. 2022, arXiv e-prints, arXiv:2204.07465. https://arxiv.org/abs/2204.07465
- Goto (2005) Goto, T. 2005, MNRAS, 357, 937, doi: 10.1111/j.1365-2966.2005.08701.x
- Goto (2006) —. 2006, MNRAS, 369, 1765, doi: 10.1111/j.1365-2966.2006.10413.x
- Goto (2007) —. 2007, MNRAS, 381, 187, doi: 10.1111/j.1365-2966.2007.12227.x
- Goto et al. (2008) Goto, T., Kawai, A., Shimono, A., et al. 2008, MNRAS, 386, 1355, doi: 10.1111/j.1365-2966.2008.12916.x
- Greene et al. (2021) Greene, O. A., Anderson, M. R., Marinelli, M., et al. 2021, ApJ, 910, 162, doi: 10.3847/1538-4357/abe4d1
- Gunn & Gott (1972) Gunn, J. E., & Gott, J. Richard, I. 1972, ApJ, 176, 1, doi: 10.1086/151605
- Gunn et al. (2006) Gunn, J. E., Siegmund, W. A., Mannery, E. J., et al. 2006, AJ, 131, 2332, doi: 10.1086/500975
- Hogg et al. (2006) Hogg, D. W., Masjedi, M., Berlind, A. A., et al. 2006, ApJ, 650, 763, doi: 10.1086/507172
- Kauffmann et al. (2003) Kauffmann, G., Heckman, T. M., White, S. D. M., et al. 2003, MNRAS, 341, 33, doi: 10.1046/j.1365-8711.2003.06291.x
- Lanz et al. (2022) Lanz, L., Stepanoff, S., Hickox, R. C., et al. 2022, arXiv e-prints, arXiv:2207.00607. https://arxiv.org/abs/2207.00607
- Law et al. (2015) Law, D. R., Yan, R., Bershady, M. A., et al. 2015, AJ, 150, 19, doi: 10.1088/0004-6256/150/1/19
- Law et al. (2016) Law, D. R., Cherinka, B., Yan, R., et al. 2016, AJ, 152, 83, doi: 10.3847/0004-6256/152/4/83
- Li et al. (2015) Li, C., Wang, E., Lin, L., et al. 2015, ApJ, 804, 125, doi: 10.1088/0004-637X/804/2/125
- Li et al. (2020) Li, N., Li, C., Mo, H., et al. 2020, ApJ, 896, 38, doi: 10.3847/1538-4357/ab92a1
- Liang et al. (2020) Liang, F.-H., Li, C., Li, N., et al. 2020, ApJ, 896, 121, doi: 10.3847/1538-4357/ab9596
- Maltby et al. (2018) Maltby, D. T., Almaini, O., Wild, V., et al. 2018, MNRAS, 480, 381, doi: 10.1093/mnras/sty1794
- Meusinger et al. (2017) Meusinger, H., Brünecke, J., Schalldach, P., & in der Au, A. 2017, A&A, 597, A134, doi: 10.1051/0004-6361/201629139
- Moore et al. (1996) Moore, B., Katz, N., Lake, G., Dressler, A., & Oemler, A. 1996, Nature, 379, 613, doi: 10.1038/379613a0
- Moore et al. (1998) Moore, B., Lake, G., & Katz, N. 1998, ApJ, 495, 139, doi: 10.1086/305264
- Newman et al. (2012) Newman, A. B., Ellis, R. S., Bundy, K., & Treu, T. 2012, ApJ, 746, 162, doi: 10.1088/0004-637X/746/2/162
- Oemler et al. (1997) Oemler, Augustus, J., Dressler, A., & Butcher, H. R. 1997, ApJ, 474, 561, doi: 10.1086/303472
- Otter et al. (2022) Otter, J. A., Rowlands, K., Alatalo, K., et al. 2022, ApJ, 941, 93, doi: 10.3847/1538-4357/ac9dee
- Owers et al. (2019) Owers, M. S., Hudson, M. J., Oman, K. A., et al. 2019, ApJ, 873, 52, doi: 10.3847/1538-4357/ab0201
- Paccagnella et al. (2017) Paccagnella, A., Vulcani, B., Poggianti, B. M., et al. 2017, ApJ, 838, 148, doi: 10.3847/1538-4357/aa64d7
- Pawlik et al. (2019) Pawlik, M. M., McAlpine, S., Trayford, J. W., et al. 2019, Nature Astronomy, 3, 440, doi: 10.1038/s41550-019-0725-z
- Pawlik et al. (2016) Pawlik, M. M., Wild, V., Walcher, C. J., et al. 2016, MNRAS, 456, 3032, doi: 10.1093/mnras/stv2878
- Pawlik et al. (2018) Pawlik, M. M., Taj Aldeen, L., Wild, V., et al. 2018, MNRAS, 477, 1708, doi: 10.1093/mnras/sty589
- Poggianti et al. (1999) Poggianti, B. M., Smail, I., Dressler, A., et al. 1999, ApJ, 518, 576, doi: 10.1086/307322
- Pracy et al. (2009) Pracy, M. B., Kuntschner, H., Couch, W. J., et al. 2009, MNRAS, 396, 1349, doi: 10.1111/j.1365-2966.2009.14836.x
- Salim et al. (2016) Salim, S., Lee, J. C., Janowiecki, S., et al. 2016, ApJS, 227, 2, doi: 10.3847/0067-0049/227/1/2
- Sánchez et al. (2012) Sánchez, S. F., Rosales-Ortega, F. F., Marino, R. A., et al. 2012, A&A, 546, A2, doi: 10.1051/0004-6361/201219578
- Sánchez et al. (2016) Sánchez, S. F., Pérez, E., Sánchez-Blázquez, P., et al. 2016, Rev. Mexicana Astron. Astrofis., 52, 21. https://arxiv.org/abs/1509.08552
- Sazonova et al. (2021) Sazonova, E., Alatalo, K., Rowlands, K., et al. 2021, ApJ, 919, 134, doi: 10.3847/1538-4357/ac0f7f
- Sell et al. (2014) Sell, P. H., Tremonti, C. A., Hickox, R. C., et al. 2014, MNRAS, 441, 3417, doi: 10.1093/mnras/stu636
- Setton et al. (2022) Setton, D. J., Verrico, M., Bezanson, R., et al. 2022, ApJ, 931, 51, doi: 10.3847/1538-4357/ac6096
- Shen et al. (2003) Shen, S., Mo, H. J., White, S. D. M., et al. 2003, MNRAS, 343, 978, doi: 10.1046/j.1365-8711.2003.06740.x
- Smee et al. (2013) Smee, S. A., Gunn, J. E., Uomoto, A., et al. 2013, AJ, 146, 32, doi: 10.1088/0004-6256/146/2/32
- Strateva et al. (2001) Strateva, I., Ivezić, Ž., Knapp, G. R., et al. 2001, AJ, 122, 1861, doi: 10.1086/323301
- Suess et al. (2020) Suess, K. A., Kriek, M., Price, S. H., & Barro, G. 2020, ApJ, 899, L26, doi: 10.3847/2041-8213/abacc9
- Swinbank et al. (2012) Swinbank, A. M., Sobral, D., Smail, I., et al. 2012, MNRAS, 426, 935, doi: 10.1111/j.1365-2966.2012.21774.x
- Tran et al. (2003) Tran, K.-V. H., Franx, M., Illingworth, G., Kelson, D. D., & van Dokkum, P. 2003, ApJ, 599, 865, doi: 10.1086/379804
- Tran et al. (2004) Tran, K.-V. H., Franx, M., Illingworth, G. D., et al. 2004, ApJ, 609, 683, doi: 10.1086/421237
- Trouille et al. (2013) Trouille, L., Tremonti, C. A., Chen, Y. M., et al. 2013, in Astronomical Society of the Pacific Conference Series, Vol. 477, Galaxy Mergers in an Evolving Universe, ed. W. H. Sun, C. K. Xu, N. Z. Scoville, & D. B. Sanders, 211
- Vergani et al. (2010) Vergani, D., Zamorani, G., Lilly, S., et al. 2010, A&A, 509, A42, doi: 10.1051/0004-6361/200912802
- Verrico et al. (2022) Verrico, M., Setton, D. J., Bezanson, R., et al. 2022, arXiv e-prints, arXiv:2211.16532, doi: 10.48550/arXiv.2211.16532
- Vulcani et al. (2020) Vulcani, B., Fritz, J., Poggianti, B. M., et al. 2020, ApJ, 892, 146, doi: 10.3847/1538-4357/ab7bdd
- Wake et al. (2017) Wake, D. A., Bundy, K., Diamond-Stanic, A. M., et al. 2017, AJ, 154, 86, doi: 10.3847/1538-3881/aa7ecc
- Wang et al. (2018) Wang, E., Li, C., Xiao, T., et al. 2018, ApJ, 856, 137, doi: 10.3847/1538-4357/aab263
- Wellons et al. (2015) Wellons, S., Torrey, P., Ma, C.-P., et al. 2015, MNRAS, 449, 361, doi: 10.1093/mnras/stv303
- Werle et al. (2022) Werle, A., Poggianti, B., Moretti, A., et al. 2022, ApJ, 930, 43, doi: 10.3847/1538-4357/ac5f06
- Whitaker et al. (2012) Whitaker, K. E., Kriek, M., van Dokkum, P. G., et al. 2012, ApJ, 745, 179, doi: 10.1088/0004-637X/745/2/179
- Wild et al. (2007) Wild, V., Kauffmann, G., Heckman, T., et al. 2007, MNRAS, 381, 543, doi: 10.1111/j.1365-2966.2007.12256.x
- Wild et al. (2009) Wild, V., Walcher, C. J., Johansson, P. H., et al. 2009, MNRAS, 395, 144, doi: 10.1111/j.1365-2966.2009.14537.x
- Wilkinson et al. (2021) Wilkinson, A., Almaini, O., Wild, V., et al. 2021, MNRAS, 504, 4533, doi: 10.1093/mnras/stab965
- Wilkinson et al. (2022) Wilkinson, S., Ellison, S. L., Bottrell, C., et al. 2022, arXiv e-prints, arXiv:2207.04152. https://arxiv.org/abs/2207.04152
- Wong et al. (2012) Wong, O. I., Schawinski, K., Kaviraj, S., et al. 2012, MNRAS, 420, 1684, doi: 10.1111/j.1365-2966.2011.20159.x
- Woo et al. (2013) Woo, J., Dekel, A., Faber, S. M., et al. 2013, MNRAS, 428, 3306, doi: 10.1093/mnras/sts274
- Wu (2021) Wu, P.-F. 2021, ApJ, 913, 44, doi: 10.3847/1538-4357/abf493
- Wu et al. (2018) Wu, P.-F., van der Wel, A., Bezanson, R., et al. 2018, ApJ, 868, 37, doi: 10.3847/1538-4357/aae822
- Wu et al. (2020) —. 2020, ApJ, 888, 77, doi: 10.3847/1538-4357/ab5fd9
- Yan et al. (2006) Yan, R., Newman, J. A., Faber, S. M., et al. 2006, ApJ, 648, 281, doi: 10.1086/505629
- Yan et al. (2009) —. 2009, MNRAS, 398, 735, doi: 10.1111/j.1365-2966.2009.15192.x
- Yan et al. (2016a) Yan, R., Tremonti, C., Bershady, M. A., et al. 2016a, AJ, 151, 8, doi: 10.3847/0004-6256/151/1/8
- Yan et al. (2016b) Yan, R., Bundy, K., Law, D. R., et al. 2016b, AJ, 152, 197, doi: 10.3847/0004-6256/152/6/197
- Yan et al. (2019) Yan, R., Chen, Y., Lazarz, D., et al. 2019, ApJ, 883, 175, doi: 10.3847/1538-4357/ab3ebc
- Yang et al. (2008) Yang, Y., Zabludoff, A. I., Zaritsky, D., & Mihos, J. C. 2008, ApJ, 688, 945, doi: 10.1086/591656
- Yano et al. (2016) Yano, M., Kriek, M., van der Wel, A., & Whitaker, K. E. 2016, ApJ, 817, L21, doi: 10.3847/2041-8205/817/2/L21
- Yesuf (2022) Yesuf, H. M. 2022, arXiv e-prints, arXiv:2207.12844. https://arxiv.org/abs/2207.12844
- Yesuf et al. (2014) Yesuf, H. M., Faber, S. M., Trump, J. R., et al. 2014, ApJ, 792, 84, doi: 10.1088/0004-637X/792/2/84
- Yesuf et al. (2017) Yesuf, H. M., French, K. D., Faber, S. M., & Koo, D. C. 2017, MNRAS, 469, 3015, doi: 10.1093/mnras/stx1046
- York et al. (2000) York, D. G., Adelman, J., Anderson, John E., J., et al. 2000, AJ, 120, 1579, doi: 10.1086/301513
- Zabludoff et al. (1996) Zabludoff, A. I., Zaritsky, D., Lin, H., et al. 1996, ApJ, 466, 104, doi: 10.1086/177495
- Zheng et al. (2020) Zheng, Y., Wild, V., Lahén, N., et al. 2020, MNRAS, 498, 1259, doi: 10.1093/mnras/staa2358
- Zwaan et al. (2013) Zwaan, M. A., Kuntschner, H., Pracy, M. B., & Couch, W. J. 2013, MNRAS, 432, 492, doi: 10.1093/mnras/stt496