The H i study of XMP gas-rich dwarfs in nearby voids – I
Abstract
We present and discuss the results of the Giant Metrewave Radio Telescope (GMRT) H i 21-cm line mapping for five isolated low-mass (Mbary(2–8)107 M☉) eXtremely Metal Poor (XMP) dwarfs [12+(O/H)=7.13-7.28], selected from the Nearby Void Galaxy (NVG) sample. All the studied void dwarfs show the disturbed morphology in the H i maps with the angular resolutions of 11 to 40. We examine the H i morphology and velocity field and the relative orientation of their stellar and gas body spins. We discuss the overall non-equilibrium state of their gas and the possible origin and evolution of the studied void dwarfs. The most straightforward interpretation of the ubiquitous phenomenon of the gas component non-equilibrium state in these and similar void dwarfs is the cold accretion from the void filaments and/or minor mergers. The cold gas accretion in voids could be linked to the presence of small filaments that constitute the substructure of voids.
keywords:
galaxies: dwarf – galaxies: evolution – galaxies: individual: J0001+3222, J0231+2542, J0306+0028, J1259–1924, J2103–0049 – galaxies: kinematics and dynamics – radio lines: galaxies – cosmology: large-scale structure of Universe1 INTRODUCTION
The study of voids and their galaxies remains one of the current directions in the understanding of formation and evolution of galaxies and their structures (see, e.g., review by van de Weygaert & Platen (2011); van de Weygaert (2016) and references therein). However, the majority of the known studies on void galaxies are biased towards the relatively distant voids with typical distances, 80 – 200 Mpc. The void galaxies they probe are related to the upper part of the galaxy Luminosity Function (LF), namely those with (e.g., Rojas et al., 2004, 2005; Sorrentino et al., 2006; Wegner et al., 2019). For this luminosity range, relatively modest differences are found in void galaxies in comparison to their counterparts in denser environments.
To understand the effect of void environment on a much more numerous population of the smaller-mass galaxies, one should explore objects in the nearby voids. The typical low limits on the apparent magnitude of the common redshift surveys are on the level of ,r 18–18.5 mag (e.g. Abazajian et al., 2009). With these limits, in order to probe faint galaxies with luminosities down to M –12 mag and fainter, one should focus on voids and their galaxies in our nearby surroundings. To this end, a galaxy sample composed of galaxies residing in one of the nearby voids, the Lynx-Cancer, was formed by Pustilnik & Tepliakova (2011).
The study of this sample, consisting of over a hundred galaxies with a median M –14, was primarily aimed to determine their evolutionary parameters, specifically the gas metallicity and gas mass fraction (or its substitute, the ratio M(H i)/LB) (Pustilnik et al., 2010, 2011, 2016; Pustilnik & Martin, 2016). In addition, the H i gas structure and kinematics were studied (Chengalur & Pustilnik, 2013; Chengalur et al., 2015, 2017; Kurapati et al., 2018; Kurapati, 2020; Kurapati et al., 2020), along with the photometric parameters of the sample (Perepelitsyna et al., 2014). This study covered the great majority of the sample galaxies without any additional bias. As a result, it was found that void galaxies, as a group, have reduced gas metallicity relative to the reference sample of similar galaxies in the Local Volume (Berg et al., 2012), on average by 40%, albeit with significant scatter (Pustilnik et al., 2016, 2021). Similarly, for the same luminosity, their parameter M(H i)/LB appeared to be, on average, approximately 40% higher (Pustilnik & Martin, 2016).
As an additional outcome of this unbiased study, it was found that among the least luminous void dwarfs there is a substantial fraction of the unusual, eXtremely Metal-Poor (XMP) galaxies. They have significantly reduced O/H values for their luminosities (by a factor of 2–5), corresponding to 12+(O/H)=7.0–7.3. Moreover, they have a very high gas mass fraction (Mgas/Mbary 0.95–0.99). Furthermore, the majority of this small group of unusual dwarfs display very blue colours in their outer regions, indicating the ages of the main stellar population in the range of (1–4) Gyr. These properties resemble what one would expect for galaxies in the early phases of evolution. Interestingly, they also appear to be the best proxies for the nearby so called VYGs (Very Young Galaxies, suggested in simulations of Tweed et al. (2018)). While such objects are expected to be very rare in the models, they can be the important probes of the validity of the modern models of galaxy formation.
In order to increase the sample of such unusual dwarfs, many efforts have been made to identify them (e.g., Kniazev et al., 2003; Izotov et al., 2006; Izotov & Thuan, 2007; Izotov et al., 2018, 2019; Sánchez Almeida et al., 2016; Guseva et al., 2017; Hsyu et al., 2017, 2018; James et al., 2017; Kojima et al., 2020). However, the overall outcome of these various approaches has been rather limited: only a handful of objects have been identified, and their distances extend up to several hundred Mpc. Several relatively close dwarfs were discovered during extensive searches for the emission-line XMPs in the SDSS database, which are summarized by Izotov et al. (2019). Thanks to their new empirical O/H estimator, best suited for the lowest metallicity H ii regions, these authors were able to find the new XMP objects without the temperature-sensitive faint auroral line [Oiii]4363 in their spectra.
Substantial progress in this direction can be attributed to the formation of a new sample comprising 1,350 galaxies residing in the ‘Nearby Voids’ (D 25 Mpc) - Nearby Void Galaxies (NVG) sample (Pustilnik et al., 2019). Utilizing all available information about the NVG objects from public databases and existing literature, Pustilnik et al. (2020a) compiled a list of 60 void XMP candidates. These candidates have several properties resembling those of the small group of prototype XMP void dwarfs found in the Lynx-Cancer void. Subsequent spectroscopic observations, conducted using SALT (Southern African Large Telescope) and BTA (Big Telescope Azimuthal) (Pustilnik et al., 2020b, 2021, Pustilnik et al. 2023, MNRAS, in press), resulted in the discovery of eleven new void dwarfs with 12+log(O/H) values ranging from 6.98 to 7.21 dex, or gas metallicities of Z(gas) ranging from Z☉/50 to Z☉/30. Additionally, they identified 23 more dwarfs with somewhat higher gas metallicities: Z(gas) Z⊙/30 – Z⊙/20.
Besides, we recently began the complex study of the whole sample of 260 void galaxies residing within the Local Volume (LV, D 11 Mpc) (Pustilnik et al., 2022, Pustilnik et al. 2023, submitted), similar to the unbiased study of the whole sample in the Lynx-Cancer void (Pustilnik et al., 2016). This also resulted in several new XMP dwarfs in the neaby voids.
Previous studies of these unusual galaxies have shown that their baryon mass is predominantly composed of atomic gases (H i and He). To gain a better understanding of their properties, such as dynamical mass, gas morphology, kinematics, and the relationship between gas distribution and star-forming sites, obtaining high-resolution H i 21 cm observations for these galaxies is crucial. In our previous GMRT studies of H i gas in several void XMP dwarfs, we have already presented their morphology, kinematics, and related conclusions (Ekta et al., 2008, 2009; Ekta & Chengalur, 2010; Chengalur & Pustilnik, 2013; Chengalur et al., 2015, 2017). However, the statistics for void XMP dwarfs with high-resolution H i 21 cm observations are still relatively low.
Moreover, extremely gas-rich and metal-poor dwarfs in voids are of interest in the context of studying gas instability and collapse due to their effect on the density threshold for the onset of star formation. Additionally, interactions and especially merger events involving extremely gas-rich objects are expected to follow different processes compared to galaxies where stars make up the main part of the baryon component. The merging of gas-dominated objects can efficiently dissipate system momentum via shocks. While it undoubtedly occurs in galaxies in the early Universe, this intriguing process remains relatively unexplored, both in observations and models. Furthermore, voids are promising places to search for tracers of cold gas accretion, since numerical simulations predict that low density regions at are dominated by cold gas accretion (e.g. Kereš et al., 2005, 2009; Dekel et al., 2013).
In this paper, we present the results of GMRT H i mapping for five isolated XMP dwarfs located in nearby voids. Three of these dwarfs fall within the Local Volume (LV), allowing for mapping with higher linear resolution. In forthcoming papers, we will extend this study to include ten more gas-rich void XMP dwarfs. To investigate star formation in this XMP group, we will analyze high-resolution H i maps and compare them with H emission distribution, which will be presented later in a separate paper.
The paper is organized as follows: In Section 2, we introduce the sample of observed void XMP dwarfs. In Section 3, we describe the observations and data reduction. In Section 4, we present the results of the observations and their analysis. In Section 5, we discuss the results and their implications in a broader context. Finally, in Section 6, we provide a summary and draw our conclusions.
| Parameter | Unit | J0001+3222 | J0231+2542 | J0306+0028 | J1259–1924 | J2103–0049 |
|---|---|---|---|---|---|---|
| AGC103567 | AGC122400 | PGC1166738 | PGC044681 | PGC1133627 | ||
| 12+log(O/H) | (dex) | 7.13.06 | 7.20.12 | 7.19.05 | 7.28.05 | 7.20.05 |
| 17.14 | 18.92 | 17.94 | 17.65 | 17.44 | ||
| A | 0.47 | 0.42 | 0.08 | 0.11 | 0.11 | |
| M | –12.86 | –12.45 | –12.67 | –12.01 | –14.07 | |
| Distance | (Mpc) | 9.1(2) | 15.5 | 11.2 | 7.3 | 17.4 |
| Vhel(H i) | (km s-1) | 5421 | 9381 | 7101 | 8271 | 14111 |
| Sint(3) | (Jy km s-1) | 1.420.04 | 0.890.05 | 0.550.25 | 4.490.14 | 0.950.19 |
| W50(3) | (km s-1) | 322 | 312 | 3826 | 382 | 866 |
| W20(3) | (km s-1) | 467 | 6913 | 7940 | 512 | 1049 |
| Mstar | (107 M⊙) | 0.155 | – | 0.245 | 0.437 | 2.14 |
| M(H i)/LB | (M⊙/L⊙) | 1.0 | 3.4 | 1.2 | 7.0 | 1.3 |
| (1) – from NED; (2) – derived in this paper; (3) – from published single-dish data | ||||||
| J0001+3222 | J0231+2542 | J0306+0028 | J1259-1924 | J2103-0049 | |
|---|---|---|---|---|---|
| AGC103567 | AGC122400 | PGC1166738 | PGC044681 | PGC1133627 | |
| Date of observations | 2021 Jun 04 | 2021 Jun 06 | 2021 Jun 05 | 2021 Jul 13 | 2021 Sep 07 |
| 2021 Jun 07 | |||||
| Field center R.A.(2000) | 00h01m06.5s | 02h31m22.1s | 03h06m46.9s | 12h59m56.6s | 21h03m47.2s |
| Field center Dec.(2000) | 32o2241.0" | 25o4245.0" | 00o2811.0" | –19o2441.0" | –00o4950.0" |
| Central Velocity (km s-1) | 542 | 938 | 700 | 827 | 1411 |
| Time on-source (h) | 9 | 9 | 7+7 | 9 | 9 |
| Number of channels | 512 | 512 | 512 | 512 | 512 |
| Channel separation (km s-1) | 1.7 | 1.7 | 1.7 | 1.7 | 1.7 |
| Flux Calibrators | 3C48 | 3C48 | 3C48 | 3C147 | 3C48 |
| Phase Calibrators | 0029+349 | 0237+288 | 0323+055 | 1351-148 | 2136+006 |
| Resolution (arcsec2) (rms (mJy Bm-1)) | 43 36 (1.6) | 43.5 34 (1.6) | 43.5 36.5 (1.8) | 46.5 33.5 (1.8) | 45.5 37.5 (1.6) |
| 15 13 (1.1) | 16.5 13 (1.1) | 17 13.5 (1.4) | 16 12 (1.4) | 20 15 (1.1) | |
| 12.5 9 (1.0) | 12 9.5 (1.0) | 12.5 10 (1.2) | 11 8.5 (1.2) | 14.5 9.5 (1.0) |
2 SAMPLE
The entire sample of XMP dwarfs in the Nearby Voids, for which we obtained H i 21 cm observations, includes approximately 15 gas-rich galaxies observed at GMRT. These XMP dwarfs were identified based on the results of studies conducted in both the Lynx-Cancer void (Pustilnik et al., 2016) and the ‘Nearby Voids’ sample (Pustilnik et al., 2020b, 2021, Pustilnik et al. 2023, MNRAS, in press). In this paper, we present the results for 5 dwarfs observed at GMRT from June to September 2021. The remaining XMP and/or gas-rich void dwarfs, observed in other periods, will be presented in subsequent papers.
The summary of their main properties, known from the literature and from our previous results, is presented in the Table 1. The rows are as follows:
Row 1 - gas ‘metallicity’ 12+log(O/H) (in dex). This is typically determined using the electron temperature method ( method) if the principal faint auroral line [Oiii] 4363 Å can be reliably measured. In cases where this line is too faint or undetectable, as for all dwarfs in this work, various empirical O/H estimators are employed.
We used a robust empirical O/H estimator, based on the intensities of strong oxygen lines (Izotov et al., 2019), specifically suited
for the lowest metallicity range, 12+log(O/H) 7.5, which has an accuracy of 0.04 dex (Izotov et al., 2019; Pustilnik et al., 2021). All the values of 12+log(O/H) shown in this table are from Pustilnik et al. (2020b, 2021, and 2023 (MNRAS, in press)). For galaxy J1259–1924, which had relatively low signal-to-noise spectra, the adopted value of 12+log(O/H) is the average of two different H ii-regions on spectra from Pustilnik et al. (2020b) and Pustilnik et al. (2023).
Row 2 - the total B magnitude, not corrected for AB, obtained by transformation from the total g and r, according to the formulae given in Lupton et al (2005)111http://www.sdss.org/dr5/algorithms
/sdssUBVRITransform.html#Lupton2005;
Row 3 - AB, the Galactic extinction in B band;
Row 4 - the absolute blue magnitude corrected for the Galactic extinction;
Row 5 - the adopted distance in Mpc. The distance for galaxy J1259–1924 is determined via the Tip of RGB method based on the photometry of individual stars on the HST (Hubble Space Telescope) images (Karachentsev et al., 2017). For the remaining four dwarfs, the distance was estimated from their radial velocities according to the kinematic model by Tully et al. (2008). This model accounts for the motions of the Local Sheet towards the nearby attractor in the direction of the Virgo cluster and away from the center of the Local Void (see Pustilnik et al., 2019, for more details);
Row 6 - the heliocentric velocity, obtained from H i profile in this paper;
Row 7 - Integrated flux, measured from single dish H i observations ;
Row 8 and 9 - Line widths W50 and W20 in km s-1measured from single dish H i observations . These values represent the measured linewidths at 50 % and
20 % of the peak flux, respectively;
Row 10 - stellar mass in M⊙;
Row 11 - ratio of H i mass to blue luminosity, M(H i)/LB in solar units.
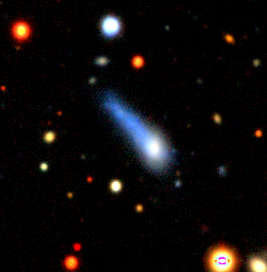
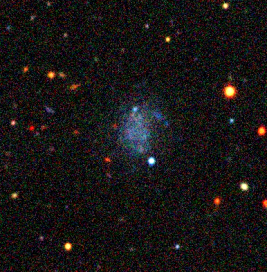
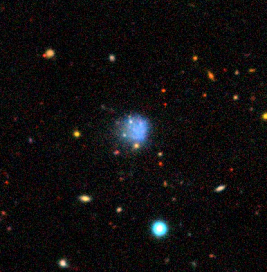
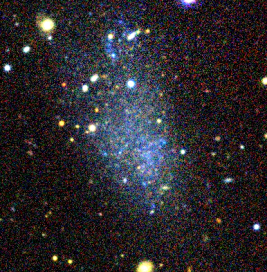
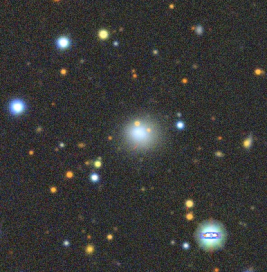
In Figure 1, we present the deepest available color images of the five studied void XMP dwarfs. All the images were obtained from DR9 or DR10 of the DESI Legacy Imaging Surveys (Dey et al., 2019), except for J2103–0049, for which we selected the deep images from SDSS Stripe82 (Fliri & Trujillo, 2016). This figure clearly shows the optical sizes and morphologies of the XMP dwarfs, which may not be as distinct in the subsequent figures where H i maps are overlaid.
| Parameter | Unit | J0001+3222 | J0231+2542 | J0306+0028 | J1259–1924 | J2103–0049 |
|---|---|---|---|---|---|---|
| AGC103567 | AGC122400 | PGC1166738 | PGC044681 | PGC1133627 | ||
| Sint | (Jy km s-1) | 0.760.07 | 0.730.09 | 0.420.04 | 4.200.29 | 1.300.20 |
| W50 | (km s-1) | 38 | 32 | 20 | 40 | 108 |
| W20 | (km s-1) | 43 | 49 | 53 | 62 | 145 |
| b/a | 0.59 | 0.88 | 0.54 | 0.55 | 0.32 | |
| (∘) | 68 | 31 | 67 | 64 | 84 | |
| (km s-1) | 5–6 | 8–10 | 6–8 | 10–12 | 12–16 | |
| M(H i) | (107 M⊙) | 2.8 | 4.1 | 1.3 | 5.3 | 9.3 |
| Mgas | (10) | 3.6 | 5.3 | 1.7 | 6.9 | 12.1 |
| R | (kpc) | 1.5 | 2.2 | 1.4 | 2.3 | 7.3 |
| R | (kpc) | 1.3 | 1.7 | 0.8 | 2.1 | – |
| M | (10) | 1.8 | 11.6 | 2.7 | 6.4 | 89.2 |
| M | (10) | 1.6 | 8.8 | 1.5 | 5.7 | – |
| M(H i)/LB | (M⊙/L⊙) | 1.0 | 2.8 | 0.9 | 6.6 | 1.7 |
| a Radius of the galaxy based on moment maps; b Radius of the galaxy where the inclination corrected surface density is 1 M⊙ pc-2; c Dynamic mass of the galaxy based on R; d Dynamic mass of the galaxy based on R | ||||||

3 OBSERVATIONS AND DATA ANALYSIS
The GMRT H i 21-cm observations of the 5 void XMP galaxies presented in this paper were conducted between June and September 2021. We used the GMRT Software Back-end (GSB) setup, which is centered at the heliocentric redshift of each galaxy, providing a total bandwidth of 4.17 MHz ( 890 km s-1) divided into 512 channels, resulting in a velocity resolution of 1.74 km s-1. All sources were observed for 9 hours, except for the faintest galaxy (J0306+0028), which was observed for 14 hours. The parameters of the GMRT observations are summarized in Table 2.
The initial flagging and calibration were performed using the stand-alone pipeline ‘flagcal’ (Prasad & Chengalur, 2012), and subsequent processing was carried out using standard tasks within the AIPS package. The ‘CVEL’ task was applied to the calibrated data sets to correct for the Doppler shift due to Earth’s motion. The galaxy J0306+0028 was observed over two sessions, which were combined using the task ‘DBCON’ before imaging. A continuum image was generated using the line-free channels, and the corresponding clean components were subtracted using the ‘UVSUB’ task. Any residual continuum was subtracted in the image plane using ‘IMLIN’. Data cubes were generated by averaging three channels, resulting in a channel width of approximately 5.1 km s-1. These cubes, produced at multiple resolutions, leverage the hybrid configuration of GMRT to create both high and low-angular resolution images from a single observation. These cubes were produced for various (u,v) ranges, including 0–5 k, 0–15 k, and 0–20 k, which correspond to roughly 40, 15, and 10 respectively.
We use the Source Finding Application (SoFiA2; https://github.com/SoFiA-Admin/SoFiA-2) pipeline (Serra et al., 2015; Westmeier et al., 2021), which is designed for automatic Hi source finding in interferometric spectral line data to detect the H i emission in data cubes and to create moment maps. We use the ‘smooth+clip’ algorithm which iteratively smooths the data cube on multiple spatial and spectral scales to obtain significant emission above a user-specified detection threshold on each scale. Applying a 4 clip level, we extract H i parameters of each galaxy including moment maps. We did not detect any companion galaxies associated with any of the galaxies.
4 Results
4.1 H i integrated parameters
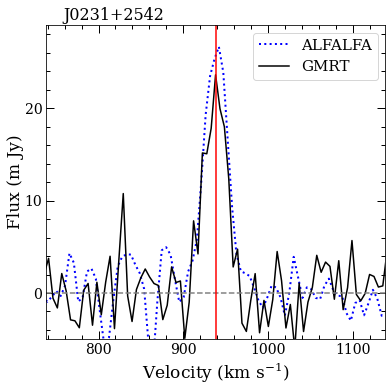
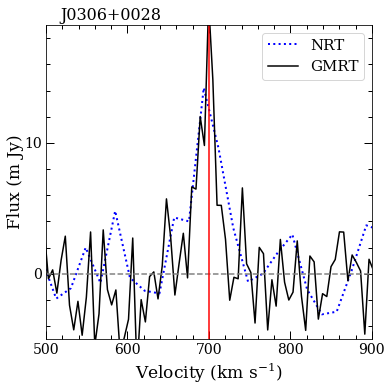
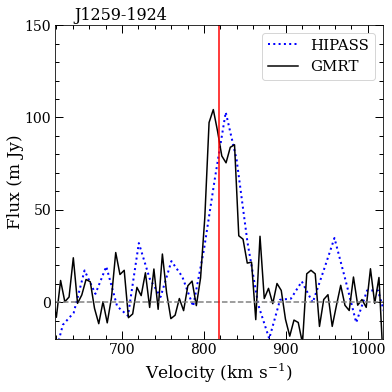
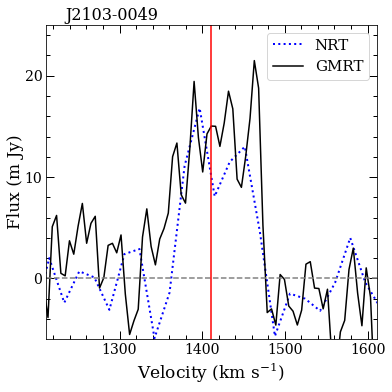
In this section, we compare the global H i profiles and their derived parameters obtained from GMRT interferometric observations in this study, with those from previous single-dish observations. The H i spectra were extracted from the unsmoothed cubes in the regions where the H i emission is detected. Integrated fluxes are measured from these integrated global profiles. We present the global H i emission of all the galaxies in Fig. 2. The black solid lines indicate the H i profiles obtained from the GMRT observations, while the blue dotted lines show the integrated single-dish profiles (Haynes et al., 2018; van Driel et al., 2016; Huchtmeier et al., 2000). The single-dish H i observations of J0001+3222 and J0231+2542 are from the blind H i ALFALFA survey (Haynes et al., 2018), observed by the Arecibo telescope, which has a resolution of approximately 3.5 arcmin. The single-dish H i profiles of J0306+0028 (cataloged as NIBLES0347) and J2103–0049 (cataloged as NIBLES2400) are taken from van Driel et al. (2016), observed by the Nançay Radio Telescope (NRT). The H i profile of the galaxy J1259–1924 was obtained from the HIPASS survey (Meyer et al., 2004), observed with the Parkes telescope.
The GMRT profiles for galaxies J0231+2542, J0306+0028, and J1259–1924 match quite well with their corresponding single dish H i profiles. The values of integrated flux and the profile widths for both measurements coincide within the errors (Fig. 2), although the single dish fluxes are slightly higher than GMRT fluxes as expected. However, for J0001+3222, the GMRT flux at a resolution of 40 is only 50 of the total H i flux detected by the ALFALFA blind survey with the effective beam width of five times larger (3.5). This difference may be attributed to missing flux, i.e. a large fraction of HI being in an extended distribution that is resolved out. Another possibility is the presence of multiple sources within the Arecibo beam. However, the latter scenario seems less likely, as an H i source with a flux comparable to that of J0001+3222 should have been detected by GMRT, considering the primary beam of GMRT, which has a FWHM of 22. On the other hand, for the galaxy J2103–0049, GMRT flux is 35 higher compared to the single dish flux. This discrepancy may be explained by difficulties in single dish baseline subtraction or due to the ON-OFF mode of the NRT observations (van Driel et al., 2016). If the OFF position of NRT includes a signal from a nearby H i emitter with a close radial velocity, it can affect the H i flux and the line profile of the target galaxy. In this context, the well-known XMP void galaxy PGC1139658 = J2104–-0035 (Izotov et al., 2006; Ekta et al., 2008; Pustilnik et al., 2021), with the radial velocity of 1401 km s-1 is a probable candidate to affect the NRT OFF position flux. Being at the projected distance of 117 kpc, that is in the same space cell, it, however, is a weak disturber for J2104–0035.
In Table 3, we present all the H i integrated parameters obtained from GMRT observations in this work. The rows are as follows:
Row 1 - Integrated flux, measured from the integrated global profiles and the error on the integrated flux was obtained by taking the quadrature of RMS noise and uncertainty due to absolute flux calibration;
Row 2 and 3 - Line widths W50 and W20 in km s-1measured from GMRT profiles
Row 4 and 5 - b/a, minor axis to major axis ratio and H i morphological inclination; The values of minor axis and major axis were obtained from the SoFiA output catalogues, which were derived by fitting ellipses to isophotes of H i maps. The inclinations (iHI) were estimated based on the ratio of minor to major axis, including a correction factor dependent on the intrinsic axial ratio distribution from a sample of galaxies, as described in Staveley-Smith et al. (1992):
| (1) |
where is the intrinsic axis ratio. We assume an intrinsic thickness of (Roychowdhury et al., 2013; Sánchez-Janssen et al., 2010) for these faint dwarfs.
Row 5 - Velocity dispersion in km s-1;
Row 6 and 7 - measured H i mass and gas mass (corrected for helium) in units of 107 M⊙. We estimate the H i mass using the standard formula , where is the distance in Mpc, is the integrated flux density in
Jy km s-1 (Roberts, 1962). We adopt distances and integrated flux of H i presented in Table 1
Row 8 and 9 - Radius of the galaxy (R) based on the extent of moment maps in kpc and Radius of the galaxy R in kpc is determined by fitting ellipses to the contour of the inclination-corrected H i column density map corresponding to 1 M⊙ pc-2. They are derived homogeneously for all studied galaxies from the moment maps with FWHM 15. For two galaxies that are well resolved with the beam size of FWHM 40, we provide the alternative estimates in Sections 4.2.4 and 4.2.5, in order to better understand how they can vary.
Row 10 and 11 - Estimated dynamic mass using the radius as derived in Row 8 and Row 9 respectively. We use a simple dynamical mass modelling approach since these galaxies have disturbed velocity fields. We estimate the dynamical mass (following de Blok & Walter (2014); Guo et al. (2020)) using:
| (2) |
where (in km s-1) is the line width measured from GMRT profiles, is the inclination angle, and RHI is the radius(in kpc) as determined in the previous rows.
Row 12 - the ratio of H i mass to blue luminosity, M(H i)/LB in solar units.

4.2 H i MORPHOLOGY AND KINEMATICS
One of the most prominent features in the morphology of the majority of XMP gas-rich dwarfs, mapped in the H i line so far (e.g. Ekta et al., 2008, 2009; Chengalur et al., 2015, 2017), as well as seen in this paper (see Figures 3-7), is the presence of clear disturbances in their H i density distributions and velocity fields. These disturbances can sometimes be smoothed out in the lowest resolution maps. However, higher-resolution maps reveal many disturbed features. In the following subsections, we provide a more detailed description of the GMRT H i maps obtained for each of the five studied XMP void dwarfs.
4.2.1 J0001+3222
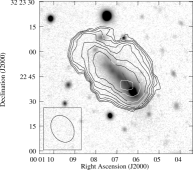
In the top row of Figure 3 (left-hand panel), we show the H i distribution ( 40 ) of the galaxy J0001+3222 overlaid on its optical (-band) image taken from the Legacy surveys database (Dey et al., 2019). As explained in Pustilnik et al. (2021), its tadpole appearance is due to the chance projection of a distant red galaxy on to the edge of the nearby void blue almost edge-on XMP disc. There are no apparent galaxies in the neighborhood within approximately 60 kpc in projection (20), which could significantly disturb J0001+3222. Therefore, as a first approximation, this galaxy can be considered relatively isolated.
To assess the local environment, we initially examined galaxies with known redshifts within a radius of 30 using the HyperLEDA database, but did not find any. Subsequently, we carefully examined its environments for the potential fainter counterparts using the deepest colour images available in the Legacy survey. Four possible blue or bluish objects, ranked by their angular distance to J0001+3222, are situated at 3.3, 6.4, 6.4, and 15.3, or approximately 10, 19, 19, and 45 kpc, respectively. Their B-band magnitudes, estimated from the SDSS DR16 catalog g and r magnitudes, are as follows: 20.53, 18.06, 19.59, and 17.75.
Assuming a gas-mass to blue luminosity ratio of M(H i)/LB 1 and accounting for the Milky Way extinction A 0.2 mag, one can estimate the expected H i flux at their positions and the likelihood of detecting them in our GMRT observations. The expected values of for these galaxies are 0.05, 0.42, 0.11, and 0.6 Jy km s-1, respectively. In principle, only the two brighter galaxies could be detected, given that the main target with = 0.76 Jy km s-1 is detected with a signal-to-noise ratio of only 10. However, when considering the substantial offset of these objects from the primary beam center and the resulting loss of their flux, one would expect their detection to be at a level of 0.2 Jy km s-1 if they have radial velocities within the range covered by the observations, that is 542380 km s-1. Due to their low expected H i integrated flux, one can not exclude their proximity to the target void XMP dwarf. Nevertheless, the combination of their expected masses and mutual distances suggests that their tidal effect on the target galaxy would be relatively small.
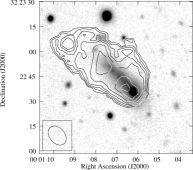
Despite the available data do not provide evidence for the presence of a substantial disturber, the H i morphology of J0001+3222, as seen in the Moment 0 (MOM0) map with a beam of 40, is rather asymmetric. With this beam size the whole H i body of the galaxy is barely resolved. However, its major axis is clearly inclined relative to the stellar body. A substantial appendage on the NE side is also evident. The extent of the H i body is only about twice as large at the column densities of 1019 atoms cm-2, compared to that of the optical disc, as seen in the deepest images.
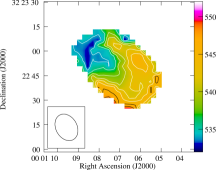
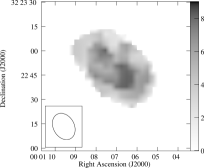
In the maps with the higher angular resolutions (the second and the third rows of Fig. 3) with the effective FWHM beamwidths of 15 (17 13) and 11 (12.5 9), respectively, the disturbed morphology and velocity field are even more distinctly visible. Namely, there are two peaks of density along the main body (both within the optical ‘disc’) and one more peak in the NE ‘finger’. There is also a kind of outflow along the minor axis to the NW. The related maps of gas radial velocities also show clear irregularities indicative of non-equilibrium state. However, these disturbed structures little affect the velocity dispersion, as one can see in MOM2 maps. The observed velocity dispersion () of 6–9 km s-1 is rather typical of dwarf irregular galaxies. After correction for the effective channel width of 5.1 km s-1 and the contribution of the velocity gradient convolved with the beam, namely the term of 0.5FWHM, here of the order of 3–4 km s-1, does not exceed 6–7 km s-1.
Despite the significantly disturbed appearance of the velocity field, a relatively regular velocity gradient is observed in the two higher resolution MOM1 maps, approximately from the NE to the SW. The full amplitude of the velocity change does not exceed 20 km s-1. This is in contrast with the broader velocity range visible in the integrated H i profiles, especially for the ALFALFA one, as presented in Figure 2, where a velocity range of 38 km s-1 (W50) and 43 km s-1 (W20) is observed. By adopting the latter value and the estimated inclination angle = 68°(using eqn 1), we derive Vrot to be 23 km s-1. The full extent of H i gas, as seen on the MOM0 maps of Figure 3, is 60 (or 2.65 kpc).
The velocity field of this galaxy is not suitable for deriving a rotation curve, since it shows significant disturbances. We use the above estimated radius and velocity, and estimate the indicative dynamical mass, using the equation 2 which gives 1.8 108 M⊙.
Comparing the H i profiles from ALFALFA and GMRT in Fig. 2, it is evident that the larger beam of GMRT significantly resolves out the low-density outer layers of this galaxy. Consequently, the value of Mdyn could be larger.
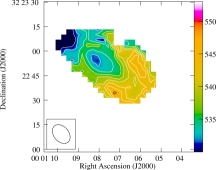
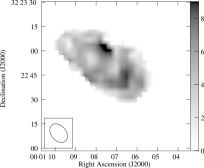
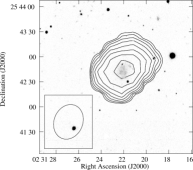
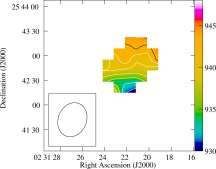
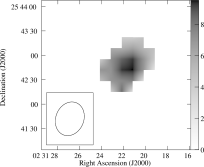
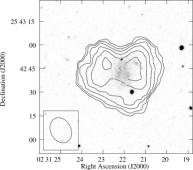
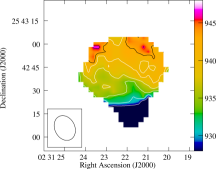
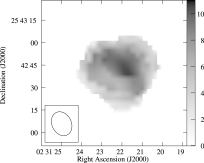
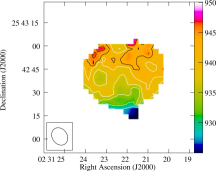
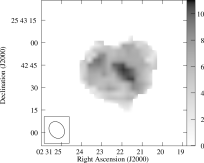
4.2.2 J0231+2542=AGC122400
This XMP dwarf also was discovered as an H i source in the blind H i survey ALFALFA (Haynes et al., 2018) and identified with a faint optical galaxy. This very LSB dwarf shows elongation in its optical body approximately in the S–N direction (PA 0°) (see Figure 1). A faint blue ‘flow’ from the North edge to the West suggests some tracers of past or current disturbance.
As shown in the top row left panel of Figure 4, where the H i contours, at a resolution of 40 (43.5 34) are overlaid on the optical band image, the major axis of the H i body is clearly inclined at PA –40°. The total extent of H i is, however, comparable to the beam width, so that the disturbed morphology and velocity fields are largely smeared by the beam in these MOM0 and MOM1 moment maps.
In the second and the third rows of Figure 4, we present similar H i flux maps overlaid onto the optical image, with FWHM beam widths of 15 (16.513) and 11 (12 9.5), respectively. In these maps, the H i body appears to consist of two approximately equal parts with density peaks on the both sides of the stellar body and the whole H i body major axis is perpendicular to the optical major axis. This ‘internal’ orientation of the major axis of the H i body differs significantly from that of the larger-scale body as seen in the top row of this figure.
Therefore, we see two signatures of the non-equilibrium state of gas in this galaxy. The first one is related to the large misalignment of the major axes of the stellar and gas components. The second signature is the non-equilibrium state of the gas body itself. This is well seen in the maps with the beam widths of 15′′ and 11′′. The signatures of the latter are both, the odd morphology and the irregular velocity field. However, despite the clearly seen disturbed state of the H i gas, the global morphology and the velocity field indicate that at first approximation the velocity field has the dominant direction of its gradient, roughly from the S to the N, with the full range of radial velocities of 20 km s-1 that can be attributed to the total angular momentum.
In the right-hand panels we present the maps of the observed velocity dispersion (MOM2). They reach the maximal values of 8–11 km s-1 near the central part of the H i body, which, in turn, is close to the position of the stellar body. After correcting the observed values for channel width and velocity gradient (similar to that shown for J0001+3222), we derive the maximal values of 9 km s-1.
The analysis of its environment up to the distances of 30 (130 kpc) was performed with HyperLEDA and on the deep colour images of the Legacy survey, within a square region of 30 30, somewhat larger than the primary GMRT beamwidth FWHM diameter (22 or 100 kpc). This search reveals three bluish irregular galaxies at the angular distances of 1.3, 4.5 and 10. These potential companions/disturbers, with the total B-magnitudes fainter than that of AGC122400 by 2.8, 2.1 and 1.5 mag, are situated at the projected linear distances of 5.7, 20 and 45 kpc, respectively. We search for the H i counterparts of these galaxies in our GMRT observations.
If these bluish galaxies have radial velocities within 380 km s-1 of the velocity of AGC122400, one could, in principle, detect the brightest and the most distant object, SDSS J023112.80+255227.2, at a low S-to-N ratio. However, nothing hints at a signal at this position in the data cube. Two other bluish galaxies are too faint for detection.
The use of the available velocity field for the estimate of the dynamical mass in this object is also limited by the complex gas motions and morphology. Following the approach in J0001+3222 from the previous section, we estimate the indicative dynamical mass using Formula 2. Since the GMRT global H i profile matches well with the ALFALFA profile, we use the parameter W20 = 49 km s-1 and adopt inclination angle = 31° to estimate its rotation velocity. Considering the apparent radius of the H i body along the ‘major’ axis on the MOM0 map with the beam size of FWHM40 at the H i column density level of 1.9 1019 atoms cm-2 (Figure 4), we adopt R = 3.0 kpc. We obtain a dynamic mass 15.3 108 M⊙.
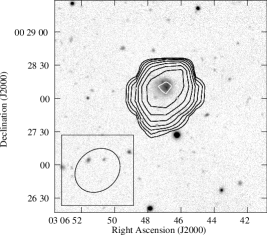
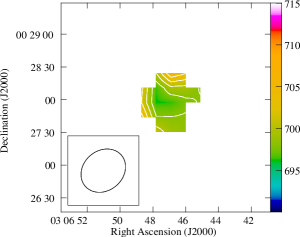
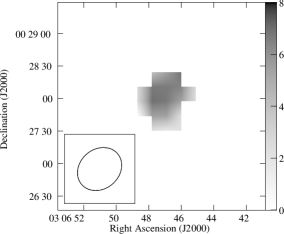
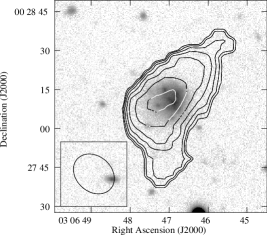
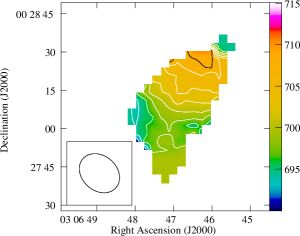
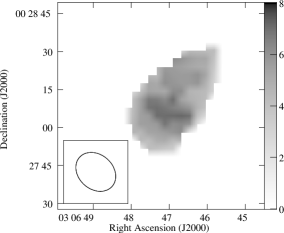
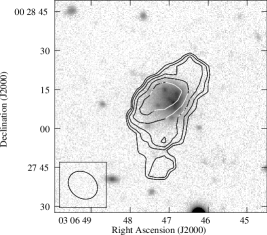
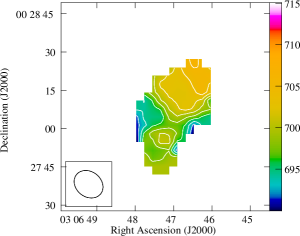
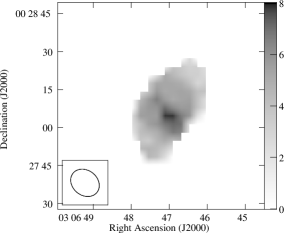
4.2.3 J0306+0028=PGC1166738
This galaxy was initially identified in the SDSS (Adelman-McCarthy et al., 2007) as a nearby emission-line dwarf SDSSJ030646.86+002810.2 with the radial velocity of Vhel = 711 km s-1. Its H i emission was previously detected by van Driel et al. (2016) (cataloged as NIBLES0347) at the close radial velocity of 699 km s-1 with an integrated flux S(H i) = 0.550.25 Jy km s-1, which matches well with our GMRT observations (see §4.1).
The optical morphology of this galaxy in the deep image of the Legacy survey (Fig. 1) appears as a slightly elongated blue body with several knots. Its major axis is oriented approximately in the S–N direction (PA 0°). In the left panel of the top row of Figure 5, we show the H i contours at a resolution of 40 (43.5 36.5), overlaid on its optical (-band) image taken from the Legacy surveys database (Dey et al., 2019) in grey scale. The H i body is elongated at PA –45° and its density peak is close in position to the center of the optical image. The outermost contours are clearly not elliptical but rather exhibit a disturbed morphology. The velocity field, shown with isovelocity contours and in the colour scale, is barely resolved with this larger beam. We discuss it below for maps with the higher angular resolution.
In the middle and bottom rows of Fig. 5, we present similar maps with the beam widths of 15 (17 13.5) and 11 (12.510). Here, the asymmetric morphology of the H i body is well seen in the left panels. There are two distinct components of the main body: the brighter one, with the peak, centered roughly at the position of the optical body, and the fainter component, elongated at PA –45°. Additionally, there is a separate faint H i component at 30 to the South of the center of the optical body. This small H i blob seems to be kinematically detached from the gas in the main component since the velocity field clearly breaks at their boundary. No optical counterpart of this blob is seen, however, to the limit of the available images in the mentioned above deep surveys.
In the right-hand panels we show the maps of the observed velocity dispersion (MOM2). Its maximal observed values do not exceed of 8 km s-1. After the corrections, similar to those in the previous dwarfs, the values of do not exceed 6 km s-1.
The examination of the environment of this galaxy within the radius of 30 (100 kpc) with the HyperLEDA and with the Legacy DR10 colour images, reveals only one potential counterpart, a bluish irregular galaxy at the projected distance of 7.45 (24 kpc), with B-mag of 20.4 mag. For the typical value for such galaxies, of M(H i)/L1, its expected flux F(H i) is only 0.05 Jy km s-1, well below the detection limit of our observations.
Similar to the two previous XMP dwarfs, the apparent morphology and velocity field are complex. Moreover, for the more extended structure, the velocity field is poorly resolved. As in the previous cases, we derive the indicative dynamical mass with Formula 2 above. We adopt the total extent of H i body as seen in the MOM0 map with the beam size of , namely of 56.5 at the H i column density level of atoms cm-2. This corresponds to the angular radius of 26 and R = 1.4 kpc. Adopting the parameter W20 = 53 km s-1 and the =67°, as shown in Table 3, we obtain the estimate of the rotation velocity of 29 km s-1. The corresponding value of the dynamical mass is = 2.7108 M⊙.
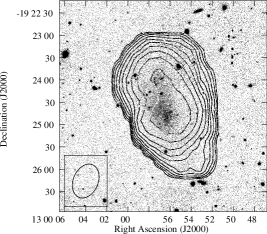
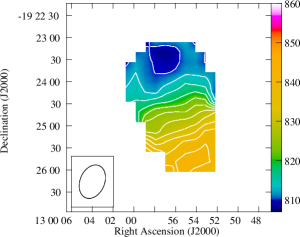
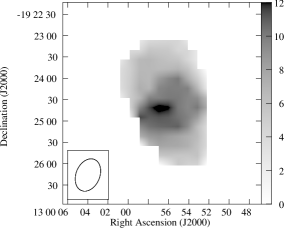
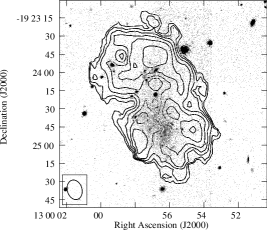
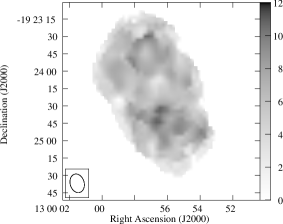
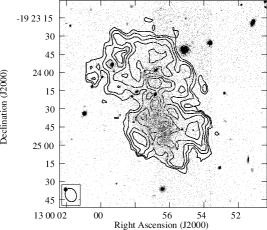
4.2.4 J1259–1924 = PGC044681 = KK176 = HIPASSJ1259–19
J1259–1924 was first identified as a nearby galaxy and a gas-rich object by Huchtmeier et al. (2000). Subsequently, it was also observed in H i line by Pisano et al. (2011), who categorized this galaxy (listed as SGC 1257–1909) as a member of a so-called ‘HIPASS’ Group, which includes three other galaxies. Their H i mapping had a relatively poor angular resolution of 177 40. Therefore, we only can use their integrated H i parameters for comparison. The nearest neighboring galaxy to J1259–1924 is UGCA320 (DDO161 or J130316.8–172523), with a radial velocity Vhel = 742 km s-1, situated at a projected distance of approximately 2.2°, corresponding to 0.28 Mpc. UGCA320 is situated at a known TRGB-based distance of 6.03 Mpc (Karachentsev et al., 2017), while J1259–1924 has a TRGB-based distance of 7.3 Mpc. The radial velocity of UGCA320 differs by V = –86 km s-1 from that of J1259–1924. This difference, assuming the Hubble flow, corresponds to the mutual line-of-site distance of 1.2 Mpc, which is very close to the difference of distances, determined via the TRGB method. This indicates that two galaxies do not belong to the same aggregate as also was noted by Karachentsev et al. (2017).
The main galaxy of this ‘HIPASS’ group, the subluminous Sc spiral NGC5068 (J131854.8–210220), with the absolute magnitude of MB = –18.45 mag (HyperLEDA) and with Vhel = 671 km s-1, is a part of the NVG sample of galaxies in the nearby voids (Pustilnik et al., 2019). Its TRGB-based distance, D=5.15 Mpc, was determined by Karachentsev et al. (2017). This value is 2.1 Mpc smaller than the distance to J1259–1924. This indicates that J1259–1924 is not associated to NGC5068. This conclusion was also made by Karachentsev et al. (2017). They made a similar conclusion for UGCA320 and its companion UGCA319.
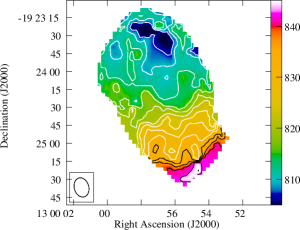
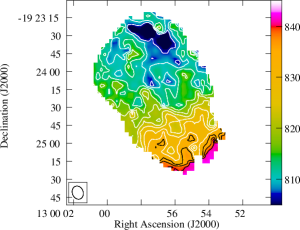
We present the H i column density and velocity distributions of J1259–1924 in Figure 6. The top row displays maps with the beam width of FWHM40. At this low resolution, the H i body (left-hand panel), elongated approximately from the S to the N, has a rather simple morphology of a disc seen at a moderate inclination angle. The velocity field (in the middle panel), in general, corroborates this impression. It looks rather regular and resembles the appearance of the global rotation.
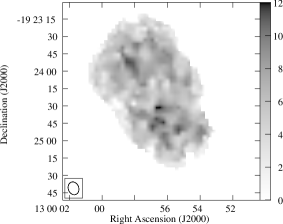
The right panel shows the observed velocity dispersion (MOM2) of H i gas in grey scale. As the right-hand scale bar shows, it varies along the body from rather typical level of 6–8 km s-1 in the outer parts to the elevated value of 12 km s-1 in the center. To derive the true value of velocity dispersion, we apply the same corrections as for the previous galaxies that gives us the range for 6–10 km s-1. The regions of the enhanced velocity dispersion are often localized close to the peaks of gas density, and hence, can be related to the sites of the recent or current star formation.
In the middle and bottom rows we show the higher resolution maps with FWHM of 14 (16 12) and 10(11 8.5). These maps show only the shrinked portion of the H i body visible in the top row due to ‘resolving-out effect’ of the outer parts, particularly those with the lowest column densities. In these moment maps, the extent of H i is reduced by a factor of 1.5 relative to that of the whole body shown in the top row. The morphology of this structure is complex, with multiple local density peaks at column density level of (6–8)1020 atoms cm-2. The respective MOM1 maps show the complex structure. While a general velocity gradient is observable from the north to the south, covering a full range of 35 km s-1, there are regions exhibiting substantial velocity disturbances, with extents comparable to the beam size. Some of these disturbances coincide with the positions of local gas density peaks.
The smooth density map and velocity field with a beam size of FWHM 40 are well resolved and appears rather regular, albeit also with tracers of the apparent disturbance. This map can be used, similar to the previous galaxies, to estimate the indicative dynamical mass within the limits of the detected H i body. We adopt the full extent along the major axis as 210. This corresponds to the linear radius of R(H i) = 3.7 kpc. With the full range of radial velocity of W62 km s-1, and inclination angle of = 64°, the adopted Vrot 34.5 km s-1. Then, the estimate of Mdyn as derived on the lowest resolution data, is 1.0109 M⊙. This estimate is a factor of 1.6 larger than presented in Table 3, which is derived with R(H i) obtained on the MOM0 map with the beam width of 15.
The local environment of J1259–1924 was examined on the DR10 colour image of the Legacy survey. Within the radius of 30, the only bluish galaxy which can be potentially in the LV, is PGC858037 (J125922.48-191358.1), with B18.0 mag and AB =0.4, situated at the projected distance of 13.7 (28 kpc). If this galaxy would have radial velocity within the observed range for the target object, for a typical ratio M(H i)/L 1, one could expect its F(H i) at the level of 0.6 Jy km s-1. However, due to its off-set position relative to the center of the GMRT primary beam, one expects a flux loss by a factor of more than two, and hence, the flux of 0.3 Jy km s-1. If it would have the mentioned above flux of 0.6 Jy km s-1, and the velocity below 3000 km s-1, it would be detected in the map of Pisano et al. (2011). Our data cubes at various angular resolutions do not indicate any signal at this position.
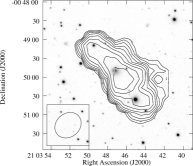
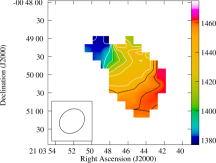
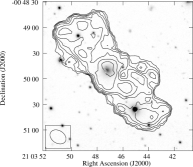
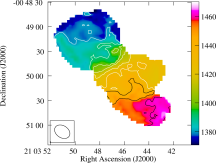
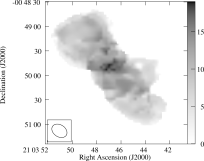
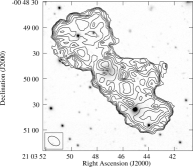
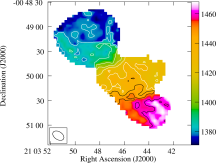
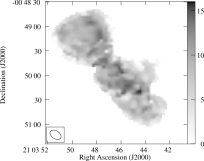
4.2.5 J2103–0049=PGC1133627
The global H i parameters of J2103–0049 were initially obtained by van Driel et al. (2016) on observations with the Nançay Radio telescope (NRT). The accuracy of their H i flux is 20%. Therefore, the better quality data, including the column density maps and velocity field are clearly needed. It was also quite atypical for that faint and compact dwarf to have rather large velocity width W 80 km s-1.
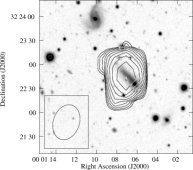
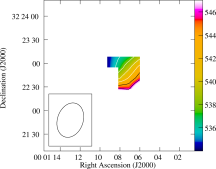
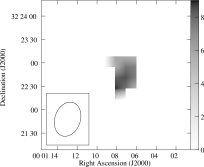
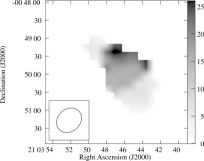
H i maps for galaxy J2103–0049 are shown in Figure 7. In the top row, the MOM0, MOM1 and MOM2 maps with the beam width of FWHM 41 (45.5 37.5) are presented. In the left-hand panel, the H i density contours are overlaid on the grey scale SDSS Stripe82 optical image in filter . The main H i body is well elongated (axial ratio of 3), with the total extent of 3 and the major axis directed at PA 45°. This is in contrast with the optical appearance of the almost round blue oval with the total extent of 15. The bending H i body is clearly disturbed, with appendages visible on the W and E sides. As seen in the middle panel (MOM1), the full range of velocities is 80 km s-1, that corroborates the respective H i profile width from van Driel et al. (2016). The general velocity gradient is close to the direction along the ‘major’ axis, but the velocity field looks asymmetric. The map of the visible velocity dispersion (MOM2) in the right-hand panel displays the values substanially larger than for the other dwarfs in this work. In particular, this relates to the regions at the W edge of the main body, where MOM2 is enhanced up to 20–25 km s-1. The highest values of MOM2 seem to be related to regions of the large velocity gradients smeared by the large beam size of the lowest resolution moment maps.
In the middle and bottom rows, we show the similar maps for beams with FWHM of 17 (20 15) and 12 (14.5 9.5), respectively. With this 2–3-times higher angular resolution, the overall size of H i body remains close to that for the lowest resolution map. This implies that the outer parts appear to have sufficiently high densities and are not resolved out by the smaller beams.
The higher resolution maps reveal a three-part structure, with the isovelocity lines bending on the both, the NE and SW edges. Besides, the central region of the gas body, surrounding the compact stellar image, can be dynamically separated from the two outer parts, since within this region the gas radial velocity shows only small changes.
In MOM2 maps, the region of the largest velocity dispersion, of 15–18 km s-1 falls close to the stellar body of the galaxy, in which we witness the recent and current star formation. With the substantial correction of the observed MOM2 for the contribution of the velocity gradient (20 km s-1 on the scale of the beam width), the related values of are reduced to 11–12 km s-1. This enhanced can indicate the local agitation of the surrounding gas.
All the global irregularities, both in the gas distribution and in the velocity field, indicate the non-equilibrium state of the gas body in this galaxy.
On the lowest resolution maps, with the beam width of 40 (Fig. 7, top row), both, the morphology and velocity field resemble at the first approximation a rotating disc, albeit with the apparent disturbances. We use both, the gas body extent and the full range of the monotonic velocity gradient to get the estimate of the indicative dynamical mass, similar to other studied dwarfs. The angular extent along the major axis of the H i body is 3 (or 15 kpc), and the related radius at the column density of 1.3 1019 atoms cm-2 is 7.5 kpc. The full velocity range on the MOM1 map is 90 km s-1. However, its parameter W20, as revealed by the integrated H i profile in Figure 2, is of 145 km s-1 (see Table 3). With the adopted = 84°, we derive the estimate of Vrot = 73 km s-1. The corresponding dynamical mass is of Mdyn = 9.2109 M⊙.
We examined the local environment of this galaxy in order to identify potential disturbers. Within a radius of 30, HyperLEDA provides the only galaxy with a close radial velocity. This is PGC1139658 = J2104–0035, at Vhel = 1401 km s-1 (Ekta et al., 2008) and B 17.4 mag, located at a projected distance of 117 kpc (23). This well-known gas-rich XMP dwarf (Izotov et al., 2006; Ekta et al., 2008; Pustilnik et al., 2020a) is unbound to the target galaxy J2103–0049, but appears to be a part of the same filament of the void substructure.
In the Legacy survey image, we identify two faint bluish galaxies: one located at 1.6 (8 kpc) to NW, with B20.6 mag, and another at 2.9 (15 kpc) to S, with B19.7 mag. Considering the typical ratio of M(H i)/L1, their expected F(H i) are only 0.04 and 0.11 Jy km s-1, respectively, which are too low for the detection with the current GMRT observations. An alternative option is to obtain their optical redshifts, which appears to be feasible. If these faint galaxies are situated in the same ‘cosmic cell’ as the target galaxy, their baryonic masses are a factor of 25 and 10 lower than that of the target object. Accounting for their projected distances, these low-mass objects at the 3D distances of 12 and 20 kpc, could, in principle have a sizable tidal effect on to the main, J2103–0049. Thus, if their proximity will be confirmed by the optical spectroscopy, a more detailed analysis of their possible interaction will be required.
5 DISCUSSION
5.1 Global parameters of void XMP dwarfs
In this paper, we present the GMRT H i mapping of the first 5 XMP void dwarfs from a subsample of 15 such galaxies. A comprehensive statistical analysis of their main properties, along with a comparison to the other known dwarf samples with the similar range of baryonic masses, such as FIGGS (Begum et al., 2008a) and SHIELD (McQuinn et al., 2021, and references therein), is planned after presenting the remaining 10 void dwarfs in this category. Nevertheless, it is worth briefly describing and summarising their main properties in Tables 1 and 3. At first approximation, they appear to be representative of the larger sample of void XMP dwarfs, mapped so far in the H i 21-cm line.
The parameters for the studied XMP dwarfs in Tables 1 and 3 show a rather small scatter in their global parameters. This can be partly attributed to selection criteria used to separate such objects from the full list of 1350 objects in the NVG sample, as described in Pustilnik et al. (2020a). For example, their absolute blue magnitudes all fall within the range MB of –12.4 to –14.1 mag, that is their luminosity varies by a factor of about five. All these dwarfs are gas-rich, with the range of their M(H i)/LB 1–7.
The atomic gas (H i and He) is the dominant component of their baryon mass. Mgas varies by a factor of 7, ranging from 2.5 to 17.4 107 M⊙. This roughly reflects the range of their optical blue luminosity, provided mostly by a relatively young stellar population, as indicated by their bluish or blue integrated optical colours. Since the apparent magnitudes of these dwarfs are rather faint, not all of the galaxies have good optical multi-colour photometry and NIR magnitudes. Therefore, the estimates of their stellar mass are available only for a subset of these XMP void dwarfs. For the four dwarfs with available estimates of the stellar mass, it comprises roughly from 5 to 10 percent of the total baryon mass.
The width of the line profile of the integrated H i emission serves an indicator of the amplitude of gas motions. The line profile, besides the systematic motions (rotation, expansion, accretion), includes as well the contribution from both, thermal and turbulent gas motions in the galaxy, with the typical velocity dispersion of 6–10 km s-1(e.g. Tamburro et al., 2009). The profile widths – W50 and W20 for our GMRT data, as derived from the lowest angular resolution cubes (FWHM 40), are shown in Table 3. The derived values of W50 are relatively small, ranging from 20 to 40 km s-1, except for galaxy J2103–0049, for which this parameter reaches of 108 km s-1. This galaxy is the most distant and massive of all five dwarfs in this sample. One of the possible reasons of its increased velocity amplitude and enhanced velocity dispersion can be a merger, as the gas morphology and kinematics hint (see Fig. 7).
The estimates of H i profile widths, presented in Table 3, allow one to estimate the value of Vrot. For all dwarfs except J2103-0049, the derived values of V fall within the range of 23 to 47 km s-1. The indicative dynamical masses in Table 3 are estimated for galaxy radii corresponding to the surface density level of 1 M⊙ pc-2 derived for all galaxies on the MOM0 maps with the beam width of . For this beam width, all studied galaxies are sufficiently well resolved and the respective radii are reliably measured.
The dynamical mass, defined in this manner, falls within the range of (1.6–8.8)108 M⊙. The case of J2103–0049 appears to be an exception. For this object, with Vrot = 73 km s-1, M 9109 M⊙, is about an order of magnitude larger than for the rest of the group. This can be related to its probable merger case, since for this interpretation, the observed velocity range could be due to the relative orbital velocity of the two merging components. A deeper study of this object is needed to elucidate its outlying parameters. As for the estimates of the indicative dynamical mass in the four other dwarfs, of 109 M⊙, these values are rather lower limits due to the usage of the estimated linear radius in Formula 2. In all these objects, this radius corresponds to the column gas density of 1.25 1020 atoms cm-2 (or to the mass surface density of 1 M⊙ pc-2). In addition, we also present estimates of Mdyn, in Table 3, calculated using the maximal radii of H i body observed in MOM0 maps with the beam width of 15.
5.2 Spin misalignment of H i-gas and stellar body
The mutual orientation of gas and stellar spins is an important indicator of the non-equilibrium state of a galaxy, related to the recent interactions, mergers or gas accretion. In Figure 1, we show the optical images of the studied galaxies, extracted from the Legacy database, which give the impression of their optical morphology and orientation. We highlight the most reliable cases where a clear misalignment or, conversely, a good alignment of the gas and stellar spins is observed.
For galaxies J0001+3222, J0231+2542 and J1259–1924, their optical low surface brightness (LSB) bodies are significantly elongated. Their H i gas bodies are clearly elongated as well.
In the case of J0001+3222, the major axis of the H i distribution for the low resolution MOM0 map (FWHM 40) is inclined at a large angle (of 45°) relative to the major axis of the optical disc. In the higher resolution maps, the gas component is elongated approximately along the optical major axis. However, in addition, there is an appendage in the direction, approximately perpendicular to the optical major axis. One can suggest that this feature represents a residual of the mainly resolved out extended gas which is misaligned with the optical ‘disc’.
For J0231+2542, the direction of the major axis of H i distribution is roughly perpendicular to that of the major axis of the LSB optical body.
The stellar LSB body of J0306+0028 looks roundish and rather irregular due to several brightness spikes. This precludes the determination of the major axis orientation. Therefore, despite the H i body is well elongated at the lowest resolution, and its orientation keeps approximately the same for maps with the higher resolution, it is difficult to judge about the relative orientation of spins for the stellar and gas bodies. Thus, the indication on the non-equilibrium state of this galaxy comes primarily from the complex morphology and velocity field of H i gas, which are better seen in the higher resolution maps in Figures 5.
For the nearest dwarf J1259–1924, both the stellar and the atomic gas bodies are elongated approximately in the same direction. The H i disc has the complex structure in the MOM0 map with the lowest resolution, with the appendages at the SW edge and on the eastern side. This makes difficult to determine the alignment between the spins of the stellar and gas discs. At the higher angular resolution, with even more complex morphology, one does not notice an apparent misalignment of H i body with that of the stellar component.
The void XMP dwarf J2103–0049 also has the roundish form of the optical LSB outer body. However, a small elongation allows one to estimate the PA of the major axis of 60°. This seems to differ significantly from the orientation of the H i major axis for the lowest resolution beam width. As discussed above, the unusual gas morphology and velocity field probably indicate an advanced merger. However, the option of gas accretion is also possible. To arrive to a more based conclusions about the real scenario resulted in the visible disturbed morphology and gas motions, one needs a more detailed analysis of the studied dwarfs, including the multiwavelength data and the clear criteria to distinguish the cases of a merger or of the secular/intermittent accretion of the unprocessed void gas.
In fact, the misalignment of stellar and gaseous spins (both, atomic and ionised), including their counter-rotation, is not a very rare phenomenon. E.g., a large review of the known cases of the cold gas accretion to spiral galaxies was presented by Sancisi et al. (2008). However, the majority of the known cases are related to rather massive discs, where the ordered motions of stars and gas are clearly traced. They include, in particular, the so-called polar-ring galaxies (e.g. Moiseev, 2012; Moiseev et al., 2015; Egorov & Moiseev, 2019) and many cases of S0 galaxies (e.g. Sil’chenko et al., 2019, 2023).
A fraction of misaligned spins found in the systematical studies with the ‘SAMI’ and ‘MaNGA’ instrument, covering large representative samples of disc galaxies (e.g. Ristea et al., 2022; Xu et al., 2022; Zinchenko, 2023), appears at the level of 5–12%. The most straightforward interpretation of this phenomenon is an appearance of the recent gas accretion or a minor merger. This occurs when the spin of the main component is inclined relative to the direction of the orbital angular momentum of the inflowing gas or of the infalling ‘companion’.
For dwarfs, this kind of phenomenon is noticed and described only for a few objects (e.g. MRK996, Jaiswal & Omar, 2020). For dwarfs in the void environment, this phenomenon is even less studied, mainly due to the absence of suitable void galaxy samples, in which the atomic gas component can be mapped with the sufficient angular resolution and sensitivity.
For void dwarfs, these should be in principle the same mechanisms, however with the substantially scaled down parameters. In particular, due to the reduced number density ngal, roughly by a factor of 5 relative to the mean density, typical of walls, the galaxy collision rate can be reduced by a factor of n. In reality, due to the small-scale clustering, this effect should be smaller, however. Similarly, as argued by Aragon-Calvo & Szalay (2013), the gas motions in the small void filaments are expected to be sub-sound in difference to those for the denser and longer filaments. This can change the parameters of cold gas accretion.
The known examples of accretion and interaction in voids are the polar-ring galaxy VGS-12 from the Void Galaxy Survey (Kreckel et al., 2012), which resides in the wall between the two prominent voids (Stanonik et al., 2009). Several void XMP galaxies, studied earlier with GMRT, show the clear traces of merging or probable accretion (Ekta et al., 2008; Chengalur et al., 2017).
5.3 Disturbed H i-morphology in void XMP dwarfs in the context
As mentioned above, all XMP void dwarfs in this study exhibit clear disturbances in both, morphology and velocity fields across various spatial scales. However, no sufficiently close companions were known for any of these five XMP dwarfs. Therefore, one of the secondary objectives of our GMRT H i-mapping was to search for possible dwarf disturbers in the surroundings of the target galaxies. Our analysis of potential counterparts for the target dwarfs within the GMRT primary beam field of view (FWHM 22) did not reveal any candidates with H i flux larger than 10–20 percent of that for the main target object. Therefore, the fly-by tidal effects from the unknown sufficiently close neighbours appear, in general, unimportant for the studied dwarfs.
These void XMP dwarfs represent the lower parts of the galaxy luminosity or mass functions. Several samples of low mass dwarfs were studied so far via H i mapping, including SHIELD (McQuinn et al., 2021) and FIGGS (Begum et al., 2008b). They closely match the mass and luminosity range of the galaxies in this work. Moreover, by chance, some of the representatives of these samples fall into nearby voids and belong to our primary Nearby Void Galaxy (NVG) sample (Pustilnik et al., 2019). We are planning to compare their properties with our low-mass void sample in upcoming papers, where we will present GMRT observations for the remaining 10 XMP dwarfs. This approach will enable us to obtain statistically significant results.
There are several scenarios that could be responsible for the observed non-equilibrium state of the atomic gas in the discussed dwarfs. They include: 1) an effect of the localized star formation leading to the formation of expanding gas shells; 2) a result of the advanced stage of a (minor) merger; 3) tidal disturbance by a nearby ‘dark’ neighbour, that is by a very gas-rich Dark Matter (DM) halo with a small fraction of stellar mass, which could remain undetected in the moderate depth optical imaging surveys. And finally, 4) the on-going accretion of intergalactic gas, presumably from the cosmic filaments.
For shells or outflows related to the strong star formation (SF) burst and their probable cumulative effect, one does not expect counter-rotating gas or other global effects. We can not exclude effect of the old sufficiently powerful localized SF on the overall gas morphology and kinematics. However, since the majority of our void dwarfs belong to the LSB population, the alternative scenarios seem to be more probable.
Of them, the tidal disturbance by a fly-by ‘dark’ object is an open option, since the estimate of its effect depends on the observational upper limit on its H i mass and the related mass of the DM halo, on the one hand, and the distance of such ‘dark’ object from the target dwarf. This requires high resolution numerical simulations of small galaxy interactions, which also should account for baryonic component of the main galaxy being almost purely gaseous.
The remaining two scenarios, a merger of two dwarfs and accretion of intergalactic gas, are both quite probable. However, due to the significantly reduced average galaxy density in voids, the rate of mergers is expected to be many times lower than in the adjacent walls and the denser elements of structure. On the other hand, as shown by Aragon-Calvo & Szalay (2013), the specific conditions of the subsonic gas flows in small void filaments, are conducive for the cold gas accretion onto void galaxies. Therefore, one can expect, that in voids, the main mechanism of the external disturbance of a galaxy is related to cold gas accretion.
To distinguish between the two scenarios and to understand which one is applicable in specific instances, a detailed investigation through advanced simulations is required. The parameters of the studied void XMP dwarfs emphasize the necessity for high mass resolution (preferably better than 105 M⊙ on baryonic matter), particularly for these predominantly gaseous objects.
6 Summary and conclusions
We present the results of the sensitive and high-angular-resolution GMRT H i-mapping of the five most metal-poor (12+(O/H) = 7.13–7.28 dex) isolated gas-rich void dwarf galaxies. This work presents the first part of the whole sample of 15 XMP void dwarfs mapped to date in the H i line with GMRT. The statistical analysis of these results and the comparison with samples of similar mass and luminosity dwarfs studied by other groups will be addressed in future work. Summarising the results and discussion above, we draw the following conclusions:
-
1.
Despite their isolation from potentially disturbing galaxies, all of them show overall disturbed H i-morphology and velocity fields, clearly indicating a non-equlibrium state of their dominant baryonic component. Additional examination of the surroundings of the studied dwarfs, conducted on the Legacy survey images up to projected distances of 100 kpc, did not reveal potential disturbers. Furthermore, our GMRT observations, with a limiting H i column density sensitivity of (1–2)1019atoms cm-2, did not detect any potential gas-rich disturbers within the primary beam of GMRT, which corresponds to projected distances of 30–80 kpc.
-
2.
Another evidence of the non-equilibrium state of gas in the studied objects is the significant misalignment between the spins of H i and stellar ‘discs’. The simplest interpretation of this phenomenon is related to the dynamical youth, that is the unrelaxed state after the recent non-coplanar accretion of the intergalactic medium gas blob or a gas-rich merger.
-
3.
The new results add a significant number of isolated void XMP objects in a non-equilibrium state to a few similar objects known from earlier studies. We discuss possible scenarios responsible for the disturbed H i morphology of the studied dwarfs: expelling H i-gas due to the previous substantial localized SF episode, the recent minor merger, the effect of the nearby ‘dark’ galaxies, or the cold gas accretion. While the last scenario seems to be better consistent with the available data, new high-resolution simulations of cold gas accretion in voids are necessary to make more certain conclusions.
Acknowledgements
This paper is based in part on observations taken with the GMRT. We thank the staff of the GMRT who made these observations possible. The GMRT is run by the National Centre for Radio Astrophysics of the Tata Institute of Fundamental Research. The reported study was funded by Russian Science Foundation according to the research project 22-22-00654. The research of SK was supported by the South African Research Chairs Initiative (SARChI) of the Department of Science and Technology and National Research Foundation.
Our thanks are to M.P. Haynes, who provided us with the ALFALFA H i profiles for part of the galaxies studied in this work. The authors acknowledge the spectral and photometric data and the related information available in the SDSS and the Legacy survey databases. The Sloan Digital Sky Survey (SDSS) is a joint project of the University of Chicago, Fermilab, the Institute for Advanced Study, the Japan Participation Group, the Johns Hopkins University, the Max-Planck-Institute for Astronomy (MPIA), the Max-Planck-Institute for Astrophysics (MPA), New Mexico State University, Princeton University, the United States Naval Observatory, and the University of Washington. This research has made use of the NASA/IPAC Extragalactic Database (NED), which is operated by the Jet Propulsion Laboratory, California Institute of Technology, under contract with the National Aeronautics and Space Administration.
The DESI Legacy Imaging Surveys consist of three individual and complementary projects: the Dark Energy Camera Legacy Survey (DECaLS), the Beijing-Arizona Sky Survey (BASS), and the Mayall z-band Legacy Survey (MzLS). DECaLS, BASS and MzLS together include data obtained, respectively, at the Blanco telescope, Cerro Tololo Inter-American Observatory, NSF’s NOIRLab; the Bok telescope, Steward Observatory, University of Arizona; and the Mayall telescope, Kitt Peak National Observatory, NOIRLab. NOIRLab is operated by the Association of Universities for Research in Astronomy (AURA) under a cooperative agreement with the National Science Foundation. Pipeline processing and analyses of the data were supported by NOIRLab and the Lawrence Berkeley National Laboratory (LBNL). Legacy Surveys also uses data products from the Near-Earth Object Wide-field Infrared Survey Explorer (NEOWISE), a project of the Jet Propulsion Laboratory/California Institute of Technology, funded by the National Aeronautics and Space Administration. Legacy Surveys was supported by: the Director, Office of Science, Office of High Energy Physics of the U.S. Department of Energy; the National Energy Research Scientific Computing Center, a DOE Office of Science User Facility; the U.S. National Science Foundation, Division of Astronomical Sciences; the National Astronomical Observatories of China, the Chinese Academy of Sciences and the Chinese National Natural Science Foundation. LBNL is managed by the Regents of the University of California under contract to the U.S. Department of Energy.
We acknowledge the use of the ilifu cloud computing facility—www.ilifu.ac.za, a partnership between the University of Cape Town, the University of the Western Cape, the University of Stellenbosch, Sol Plaatje University, the Cape Peninsula University of Technology, and the South African Radio Astronomy Observatory. The Ilifu facility is supported by contributions from the Inter-University Institute for Data Intensive Astronomy (IDIA a partnership between the University of Cape Town, the University of Pretoria, the University of the Western Cape and the South African Radio Astronomy Observatory), the Computational Biology division at UCT and the Data Intensive Research Initiative of South Africa (DIRISA).
Data Availability
The raw data underlying this article are available at the GMRT archive. The data cubes and the moment maps are available on request from the authors (SK).
References
- Abazajian et al. (2009) Abazajian K. N., et al., 2009, ApJS, 182, 543
- Adelman-McCarthy et al. (2007) Adelman-McCarthy J. K., et al., 2007, ApJS, 172, 634
- Aragon-Calvo & Szalay (2013) Aragon-Calvo M. A., Szalay A. S., 2013, MNRAS, 428, 3409
- Begum et al. (2008a) Begum A., Chengalur J. N., Karachentsev I. D., Sharina M. E., 2008a, MNRAS, 386, 138
- Begum et al. (2008b) Begum A., Chengalur J. N., Karachentsev I. D., Sharina M. E., Kaisin S. S., 2008b, MNRAS, 386, 1667
- Berg et al. (2012) Berg D. A., et al., 2012, ApJ, 754, 98
- Chengalur & Pustilnik (2013) Chengalur J. N., Pustilnik S. A., 2013, MNRAS, 428, 1579
- Chengalur et al. (2015) Chengalur J. N., Pustilnik S. A., Makarov D. I., Perepelitsyna Y. A., Safonova E. S., Karachentsev I. D., 2015, MNRAS, 448, 1634
- Chengalur et al. (2017) Chengalur J. N., Pustilnik S. A., Egorova E. S., 2017, MNRAS, 465, 2342
- Dekel et al. (2013) Dekel A., Zolotov A., Tweed D., Cacciato M., Ceverino D., Primack J. R., 2013, MNRAS, 435, 999
- Dey et al. (2019) Dey A., et al., 2019, AJ, 157, 168
- Egorov & Moiseev (2019) Egorov O. V., Moiseev A. V., 2019, MNRAS, 486, 4186
- Ekta & Chengalur (2010) Ekta B., Chengalur J. N., 2010, MNRAS, 406, 1238
- Ekta et al. (2008) Ekta B., Chengalur J. N., Pustilnik S. A., 2008, MNRAS, 391, 881
- Ekta et al. (2009) Ekta B., Pustilnik S. A., Chengalur J. N., 2009, MNRAS, 397, 963
- Fliri & Trujillo (2016) Fliri J., Trujillo I., 2016, MNRAS, 456, 1359
- Guo et al. (2020) Guo Q., et al., 2020, Nature Astronomy, 4, 246
- Guseva et al. (2017) Guseva N. G., Izotov Y. I., Fricke K. J., Henkel C., 2017, A&A, 599, A65
- Haynes et al. (2018) Haynes M. P., et al., 2018, ApJ, 861, 49
- Hsyu et al. (2017) Hsyu T., Cooke R. J., Prochaska J. X., Bolte M., 2017, ApJ, 845, L22
- Hsyu et al. (2018) Hsyu T., Cooke R. J., Prochaska J. X., Bolte M., 2018, ApJ, 863, 134
- Huchtmeier et al. (2000) Huchtmeier W. K., Karachentsev I. D., Karachentseva V. E., Ehle M., 2000, A&AS, 141, 469
- Izotov & Thuan (2007) Izotov Y. I., Thuan T. X., 2007, ApJ, 665, 1115
- Izotov et al. (2006) Izotov Y. I., Papaderos P., Guseva N. G., Fricke K. J., Thuan T. X., 2006, A&A, 454, 137
- Izotov et al. (2018) Izotov Y. I., Thuan T. X., Guseva N. G., Liss S. E., 2018, MNRAS, 473, 1956
- Izotov et al. (2019) Izotov Y. I., Guseva N. G., Fricke K. J., Henkel C., 2019, A&A, 623, A40
- Jaiswal & Omar (2020) Jaiswal S., Omar A., 2020, MNRAS, 498, 4745
- James et al. (2017) James B. L., Koposov S. E., Stark D. P., Belokurov V., Pettini M., Olszewski E. W., McQuinn K. B. W., 2017, MNRAS, 465, 3977
- Karachentsev et al. (2017) Karachentsev I. D., Makarova L. N., Tully R. B., Rizzi L., Karachentseva V. E., Shaya E. J., 2017, MNRAS, 469, L113
- Kereš et al. (2005) Kereš D., Katz N., Weinberg D. H., Davé R., 2005, MNRAS, 363, 2
- Kereš et al. (2009) Kereš D., Katz N., Fardal M., Davé R., Weinberg D. H., 2009, MNRAS, 395, 160
- Kniazev et al. (2003) Kniazev A. Y., Grebel E. K., Hao L., Strauss M. A., Brinkmann J., Fukugita M., 2003, ApJ, 593, L73
- Kojima et al. (2020) Kojima T., et al., 2020, ApJ, 898, 142
- Kreckel et al. (2012) Kreckel K., Platen E., Aragón-Calvo M. A., van Gorkom J. H., van de Weygaert R., van der Hulst J. M., Beygu B., 2012, AJ, 144, 16
- Kurapati (2020) Kurapati S., 2020, PhD thesis, TIFR, National Center for Radiophysics, Pune
- Kurapati et al. (2018) Kurapati S., Chengalur J. N., Pustilnik S., Kamphuis P., 2018, MNRAS, 479, 228
- Kurapati et al. (2020) Kurapati S., Chengalur J. N., Kamphuis P., Pustilnik S., 2020, MNRAS, 491, 4993
- McQuinn et al. (2021) McQuinn K. B. W., et al., 2021, ApJ, 918, 23
- Meyer et al. (2004) Meyer M. J., et al., 2004, MNRAS, 350, 1195
- Moiseev (2012) Moiseev A. V., 2012, Astrophysical Bulletin, 67, 147
- Moiseev et al. (2015) Moiseev A., Khoperskov S., Khoperskov A., Smirnova K., Smirnova A., Saburova A., Reshetnikov V., 2015, Baltic Astronomy, 24, 76
- Perepelitsyna et al. (2014) Perepelitsyna Y. A., Pustilnik S. A., Kniazev A. Y., 2014, Astrophysical Bulletin, 69, 247
- Pisano et al. (2011) Pisano D. J., Barnes D. G., Staveley-Smith L., Gibson B. K., Kilborn V. A., Freeman K. C., 2011, ApJS, 197, 28
- Prasad & Chengalur (2012) Prasad J., Chengalur J., 2012, Experimental Astronomy, 33, 157
- Pustilnik & Martin (2016) Pustilnik S. A., Martin J. M., 2016, A&A, 596, A86
- Pustilnik & Tepliakova (2011) Pustilnik S. A., Tepliakova A. L., 2011, MNRAS, 415, 1188
- Pustilnik et al. (2010) Pustilnik S., Kniazev A., Lyamina Y., Tepliakova A., 2010, arXiv e-prints, p. arXiv:1011.3430
- Pustilnik et al. (2011) Pustilnik S. A., Martin J. M., Tepliakova A. L., Kniazev A. Y., 2011, MNRAS, 417, 1335
- Pustilnik et al. (2016) Pustilnik S. A., Perepelitsyna Y. A., Kniazev A. Y., 2016, MNRAS, 463, 670
- Pustilnik et al. (2019) Pustilnik S. A., Tepliakova A. L., Makarov D. I., 2019, MNRAS, 482, 4329
- Pustilnik et al. (2020a) Pustilnik S. A., Egorova E. S., Perepelitsyna Y. A., Kniazev A. Y., 2020a, MNRAS, 492, 1078
- Pustilnik et al. (2020b) Pustilnik S. A., Kniazev A. Y., Perepelitsyna Y. A., Egorova E. S., 2020b, MNRAS, 493, 830
- Pustilnik et al. (2021) Pustilnik S. A., Egorova E. S., Kniazev A. Y., Perepelitsyna Y. A., Tepliakova A. L., Burenkov A. N., Oparin D. V., 2021, MNRAS, 507, 944
- Pustilnik et al. (2022) Pustilnik S. A., Perepelitsyna Y., Tepliakova A., Kniazev A., Egorova E., Chengalur J. N., Kurapati S., 2022, in The Multifaceted Universe: Theory and Observations - 2000. p. 26 (arXiv:2212.05640), doi:10.48550/arXiv.2212.05640
- Ristea et al. (2022) Ristea A., et al., 2022, MNRAS, 517, 2677
- Roberts (1962) Roberts M. S., 1962, AJ, 67, 437
- Rojas et al. (2004) Rojas R. R., Vogeley M. S., Hoyle F., Brinkmann J., 2004, ApJ, 617, 50
- Rojas et al. (2005) Rojas R. R., Vogeley M. S., Hoyle F., Brinkmann J., 2005, ApJ, 624, 571
- Roychowdhury et al. (2013) Roychowdhury S., Chengalur J. N., Karachentsev I. D., Kaisina E. I., 2013, MNRAS, 436, L104
- Sánchez Almeida et al. (2016) Sánchez Almeida J., Pérez-Montero E., Morales-Luis A. B., Muñoz-Tuñón C., García-Benito R., Nuza S. E., Kitaura F. S., 2016, ApJ, 819, 110
- Sánchez-Janssen et al. (2010) Sánchez-Janssen R., Méndez-Abreu J., Aguerri J. A. L., 2010, MNRAS, 406, L65
- Sancisi et al. (2008) Sancisi R., Fraternali F., Oosterloo T., van der Hulst T., 2008, A&ARv, 15, 189
- Serra et al. (2015) Serra P., et al., 2015, MNRAS, 448, 1922
- Sil’chenko et al. (2019) Sil’chenko O. K., Moiseev A. V., Egorov O. V., 2019, ApJS, 244, 6
- Sil’chenko et al. (2023) Sil’chenko O. K., Moiseev A. V., Oparin D. V., Zlydneva D. V., Kozlova D. V., 2023, Astronomy Letters, 49, 229
- Sorrentino et al. (2006) Sorrentino G., Antonuccio-Delogu V., Rifatto A., 2006, A&A, 460, 673
- Stanonik et al. (2009) Stanonik K., Platen E., Aragón-Calvo M. A., van Gorkom J. H., van de Weygaert R., van der Hulst J. M., Peebles P. J. E., 2009, ApJ, 696, L6
- Staveley-Smith et al. (1992) Staveley-Smith L., Davies R. D., Kinman T. D., 1992, MNRAS, 258, 334
- Tamburro et al. (2009) Tamburro D., Rix H. W., Leroy A. K., Mac Low M. M., Walter F., Kennicutt R. C., Brinks E., de Blok W. J. G., 2009, AJ, 137, 4424
- Tully et al. (2008) Tully R. B., Shaya E. J., Karachentsev I. D., Courtois H. M., Kocevski D. D., Rizzi L., Peel A., 2008, ApJ, 676, 184
- Tweed et al. (2018) Tweed D. P., Mamon G. A., Thuan T. X., Cattaneo A., Dekel A., Menci N., Calura F., Silk J., 2018, MNRAS, 477, 1427
- Wegner et al. (2019) Wegner G. A., Salzer J. J., Taylor J. M., Hirschauer A. S., 2019, ApJ, 883, 29
- Westmeier et al. (2021) Westmeier T., et al., 2021, MNRAS, 506, 3962
- Xu et al. (2022) Xu H., et al., 2022, MNRAS, 511, 4685
- Zinchenko (2023) Zinchenko I. A., 2023, A&A, 674, L7
- de Blok & Walter (2014) de Blok W. J. G., Walter F., 2014, AJ, 147, 96
- van Driel et al. (2016) van Driel W., et al., 2016, A&A, 595, A118
- van de Weygaert (2016) van de Weygaert R., 2016, in van de Weygaert R., Shandarin S., Saar E., Einasto J., eds, Vol. 308, The Zeldovich Universe: Genesis and Growth of the Cosmic Web. pp 493–523 (arXiv:1611.01222), doi:10.1017/S1743921316010504
- van de Weygaert & Platen (2011) van de Weygaert R., Platen E., 2011, in International Journal of Modern Physics Conference Series. pp 41–66 (arXiv:0912.2997), doi:10.1142/S2010194511000092