FERGI: Automatic Annotation of User Preferences for Text-to-Image Generation from Spontaneous Facial Expression Reaction
Abstract
Researchers have proposed to use data of human preference feedback to fine-tune text-to-image generative models. However, the scalability of human feedback collection has been limited by its reliance on manual annotation. Therefore, we develop and test a method to automatically annotate user preferences from their spontaneous facial expression reaction to the generated images. We collect a dataset of Facial Expression Reaction to Generated Images (FERGI) and show that the activations of multiple facial action units (AUs) are highly correlated with user evaluations of the generated images. Specifically, AU4 (brow lowerer) is most consistently reflective of negative evaluations of the generated image. This can be useful in two ways. Firstly, we can automatically annotate user preferences between image pairs with substantial difference in AU4 responses to them with an accuracy significantly outperforming state-of-the-art scoring models. Secondly, directly integrating the AU4 responses with the scoring models improves their consistency with human preferences. Additionally, the AU4 response best reflects the user’s evaluation of the image fidelity, making it complementary to the state-of-the-art scoring models, which are generally better at reflecting image-text alignment. Finally, this method of automatic annotation with facial expression analysis can be potentially generalized to other generation tasks. The code is available at https://github.com/ShuangquanFeng/FERGI, and the dataset is also available at the same link for research purposes.
1 Introduction
The rapid recent advancements in text-to-image generative models have enabled the generation of high-fidelity images aligned with text prompts [50, 56, 59, 57, 58, 54]. To better improve the fidelity of the generated images and their alignment with the text prompts, researchers collected large-scale datasets of human preference feedback on images generated by text-to-image models [73, 39, 32, 72, 71, 80] and proposed methods of fine-tuning the models with data of human preference feedback [73, 38, 21].
However, the scalability of human feedback collection has still been limited by its reliance on manual annotation. Therefore, we develop and test a system to automatically annotate user preferences for text-to-image generation from their spontaneous facial expression reaction to the generated images. This automatic annotation requires zero additional effort from the real users of text-to-image generators and is thus expected to increase the scalability of human preference feedback data collection.
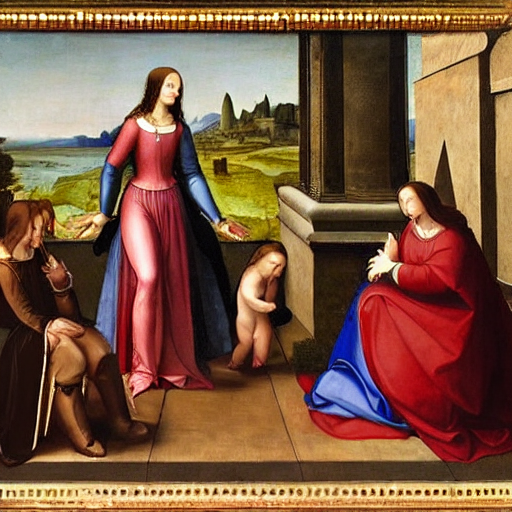
We present the Facial Expression Reaction to Generated Images (FERGI) dataset, which comprises video recordings of 33 participants’ facial expression reaction to 2827 images generated by Stable Diffusion v1.4 [58] based on 576 different self-drafted text prompts, along with their feedback on the generated images from manual input. We estimate the activation of facial action units (AUs), as defined in the Facial Action Coding System (FACS, a comprehensive system breaking down facial expressions into individual components of AUs of muscle movements [19]), in the facial expression reaction videos with a pre-trained model and show that the activations of multiple AUs are highly correlated with user evaluations of the generated images. We further propose a method of automatically annotating user preferences by detecting the activation of AU4 in the facial expression reaction to the generated images and show that this evaluation metric best reflects the user’s evaluation of the image fidelity, making it complementary to the state-of-the-art scoring models, which are generally better at reflecting image-text alignment.
2 FERGI Dataset
2.1 Participants
39 participants were recruited from the SONA system of University of California San Diego (UCSD) and completed the study asynchronously on personal computers. 6 participants were removed from the dataset for various reasons, including failure to participate, failure in video recording, and not permitting sharing of their video recordings for research. Therefore, we ended up with a dataset of 33 participants that is available upon request for research purposes at https://github.com/ShuangquanFeng/FERGI. The collection and usage of human participant data in the dataset were approved by the Institutional Review Board (IRB) of UCSD.
2.2 Data Collection Procedure
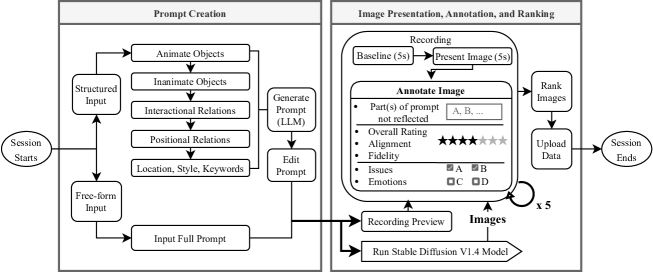
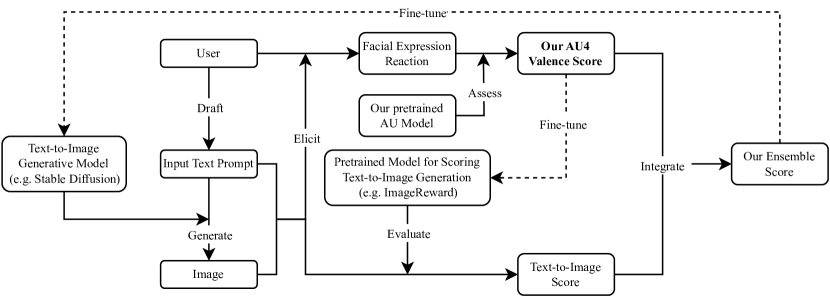
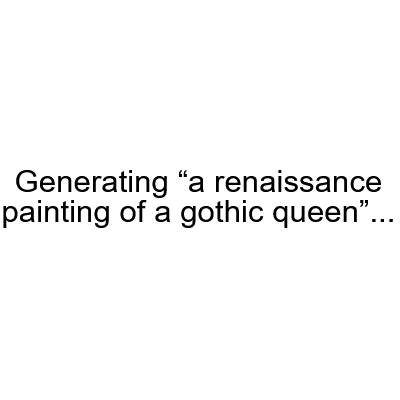
Each participant completes multiple sessions of data collection. In each session, the participant drafts one text prompt and views 5 images generated from the input text prompt. A flow chart of the procedure of each session is shown in Fig. 1. Details are explained below.
2.2.1 Prompt Creation
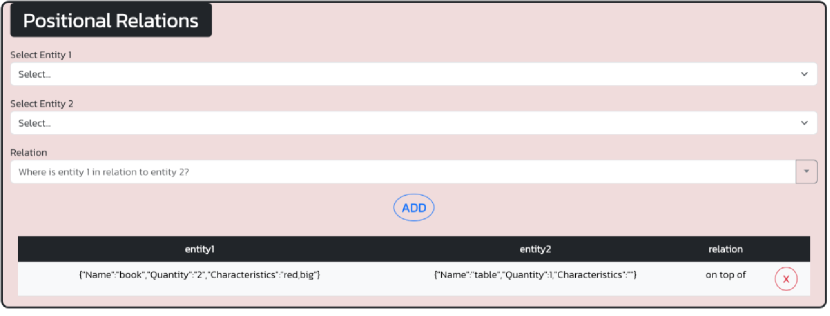
There are two types of sessions, structured input and free-form input. In both types, the participant can freely draft any text prompt as the input as long as it is not NSFW. The only difference between the two types lies in how the input text prompt is created. In a structured input session, the participant fills out a form to separately specify different elements desired in the images to generate: animate objects, inanimate objects, interactional relations (between two objects), positional relations (between two objects), location, style (of the image), and keywords. Based on the contents of the form, a text prompt is then automatically generated by the Large Language Model (LLM) OpenAI gpt3.5-turbo. The participant can freely adjust the generated prompt as the final input text prompt. In a free-form input, the participant directly enters the entire final input text prompt.
2.2.2 Recording
After the input text prompt is finalized, the participant is directed to a webcam preview to confirm that the webcam captures their face appropriately. The webcam is then used to record throughout the rest of the session. The configuration of the raw videos vary based on the participant’s device and browser. Though, recorded videos of most participants have a resolution of , and all recorded videos are standardized to 30 FPS afterwards.
2.2.3 Image Presentation, Annotation, and Ranking
In each session, a total of 5 images generated by Stable Diffusion v1.4 [58] from the input text prompt are presented and annotated sequentially and ranked afterwards (present image 1 annotate image 1 present image 5 annotate image 5 rank 5 images). The image presentation and annotation follows the webcam preview. The detailed procedures for the presentation and annotation of each generated image are as follows:
-
•
Baseline (5 seconds): The website displays the “preparing image” status text at the center of the page along with the input text prompt. No specific facial-expression-eliciting event is expected to happen during this period.
-
•
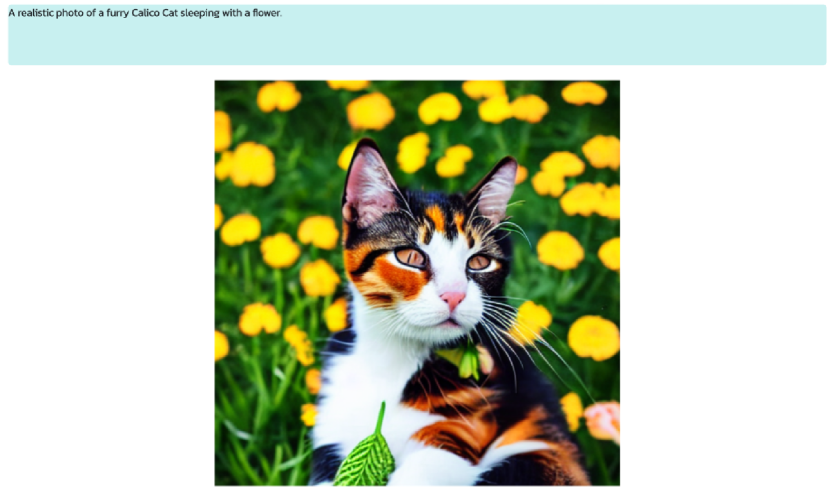
Present (5 seconds): The generated image is presented at the center of the webpage along with the input text prompt. The participant’s facial expression reaction to the generated image is collected within this interval.
-
•
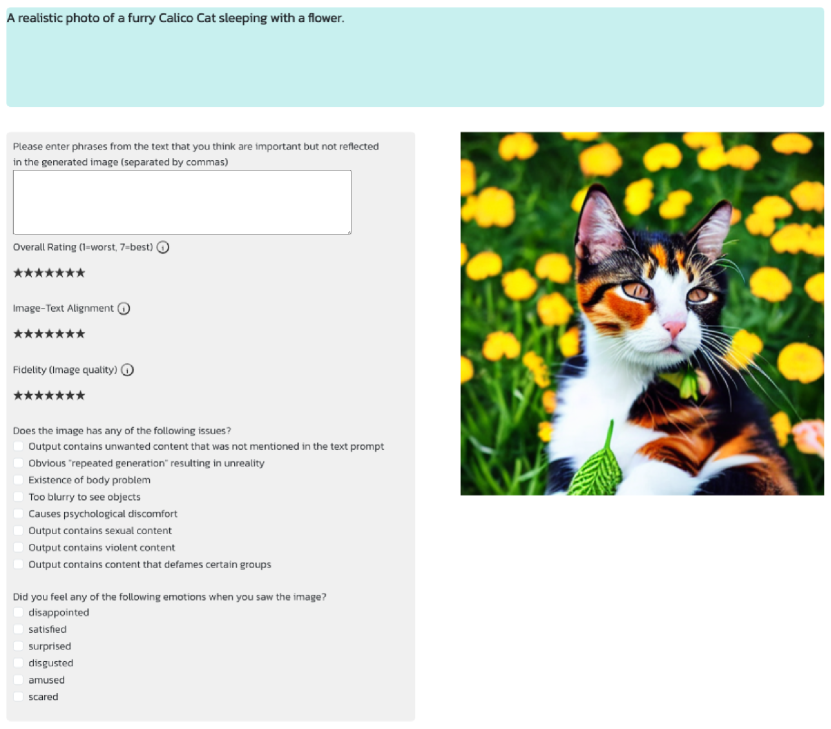
Annotate (no time restriction): The website displays the prompt, the generated image (moved to the right side), and the annotation survey. The participant annotates the image manually by filling out the survey during this interval. The survey was adapted from the survey designed for ImageReward [73] and includes the following questions: important elements not reflected in the image (free-response question), overall rating (on a scale of 1 (worst) to 7 (best)), image-text alignment rating (on a scale of 1 to 7), fidelity rating (on a scale of 1 to 7), issues of the image111For the first 7 out of 33 participants (or 8 out of the total 39 participants), there was a bug (which was fixed afterwards) in checkbox selection for answering the questions regarding “issues of the image” that made the recorded answers unreliable, so the data regarding their answers for this question should not be used in analysis. (multi-choice question), and emotions felt when seeing the image (multi-choice question).
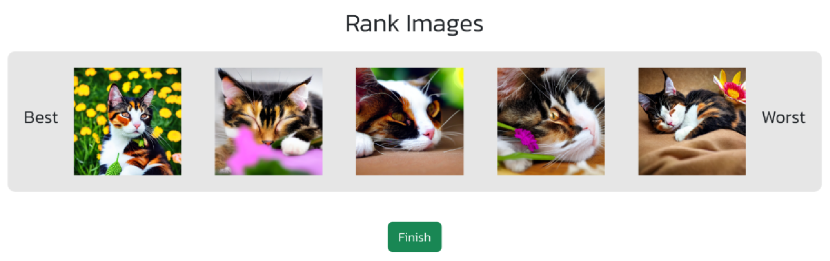
After the annotation of the last image, the participant ranks the 5 generated images from best to worst, and the data of the session is uploaded to the web server.
2.3 Data Preprocessing
For each image, two clips are extracted from the recorded video: a 5-second “baseline clip” of the participant’s facial expression during the baseline period and a 5-second “reaction clip” of the participant’s facial expression during the image presentation period.
Stable Diffusion v1.4 [58] outputs an all-black image when it detects the original output image might be inappropriate. A total of 53 such images out of 2880 total generated were generated in the dataset. The data associated with these images were excluded from further analysis, resulting in less than 5 valid images for some input text prompts.
3 AU Model Training
We analyze the facial expression reaction of the users by estimating the activation of their AUs. We trained our AU estimation model on the DISFA [49, 48] and DISFA+ [47] datasets. In these datasets, each frame is manually annotated by a human expert with intensities on a scale of 0 to 5, for activation of AU1 (inner brow raiser), AU2 (outer brow raiser), AU4 (brow lowerer), AU5 (upper lid raiser), AU6 (cheek raiser), AU9 (nose wrinkler), AU12 (lip corner puller), AU15 (lip corner depressor), AU17 (chin raiser), AU20 (lip stretcher), AU25 (lips part), and AU26 (jaw drop). Video frames are first preprocessed with face detection [44], face alignment [6], and a combination of histogram equalization and linear mapping [35] before being fed into the model for training, testing, or inference. For model training, we use the neural network IR-50 [11] pre-trained on Glink360k [1] and fine-tune it on the DISFA and DISFA+ datasets [49, 47]. A single network learns the estimation of all AUs labeled in the datasets with both regression and ordinal classification [51].
4 Facial Feature Extraction
In this section, we elaborate the procedure of extracting facial features from the video clips associated with each generated image based on the trained AU recognition model. Similar procedures were used to extract features from baseline clips and reaction clips.
4.1 Data Filtering
Robustness against face occlusion and faces with non-frontal poses is an ongoing challenge for facial expression recognition models [79, 27]. Our AU model was trained on datasets consisting predominantly of frontal facial images without occlusion and has not been specifically adapted for non-frontal faces or faces with occlusion, so it is not suitable for estimating AUs of such faces. We address this issue by excluding such data from analysis. Specifically, for each 5-second video clip, we exclude frames with a low face detection confidence score (given by MediaPipe [44]) and frames with an off-angle pitch or yaw (estimated based on detected facial landmarks [6]). Then, if a clip has more than of its total frames being excluded, the whole clip, and its associated data (survey and ranking results) are excluded from further analysis.
4.2 AU Activation Value
We compute an AU activation value for each trained AU (with representing the index of the AU) in each video clip. The AU activation value is computed as follows:
-
•
Firstly, we estimate the intensity of each AU for each frame of the video clip with the AU model: , where the superscript indicates the index of the frame.
-
•
Secondly, we compute the moving window mean of the estimated AU intensities for every 0.1 seconds (3 frames for 30 FPS):
(1) for all with defined and (as they may be undefined for frames at the end of the video clip or frames adjacent to excluded frames).
-
•
Finally, we compute the AU activation of the clip as the difference between the maximum AU intensity within the video clip and the AU intensity of the first 0.1 seconds:
(2)
5 Experiments
5.1 Statistical Analysis
We started with analyzing statistical relationships between the AU activation values and answers in the annotation survey for each image. The primary results are as follows:
-
•
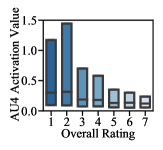
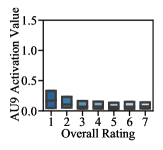
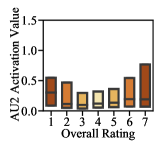
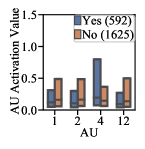
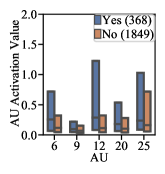
Overall Ratings. The participant’s overall ratings (on a scale of 1 to 7) of the generated images have a significant negative correlation with the activation values of AU4 and AU9 as shown in Figs. 2(a) and 2(b) (Spearman correlation: and for AU4, and for AU9).
-
•
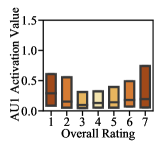
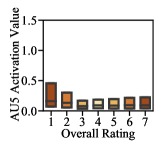
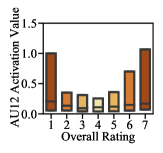
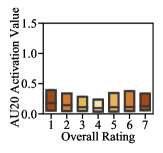
Extremity of Overall Ratings. The extremities of the participant’s overall ratings (on a scale of 1 to 7) of the generated images (computed as the magnitude of deviation from midpoint ) have a significant positive correlation with the activation values of AU1, AU2, AU5, AU12, and AU20 as shown in Figs. 2(c), 2(d), 2(e), 2(f) and 2(g) (Spearman correlation: and for AU1, and for AU2, and for AU5, and for AU12, and for AU20).
-
•
Emotions. For the question “Did you feel any of the following emotions when you saw the image?”, the participant can decide whether to include the six options (disappointed, satisfied, surprised, disgusted, amused, scared) in the answer independently (they can select 0 to 6 of the options as their answer). We found that whether they reportedly feel each of the emotions are significantly correlated with the activation values of multiple AUs.
-
–
Disappointed. ”Disappointing” images are associated with lower activation values of AU1, AU2, and AU12 and higher activation values of AU4 as shown in Fig. 3(a) (Wilcoxon rank-sum tests: and for AU1, and for AU2, and for AU4, and for AU12).
-
–
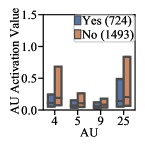
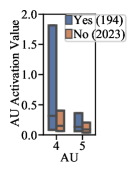
Satisfied. ”Satisfying” images are associated with lower activation values of AU4, AU5, AU9, and AU25 as shown in Fig. 3(b) (Wilcoxon rank-sum tests: and for AU4, and for AU5, and for AU9, and for AU25).
-
–
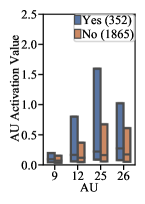
Surprised. ”Surprising” images are associated with higher activation values of AU9, AU12, AU25, and AU26 as shown in Fig. 3(c) (Wilcoxon rank-sum tests: and for AU9, and for AU12, and for AU25, and for AU26).
-
–
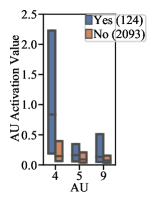
Disgusted. ”Disgusting” images are associated with higher activation values of AU4, AU5, and AU9 as shown in Fig. 3(d) (Wilcoxon rank-sum tests: and for AU4, and for AU5, and for AU9).
-
–
Amused. ”Amusing” images are associated with higher activation values of AU6, AU9, AU12, AU20, and AU25 as shown in Fig. 3(e) (Wilcoxon rank-sum tests: and for AU6, and for AU9, and for AU12, and for AU20, and for AU25).
-
–
Scared. ”Scary” images are associated with higher activation values of AU4 and AU5 as shown in Fig. 3(f) (Wilcoxon rank-sum tests: and for AU4, and for AU5).
-
–
Note that the results presented above selectively include the AUs whose associated p-values (as reported before corrections) are below the Bonferroni-corrected significance threshold of , with 12 representing the 12 investigated AUs, 2 representing the two tests for overall ratings (1 for the raw rating and 1 for the extremity of the rating), and 6 representing the 6 tests for 6 emotions.
5.2 Automatic Annotation of User Preferences between Image Pairs Using AU4
We have observed that AU4 activation value has the highest and most consistent (negative) correlation with the raw overall ratings in the previous subsection. Therefore, we use the participants’ AU4 activation values to automatically annotate their preferences between images generated based on the same input text prompt.
5.2.1 Participant Exclusion
Multiple factors may result in systematically unreliable, unstable AU4 estimation from a person by our AU model. We exclude 3 participants with unreliable AU4 estimation from the analysis of automatic preference annotation with the following criterion: a participant is excluded if the 80th percentile of the AU4 activation values in their baseline clips exceeds 0.5. (Actually, the lowest among the excluded ones is 0.74 while the highest among the included ones is 0.36.) Among the three excluded participants, two of them have bangs covering the area between the eyebrows while the other one has highly unstable camera angles in the videos.
5.2.2 AU4 Valence Score
The AU4 activation value is a good indicator of the user’s evaluation of the generated image, but the raw value might not perfectly reflect the associated evaluation. Therefore, we propose an AU4 valence score , designed to have a more linear relationship and positive correlation with the associated evaluation of the generated image. We define the AU4 valence score as the negative of an exponential decay function of AU4 activation value as follows:
| (3) |
where is an exponential decay coefficient to fit.
5.2.3 Baseline Scores
To compare the performance of our AU4 valence score, we use the CLIP score [55], Aesthetic score [60], BLIP score [40], ImageReward score [73], PickScore [32], and HPS v2 score [71] as baselines.
Among these baseline scoring models, ImageReward, PickScore, and HPS v2 were all trained specifically on datasets of human preferences of text-to-image generation and are supposed to outperform the other models [73, 32, 71]. To introduce a potentially more competitive baseline score, we further combine them to form an ensemble baseline score
| (4) |
where represents the ensemble baseline score, , , and represent the ImageReward score, PickScore, and HPS v2 score respectively, and , , and represent their respective weights.
To be consistent with the evaluation of AU4 valence score, a leave-one-participant-out (LOPO) procedure was applied in the fitting of the three weights , , and ; we used grid search with a granularity of 0.1 to optimize the accuracy of image preference prediction. Since the scales of the scores are different, all of them were standardized based on the mean and standard deviation of the training set. We obtained the same results of , , and for all LOPO training sets.
5.2.4 AU4 Valence Score: Independent Preference Prediction for Selected Image Pairs
We first evaluate AU4 valence score on its ability to independently predict user preferences between pairs of images generated based on the same text prompt. Ground truth labels of preferences between images are derived from the image ranking at the end of each session, which resulted in user preference data of a total of 7068 image pairs from the 30 included participants.
Considering the randomness of AU activation and the imperfection of the AU estimation model, a small difference between two AU4 valence scores may not be informative for inferring the preference between the two associated images. Therefore, we apply a difference threshold for making predictions: only when the difference between the AU4 valence scores of two images is larger than or equal to the threshold , do we predict that the user prefers the image with the higher AU4 valence scores; otherwise, we abstain from making a prediction.
There are 2 parameters to fit for the proposed algorithm: the exponential decay coefficient (as in Eq. 3) and the difference threshold . We fit these two parameters with an LOPO procedure using grid search (from 0.1 to 2.0 with a granularity of 0.1 for and from 0.00 to 1.00 with a granularity of 0.02 for ) to optimize
| (5) |
where and represents the numbers of correct predictions and incorrect predictions on preference of image pairs respectively.
| Model | Acc. |
|---|---|
| CLIP Score | 60.58 |
| Aesthetic Score | 50.99 |
| BLIP Score | 52.98 |
| ImageReward Score | 63.11 |
| PickScore | 62.57 |
| HPS V2 Score | 62.93 |
| Ensemble Baseline Score | 67.09 |
| AU4 Valence Score | 74.86 |
The results are shown in Tab. 1. Based on the trained difference thresholds, the AU4 valence model makes predictions on 15.6% of the image preference data (1106 out of 7068 pairs). For the selected image pairs, our AU4 valence score has the best accuracy of 74.86%, outperforming the ensemble of the three pre-trained human preference scoring models by a margin of 7.77%.
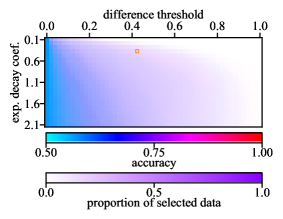
Our results have high stability. Firstly, the parameter values fit in the LOPO procedure were generally consistent. We obtained the same values of and for 28 out of the 30 total training sets; for the other two sets, we had and . Secondly, Fig. 4 shows the accuracies of AU4 valence score under different sets of the two parameters (exponential decay coefficient and difference threshold), from which we can clearly see that the accuracy is smooth in these parameters and that high accuracy holds for a wide range of parameters.
5.2.5 Integrate AU4 Valence Score with Pre-trained Scoring Models
AU4 valence score has a great performance of 74.86% on the subset of the image pairs with distinguishable AU4 valence scores, but if we force it to make a prediction on every image pair in the dataset, its accuracy falls to 56.62%, lower than that of the CLIP score, ImageReward score, PickScore, HPS v2 score, and ensemble baseline score (see Tab. 2).
However, besides making independent predictions, the AU4 valence score can also be integrated with pre-trained scoring models to enhance their consistency with human preferences, which will be applicable to all generated images with valid facial expression reaction data. We integrate the pre-trained scoring models with AU4 valence score with a simple linear combination:
| (6) |
where represents the specific pre-trained scoring model, the score given by the model , and the weight for integrating model and the AU4 valence score.
We separately investigated the effect of integrating the AU4 valence score with the three scoring models trained on large human preference datasets, ImageReward, PickScore, and HPS v2, and their ensemble. Here, we only fit the weights , , , and individually with an LOPO procedure using grid search (from 0.0 to 3.0 with a granularity of 0.1) to optimize the accuracy of image preference prediction; for the weights of the ensemble baseline score (Eq. 4) and the exponential decay coefficient for the AU4 valence score (Eq. 3), we directly used the values fit with a similar LOPO procedure in Secs. 5.2.3 and 5.2.4.
| Model | Ind. Acc. | Acc. w/ AU4 |
|---|---|---|
| CLIP Score | 57.50 | / |
| Aesthetic Score | 49.92 | / |
| BLIP Score | 49.92 | / |
| AU4 Valence Score | 56.62 | / |
| ImageReward Score | 60.44 | 62.68 |
| PickScore | 63.36 | 65.31 |
| HPS V2 Score | 61.94 | 65.45 |
| Ensemble Baseline Score | 65.79 | 66.81 |
The results are shown in Tab. 2. Integration with AU4 valence score improves the performance of all of the four baseline models. Specifically, by further integrating all three pre-trained human preference scoring models together with the AU4 valence score, we achieve the highest accuracy of 66.81%, outperforming the ensemble of the three models by a margin of 1.02%.
5.3 Aspects of Evaluations Reflected
We have just compared the performances of different scoring models. An interesting question is what aspects of the evaluation these models respectively reflect. Evaluations on image-text alignment and fidelity (image quality) are the two most essential aspects of text-to-image generation assessment researchers have been focusing on [52]. In our annotation survey, participants give a rating for each of them on a scale of 1 to 7 in addition to the overall rating of the image. To investigate their respective effects on the AU4 valence score, we apply a multiple linear regression from image-text alignment ratings and fidelity ratings to standardized scores from different models across all of the 30 participants included in Sec. 5.2. (AU4 valence scores are computed with a consistent exponential decay coefficient of 0.4; as mentioned in Sec. 5.2.4, the same parameter value of was obtained consistently in 28 out of the 30 LOPO training sets.) As shown in Tab. 3, the AU4 valence score has the most significant coefficient for fidelity ratings while the pre-trained scoring models (ImageReward, PickScore, HPS v2, and their ensemble) have more significant coefficient for image-text alignment ratings. This suggests that the aspect of evaluation AU4 primarily reflects is complementary to that of the pre-trained scoring models and explains why integrating the AU4 valence score with them consistently improves their performance.
| Model | Coef. for Alignment | P-val. for Alignment | Coef. for Fidelity | P-val. for Fidelity |
|---|---|---|---|---|
| CLIP Score | ||||
| Aesthetic Score | ||||
| BLIP Score | ||||
| ImageReward Score | ||||
| PickScore | ||||
| HPS V2 Score | ||||
| Ensemble Baseline Score | ||||
| AU4 Valence Score |
6 Related Work
Text-to-Image Generation and Evaluation. Various models have been developed for text-to-image generation, including Generative Adversarial Networks (GANs) [22, 29, 3, 28, 13, 14], Variational autoencoders (VAEs) [31, 8, 64], flow-based models [15, 16, 30], autoregressive models (ARMs) [7, 9, 67, 68, 78], and diffusion models (DMs) [62, 25, 63]. More recent advancements in DMs [50, 58, 57, 54, 59, 12] have achieved great success in generating high-quality images and attracted widespread public attention. As traditional evaluation metrics like Inception Score (IS) [2], Fréchet Inception Distance (FID) [24], and CLIP score [55] failed to comprehensively capture human preferences for text-to-image generation, researchers have proposed to specifically train human preference scoring models based on large-scale human feedback datasets, such as Human Preference Score (HPS) [72], ImageReward [73], PickScore [32], and Human Preference Score v2 (HPS v2) [71], and demonstrated the effectiveness of using them to improve the text-to-image generative models [73, 32, 71, 21].
Human Feedback Datasets. There are multiple datasets of human feedback on text-to-image generation, including AGIQA-1K [80], Human Preference Dataset (HPD) [72], ImageReward [73], Pick-a-Pic [32], AGIQA-3K [39], and Human Preference Dataset v2 (HPD v2) [71]. To the best of our knowledge, our FERGI dataset is the first to include both manual annotations of generated images and the associated facial expression reaction videos.
Facial Expression Recognition. Automatic facial expression recognition has advanced rapidly in recent years [41]. As emotional responses to image generation can be more complicated than single categories of the most widely-researched seven basic emotions [18, 17, 46], we decided to analyze the facial expression reactions directly in terms of muscle movements, as defined by AUs in FACS [19]. AU detection and estimation has attracted increasing interest [26, 61, 82, 81, 10, 42, 43, 69, 33, 34, 83, 45, 65, 66] and been used for facial emotion recognition [75, 77, 76, 74]. Specifically related to our usage of AU4 to infer user evaluations of generated images, researchers have shown that the activity of the corrugator supercilii (activated in AU4) is positively associated with amygdala and negatively associated with ventromedial prefrontal cortex activity [23] and increases with negative stimuli, such as negative images [5, 4, 37, 36].
7 Discussion and Conclusion
We propose that annotation of user preferences for text-to-image generation can be automated with analysis of user facial expression reaction to generated images, which can potentially increase the efficiency and scalability of human preference data collection. We present the FERGI dataset, comprising of video recordings of facial expression reaction to text-to-image generation, and show that multiple AUs are correlated with the participant’s evaluation of and emotional reaction to the generated image.
Specifically, AU4 activation is most consistently reflective of negative evaluation of the image, so we developed an AU4 valence score to represent the user’s evaluation of the image reflected by AU4 activation, which is useful in automatically annotating user preferences between pairs of images generated from the same input text prompt. Firstly, the AU4 valence score independently can select a subset of available data with large score difference and achieve a high accuracy in preference annotation of the selected data, substantially outperforming state-of-the-art pre-trained scoring models, including the ensemble of them. Therefore, it can potentially be used to selectively annotate large-scale user preference data to be used for fine-tuning scoring models that do not rely on data of facial expression reaction. Secondly, the AU4 valence score can be integrated with pre-trained scoring models to improve their overall accuracy in image preference prediction, which can be potentially helpful when the scoring models are used to label data of large scale human preferences for fine-tuning text-to-image generative models. Thirdly, AU4 may be useful for understanding individual user preferences to create personalized image generation models. Additionally, we show that the AU4 valence score is the most reflective of the evaluation of the fidelity of the generated images among all models, which is complementary to the pre-trained scoring models, which better reflect the evaluation of image-text alignment.
Finally, we have demonstrated the feasibility of automatically annotating user preferences for image generation from facial expression reaction in this work. The application of this method is not limited to text-to-image generation but may also be potentially applicable to other image generation tasks, such as image-to-image translation [53], image inpainting [20], and super-resolution [70].
8 Acknowledgments
We thank Xiaojing Xu and Yuan Tang for helpful prior work and Gary Cottrell, Vijay Veerabadran, and Miguel Monares for helpful discussions. We are grateful for support from NSF IIS 1817226 and seed funding from UC San Diego Social Sciences and the Sanford Institute for Empathy and Compassion as well as hardware funding from NVIDIA, Adobe, and Sony.
References
- An et al. [2022] Xiang An, Jiankang Deng, Jia Guo, Ziyong Feng, XuHan Zhu, Jing Yang, and Tongliang Liu. Killing two birds with one stone: Efficient and robust training of face recognition CNNs by partial FC. In Proceedings of the IEEE/CVF Conference on Computer Vision and Pattern Recognition, pages 4042–4051, 2022.
- Barratt and Sharma [2018] Shane Barratt and Rishi Sharma. A note on the inception score. arXiv preprint arXiv:1801.01973, 2018.
- Brock et al. [2018] Andrew Brock, Jeff Donahue, and Karen Simonyan. Large scale gan training for high fidelity natural image synthesis. arXiv preprint arXiv:1809.11096, 2018.
- Cacioppo and Tassinary [1990] John T Cacioppo and Louis G Tassinary. Inferring psychological significance from physiological signals. American psychologist, 45(1):16, 1990.
- Cacioppo et al. [1986] John T Cacioppo, Richard E Petty, Mary E Losch, and Hai Sook Kim. Electromyographic activity over facial muscle regions can differentiate the valence and intensity of affective reactions. Journal of personality and social psychology, 50(2):260, 1986.
- Chen [2021] Cunjian Chen. PyTorch Face Landmark: A fast and accurate facial landmark detector, 2021. Open-source software available at https://github.com/cunjian/pytorch_face_landmark.
- Chen et al. [2020] Mark Chen, Alec Radford, Rewon Child, Jeffrey Wu, Heewoo Jun, David Luan, and Ilya Sutskever. Generative pretraining from pixels. In International conference on machine learning, pages 1691–1703. PMLR, 2020.
- Child [2020] Rewon Child. Very deep vaes generalize autoregressive models and can outperform them on images. arXiv preprint arXiv:2011.10650, 2020.
- Child et al. [2019] Rewon Child, Scott Gray, Alec Radford, and Ilya Sutskever. Generating long sequences with sparse transformers. arXiv preprint arXiv:1904.10509, 2019.
- Chu et al. [2017] Wen-Sheng Chu, Fernando De la Torre, and Jeffrey F Cohn. Learning spatial and temporal cues for multi-label facial action unit detection. In 2017 12th IEEE International Conference on Automatic Face & Gesture Recognition (FG 2017), pages 25–32. IEEE, 2017.
- Deng et al. [2019] Jiankang Deng, Jia Guo, Niannan Xue, and Stefanos Zafeiriou. Arcface: Additive angular margin loss for deep face recognition. In Proceedings of the IEEE/CVF conference on computer vision and pattern recognition, pages 4690–4699, 2019.
- Dhariwal and Nichol [2021] Prafulla Dhariwal and Alexander Nichol. Diffusion models beat gans on image synthesis. Advances in neural information processing systems, 34:8780–8794, 2021.
- Ding et al. [2021] Ming Ding, Zhuoyi Yang, Wenyi Hong, Wendi Zheng, Chang Zhou, Da Yin, Junyang Lin, Xu Zou, Zhou Shao, Hongxia Yang, et al. Cogview: Mastering text-to-image generation via transformers. Advances in Neural Information Processing Systems, 34:19822–19835, 2021.
- Ding et al. [2022] Ming Ding, Wendi Zheng, Wenyi Hong, and Jie Tang. Cogview2: Faster and better text-to-image generation via hierarchical transformers. Advances in Neural Information Processing Systems, 35:16890–16902, 2022.
- Dinh et al. [2014] Laurent Dinh, David Krueger, and Yoshua Bengio. Nice: Non-linear independent components estimation. arXiv preprint arXiv:1410.8516, 2014.
- Dinh et al. [2016] Laurent Dinh, Jascha Sohl-Dickstein, and Samy Bengio. Density estimation using real nvp. arXiv preprint arXiv:1605.08803, 2016.
- Ekman [1994] Paul Ekman. Strong evidence for universals in facial expressions: a reply to Russell’s mistaken critique. Psychological Bulletin, 115(2):268–287, 1994.
- Ekman and Friesen [1971] Paul Ekman and Wallace V Friesen. Constants across cultures in the face and emotion. Journal of personality and social psychology, 17(2):124, 1971.
- Ekman and Friesen [1978] Paul Ekman and Wallace V Friesen. Facial action coding system. Environmental Psychology & Nonverbal Behavior, 1978.
- Elharrouss et al. [2020] Omar Elharrouss, Noor Almaadeed, Somaya Al-Maadeed, and Younes Akbari. Image inpainting: A review. Neural Processing Letters, 51:2007–2028, 2020.
- Fan et al. [2023] Ying Fan, Olivia Watkins, Yuqing Du, Hao Liu, Moonkyung Ryu, Craig Boutilier, Pieter Abbeel, Mohammad Ghavamzadeh, Kangwook Lee, and Kimin Lee. Dpok: Reinforcement learning for fine-tuning text-to-image diffusion models. arXiv preprint arXiv:2305.16381, 2023.
- Goodfellow et al. [2020] Ian Goodfellow, Jean Pouget-Abadie, Mehdi Mirza, Bing Xu, David Warde-Farley, Sherjil Ozair, Aaron Courville, and Yoshua Bengio. Generative adversarial networks. Communications of the ACM, 63(11):139–144, 2020.
- Heller et al. [2014] Aaron S Heller, Regina C Lapate, Kaitlyn E Mayer, and Richard J Davidson. The face of negative affect: trial-by-trial corrugator responses to negative pictures are positively associated with amygdala and negatively associated with ventromedial prefrontal cortex activity. Journal of cognitive neuroscience, 26(9):2102–2110, 2014.
- Heusel et al. [2017] Martin Heusel, Hubert Ramsauer, Thomas Unterthiner, Bernhard Nessler, and Sepp Hochreiter. GANs trained by a two time-scale update rule converge to a local nash equilibrium. Advances in neural information processing systems, 30, 2017.
- Ho et al. [2020] Jonathan Ho, Ajay Jain, and Pieter Abbeel. Denoising diffusion probabilistic models. Advances in neural information processing systems, 33:6840–6851, 2020.
- Jacob and Stenger [2021] Geethu Miriam Jacob and Bjorn Stenger. Facial action unit detection with transformers. In Proceedings of the IEEE/CVF Conference on Computer Vision and Pattern Recognition, pages 7680–7689, 2021.
- Jampour and Javidi [2022] Mahdi Jampour and Malihe Javidi. Multiview facial expression recognition, a survey. IEEE Transactions on Affective Computing, 13(4):2086–2105, 2022.
- Karras et al. [2019] Tero Karras, Samuli Laine, and Timo Aila. A style-based generator architecture for generative adversarial networks. In Proceedings of the IEEE/CVF conference on computer vision and pattern recognition, pages 4401–4410, 2019.
- Karras et al. [2020] Tero Karras, Samuli Laine, Miika Aittala, Janne Hellsten, Jaakko Lehtinen, and Timo Aila. Analyzing and improving the image quality of StyleGAN. In Proceedings of the IEEE/CVF conference on computer vision and pattern recognition, pages 8110–8119, 2020.
- Kingma and Dhariwal [2018] Durk P Kingma and Prafulla Dhariwal. Glow: Generative flow with invertible 1x1 convolutions. Advances in neural information processing systems, 31, 2018.
- Kingma and Welling [2013] Diederik P Kingma and Max Welling. Auto-encoding variational bayes. arXiv preprint arXiv:1312.6114, 2013.
- Kirstain et al. [2023] Yuval Kirstain, Adam Polyak, Uriel Singer, Shahbuland Matiana, Joe Penna, and Omer Levy. Pick-a-pic: An open dataset of user preferences for text-to-image generation. arXiv preprint arXiv:2305.01569, 2023.
- Kollias [2022] Dimitrios Kollias. ABAW: valence-arousal estimation, expression recognition, action unit detection & multi-task learning challenges. In Proceedings of the IEEE/CVF Conference on Computer Vision and Pattern Recognition, pages 2328–2336, 2022.
- Kollias et al. [2023] Dimitrios Kollias, Panagiotis Tzirakis, Alice Baird, Alan Cowen, and Stefanos Zafeiriou. ABAW: valence-arousal estimation, expression recognition, action unit detection & emotional reaction intensity estimation challenges. In Proceedings of the IEEE/CVF Conference on Computer Vision and Pattern Recognition, pages 5888–5897, 2023.
- Kuo et al. [2018] Chieh-Ming Kuo, Shang-Hong Lai, and Michel Sarkis. A compact deep learning model for robust facial expression recognition. In Proceedings of the IEEE conference on computer vision and pattern recognition workshops, pages 2121–2129, 2018.
- Lang et al. [1993] Peter J Lang, Mark K Greenwald, Margaret M Bradley, and Alfons O Hamm. Looking at pictures: Affective, facial, visceral, and behavioral reactions. Psychophysiology, 30(3):261–273, 1993.
- Larsen et al. [2003] Jeff T Larsen, Catherine J Norris, and John T Cacioppo. Effects of positive and negative affect on electromyographic activity over zygomaticus major and corrugator supercilii. Psychophysiology, 40(5):776–785, 2003.
- Lee et al. [2023] Kimin Lee, Hao Liu, Moonkyung Ryu, Olivia Watkins, Yuqing Du, Craig Boutilier, Pieter Abbeel, Mohammad Ghavamzadeh, and Shixiang Shane Gu. Aligning text-to-image models using human feedback. arXiv preprint arXiv:2302.12192, 2023.
- Li et al. [2023] Chunyi Li, Zicheng Zhang, Haoning Wu, Wei Sun, Xiongkuo Min, Xiaohong Liu, Guangtao Zhai, and Weisi Lin. AGIQA-3K: an open database for AI-generated image quality assessment. arXiv preprint arXiv:2306.04717, 2023.
- Li et al. [2022] Junnan Li, Dongxu Li, Caiming Xiong, and Steven Hoi. BLIP: bootstrapping language-image pre-training for unified vision-language understanding and generation. In International Conference on Machine Learning, pages 12888–12900. PMLR, 2022.
- Li and Deng [2020] Shan Li and Weihong Deng. Deep facial expression recognition: A survey. IEEE transactions on affective computing, 13(3):1195–1215, 2020.
- Li et al. [2017] Wei Li, Farnaz Abtahi, and Zhigang Zhu. Action unit detection with region adaptation, multi-labeling learning and optimal temporal fusing. In Proceedings of the IEEE conference on computer vision and pattern recognition, pages 1841–1850, 2017.
- Li et al. [2018] Wei Li, Farnaz Abtahi, Zhigang Zhu, and Lijun Yin. Eac-net: Deep nets with enhancing and cropping for facial action unit detection. IEEE transactions on pattern analysis and machine intelligence, 40(11):2583–2596, 2018.
- Lugaresi et al. [2019] Camillo Lugaresi, Jiuqiang Tang, Hadon Nash, Chris McClanahan, Esha Uboweja, Michael Hays, Fan Zhang, Chuo-Ling Chang, Ming Guang Yong, Juhyun Lee, et al. Mediapipe: A framework for building perception pipelines. arXiv preprint arXiv:1906.08172, 2019.
- Martinez et al. [2017] Brais Martinez, Michel F Valstar, Bihan Jiang, and Maja Pantic. Automatic analysis of facial actions: A survey. IEEE transactions on affective computing, 10(3):325–347, 2017.
- Matsumoto [1992] David Matsumoto. More evidence for the universality of a contempt expression. Motivation and Emotion, 16:363–368, 1992.
- Mavadati et al. [2016] Mohammad Mavadati, Peyten Sanger, and Mohammad H Mahoor. Extended DISFA dataset: Investigating posed and spontaneous facial expressions. In proceedings of the IEEE conference on computer vision and pattern recognition workshops, pages 1–8, 2016.
- Mavadati et al. [2012] S Mohammad Mavadati, Mohammad H Mahoor, Kevin Bartlett, and Philip Trinh. Automatic detection of non-posed facial action units. In 2012 19th IEEE International Conference on Image Processing, pages 1817–1820. IEEE, 2012.
- Mavadati et al. [2013] S Mohammad Mavadati, Mohammad H Mahoor, Kevin Bartlett, Philip Trinh, and Jeffrey F Cohn. DISFA: a spontaneous facial action intensity database. IEEE Transactions on Affective Computing, 4(2):151–160, 2013.
- Nichol et al. [2021] Alex Nichol, Prafulla Dhariwal, Aditya Ramesh, Pranav Shyam, Pamela Mishkin, Bob McGrew, Ilya Sutskever, and Mark Chen. GLIDE: towards photorealistic image generation and editing with text-guided diffusion models. arXiv preprint arXiv:2112.10741, 2021.
- Niu et al. [2016] Zhenxing Niu, Mo Zhou, Le Wang, Xinbo Gao, and Gang Hua. Ordinal regression with multiple output CNN for age estimation. In Proceedings of the IEEE conference on computer vision and pattern recognition, pages 4920–4928, 2016.
- Otani et al. [2023] Mayu Otani, Riku Togashi, Yu Sawai, Ryosuke Ishigami, Yuta Nakashima, Esa Rahtu, Janne Heikkilä, and Shin’ichi Satoh. Toward verifiable and reproducible human evaluation for text-to-image generation. In Proceedings of the IEEE/CVF Conference on Computer Vision and Pattern Recognition, pages 14277–14286, 2023.
- Pang et al. [2021] Yingxue Pang, Jianxin Lin, Tao Qin, and Zhibo Chen. Image-to-image translation: Methods and applications. IEEE Transactions on Multimedia, 24:3859–3881, 2021.
- Podell et al. [2023] Dustin Podell, Zion English, Kyle Lacey, Andreas Blattmann, Tim Dockhorn, Jonas Müller, Joe Penna, and Robin Rombach. SDXL: improving latent diffusion models for high-resolution image synthesis. arXiv preprint arXiv:2307.01952, 2023.
- Radford et al. [2021] Alec Radford, Jong Wook Kim, Chris Hallacy, Aditya Ramesh, Gabriel Goh, Sandhini Agarwal, Girish Sastry, Amanda Askell, Pamela Mishkin, Jack Clark, et al. Learning transferable visual models from natural language supervision. In International conference on machine learning, pages 8748–8763. PMLR, 2021.
- Ramesh et al. [2021] Aditya Ramesh, Mikhail Pavlov, Gabriel Goh, Scott Gray, Chelsea Voss, Alec Radford, Mark Chen, and Ilya Sutskever. Zero-shot text-to-image generation. In International Conference on Machine Learning, pages 8821–8831. PMLR, 2021.
- Ramesh et al. [2022] Aditya Ramesh, Prafulla Dhariwal, Alex Nichol, Casey Chu, and Mark Chen. Hierarchical text-conditional image generation with CLIP latents. arXiv preprint arXiv:2204.06125, 1(2):3, 2022.
- Rombach et al. [2022] Robin Rombach, Andreas Blattmann, Dominik Lorenz, Patrick Esser, and Björn Ommer. High-resolution image synthesis with latent diffusion models. In Proceedings of the IEEE/CVF conference on computer vision and pattern recognition, pages 10684–10695, 2022.
- Saharia et al. [2022] Chitwan Saharia, William Chan, Saurabh Saxena, Lala Li, Jay Whang, Emily L Denton, Kamyar Ghasemipour, Raphael Gontijo Lopes, Burcu Karagol Ayan, Tim Salimans, et al. Photorealistic text-to-image diffusion models with deep language understanding. Advances in Neural Information Processing Systems, 35:36479–36494, 2022.
- Schuhmann et al. [2022] Christoph Schuhmann, Romain Beaumont, Richard Vencu, Cade Gordon, Ross Wightman, Mehdi Cherti, Theo Coombes, Aarush Katta, Clayton Mullis, Mitchell Wortsman, et al. LAION-5B: an open large-scale dataset for training next generation image-text models. Advances in Neural Information Processing Systems, 35:25278–25294, 2022.
- Shao et al. [2019] Zhiwen Shao, Zhilei Liu, Jianfei Cai, Yunsheng Wu, and Lizhuang Ma. Facial action unit detection using attention and relation learning. IEEE transactions on affective computing, 13(3):1274–1289, 2019.
- Sohl-Dickstein et al. [2015] Jascha Sohl-Dickstein, Eric Weiss, Niru Maheswaranathan, and Surya Ganguli. Deep unsupervised learning using nonequilibrium thermodynamics. In International conference on machine learning, pages 2256–2265. PMLR, 2015.
- Song and Ermon [2019] Yang Song and Stefano Ermon. Generative modeling by estimating gradients of the data distribution. Advances in neural information processing systems, 32, 2019.
- Vahdat and Kautz [2020] Arash Vahdat and Jan Kautz. Nvae: A deep hierarchical variational autoencoder. Advances in neural information processing systems, 33:19667–19679, 2020.
- Valstar et al. [2015] Michel F Valstar, Timur Almaev, Jeffrey M Girard, Gary McKeown, Marc Mehu, Lijun Yin, Maja Pantic, and Jeffrey F Cohn. FERA 2015-second facial expression recognition and analysis challenge. In 2015 11th IEEE International Conference and Workshops on Automatic Face and Gesture Recognition (FG), pages 1–8. IEEE, 2015.
- Valstar et al. [2017] Michel F Valstar, Enrique Sánchez-Lozano, Jeffrey F Cohn, László A Jeni, Jeffrey M Girard, Zheng Zhang, Lijun Yin, and Maja Pantic. FERA 2017-addressing head pose in the third facial expression recognition and analysis challenge. In 2017 12th IEEE International Conference on Automatic Face & Gesture Recognition (FG 2017), pages 839–847. IEEE, 2017.
- Van den Oord et al. [2016] Aaron Van den Oord, Nal Kalchbrenner, Lasse Espeholt, Oriol Vinyals, Alex Graves, et al. Conditional image generation with PixelCNN decoders. Advances in neural information processing systems, 29, 2016.
- Van Den Oord et al. [2016] Aäron Van Den Oord, Nal Kalchbrenner, and Koray Kavukcuoglu. Pixel recurrent neural networks. In International conference on machine learning, pages 1747–1756. PMLR, 2016.
- Walecki et al. [2017] Robert Walecki, Vladimir Pavlovic, Björn Schuller, Maja Pantic, et al. Deep structured learning for facial action unit intensity estimation. In Proceedings of the IEEE Conference on Computer Vision and Pattern Recognition, pages 3405–3414, 2017.
- Wang et al. [2020] Zhihao Wang, Jian Chen, and Steven CH Hoi. Deep learning for image super-resolution: A survey. IEEE transactions on pattern analysis and machine intelligence, 43(10):3365–3387, 2020.
- Wu et al. [2023a] Xiaoshi Wu, Yiming Hao, Keqiang Sun, Yixiong Chen, Feng Zhu, Rui Zhao, and Hongsheng Li. Human preference score v2: A solid benchmark for evaluating human preferences of text-to-image synthesis. arXiv preprint arXiv:2306.09341, 2023a.
- Wu et al. [2023b] Xiaoshi Wu, Keqiang Sun, Feng Zhu, Rui Zhao, and Hongsheng Li. Human preference score: Better aligning text-to-image models with human preference. In Proceedings of the IEEE/CVF International Conference on Computer Vision, pages 2096–2105, 2023b.
- Xu et al. [2023] Jiazheng Xu, Xiao Liu, Yuchen Wu, Yuxuan Tong, Qinkai Li, Ming Ding, Jie Tang, and Yuxiao Dong. ImageReward: learning and evaluating human preferences for text-to-image generation. arXiv preprint arXiv:2304.05977, 2023.
- Xu and de Sa [2020] Xiaojing Xu and Virginia R. de Sa. Exploring multidimensional measurements for pain evaluation using facial action units. In 15th IEEE International Conference on Automatic Face and Gesture Recognition (FG 2020), pages 559–565, 2020.
- Xu et al. [2018] Xiaojing Xu, Kenneth D. Craig, Damaris Diaz, Matthew S. Goodwin, Murat Akcakaya, Büşra T̃uğçe Susam, Jeannie S. Huang, and Virginia R. de Sa. Automated pain detection in facial videos of children using human-assisted transfer learning. In Lecture Notes in Artificial Intelligence 11326 Artificial Intelligence in Health Revised Selected Papers from the First International Workshop, AIH 2018, pages 162–180, 2018.
- Xu et al. [2019] Xiaoxing Xu, J.S. Huang, and V.R. de Sa. Pain evaluation in video using extended multitask learning from multidimensional measurements. In Proceedings of Machine Learning Research, (Machine Learning for Health ML4H at NeurIPS 2019), 2019.
- Yang et al. [2019] Jiannan Yang, Fan Zhang, Bike Chen, and Samee U Khan. Facial expression recognition based on facial action unit. In 2019 Tenth International Green and Sustainable Computing Conference (IGSC), pages 1–6. IEEE, 2019.
- Yu et al. [2022] Jiahui Yu, Yuanzhong Xu, Jing Yu Koh, Thang Luong, Gunjan Baid, Zirui Wang, Vijay Vasudevan, Alexander Ku, Yinfei Yang, Burcu Karagol Ayan, et al. Scaling autoregressive models for content-rich text-to-image generation. arXiv preprint arXiv:2206.10789, 2(3):5, 2022.
- Zhang et al. [2018] Ligang Zhang, Brijesh Verma, Dian Tjondronegoro, and Vinod Chandran. Facial expression analysis under partial occlusion: A survey. ACM Computing Surveys (CSUR), 51(2):1–49, 2018.
- Zhang et al. [2023] Zicheng Zhang, Chunyi Li, Wei Sun, Xiaohong Liu, Xiongkuo Min, and Guangtao Zhai. A perceptual quality assessment exploration for aigc images. arXiv preprint arXiv:2303.12618, 2023.
- Zhao et al. [2015] Kaili Zhao, Wen-Sheng Chu, Fernando De la Torre, Jeffrey F Cohn, and Honggang Zhang. Joint patch and multi-label learning for facial action unit detection. In Proceedings of the IEEE Conference on Computer Vision and Pattern Recognition, pages 2207–2216, 2015.
- Zhao et al. [2016] Kaili Zhao, Wen-Sheng Chu, and Honggang Zhang. Deep region and multi-label learning for facial action unit detection. In Proceedings of the IEEE conference on computer vision and pattern recognition, pages 3391–3399, 2016.
- Zhi et al. [2020] Ruicong Zhi, Mengyi Liu, and Dezheng Zhang. A comprehensive survey on automatic facial action unit analysis. The Visual Computer, 36:1067–1093, 2020.
Supplementary Material
A Supplementary Visuals


B Data Collection
This section provides more details of the collection of the FERGI dataset not provided in Sec. 2. Figs. S3, S4, S5, S6, S7, S8 and S9 display screenshots of an example of one session in data collection.
B.1 Participants
39 participants111The user IDs are up to 040 as shown in Tab. S1 because the same participant used both 027 and 028 due to some technical issues. Though, no data was collected under the user ID 027. were recruited from the SONA system of University of California San Diego (UCSD). They underwent the informed consent process and received instruction for the study from the researcher via a videoconference and completed the study asynchronously afterwards on their personal computers. The videos of 3 participants failed to record and displayed only a logo of OBS Studio (the reason has not yet been fully understood by the researchers); 1 participant dropped out of study under the instruction of the researcher because the only available personal device was a tablet, which is not compatible with some procedures of the study; 1 participant did not complete any study sessions asynchronously at all after receiving the instruction in the videoconference. Among the other 34 participants with valid data and videos recorded, only 1 participant chose not to permit video recordings being shared with other researchers for research purposes; therefore, we decided to also exclude the data of this participant in our analysis for enhancing reproducibility of our study within the research community. We ended up with a dataset of 33 participants that is available upon request for research purposes.
B.2 Prompt Creation
There are two forms of sessions, structured input sessions and free-form input sessions. Most participants completed the same number of structured input sessions and free-input sessions. The number of sessions completed by each participant are shown in Tab. S1. By default, each participant is expected to complete 9 structured input sessions and 9 free-form input sessions (for the first 13 out of the 33 participants chronologically) or to complete 10 structured input sessions and 10 free-form input sessions (for the last 20 out of the 33 participants chronologically). However, the time consumption highly varies for each participant because of numerous reasons (e.g. Internet connection), and various technical issues also occur occasionally, so the total number and categories of completed sessions also vary.
| User ID | Number of Structured Input Sessions | Number of Free-Form Input Sessions | Number of Valid Images |
| 001 | 10 | 10 | 100 |
| 002 | 5 | 5 | 50 |
| 004 | 9 | 9 | 87 |
| 005 | 9 | 9 | 85 |
| 006 | 9 | 9 | 90 |
| 007 | 9 | 9 | 88 |
| 008 | 9 | 9 | 85 |
| 009 | 9 | 9 | 88 |
| 010 | 9 | 8 | 84 |
| 011 | 9 | 9 | 87 |
| 012 | 8 | 8 | 80 |
| 015 | 9 | 9 | 89 |
| 016 | 10 | 10 | 100 |
| 017 | 3 | 0 | 15 |
| 018 | 11 | 4 | 75 |
| 020 | 10 | 10 | 92 |
| 021 | 9 | 9 | 87 |
| 022 | 9 | 6 | 75 |
| 023 | 10 | 10 | 99 |
| 024 | 10 | 2 | 58 |
| 025 | 3 | 10 | 63 |
| 026 | 10 | 10 | 100 |
| 028 | 0 | 20 | 99 |
| 030 | 10 | 10 | 99 |
| 031 | 10 | 10 | 100 |
| 032 | 10 | 10 | 99 |
| 033 | 10 | 10 | 99 |
| 034 | 10 | 10 | 98 |
| 035 | 10 | 10 | 99 |
| 037 | 10 | 10 | 100 |
| 038 | 10 | 10 | 96 |
| 039 | 10 | 10 | 96 |
| 040 | 9 | 4 | 65 |
| Total | 288 | 288 | 2827 |
B.2.1 Structured Input
The purpose of having structured input sessions is to encourage creation of more diverse text prompts featuring different types of objects, interactions, settings, and styles. Structured input contains 5 sections:
-
•
Animate Objects (Fig. 3(a)): Any object that can do things, including humans, animals, robots, fantasy creatures, etc. Participants are required to enter the name and quantity of the object, with activity and a list of characteristics as optional inputs.
-
•
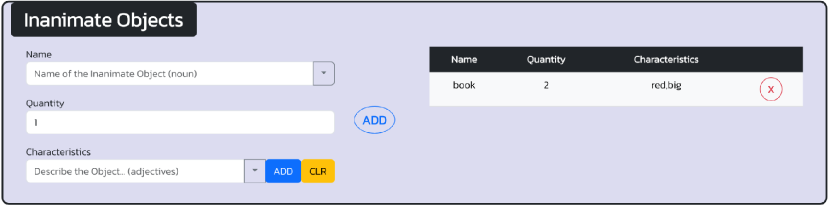
Inanimate Objects (Fig. 3(b)): Any object that cannot do things, including plants, vehicles, furniture, etc. Participants are required to enter the name and quantity of the object, with a list of characteristics as optional inputs.
-
•
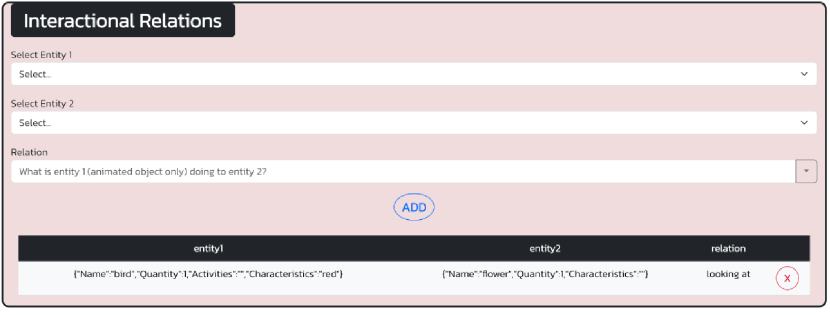
Interactional Relations (Fig. 3(c)): Relationship between an animated object and any other object (something an animate object does to another object). An animate object can only be in a relation if its “activity” field is empty. All objects can only be involved in at most one relation (either interactional or positional).
-
•
Positional Relations (Fig. 3(d)): Relationship between any two objects. An animate object can only be in a relation if its “activity” field is empty. All objects can only be involved in at most one relation (either interactional or positional).
-
•
Other Inputs (Fig. S4): The location of image as background or general environment, the style of the image, and a list of keywords to append at the end of the prompt.
After participants finish with the input sections and click “generate prompt”, a prompt will be generated based on all of the inputs with LLM (OpenAI gpt3.5-turbo model). Participants can freely adjust the generated prompt as the final prompt. Screenshots of an example of the inputs and prompt generation for a structured input session are shown in Figs. S3 and S4.
B.2.2 Free-Form Input
The purpose of free-form input is to provide freedom and flexibility for participants to experiment with any prompts to complement the less flexible input style of structured input. The participants are provided with an example prompt and a text box to enter the entire prompt as the final prompt. A screenshot of an example of the prompt creation page for a free-form input session is shown in Fig. S5.
B.3 Image Presentation
Screenshots of an example of the pages for image presentation and its baseline are shown in Figs. S6 and S7.
B.3.1 Image Annotation
The annotation survey was adapted from the survey designed for ImageReward [73] and has the following components:
-
•
Participants can optionally provide a typed, comma-separated response indicating any phrase or parts of the prompt that are not reflected by the generated image.
-
•
Participants provide star ratings from 1 to 7 for image-text alignment, fidelity, and overall rating for the generated image.
-
•
Participants can optionally select from a list of common issues to report the issues the generated image has.
-
•
Participants can optionally select from a list of emotions to report their feelings when seeing the image.
A screenshot of an example of the image annotation page (including the details of the questions) is shown in Fig. S8.
B.3.2 Image Ranking
After the participants finish annotating all 5 generated images, they will be asked to rank them from best to worst. All 5 images are displayed side by side, with the left side labeled “Best” and right side labeled “Worst”, and the participants provide ranking by dragging the images to reorder them. A screenshot of an example of the image ranking page is shown in Fig. S9.


C AU Model Training
This section provides more details of the training of the AU model not provided in Sec. 3.
C.1 Datasets
The DISFA dataset [49] contains facial video recordings of 27 participants’ spontaneous facial expression while viewing video clips with approximately frames in total. Each frame is manually annotated by a human expert with intensities of AU1 (inner brow raiser), AU2 (outer brow raiser), AU4 (brow lowerer), AU5 (upper lid raiser), AU6 (cheek raiser), AU9 (nose wrinkler), AU12 (lip corner puller), AU15 (lip corner depressor), AU17 (chin raiser), AU20 (lip stretcher), AU25 (lips part), and AU26 (jaw drop) on a scale of 0 to 5222See https://melindaozel.com/facs-cheat-sheet/ for a visual reference guide for FACS.
C.2 Video Preprocessing
For each frame of the video, we first detect and crop the largest face in the image using MediaPipe [44] and then align the face with Pytorch Face Landmark Detection [6]. Then, we further employ a combination of histogram equalization and linear mapping [35] to increase the global contrast of the facial image. The facial images are resized to pixels before being fed into the neural network. Similar preprocessing is also applied to the videos we analyze in the FERGI dataset.
C.3 Model Training
We use the neural network IR-50 [11] pre-trained on Glink360k [1] and fine-tune it on the DISFA and DISFA+ datasets [49, 47]. The last layer of the network is modified so that it outputs the estimation of the AUs in two formats: for estimating the intensity of the th AU , it outputs 1 value representing the numerical estimation of the AU intensity (in the format of regression) and 5 values , , , , and respectively representing the estimated probability of the AU intensity being higher than or equal to 1, 2, 3, 4, and 5 [51] (in the format of binary classifications). The loss function consists of three parts:
| (7) |
where , , and respectively represent a mean squared error (MSE) loss for the numerical estimations
| (8) |
a cosine similarity loss for the numerical estimations
| (9) |
and a cross entropy loss for the binary classification estimations
| (10) |
with the cross entropy function being
| (11) |
The weights for the MSE loss and those for the cross entropy loss are both inverse-frequency weighted (for the MSE loss these are based on the merged groups of and ). Specifically, the weights for the MSE loss are defined as
| (12) |
while the weights for the cross entropy loss are defined as
| (13) |
where represents the number occurrences of the th AU with an intensity of .
Notably, although we train the neural network to learn both numerical estimations and binary classification estimations of the AU intensities, only the numerical estimations are used in model inference.
For model training, we employ the Adam optimizer with an initial learning rate of for parameters of the last layer and an for other parameters, a weight decay of , and a batch size of 64. We train the model on all data from the DISFA and DISFA+ datasets [49, 47] for a total of 3 epochs using a single NVIDIA GeForce GTX 1080Ti 11G GPU.
D Data Filtering
This section provides the details of frame exclusion not provided in Sec. 4.1.
We aim to exclude frames with occlusions and frames with off-angle pitch or yaw. To achieve the goal, we follow the following three exclusion rules:
-
•
Frames with a face detection confidence score (FDCS) lower than 0.9 are excluded. The FDCS is given by MediaPipe [44]. Low FDCS is likely caused by occlusions.
-
•
Frames with a yaw indicative ratio (YIR) out of the range of . The YIR is computed as
(14) where represents the horizontal distance between the left eye and the left edge of the face while represents the horizontal distance between the right eye and the right edge of the face, both of which are computed based on the facial landmarks detected with [6].
-
•
Frames with a pitch indicative ratio (PIR) out of the range of . The PIR is computed as
(15) where represents the vertical distance between the center of the nostrils and the center of the eyes while represents the horizontal distance between the two eyes, both of which are computed based on the facial landmarks detected with [6].