X-ray Observations of the Enigmatic Wolf-Rayet System Mus:
Two’s Company But Three’s a Crowd
Abstract
Mus is a remarkable spectroscopic binary (SB) consisting of a carbon-type Wolf-Rayet star and OV companion (WC6O6-7V) in a 19-day orbit. In addition an O-supergiant is visually detected at a small offset of 46 mas and if gravitationally bound to the SB system would have an orbital period of many decades. Mus is X-ray bright and a nonthermal radio source as commonly observed in massive colliding wind (CW) binaries. We present new Chandra X-ray observations of Mus which complement previous XMM-Newton observations. The X-ray emission consists of a cool nearly steady weakly-absorbed plasma component with broad redshifted emission lines located in an extended region far from the SB system. Hotter plasma is also present traced by Fe XXV emission. The observed flux in the 2-5 keV range dropped significantly on a timescale of 5 years. The flux decrease can be attributed to an increase in absorption toward the hotter plasma which is likely located in the confined wind interaction region of the short-period SB system. The X-ray emission of Mus is remarkably similar to the WCO binary Vel including carbon recombination spectral lines but both systems show unusual line centroid properties that challenge CW models.
1 Introduction
Wolf-Rayet (WR) stars are evolved massive stars that may end their lives as supernovae, in some cases accompanied by -ray bursts (Woosley & Bloom 2006). They are losing mass at high rates and their powerful winds replenish the interstellar medium with metal-rich material that will be recycled into new generations of stars. With typical terminal wind speeds V∞ 1000 - 2500 km s-1, the supersonic winds of WR stars and interacting winds in massive WROB binaries offer excellent opportunities for observational tests of wind shock models.
The present work focuses on X-ray properties of the multiple system Mus (= HD 113904 = WR 48). It is a spectroscopic binary (SB) consisting of a carbon-type WR star with an O-star companion (WC6O6-7V) in a 19-day orbit. In addition an O9.5I star is visually detected at an offset of 469 mas (Hartkopf et al. 1999). Chandra has an angular resolution of about one arcsecond which is not sufficient to spatially resolve the two components of the Mus SB system or disentangle emission of the SB system from that of the O supergiant. X-rays in such multiple systems can arise in the shocked winds of either star or in colliding wind (CW) shocks formed between the stars. Thus, the observed X-ray spectrum may consist of multiple superimposed components. Distinguishing between them relies on diagnostics such as plasma temperature distribution and emission line properties (e.g. line widths, centroid shifts). Reliable measurements of line properties require high spectral resolution grating observations.
X-rays can be produced in the winds of the individual stars in massive binaries as a result of radiative shocks associated with line-driven instabilities (Lucy & White 1980; Owocki et al. 1988; Feldmeier et al. 1997). Radiative shocks are predicted to generate cool X-ray plasma (kT 1 keV) as has been observed in objects like the O4I star Puppis (Cassinelli et al. 2001; Kahn et al. 2001). But single nitrogen-type WN stars without known companions reveal hotter plasma (kT 2 keV) that is not predicted for radiative wind shocks (Skinner et al. 2010; 2012) as do rare oxygen-type WO stars (Sokal et al. 2010; Skinner et al. 2019). But it is remarkable that putatively single carbon-type WC stars with tremendous bolometric luminosities and powerful winds have so far eluded X-ray detection in sensitive pointed observations (Oskinova et al. 2003; Skinner et al. 2006).
Hot X-ray plasma can arise in CW shocks in WROB systems (Cherapashchuk 1976; Prilutskii & Usov 1976; Luo et al. 1990; Usov 1992; Stevens, Blondin, & Pollock 1992). The predicted maximum temperature for an adiabatic CW shock is kTcw 1.96[V⟂/1000 km s-1]2 keV where is the mean particle weight in the wind and V⟂ is the wind velocity component perpendicular to the shock front (Luo et al. 1990). For terminal wind speeds V∞ 1000 - 2500 km s-1 typical of WR and O stars maximum shock temperatures on the line-of-centers kTcw 2 keV are expected. Such hotter plasma has now been detected in several WR binaries. These include well-studied systems like the 78-day binary Vel whose whose WC8O7.5 type is similar to Mus (Willis, Schild, & Stevens 1995; Skinner et al. 2001; Schild et al. 2004).
We present here new Chandra X-ray observations of the multi-component WR system Mus when the O6-7V star was passing in front of the WR star ( 0.6). In addition we summarize archived XMM-Newton data obtained in 2004 at nearly the same phase as Chandra and in 2009 ( 0.95) with the WR star passing in front. The primary objective was to confirm and extend previous reports of redshifted emission lines and attempt to reconcile the observed X-ray emission with the CW shock interpretation.
2 The Target: Mus
Mus (= HD 113904) is listed as WR 48 in the catalog of van der Hucht (2001) with a visual extinction Av = 0.93 mag. This equates to AV = 0.84 mag using AV = 0.9Av. Its Gaia DR3 parallax distance is 2.168 kpc. The SB system was classified as WC6O6-7V by Hill et al. (2002).
To determine orbital phases of the X-ray observations we use the orbital solution for the SB system of Hill et al. (2002) who adopted a period Porb = 19.13750.0025 d based on the work of Schnurr (1999). But the determination of the SB orbital parameters is hampered by the nearby bright supergiant. No atmospheric eclipse that could be used to constrain the orbital ephemeris has so far been detected in the SB system (Lenoir-Craig et al. 2021). Lenoir-Craig et al. also note an unexplained phase difference for time of minimum brightness between their results and those of Marchenko et al. (1998). Attempts to quantify the SB orbit based on linear polarization observations have yielded negative results (St.-Louis et al. 1987). Moffat & Seggewiss (1977) determined Porb = 18.3410.008 d, but aliasing also allows values of 18.596 d, 18.858 d, or 19.128 d (Lenoir-Craig et al. 2021). Using Hipparcos photometry Marchenko et al. (1998) obtained Porb = 18.050.32 d. Considering the above mixed results, the X-ray orbital phases computed using Porb = 19.1375 d (Tables 1,2) should be treated with caution.
If the OI star is gravitationally bound to the SB system at the Gaia DR3 parallax distance of 2.17 kpc then a long-period orbit is predicted. The 46 mas offset corresponds to a projected separation 100 AU. To estimate the orbital period we assume a WR mass MWC6 = 12 M⊙ (Hill et al. 2002) and O-star masses (Weidner & Vink 2010) MO7V = 30 M⊙ and MO9.5I = 35 M⊙. To simplify the three-body orbit to a tractable two-body orbit we combine the SB system into a single object of mass 42 M⊙. This combined mass is similar to the OI star mass and the center-of-mass thus lies approximately halfway between the SB system and the OI star. If the orbit of the OISB system is near-circular their physical (deprojected) separation is twice the orbit semi-major axis . Since we obtain 50 AU and by Kepler’s 3rd law Porb,OI 40 years. This is a lower limit and the actual period, which depends on the (unknown) deprojected separation , could be much longer than 40 years. Previous nonthermal radio studies have argued that the OI star is in such a bound orbit (Dougherty & Williams 2000).
3 Previous XMM-Newton Observations
An X-ray observation of Mus with XMM-Newton was obtained in 2004 (ObsId 0090030201) when the OV star was nearly in front of the WR star and analyzed by Sugawara et al. (2008). A second XMM-Newton observation in 2009 (ObsId 0605670201) at nearly opposite phase is archived and discussed below. Somewhat surprisingly, bright low-temperature emission lines such as O VIII (maximum line power at Tmax 3 MK) in the XMM-Newton grating spectrum were found to be redshifted by 650 km s-1 when the O6-7V star was passing in front. If the X-ray emission originates in a CW shock in the SB system and the WR wind momentum dominates the O6-7V wind (as is usually the case) then blueshifted lines would be expected when the O6-7V star is passing in front of the WR star. In that viewing geometry the CW shock cone wraps around the O6-7V star with a blueshifted flow velocity component toward the observer. The magnitude of the blueshift depends on the shock cone opening angle with wider angles giving smaller blueshifts. To explain the puzzling redshifted lines, Sugawara et al. (2008) proposed that they originate in a CW shock between the SB system and the OI star. In that picture the OI star would be in a bound orbit with the SB system and behind it (Fig. 4 of Sugawara et al. 2008).
| ObsId | Start Date/Time | Livetime | PhaseaaThe start-stop phases are referenced to phase = 0 (WR star in front) at To = HJD 2451377.510.45 d and assume an orbital period Porb= 19.13750.0025 d (Hill et al. 2002). | Counts | Count rate | E50 | H.R. | Pvar |
|---|---|---|---|---|---|---|---|---|
| TT | (ks) | (cts) | (cts ks-1) | (keV) | ||||
| 23378 | 2020 Nov 24 10:39 | 14.757 | 0.60-0.61 | 189 | 12.562.98 | 2.60 | 0.67 | 0.06 |
| 24869 | 2020 Nov 24 23:16 | 14.755 | 0.63-0.64 | 211 | 13.913.11 | 2.83 | 0.79 | 0.12 |
| 24497 | 2022 Jun 1 19:25 | 29.574 | 0.57-0.59 | 259 | 8.632.99 | 2.79 | 0.71 | 0.09 |
| 24498 | 2022 Jun 3 06:03 | 30.393 | 0.64-0.66 | 408 | 13.172.48 | 2.64 | 0.74 | 0.06 |
| 24496 | 2022 Jun 22 13:14 | 29.575 | 0.65-0.67 | 345 | 11.603.71 | 2.63 | 0.74 | 0.05 |
| mean | … | … | … | … | 11.971.83 | 2.70 | 0.73 | … |
Note. — The livetime is the on-source time and excludes dead-time when the detector is not collecting data. X-ray properties are based on source events in the 0.2 - 8 keV range. The mean count rates and standard deviations were obtained by fitting the X-ray light curve binned at 1200 s intervals. E50 is the median photon energy. Hardness ratio H.R. = counts(2-8 keV)/counts(0.2-8 keV). Pvar is the probability that the source is variable based on event arrival times as determined by the CIAO tool glvary. The X-ray centroid position obtained by averaging all observations is (J2000) R.A. = 13h 08m 07.140s Decl. = 65∘ 18′ 21.70′′. The Hubble Space Telescope (HST) Guide Star Catalog (GSC v2.3.2) position of Mus is R.A. = 13h 08m 07.155s Decl. = 65∘ 18′ 21.50′′. The 2MASS position is R.A. = 13h 08m 07.153s Decl. = 65∘ 18′ 21.517′′.
4 X-ray Observations
4.1 Chandra
The total Chandra observing time (120 ks) was split into five segments (Table 1) to accommodate Chandra’s operational constraints. The data were obtained using the High Energy Transmission Grating (HETG)/Advanced CCD Imaging Spectrometer (ACIS-S) combination. The HETG provides grating data from the Medium Energy Grating (MEG) and High Energy Grating (HEG). ACIS-S also gives undispersed HETG 0-order data (hereafter referred to as ACIS-S 0-order or simply ACIS-S) at lower energy resolution than HETG. Detailed information on Chandra’s instrumentation is in the Proposer’s Observatory Guide (POG)111https://cxc.harvard.edu/proposer/POG/.
The pipeline-processed data files provided by the Chandra X-ray Center were analyzed using science threads in Chandra Interactive Analysis Software (CIAO version 4.14) and recent calibration data (CALDB version 4.9.8). ACIS-S 0-order source events were extracted from a circular region of radius 2.′′0 centered on the X-ray peak for each observation. Background is negligible. Energy-filtered 0-order source events were used to determine count rates, median event energies, and hardness ratios (H.R.). The probability of source variability was determined using the CIAO tool glvary. CIAO specextract was used to extract ACIS-S 0-order spectra for each observation along with observation-specific response matrix files (RMFs) and auxiliary response files (ARFs). Spectral fitting was undertaken with CIAO Sherpa and HEASOFT XSPEC version 12.8.2222http://heasarc.gsfc.nasa.gov/xanadu/xspec. The ACIS-S 0-order spectra for the five observations were fitted simultaneously in XSPEC, the recommended procedure for analyzing Chandra data acquired at different epochs. The five spectra were combined into a single spectrum for display purposes. To facilitate comparison with the results of Sugawara et al. (2008) we have modeled X-ray absorption using the XSPEC model. Fits were compared with the more recent absorption model and only minor differences were found.
We analyzed 1st order MEG1 and HEG1 grating spectra (1 and orders combined). The MEG1 spectra for each observation were combined into a summed MEG1 spectrum using CIAO combine_grating_spectra, and similarly for HEG1. Grating RMF and ARF files were generated using CIAO mktgresp. Emission lines were fitted with Gaussian profiles to determine line properties. Since the grating spectra of the individual observations do not contain enough line counts to reliably measure line properties the summed grating spectra were used for line fitting.
4.2 XMM-Newton
For comparison with Chandra we have retrieved the XMM-Newton archive data for the two Mus observations, ObsIds 0090030201 (119.6 ks, 20 July 2004) and 0605670201 (54.3 ks, 19 July 2009). The data were reprocessed using the XMM-Newton Science Analysis Software (SAS vers. 18) modules epchain and emchain, applying recent calibration data. Undispersed source spectra were extracted using SAS xmmselect for the pn, MOS1, and MOS2 detectors comprising the European Photon Imaging Camera (EPIC). Background spectra were extracted in adjacent source free regions. Observation-specific RMF and ARF files were created for each EPIC spectrum using SAS modules rmfgen and arfgen. Spectra were fitted using XSPEC as for the Chandra data.
5 Results
5.1 Chandra
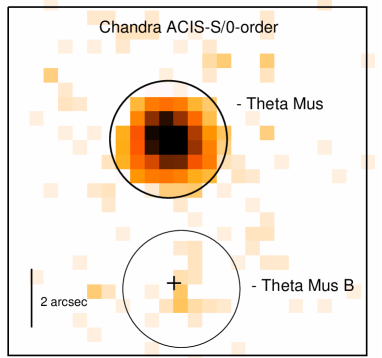
Mus was clearly detected in all five Chandra observations (Table 1). Figure 1 shows the ACIS-S 0-order image obtained by combining events from the June 2022 observations. A faint X-ray source lies 5′′.2 south of Mus whose X-ray centroid is offset 0′′.35 from the O9III star Mus B. This offset is well within the 1 Chandra ACIS-S absolute astrometric accuracy of 0′′.79 (68% confidence circle radius333https://cxc.harvard.edu/cal/ASPECT/celmon/). so the faint source is most likely Mus B. Its count rate is more than 60 times lower than Mus. The = 2′′ extraction region used for Mus ACIS-S analysis excludes the faint emission from Mus B which is not of primary interest in this study. The X-ray centroid is in excellent agreement with optical and near-IR positions of Mus. The X-ray properties in Table 1 are similar for each observation. The individual observations show no significant X-ray variability but the count rate in ObsId 24497 is 1.8 lower than the mean for all five observations. If real, this decrease would indicate variability on a short timescale of 2 days.
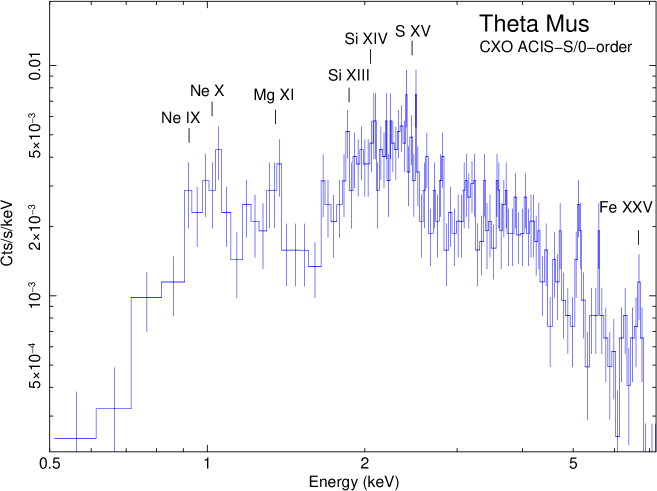
Undispersed ACIS-S Spectra. The summed ACIS-S spectrum is shown in Figure 2-top. As noted, the individual spectra were fitted simultaneously in XSPEC. We compared fits using two-temperature optically thin plasma models (2T ) and 2T plane-parallel shock models (2T ) which are typically used for modeling WR star X-ray spectra. The model assumes collisional ionization equilibrium (CIE) whereas the model accounts for possible non-equilibrium ionization (NEI) conditions that may occur in the plasma of rapidly-heated shocks (e.g. Zhekov 2007).
To make comparisons with the analysis of XMM-Newton spectra by Sugawara et al. (2008) we referenced the abundances in spectral fits (Table 2) to the solar values of Anders & Grevesse (1989). But evolved WC stars have nonsolar abundances that are depleted in hydrogen and nitrogen with enhanced carbon. We have thus compared solar abundance spectral fits with fits using generic WC star abundances (van der Hucht, Cassinelli, & Williams 1986). The fit quality as judged by is poor using the generic WC abundances but improves by allowing the C abundance to increase above the generic reference value, as was also true for fits referenced to solar abundances.
The 2T model provides slightly better fits of the ACIS-S spectra than 2T as gauged by the fit statistic. Thus we do not include the ACIS-S 2T fit in Table 2 but it is included for the higher signal-to-noise ratio 2009 XMM-Newton EPIC data (discussed below). Even so, both models converge to similar values for physical quantities such as plasma temperature. The ACIS-S spectra do not tightly constrain the absorption column density so it was held fixed in ACIS-S fits at NH = 1.6 1021 cm-2, consistent with that expected for AV = 0.84 and a standard conversion NH (cm-2) = 1.90.3 1021AV (Gorenstein 1975; Vuong et al. 2003). It is also nearly identical to that obtained from 2T fits of XMM-Newton EPIC spectra (Table 2).
The various ACIS-S spectral fits show very little sensitivity to abundance deviations from solar, which is not surprising given the moderate spectral resolution of ACIS-S and the modest number of spectral counts. However all fits converged to a subsolar Fe abundance, as was also found in our analysis of XMM-Newton spectra below and by Sugawara et al. (2008). The carbon and oxygen lines present in XMM-Newton spectra at energies below 0.7 keV lie below the energy range where ACIS-S is sensitive. Thus Chandra does not provide any constraints on the C abundance although XMM-Newton spectra do (Sec. 5.2).
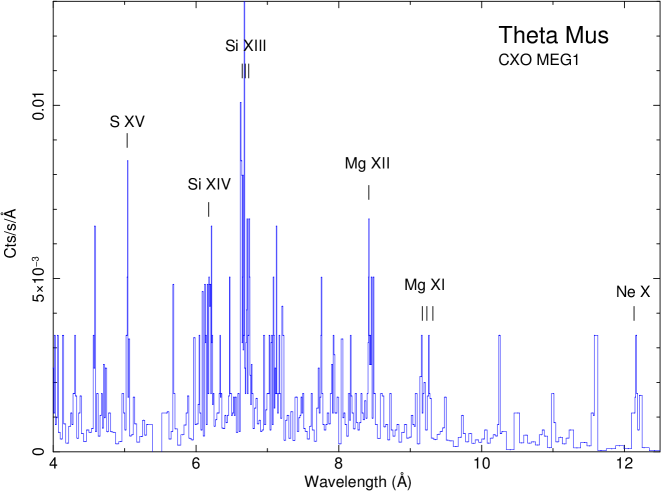
HETG Spectra. The Chandra MEG1 spectrum of Mus is shown in Figure 3-top. Several emission lines and line blends are present (Table 3) spanning a temperature range of Tmax 6 MK (Ne X) to Tmax 16 MK (S XV). The HEG1 spectrum is similar to MEG1 but only the Mg XII, Si XIII, and S XV lines in HEG1 have sufficient counts to permit line measurements. Even so, they provide a good cross-check with MEG1 since HEG1 spectral resolution ( = 0.012 Å ) is superior to MEG1 ( = 0.023 Å).
All of the HETG lines are redshifted with exception of S XV (Table 3). The Ne X line (12 net MEG1 counts) has a redshift of 841 (396,593) km s-1 and width FWHM 0.04 Å (990 km s-1). This width is nearly twice the MEG1 resolving power. Line broadening is also present in the XMM-Newton grating spectra (Sugawara et al. 2008).
Table 3 shows what appears to be a trend toward smaller redshifts in hotter lines. The individual components of the doublet lines (Ne X, Mg XII, Si XIV) are not resolved by MEG1 and their redshifts may be slightly overestimated due to flux contributions from the weaker longer wavelength component. These doublets appear somewhat broadened in the MEG1 spectrum. The faint Si XIV line (2.006 keV) is too noisy to permit a reliable centroid measurement. The S XV line (12 net MEG1 counts) is uncontaminated by other lines and quite sharp. Its measured centroid is = 5.039 (0.007, 0.006; 1) Å or = 0 (417, 357) km s-1. The uncertainty is within the limits of MEG1 absolute wavelength calibration accuracy of 0.011 Å. Thus, we measure no significant centroid shift in this hotter S XV line.
| Parameter | Chandra | XMM-Newton | XMM-Newton | XMM-Newton |
|---|---|---|---|---|
| Instrument | ACIS-S/0-order | EPIC (pnMOS) | EPIC (pnMOS) | EPIC (pnMOS) |
| ObsId | all | 0090030201 | 0090030201 | 0605670201 |
| Year | 2020, 2022 | 2004 | 2004 | 2009 |
| Phase () | 0.58 - 0.66 | 0.60 - 0.67 | 0.60 - 0.67 | 0.95 - 0.98 |
| Modelaa2T model for Chandra ACIS-S and XMM-Newton EPIC 2004 fits use one absorption component and are of form ( ) where NH,1. The EPIC 2009 fit includes a second absorption component NH,2 that is varied independently and is of form ( ) . 2T model is of form ( ). | 2T | 2T | 2T | 2T |
| Abundances | variedbbVaried abundances and best-fit values are Fe = 0.27 [0.13 - 0.41] solar. | variedccVaried abundances and best-fit values are C = 4.34 [3.27 - 5.71], O = 0.42 [0.40 - 0.48] ], Ne = 0.74 [0.73 - 0.84], Mg = 0.37 [0.36 - 0.43], Si = 1.14 [1.09 - 1.24], S = 2.18 [2.03 - 2.32] Fe = 0.11 [0.10 - 0.14] solar. | variedddVaried abundances and best-fit values are C = (4.34) fixed, O = 0.63 [0.60 - 0.68] ], Ne = 0.99 [0.93 - 1.07], Mg = 0.46 [0.40 - 0.52], Si = 2.54 [2.38 - 2.70], S = 3.30 [3.01 - 3.60] Fe = 0.10 [0.09 - 0.11] solar. | variedeeVaried abundances and best-fit values are C = 7.99 [7.58 - 9.33], O = 0.60 [0.54 - 0.67], Ne = 0.50 [0.46 - 0.55], Mg = 0.39 [0.35 - 0.44], Fe = 0.12 [0.11 - 0.14] solar. |
| NH,1 (1022 cm-2) | (0.16) | 0.16 [0.15 - 0.18] | 0.13 [0.12 - 0.14] | (0.16) |
| NH,2 (1022 cm-2) | … | … | … | 17.1 [15.2 - 19.7] |
| kT1 (keV) | (0.40) | 0.51 [0.50 - 0.53] | 0.37 [0.36 - 0.38] | 0.79 [0.77 - 0.81] |
| kT2 (keV) | 4.67 [4.26 - 5.23] | 4.34 [4.27 - 4.48] | 4.04 [3.94 - 4.14] | (4.3) |
| Eedge (keV) | …ffACIS-S fits are not sensitive to or . For EPIC fits redshift was held fixed at [2.17e-3] = 650 km s-1 (Sugawara et al. 2008). | 0.55 [0.54 - 0.56] | 0.56 [0.55 - 0.57] | 0.54 [0.54 - 0.55] |
| kTedge (eV) | …ffACIS-S fits are not sensitive to or . For EPIC fits redshift was held fixed at [2.17e-3] = 650 km s-1 (Sugawara et al. 2008). | 4.0 [0.5 - 6.7] | 3.5 [1.8 - 5.5] | (4.0) |
| redshiftffACIS-S fits are not sensitive to or . For EPIC fits redshift was held fixed at [2.17e-3] = 650 km s-1 (Sugawara et al. 2008). | (0) | (2.17e3) | (2.17e3) | (2.17e3) |
| norm1/norm2 | 0.55 | 1.05 | 1.57 | 1.86 |
| (s cm-3) | 2.32e10 | 3.89e11 | … | 4.63e11 |
| (s cm-3) | 4.67e13 | 15.5e11 | … | …ggFit did not converge to a stable value. |
| /dof () | 314.8/255 (1.23) | 2519.7/2281 (1.10) | 2668.9/2285 (1.17) | 1241.2/1149 (1.08) |
| FX,abshhFlux (0.2-8 keV) is in units of 10-13 ergs cm-2 s-1. | 12.5 [10.6 - 14.0]iiChandra ACIS-S 0-order has low effective area below 1 keV compared to XMM-Newton EPIC (Sec. 5.2). | 16.06 [15.90 - 16.10] | 16.01 [15.90 - 16.06] | 10.1 [10.0 - 10.2] |
| FX,2,abshhFlux (0.2-8 keV) is in units of 10-13 ergs cm-2 s-1. | 6.10 | 8.87 | 8.75 | 1.06 |
| log LX (ergs s-1) | 33.31 | 33.36 | 33.23 | 33.31 |
Note. — Based on XSPEC simultaneous fits of binned background-subtracted spectra. The tabulated parameters are absorption column density (NH), plasma temperaure in energy units (kT), ratio of cool/hot plasma normalizations (norm1/norm2), emission-recombination edge threshold energy (Eedge) and temperature in energy units (kTedge), upper limit on ionization timescale (), total absorbed X-ray flux (FX,abs), hot component absorbed X-ray flux (FX,2,abs), and unabsorbed X-ray luminosity LX at d = 2.168 kpc. X-ray fluxes and LX are evaluated in the 0.2-8 keV range. Square brackets enclose 1 confidence intervals. Values in parentheses were held fixed during fitting. Abundances are fixed at the solar values of Anders & Grevesse (1989) except as noted below.
| Ion | Elab | log Tmax | Net Line Flux | |||
|---|---|---|---|---|---|---|
| (keV) | (Å) | (Å) | (Å [km s-1]) | (K) | (10-6 ph cm-2 s-1) | |
| XMM-Newton (RGS) | ||||||
| O VII | 0.574 | 21.602 | 21.663 (2004) | 0.061 [847] | 6.3 | 3.73 |
| O VII | 0.574 | 21.602 | 21.679 (2009) | 0.068 [944] | 6.3 | 3.52 |
| O VIII | 0.654 | 18.967/18.973aaBlended doublet. | 19.010 (2004) | 0.043 [680] | 6.5 | 7.61 |
| O VIII | 0.654 | 18.967/18.973aaBlended doublet. | 19.025 (2009) | 0.058 [917] | 6.5 | 6.90 |
| Chandra (HETG1) | ||||||
| Ne X | 1.022 | 12.132/12.137aaBlended doublet. | 12.166 (MEG) | 0.034 [841] | 6.8 | 9.95 |
| Mg XII | 1.473 | 8.419/8.425aaBlended doublet. | 8.437 (HEG) | 0.018 [641] | 7.0 | 1.87 |
| Si XIIIr | 1.865 | 6.648 | 6.655 (MEG) | 0.007 [316] | 7.0 | 2.09 |
| Si XIIIf | 1.840 | 6.740 | 6.746 (MEG) | 0.006 [267] | 7.0 | 1.51 |
| S XV | 2.460 | 5.039 | 5.039 (MEG,HEG) | 0 [0] | 7.2 | 3.70 |
Notes: Laboratory wavelengths () and maximum line power temperatures (Tmax) are from the ATOMDB database (www.atomdb.org). Line measurements are based on the summed MEG1 spectra from all five observations except for Si XIII (resonance) and Si XIII (forbidden) lines which were only measurable in ObsIds 24497 and 24498. Net photon (ph) line fluxes are continuum-subtracted. Typical flux uncertainties are 20%.
5.2 XMM-Newton
We compare here the XMM-Newton spectra with Chandra. The comparison is useful because XMM-Newton provides better low-energy sensitivity and spectra were obtained at nearly the same phase as Chandra and at opposite phase where Chandra data are lacking.
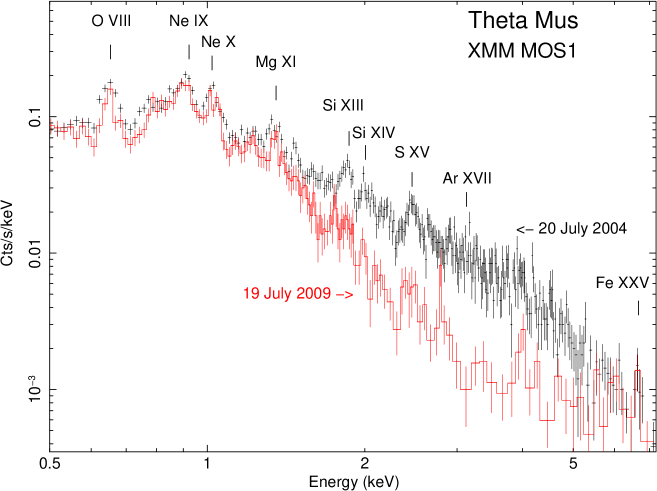
Undispersed EPIC Spectra. Figure 2-bottom shows EPIC MOS1 spectra for both XMM-Newton observations. These spectra give reliable broad-band fluxes and estimates of basic spectral parameters (NH, kT). Table 2 compares fits of the EPIC and Chandra ACIS-S 0-order spectra. The 2T fits of the ACIS-S and 2004 EPIC spectrum obtained at about the same phase give similar results but the ACIS-S fits place less emission measure in the cooler plasma component. This is largely due to the lower ACIS-S sensitivity at energies below 1 keV. This difference is apparent in Figure 2 which reveals significant emission below 1 keV in the MOS spectra such as the O VIII line which is not detected by Chandra. Thus, ACIS-S fits yield a lower measured flux than EPIC at 0.65 (Table 2). EPIC spectral fits are slightly improved in the range 0.49 - 0.55 keV near the C VI radiative recombination continuum (RRC) feature by including a recombination edge () component as did Sugawara et al. (2008). The RRC feature is faint in the EPIC spectra but clearly visible in RGS. The component does not affect ACIS-S fits since ACIS-S detects very little flux near 0.5 keV.
Table 2 includes a fit of the 2004 EPIC spectra using a 2T optically thin plasma model for comparison with 2T . The two models give similar results but 2T yields a slightly higher absorption NH and thus a higher Lx. Also the 2T model converges to a more stable value of the C abundance which is above solar and consistent with that obtained from 2T fits by Sugawara et al. (2008).
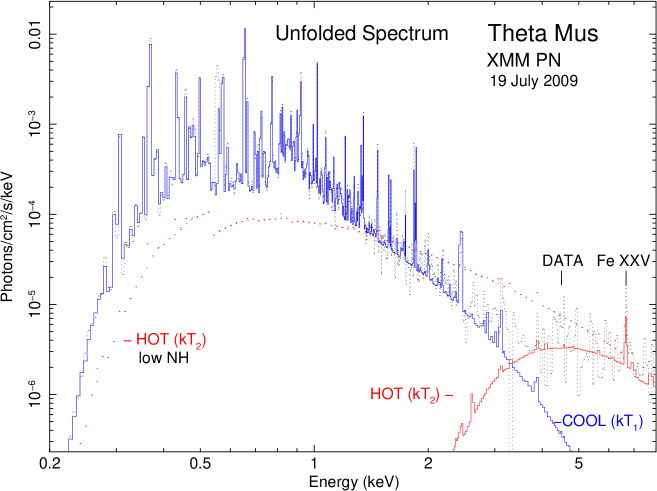
The 2009 XMM-Newton observation at phase = 0.95 - 0.98 provides crucial variability information. At lower energies the 2009 EPIC spectrum is quite similar to the 2004 EPIC spectrum but a modest flux change of 20% below 1.5 keV is not ruled out. More obvious is the decrease in emergent flux at higher energies 2 - 5 keV in the 2009 EPIC spectrum, but little if any change at the Fe XXV energy (6.67 keV). Fits of the 2009 EPIC spectra give an absorbed broad-band flux Fx,abs(0.2-8 keV) = 9.85 [9.41 - 10.1] 10-13 ergs cm-2 s-1. This is only 61% of the 2004 value. The hard-band (2-8 keV) flux dropped by more than a factor of 3 compared to the 2004 observation and accounts for most of the change. The emission measure and observed flux in the 2009 observation are dominated by the cooler plasma component. Even so, hot plasma traced by Fe XXV (Tmax 63 MK) is also present but the 2009 EPIC spectra do not tightly constrain the hot-component temperature.
The decrease in hard-band flux could be due to a change in the intrinsic X-ray spectrum or an increase in the absorption of the hotter plasma component. Although some intrinsic spectral change is not excluded an increase in absorption due to a change in viewing geometry over orbital phase is more easily reconciled with the CW picture. In that interpretation higher absorption is expected when the WR star passes in front ( 0) and the line-of-sight toward the hottest CW shock plasma near the line-of-centers passes through the dense metal-enriched WR wind. Lower absorption is anticipated when the OV star passes in front ( 0.5) and the hotter CW shock plasma is viewed through a low-density cavity formed by the OV star wind.
To test this hypothesis a separate absorption component (NH,2) was applied to the hotter plasma component in the 2T model of the 2009 EPIC spectra. This model provides a good fit (Table 2) and requires high but loosely constrained absorption NH,2 1023 cm-2. The unfolded spectrum (Fig. 4) shows that the hotter component dominates the observed spectrum above 3 keV and accounts for the Fe XXV emission. But the crossover energy depends on the plasma temperatures and absorption column density. Factors affecting the absorption are discussed below (Sec. 6.4.1).
This absorbed hot component is strikingly similar to that derived from XMM-Newton observations of Vel at low-state (Fig. 5 of Schild et al. 2004). Given the similarity it is likely that the hotter plasma originates in the CW interaction region near the line of centers where high temperatures and densities are expected. The key question is whether the CW region is in the SB system or the SBOI system (Sec. 6.4.1).
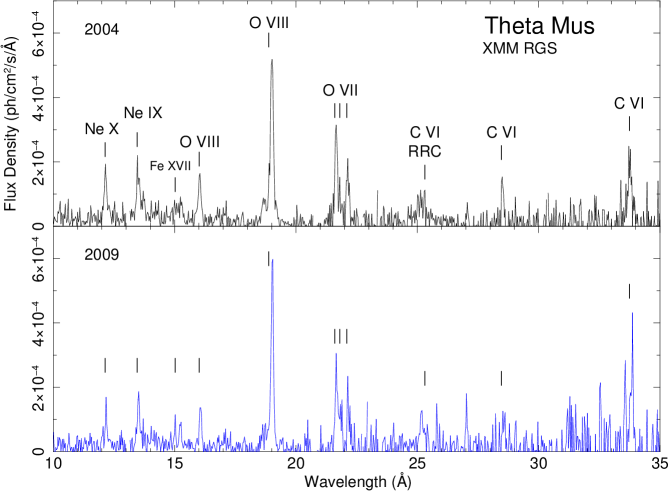
RGS Grating Spectra. Although detailed analysis of the XMM-Newton RGS grating spectra is beyond the scope of this work, we briefly summarize key results. The RGS spectra (Fig. 3) are remarkably similar even though they were obtained five years apart at opposite phases. Low-energy lines down to C VI at = 33.734 Å were detected. The C VI RRC feature at 25.30 Å is present in both spectra. Our analysis reveals that brighter lines are clearly broadened and redshifted in both observations with slightly higher shifts measured in the 2009 observation (Table 3). The strong O VIII line has width FWHM 1900400 km s-1 and is redshifted to 700 - 900 km s-1. The O VIII line fluxes of the two observations differ by no more than 15% suggesting that O VIII emission is nearly stable over 5 years.
The RGS spectra detect the O VII and Ne IX He-like triplets consisting of the closely-spaced resonance (), intercombination (), and forbidden () lines. In hot stars with strong UV radiation fields the line flux ratio = is not a reliable electron density diagnostic but can constrain the line formation distance from the star and = ()/ is temperature sensitive (Gabriel & Jordan 1969; Blumenthal, Drake, & Tucker 1972; Pradhan 1982; Porquet et al. 2001). The triplet components are well separated in O VII but not Ne IX. For the longer 2004 observation with highest signal-to-noise ratio we obtain O VII flux ratios (normalizing the line flux to unity) :: = 1.00:0.17:0.50 giving = 3.0 [2.0 - 4.9] and = 0.7 [0.5 - 0.9]. The large uncertainty range for is due to the uncertainty in measuring the flux of the faint line. In the case of low collisional excitation where the electron density is much less than the critical density ( ) and stellar photoexcitation is well below the critical photoexcitation rate ( ) the limiting values for O VII are = 3.95 and = 1.0 (Pradhan 1982). Taking the uncertainty range of into account a value is not ruled out. If the plasma is not in ionization equilibrium at the line formation temperature of O VII (Pradhan 1982). Sugawara et al. (2008) have argued for NEI conditions.
A lower limit on the O VII formation distance rOV from the O6-7V star can be obtained using the lower bound on as was done for Vel (Skinner et al. 2001; Schild et al. 2004). The approach assumes the electron density is subcritical ( ) and that photoexcitation is responsible for decreasing to a value below . Using the lower bound 2.0 for O VII gives a / 0.5. Assuming Teff 38,000 K for the O6-7V star (Weidner & Vink 2010) and scaling the value of / in Table 2 of Blumenthal et al. (1972) for Teff = 105 down to 38 kK gives a lower limit rOV 70 . This bound is a first approximation and a more refined estimate would require detailed calculation of the stellar radiation fields. But it is clear that if photoexcitation dominates over collisions then the O VII triplet does not form close to the O6-7V star.
5.3 Summary of Spectral Analysis
The X-ray emission of Mus consists of a weakly-absorbed nearly steady cool component at kT1 0.4 - 0.7 keV plus a hotter component at kT2 4 keV whose observed flux is variable on a timescale of 5 years. The hotter plasma contributed a greater fraction of the total X-ray flux at orbital phase 0.65 than at 0.96. Emission lines are broadened to FWHM 1000 km s-1 due to bulk plasma motion. Low-temperature emission lines are redshifted to velocities as high as 800 - 900 km s-1. But no significant centroid shift was measured in Chandra HETG spectra of the S XV line which traces warmer plasma that would be located nearer to the line-of-centers in CW shock binaries. The strong O VII forbidden line in the 2004 XMM-Newton RGS spectrum can be explained if O VII forms in cool low-density plasma located far from the O6-7V star. The significant decline in hot component flux can be attributed to increased absorption of the hot component at phase 0.95 - 0.98 (WR in front). The Mus X-ray luminosity for the observations analyzed herein is log Lx(0.2 - 8 keV) = 33.22 - 33.36 ergs s-1 (Table 2), close to the Einstein value log Lx = 33.2 ergs s-1. It is also similar to other massive WC binaries (Pollock 1987) including Velorum (log Lx = 33.06 - 33.17; Schild et al. 2004).
6 Discussion
6.1 Comparison with Velorum
The X-ray observations of Mus show some striking similarities with the 78-day WC8O7.5 binary Velorum studied by Willis, Schild, & Stevens (1995), Stevens et al. (1996), Skinner et al. (2001), and Schild et al. (2004). In addition to their similar spectral types both systems have a cool plasma component that is viewed under low absorption and appears to be nearly steady with orbital phase. The C VI RRC feature in both systems points to an extended region where carbon ions that likely originate in the WC star wind recombine with free electrons. Extended cool plasma located far out in the system is also implicated by strong forbidden lines in He-like triplets for both stars. In addition, hotter plasma including the Fe XXV line evidently viewed through high absorption at certain phases is present, as expected for CW shock emission near the line-of-centers. Line broadening is detected in both sytems with widths FWHM 1000 km s-1. The X-ray luminosity of Vel is similar to Mus. However, one notable difference is that the low-temperature X-ray emission lines of Mus are redshifted but no significant line shifts have been detected in Vel (Skinner et al. 2001). The unusual line shifts (or lack thereof) are not easily reconciled with colliding wind theory.
6.2 X-ray Emission from the O Stars
Although intrinsic X-rays from the WC6 star are not anticipated (Sec. 1) the X-ray emission of Mus could include intrinsic emission from the OV or OI stars. As an example, soft emission from the O9III star Mus B lying south of Mus is faintly detected by Chandra (Fig. 1). X-ray grating observations of Ori (O9.7Ib) show cool plasma that is consistent with radiative wind shocks and heavily suppressed forbidden lines in O VII and Ne IX (Waldron & Cassinelli 2000; Raassen et al. 2008). The suppressed lines imply cool plasma formation close to the star, clearly different from Mus. The Ori X-ray luminosity is log Lx = 32.14 ergs s-1 (Raassen et al. 2008). If Lx of the O9.5I star in the Mus system is similar then it would account for 10% of the observed value.
It is also unlikely that intrinsic O6-7V star emission alone can account for the observed Lx, the hotter plasma traced by the Fe XXV line, and the redshifted lines. Main sequence O-type stars are generally soft X-ray sources and a recent study based on XMM-Newton data and Gaia distances yields the correlation log (Lx/Lbol) = 6.60.4 (Gómez-Morán & Oskinova 2018). Adopting a typical O6-7V value log (Lbol/L⊙) = 5.65 gives Lx = 0.11 (0.045 - 0.28) L⊙ or log Lx = 32.6 (32.23 - 33.03) ergs s-1 which is less than the observed value log Lx = 33.3 ergs s-1. Thus, intrinsic emission from the O stars could account for some, but not all, of the observed X-ray luminosity. But if the O-star contribution were due to radiative wind shocks then one would expect low-temperature lines to be blueshifted (not redshifted) and the presence of hot plasma in Mus is at odds with radiative wind shock predictions.
6.3 Colliding Wind Predictions
The presence of redshifted low-temperature emission lines in Mus at phase 0.6 when the OV star should be nearly in front of the WC star is unexpected if the cooler X-ray plasma arises between the WC and O star in the SB system (Sec. 2). As suggested by Sugawara et al. (2008) the redshifted lines could be reconciled with the CW interpretation if the CW shock lies between the SB system and the OI star lying further away in a bound orbit. But regardless of whether a CW shock is located in the wide SBOI system or the SB system it is evident from the low absorption of cooler plasma, C VI RRC feature, and O VII / line ratio that some cool plasma is located far out in an extended region where the wind density is low. On the other hand the drop in flux of the hotter plasma component on a timescale of 5 years is compatible with the 19-day SB system but would be rather fortuitous if the SBOI system period is significantly greater than 40 years. Below we compare CW predictions for SB system and the wide SBOI system.
SB System. The location of the stagnation point on the line-of-centers between the WC6 and O6-7V stars is determined by the wind momentum ratios (eq. [1] of Stevens et al. 1992)
| (1) |
where and are the respective distances from the center of the WC and O stars to the stagnation point and = is the binary separation. Mass loss parameters for WR and O stars are rather uncertain but for purposes of an estimate we adopt the WC6 mass loss rate log = 4.74 M⊙ yr-1 and terminal wind speed = 2060 km s-1 of Nugis & Lamers (2000). For the O6-7V star we assume log = 6.3 M⊙ yr-1 and = 2450 km s-1 (Lamers & Leitherer 1993). These adopted values give = 5.5 and place the stagnation point at the contact discontinuity close to the O6-7V star at = 0.15. Using assumed masses MWC6 = 12 M⊙ (Hill et al. 2002) and MOV = 30 M⊙ (Weidner & Vink 2010), the computed semi-major axis is = 0.49 AU = 105 R⊙ for Porb = 19.1325 d. A slightly lower mass for the OV star is possible (Moffat & Seggewiss 1977) but would not significantly alter the computed value of the semi-major axis. Typical radii for WC6 stars are RWC6 3 R⊙ (Sander et al. 2012) and for O7V stars ROV 10 R⊙ (Lamers & Leitherer 1993). This gives 32 R⊙ 3 RO7V. The above results assume the winds of both stars have reached terminal speed before colliding. This would be the case for the WC6 star assuming a typical hot star wind velocity profile = with 0.7 - 1.0 (Krtička & Kubát 2011). But the O star wind would only be at about 70% of its terminal speed which would tend to push the stagnation point even closer to (or perhaps onto) the O star surface. Thus the hottest plasma would be located near the line-of-centers close to the OV star.
Theory provides analytic expressions for the CW shock X-ray luminosity (Lx,cw) that depend on mass loss parameters, binary separation, stellar radii, and whether the shock is adiabatic or radiative (e.g. Usov 1992; Stevens et al. 1992). But previous studies of WROB systems have not always yielded good agreement between the observed Lx and predictions (e.g. Skinner et al. 2019b). The discrepancies may be in part due to inaccurate mass loss rates resulting from inhomogeneous (i.e. clumped) winds (Cherepashchuk 1990; Zhekov 2012). Also for wide WR binaries where the winds have reached terminal speeds before colliding, theory predicts that Lx,cw should scale inversely with orbital separation . But no such change was detected in the hard-band X-ray emission of Vel at two different orbital phases where is thought to have changed (Schild et al. 2004). It thus seems that not all WR binaries faithfully adhere to the theoretical Lx,cw 1/ scaling relation.
For wide binaries with periods more than a few days the CW shock is expected to be adiabatic but for short-period systems it can be radiative. In the latter case most of the shock energy is radiated away (tending to increase Lx,cw) and the shocked plasma is nearly isothermal. A rough gauge on whether the shock is adiabatic or radiative is given by the ratio of the cooling time to escape time = / where 1 is typical for radiative shocks and 1 for adiabatic shocks. The wide SBOI system is clearly in the adiabatic regime but the close SB system could be either adiabatic or radiative. For the Mus SB system we obtain 1.3 (eq. [8] of Stevens et al. 1992) which favors the adiabatic regime, but marginally so. However, if the WR wind shocks onto the surface of the O star companion then radiative cooling can be important even if 1 (Stevens et al. 1992).
If we assume, as suggested above, that the WC star wind impacts the surface of the O6-7V star (with the shock cone wrapping around it) then the CW luminosity predicted for an adiabatic shock (eq. [81] of Usov 1992) is more than an order of magnitude less than the observed Lx. But if the shock is radiative then (eq. [80] of Usov 1992)
| (2) |
where the wind luminosity is = (1/2) and we have assumed spherical homogenous winds with mass density = /(4). Using the same mass loss, stellar, and orbital parameters as above gives log = 33.8 ergs s-1, or about 0.5 dex higher than observed. This difference could potentially be explained if the adopted WC mass loss rate is too high as may be the case if the wind is clumped. Thus if the WR wind shocks onto the O6-7V star the predicted for a radiative shock is in better agreement with the observed value. Even so, the above estimates are only approximate since the Usov (1992) formulation assumes a bremsstrahlung X-ray spectrum and does not account for line emission.
SBOI System. A similar analysis to above can be carried out for the SBOI system. Because of the much wider separation the CW shock would be adiabatic and the winds would be at terminal speeds before colliding. In Eq. (1) we assume that the combined SB wind is dominated by the powerful WC6 wind and use its wind speed and mass loss rate. For the OI wind we adopt = 3.2 10-6 M⊙ yr-1 and = 1800 km s-1 (Lamers & Leitherer 1993). For these wind parameters = 2.55 and the contact discontinuity lies closest to the OI star at an offset of 0.28. To estimate the deprojected separation we assume an arbitrary angle of 45∘ between the line-of-sight and the major axis of the SBOI system which gives = 141 AU. In that case the discontinuity is offset from the OI star along the line-of-centers by 40 AU. The predicted X-ray luminosity of the CW shock between the SB system and OI star is (summing results of eqs. [89, 95] of Usov 1992) log 33.6 ergs s-1 which is within a factor of two of the observed value for Mus. This is rather good agreement and an adiabatic CW shock in the SBOI system could account for the observed Lx unless is much greater than assumed above.
6.4 Questions and Challenges for the Colliding Wind Interpretation
6.4.1 Where is the Hot Plasma Located?
If the OI supergiant is in a long-period orbit around the SB system then two CW shock regions may be present: one in the SB system and another in the SBOI system. If so their contributions would be superimposed in the X-ray spectra. This creates some ambiguity as to where the X-ray emission originates.
As we have shown, the cooler plasma is located in an extended region surrounding the Mus system. The redshifted lines in the cooler plasma component that show little change at opposite SB orbital phases can be explained if the cooler plasma originates in a CW shock in the wide SBOI system with the OI star being further away (Sugawara et al. 2008). Even if the above picture is correct, it does not guarantee that the hottest plasma also originates in the SBOI system. The key diagnostic of the hot plasma is the Fe XXV line at 6.67 keV. Unfortunately this line is not bright enough to obtain a reliable centroid measurement in the Chandra grating spectra and is not captured by XMM-Newton RGS. So we do not know if it is persistently redshifted, as are the lines tracing cooler plasma.
There are two clues pointing to the SB system as the source of the hotter plasma. One is the hard-band variability timescale of 5 years. This timescale is not problematic for the 19-day SB orbit but may be for the wide SBOI system whose orbital period is not known but is certainly 40 years.
The second clue is the high absorption toward the hot component NH,2 1023 cm-2 inferred from fits of the 2009 EPIC spectrum. This value is similar to that determined for Vel and was attributed to a CW shock between the WC and OIII stars (Schild et al. 2004). CW theory predicts a characteristic absorption column density near orbital quadrature (Stevens et al. 1992)
| (3) |
where (units of 10-6 M⊙ yr-1) and Vwind,1000 (units of 1000 km s-1) correspond to the dominant wind, is the wind momentum ratio of the dominant to weaker wind (eq. [1]) and is the separation in units of 1012 cm. For the SB system 5.5 and for the SBOI system 2.55, as computed above. The key discriminant is the separation which is at least 100 times larger in the SBOI system. That leads to a much smaller absorption estimate NH,cw 1019.8 cm-2 compared to the SB system 1022.6 cm-2. The wind absorption is abundance dependent and will vary over the orbit as the line-of-sight through the wind interaction region changes. But the much larger characteristic value of NH,cw predicted for the SB system is clearly in better agreement with that needed to explain the decrease in hard-band flux in the 2009 XMM-Newton observation.
6.4.2 The Mystery of the Missing Blueshifted Lines
Even if the persistent redshifted low-temperature lines originate in a CW shock in the wide SBOI system, that does not explain the absence of blueshifted lines near SB orbital phase 0.5-0.6 (OV star in front) where they should be seen if detectable CW emission emerges from the SB system. This is not the first time questions about undetected line shifts have arisen in massive WR binaries (Sec. 6.1). A few possible explanations for the no-show blueshifts are considered below, all being somewhat speculative.
If there were no detectable CW shock emission from the SB system then the observed X-ray emission would be entirely attributed to a CW shock in the long-period SBOI system. If the OI star is in a bound orbit and 40 years then its orbital motion over the time interval of 18 years spanned by the X-ray observations might not be sufficient to cause line centroids to shift from red to blue. In fact no line shifts from red to blue were detected (Table 3) so a period 40 years is consistent with the X-ray results. Obviously, if blueshifted lines are not expected then their absence is no longer a mystery. But in this picture the SB system would not contribute significantly to the X-ray emission and this would be quite exceptional if the WR companion is indeed a OV star. Other WCO binaries are bright X-ray sources well above the detection limits of the observations discussed here (Pollock 1987). Also if the SB system were X-ray faint (or quiet) then the hot heavily-absorbed plasma would be attributed to the wide SBOI system. But as shown above the high absorption needed to account for the decrease in hard-band flux is much greater than predicted by CW theory for the wide SBOI system. We thus conclude that the hypothesis of no detectable CW X-rays from the SB system could explain the lack of blueshifted lines but it does not square well with what is known about X-ray emission of other WCO binaries or CW theory absorption predictions.
Line centroid shifts originating in high-velocity shocked gas in the SB system would be difficult to detect if the SB orbit is viewed at low inclination (face-on) or if the shock cone opening angle is large and the flow velocity along the line-of-sight is small. But on the contrary optical radial velocity variations imply a rather high orbital inclination of at least 49∘ (Moffat & Seggewiss 1977; Lenoir-Craig et al. 2021). A wide shock cone with a half opening angle 90∘ would occur for nearly equal wind momenta 1 (Stevens et al. 1992) and large adjustments in the assumed mass-loss parameters would thus be required. But such a large opening angle is not consistent with the models of Hill et al. (2002) which gave = 46∘4∘.
The accuracy of the SB system orbital ephemeris is crucial for calculation of orbital phases and interpreting line shifts. Determination of the SB orbital parameters for Mus is difficult (Sec. 2). The formal uncertainties in and reference HJD for minimum light To corresponding to = 0 adopted here (Table 1) are too small to produce a substantial error in the computed phases of the X-ray observations. Combining the uncertainties for and To results in a phase error of 0.08 (1.54 d) for the June 2022 Chandra observations and only half that amount for the XMM-Newton observations. Even so, the X-ray phases are quite sensitive to the adopted period and a small error of 0.013 d in would shift the computed Chandra phases by 0.25. If the shorter periods obtained by Moffat & Seggewiss (1977) or Marchenko et al. (1998) were adopted the computed phases would change dramatically. But the upper limit on orbital period change 4.57 s yr-1 derived by Lenoir-Craig et al. (2021) has a negligible effect on computed X-ray phases. Additional X-ray observations with more complete phase coverage over the 19 day orbit would be useful to see if line shifts vary with phase or from red to blue. There is already a hint for slightly larger redshifts in the 2009 XMM-Newton RGS spectra than in 2004 (Table 3). Also any future observations that improve our knowledge of the Mus SB or wide SBOI system orbital parameters or the nature of the elusive WR companion (discussed by Hill et al. 2002) might help clarify the X-ray results.
7 Summary of Main Results
New Chandra X-ray observations of Mus confirm that emission lines in the cooler plasma component are redshifted near 0.65 (OV star passing in front of the WC star) as previously reported from 2004 XMM-Newton observations. An archived 2009 XMM-Newton observation reveals that low-temperature lines are similarly redshifted at opposite phase 0.95. The persistent redshifts could be attributed to a CW shock in the wide SBOI system. But blueshifted lines that should appear if CW shock emission is also present in the short-period SB system have not been detected so far, for unknown reasons. Assuming no large changes occurred in the intrinsic X-ray spectrum of Mus, the decrease in emergent hard-band flux between the 2004 and 2009 XMM-Newton observations is likely due to increased absorption toward the hotter plasma component. The high absorption inferred from spectral fits points toward dense hot wind-shocked plasma near the line-of-centers in the confines of the SB system. The X-ray emission of Mus is quite similar to the WCO binary Vel implying a common physical mechanism and both systems show puzzling line centroid properties that are not easily reconciled with CW models.
References
- Anders & Grevesse [1989] Anders, E., & Grevesse, N. 1989, Geochim. Cosmochim. Acta, 53, 197
- Arnaud [1996] Arnaud, K.A. 1996, Astronomical Data Analysis Software and Systems V, eds, G. Jacoby & J. Barnes, ASP Conf. Series v. 101, 17
- Barlow et al. [1981] Barlow, M.J., Smith, L.J., & Willis, A.J. 1981, MNRAS, 196, 101
- Blumenthal et al. [1972] Blumenthal, G.R., Drake, G.W., & Tucker, W.H.1972, ApJ, 172, 205
- Cassinelli et al. [2001] Cassinelli, J.P., Miller, N.A., Waldron, W.L., MacFarlane, J.J., & Cohen, D.H. 2001, ApJ, 554, L55
- Cherepashchuk [1976] Cherepashchuk, A.M. 1976, Sov. Astron. Letters, 2, 138
- Cherepashchuk [1990] Cherepashchuk, A.M. 1990, Sov. Astron., 34, 481
- Dougherty & Williams [2000] Dougherty, S.M. & Williams, P.M. 2000, MNRAS, 319, 1005
- Feldmeier et al. [1997] Feldmeier, A., Kudritzki, R.-P., Palsa, R., Pauldrach, A.W.A., & Puls, J. 1997, A&A, 320, 899
- Fruscione et al. [2006] Fruscione, A. et al. 2006, Proc. SPIE, 6270, id. 62701V
- Gabriel et al. [2004] Gabriel, C. et al. 2004, \aspconf, 314, 759
- Gabriel & Jordan [1969] Gabriel, A.H. & Jordan, C. 1969, MNRAS, 145, 241
- Gómez-Morán & Oskinova [2018] Gómez-Morán, A. & Oskinova, L.M. 2018, A&A, 620, A89
- Gorenstein [1975] Gorenstein, P. 1975, ApJ, 198, 95
- Hartkopf et al. [1999] Hartkopf, W.J., Mason, B.D., Gies, D.R. et al. 1999, AJ, 118, 509
- Hill et al. [2002] Hill, G.M., Moffat, A.F.J., & St.-Louis 2002, MNRAS, 335, 1069
- Kahn et al. [2001] Kahn, S.M. et al. 2001, A&A, 365, L312
- Krtička & Kubát [2011] Krtička, J. & Kubát, J. 2011, A&A, 534, A97
- Lamers & Leitherer [1993] Lamers, H.J.G.L.M. & Leitherer, C. 1993, ApJ, 412, 771
- Lenoir-Craig et al. [2021] Lenoir-Craig, G., St.-Louis, N., Moffat, A.F.J., & Pablo, H. 2021, MNRAS, 506, 4465
- Lucy & White [1980] Lucy, L.B. & White, R.L. 1980, ApJ, 241, 300
- Luo et al. [1990] Luo, D., McCray, R., & MacLow, M-M. 1990, ApJ, 362, 267
- Marchenko et al. [1998] Marchenko, S.V. et al. 1998, A&A, 331, 1022
- Moffat && Seggewiss [1977] Moffat, A.F.J. & Seggewiss, W. 1977, A&A, 54, 607
- Oskinova et al. [2003] Oskinova, L.M., Ignace, R., Hamann, W.-R., Pollock, A.M.T., & Brown, J.C. 2003, A&A, 402, 755
- Owocki et al. [1988] Owocki, S.P., Castor, J.I., & Rybicki, G.B. 1988, ApJ, 335, 914
- Pollock [1987] Pollock, A.M.T. 1987, ApJ, 320, 283
- Porquet et al. [2001] Porquet, D., Mewe, R., Dubau, J., Raassen, A.J.J., & Kaastra, J.S. 2001, A&A, 376, 1113
- Pradhan [1982] Pradhan, A.K. 1982, ApJ, 263, 477
- Prilutskii & Usov [1976] Prilutskii, O.F. & Usov, V.V. 1976, Sov. Astron., 20, 2
- Raassen et al. [2008] Raassen, A.J.J., van der Hucht, K.A., Miller, N.A., & Cassinelli, J.P. 2008, A&A, 478, 513
- Sander et al. [2012] Sander, A., Hamann, W.-R., & Todt, H. 2012, A&A, 540, A144
- Schild et al. [2004] Schild, H., Güdel, M., Mewe, R., Schmutz, W., Raassen, A.J.J., Audard, M., Dumm, T., van der Hucht, K.A., Leutenegger, M.A., & Skinner, S.L. 2004, A&A, 422, 177
- Schnurr [1999] Schnurr, O. 1999, Master’s Thesis, Univ. of Heidelberg
- Skinner et al. [2001] Skinner, S.L., Güdel, M., Schmutz, W., & Stevens, I.R. 2001, ApJ, 558, L113
- Skinner et al. [2006] Skinner, S.L., Güdel, M., Schmutz, W., & Zhekov, S.A. 2006, Ap&SS, 304, 97
- Skinner et al. [2010] Skinner, S.L., Zhekov, S.A., Güdel, M., Schmutz, W., & Sokal, K.R. 2010, ApJ, 139, 825
- Skinner et al. [2012] Skinner, S.L., Zhekov, S.A., Güdel, M., Schmutz, W., & Sokal, K.R. 2012, AJ, 143, 116
- Skinner et al. [2019] Skinner, S.L., Sokal, K.R., & Güdel, M. 2019, ApJ, 871, 116
- Skinner et al. [2019] Skinner, S.L., Zhekov, S.A., Güdel, M., & Schmutz, W. 2019b, AN, 340, 50
- Sokal et al. [2010] Sokal, K.R., Skinner, S.L., Zhekov, S.A., Güdel, M., & Schmutz, W. 2010, ApJ, 715, 1327
- Stevens et al. [1992] Stevens, I.R., Blondin, J.M., & Pollock, A.M.T., 1992, ApJ, 386, 265
- Stevens et al. [1996] Stevens, I.R. et al. 1996, MNRAS, 283, 589
- St.-Louis et al. [1987] St.-Louis, N., Drissen, L., Moffat, A.F.J., Bastien, P. & Tapia, S. 1987, ApJ, 322, 870
- Sugawara et al. [2008] Sugawara, Y., Tsuboi, Y., & Maeda, Y. 2008, A&A, 490, 259
- ud-Doula & Owocki [2002] ud-Doula, A. & Owocki, S.P. 2002, ApJ, 576, 413
- Usov [1992] Usov, V.V. 1992, ApJ, 389, 635
- van der Hucht [2001] van der Hucht, K.A. 2001, New A Rev., 45, 135
- van der Hucht et al. [1986] van der Hucht, K.A., Cassinelli, J.P., & Williams, P.M. 1986, A&A, 168, 111
- Vuong et al. [2003] Vuong, M.H., Montmerle, T., Grosso, N. et al. 2003, A&A, 408, 581
- Waldron & Cassinelli [2000] Waldron, W.L. & Cassinelli, J.P. 2000, ApJ, 548, L45
- Weidner & Vink [2010] Weidner, C. & Vink, J.S. 2010, A&A, 524, A98
- Willis et al. [1995] Willis, A.J., Schild, H., & Stevens, I.R. 1995, A&A, 298, 549
- Woosley & Bloom [2006] Woosley, S.E. & Bloom, J.S. 2006, ARA&A, 44, 507
- Zhekov [2007] Zhekov, S. 2007, MNRAS, 382, 886
- Zhekov [2012] Zhekov, S. 2012, MNRAS, 422, 1332