A complexity measure in natural time analysis identifying the accumulation of stresses before major earthquakes
Abstract
Here we suggest a new procedure through which one can identify when the accumulation of stresses before major earthquakes (EQs) (of magnitude 8.2 or larger) occurs. By analyzing the seismicity in the frame of natural time, which is a new concept of time introduced in 2001, we study the evolution of the fluctuations of the entropy change of seismicity under time reversal for various scales of different length (number of events). We find that anomalous intersections between scales of different lengths are observed upon approaching an extraordinary major EQ occurrence. The investigation is presented for the seismicity in Japan since 1984 including the 9 Tohoku EQ on 11 March 2011, which is the largest EQ ever recorded there.
I Introduction
It is widely known [1, 2, 3] that earthquake (EQ) occurrences exhibit complex correlations in time, space and magnitude (e.g., [4, 5, 6, 7, 8, 9]) and the observed EQ scaling laws [10] indicate the existence of phenomena closely associated with the proximity of the system to a critical point. In the 1980s, the observation of Seismic Electric Signals (SES), which are low frequency transient changes of the electric field of the Earth preceding EQs, was reported [11, 12, 13]. Many SESs observed within a short time are termed SES activity [14] being accompanied by Earth’s magnetic field variations [15] mainly on the z-component [16, 17]. These observations have been motivated by a physical model for SES generation, which enables the explanation of the simultaneous detection of additional transient multidisciplinary phenomena before the EQ rupture[18]. This physical model is termed “pressure stimulated polarization currents” (PSPC) model [19, 11, 12, 20] and could be summarized as follows: In the Earth, electric dipoles are always present[19] due to lattice imperfections (point and linear defects) in the ionic constituents of rocks and exhibit initially random orientations at the future focal region of an EQ, where the stress, , starts to gradually increase. This is called stage A. When this stress accumulation achieves a critical value, the electric dipoles exhibit a cooperative orientation resulting in the emission of a SES activity (cf. cooperativity is a hallmark of criticality [21]). This is called stage B. Uyeda et al. [22] mentioned that the PSPC model is unique among other models that have been proposed for the explanation of the SES generation.
The criticality of SES activities has been ascertained by employing natural time analysis (NTA) [23, 24, 25], which has been introduced in 2001 [26] based on a new concept of time termed natural time. NTA enables the uncovering of hidden properties in time series of complex systems and can identify when the system approaches the critical point (for EQs the mainshock occurrence is considered the new phase) [3, 27].
II Natural time analysis. Background.
For a time series comprising events, we define as natural time for the occurrence of the -th event the quantity [26, 23, 28]. Hence, we ignore the time intervals between consecutive events, but preserve their order and energy . The evolution of the pair is studied, where is the normalized energy for the -th event. Using as the characteristic function of for all , the behavior of is studied at , because all the moments of the distribution of can be estimated from the derivatives (for positive integer) at . A quantity was defined from the Taylor expansion where
| (1) |
A careful study shows[29] that may be considered as an order parameter of seismicity and was also demonstrated[30] that the spatiotemporal variations of reveal the epicenters of the EQs of magnitude .
The dynamic entropy in natural time is given by [25]
| (2) |
where denotes the average value of weighted by , i.e., and . Upon considering [31, 3] the time-reversal , i.e., , the entropy obtained by Eq. (2), labelled by , is given by
| (3) |
which is different from . Hence, there exists a change in natural time under time reversal, thus being time-reversal asymmetric [31, 32, 3, 27]. The calculation of is carried out by means of a window of length (=number of successive events), sliding each time by one event, through the whole time series, thus, a new time series comprising successive values is formed.
The complexity measure is defined by [3, 33]
| (4) |
where is the standard deviation of the time series of and the denominator stands for the standard deviation of the time series of of =100 events. Thus, in short, quantifies how the statistics of time series varies upon changing the scale from 100 to another scale , and is of profound importance to study the dynamical evolution of a complex system (see p. 159 of Ref.[3]).
III Results
We used the seismic catalog of the Japan Meteorological Agency (JMA) in a similar fashion as in Refs.[34, 30, 35] by considering all EQs of magnitude to assure data completeness from 1984 until 15 November 2023 within the area N, E. The EQ energy was obtained from the JMA magnitude by converting [36] to the moment magnitude [37]. The values were computed according to Eq.(4).
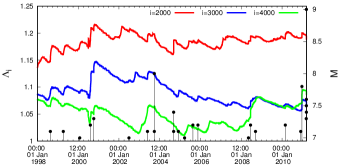
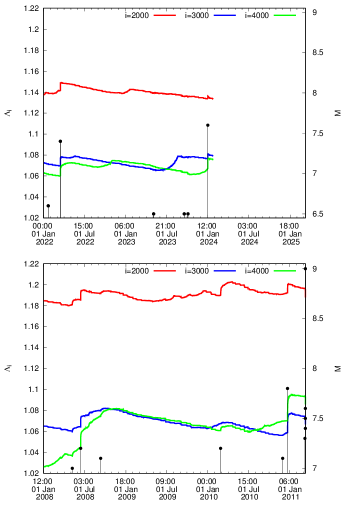
The results from Japan concerning the study of are plotted in Figs.1, 2, and 3 by starting the computation from 1 January 1984 for the scales 2000, 3000, and 4000 events. After a careful inspection of these figures the following comments are now in order:
III.1 Results from 1 January 1998 until the 9 Tohoku EQ occurrence on 11 March 2011
During almost a decade, i.e., during the period from 1 January 1998 until the 7.2 EQ on 14 June 2008, there exists no intersection between the curves of the three scales , 3000, and 4000 events since the scale events lies in the highest level, the scale events in the middle level and the scale events in the lowest level. Approximately, from the latter date the curve of the scale events shows a clear increase, thus finally almost overlapping the curve of the scale events until almost 5 August 2010. From thereon, however, the curve corresponding to events exceeds the one of 3000 events (cf. at this date the two curves intersect) and subsequently it exhibits an abrupt increase upon the occurrence of the 7.8 EQ on 22 December 2010 in southern Japan at 27.05oN 143.94oE, which constitutes an evident intersection. Remarkably, on this date (22 December 2010) of the abrupt increase of additional facts are observed: The abrupt increase conforms to the seminal work by Lifshitz and Slyozov [38] and independently by Wagner [39] (LSW) for phase transitions showing that the characteristic size of the minority phase droplets exhibits a scaling behavior in which time () growth has the form . It was found that the increase of follows the latter form and that the prefactors are proportional to the scale , while the exponent is independent of [40]. Furthermore, the Tsallis [41] entropic index exhibits a simultaneous increase with the same exponent (1/3) [40]. In addition, a minimum of the entropy change of seismicity in the entire Japanese region under time reversal was identified by Sarlis et al. [42], who also showed that the probability to obtain such a minimum by chance is approximately 3% thus demonstrating that it is statistically significant. The robustness of the appearance of on 22 December 2010 upon changing the EQ depth, the EQ magnitude threshold, and the size of the area investigated has been documented[42]. Such a minimum is of precursory nature, signaling that a large EQ is impending according to the NTA of the Olami-Feder-Christensen (OFC) model for earthquakes [43], which is probably [44] the most studied non-conservative self-organized criticality (SOC) model, originated by a simplification of the Burridge and Knopoff spring-block model [45]. In the OFC model, NTA showed that exhibits a clear minimum [3] before a large avalanche, which corresponds to a large EQ. Finally, studying the fluctuations of of seismicity in the entire Japanese region NE versus the conventional time from 1 January 1984 until the Tohoku EQ occurrence on 11 March 2011, we find [46] a large fluctuation of upon the occurrence of the 7.8 EQ on 22 December 2010. This finding was also checked for several scales from i = 150 to 500 events, which also revealed the following [46]: upon increasing it is observed (see Figs. 2b and 4e of Ref. [34]) that the increase of the fluctuation on 22 December 2010 becomes distinctly larger – obeying the interrelation - which does not happen (see Fig. 4a–d of [34]) for the increases in the fluctuations upon the occurrences of all other shallow EQs in Japan of magnitude 7.6 or larger during the period from 1 January 1984 to the time of the 9 Tohoku EQ. This interrelation , see Fig. 2(g) and (h) of Ref.[46], has a functional form strikingly reminiscent of the one discussed by Penrose et al. [47] in computer simulations of phase separation kinetics using the ideas of Lifshitz and Slyozov [38], see their equation (33) which is also due to Lifshitz and Slyozov. Hence, the fluctuation on 22 December 2010 accompanying the minimum is unique.
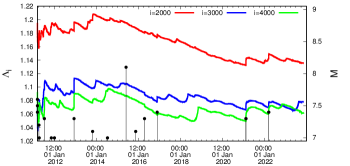
III.2 Results from 15:00 LT on 11 March 2011 until now
During this period, a 7.9 EQ occurred beneath the Ogasawara (Bonin) Islands on 30 May 2015 as depicted in Fig.2. It occurred at 680 km depth in an area without any known historical seismicity and caused significant shaking over a broad area of Japan at epicentral distances in the range 1000–2000 km. It was the first EQ felt in every Japanese prefecture since intensity observations began in 1884. This is the deepest EQ ever detected (https://www.nationalgeographic.com/science/article/deepest-earthquake-ever-detected-struck-467-miles-beneath-japan). and was also noted [48] that globally, this is the deepest (680 km centroid depth) event with 7.8 in the seismological records. The Ogasawara EQ has not been followed by an appreciably stronger EQ in contrast to the 7.8 Chichi-jima shallow EQ which occurred also at Bonin islands at 27.05oN 143.94oE on 22 December 2010, almost three months before the 9 Tohoku EQ. This could be understood as follows [35]: Upon the occurrence of the Chichi-jima EQ the following facts have been observed: First, according to Ref. [40] the complexity measures , and , i.e., the values at the natural time window lengths (scales) = 2000, 3000 and 4000 events, respectively, show a strong abrupt increase in Fig. 7 of Ref. [40] on 22 December 2010 and just after the EQ occurrence exhibiting a scaling behavior of the form (where the exponent is very close to and is approximately 0.2 days after the EQ occurrence), which conforms to LSW. Second, the order parameter fluctuations showed a unique change [46], i.e., an increase , which exhibits a functional form consistent with the LSW theory and the subsequent work of Penrose et al. [47] obeying the interrelation , see Fig. 2(g) and (h) of Ref.[46]. Such a behavior has not been observed along with the occurrence of either the Ogasawara EQ or any other shallow EQs in Japan of magnitude 7.6 or larger during the period from 1 January 1984 to the time of the 9 Tohoku EQ [46] (including also the EQ that occurred on 1 January 2024 discussed later).
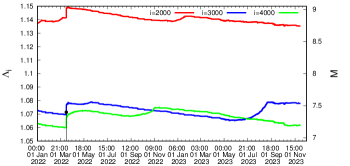
An additional important fact is the following: On 27 October 2022, the curve corresponding to the scale events (green) intersects the one for the scale (blue), but the latter on 27 June 2023 recovers (see Fig.4). This phenomenon has been followed very carefully -since it started as described in Ref. [49]- compared to the one that preceded the 9 Tohoku EQ (Fig. 5).
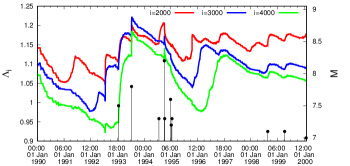
III.3 Results from 1 January 1990 until 1 February 2000
In the relevant plot (Fig.3), we observe that mostly the curve corresponding to the scale events lies in the highest level, the curve events in the middle and the curve events in the lowest level. There exists, however, the following interesting intersection: Around 8 March 1993 the curve events jumps to the highest level and remains so until 24 July 1994; subsequently the curve events returns to the highest level and after that a 8.2 EQ occurs on 4 October 1994. This is an additional case where a major EQ happens after the detection of an intersection of curves.
IV Discussion
An EQ of JMA magnitude =7.6 (USGS reported , see, e.g., https://earthquake.usgs.gov/earthquakes/eventpage/us6000m0xl) with epicenter at 37.50oN 137.27oE occurred on the west coast of Japan on 1 January 2024, i.e., almost 3 weeks after drawing attention in Ref.[49] to the important fact focused on the phenomenon described in the last 7 lines of Section III.B along with Fig.4. Referring to the intersection mentioned there, i.e., the curve corresponding to the scale =4000 events (green) intersects the one for the scale =3000 (blue), the following comments are now in order: First, the two EQs of magnitude close to 8, i.e., the 2003 Tokachi EQ (see Fig.1) and the 2015 Ogasawara EQ (see Fig.2), have not been preceded by an intersection (see also Fig.2 where the green curve approaches -but not intersects- the blue curve). Second, concerning the 8.2 EQ in 1994 -exceeding the aforementioned two EQs of magnitude close to 8- there exists an intersection, however, since the curve events in Fig.3 jumps to the highest level and an intersection occurs with the curve events (red) around 8 March 1993. In other words, before 27 October 2022 the only intersection between the curves corresponding to the scales and events was observed before the Tohoku 9 EQ, see Section III.A. Thus the phenomenon emerged in Fig.4 and mentioned in the last lines of Section III.B has only appeared before the Tohoku 9 EQ as can be visualized in the lower panel of Fig.5 -which is just an excerpt of Fig.1- showing the following sequence before the Tohoku mainshock: (a)for several months (i.e., approximately 14.5 months from 25 October 2008 to 10 January 2010) the events curve slightly exceeded the curve (which actually occurred in the aforementioned 2023 case) and (b)subsequently the curve recovered for approximately 7 months (from 10 January 2010 to 5 August 2010). Then, a clear intersection occurs on around 5 August 2010 and the events curve starts to increase more rapidly until 22 December 2010 when a 7.8 EQ occurred. Almost two weeks later an SES activity started (with a duration of around 10 days) and almost two months later the 9 Tohoku mainshock occurred. In short, the aforementioned comments shed more light on why the phenomenon in 2023 -depicted in Fig.4 and Fig.5 (upper panel)- has been, followed very carefully as mentioned in Ref.[49] by comparing to the one that preceded the 9 Tohoku EQ.
We now proceed to the estimation of the statistical significance of the observed phenomenon. As mentioned above on 8 March 1993, i.e., 19 months before the East-Off Hokaido 8.2 EQ on 4 October 1994, exceeded for the first time. A similar phenomenon concerning exceeding occurred on 14 June 2008, i.e., 32 months before the 9 Tohoku EQ on 11 March 2011, see Section III.1. Thus, assuming that an alarm is set ON when such intersections occur, we find that for the time period from 1 January 1990 to 1 January 2022 consisting of 384 months the probability to have the alarm ON is %. Obviously, the -value to hit by chance both EQs of magnitude 8.2 or larger is %, which points to statistical significance of the phenomenon observed. We clarify that the present calculation of the statistical significance does not include the period depicted in Fig.4 because the intersection displayed after 1 January 2022 is still under investigation, as already mentioned in Section III.2.
V Summary and Conclusions
Let us summarize: is a complexity measure in NTA quantifying the fluctuations of the entropy change under time-reversal. Studying the evolution of curves for the seismicity of Japan during the last 39 years for various scales 2000 to 4000 events), we find that intersections of these curves occurred before the two strongest EQs (exceeding 8), i.e., the 9 Tohoku EQ on 11 March 2011 and the East-Off Hokaido 8.2 EQ on 4 October 1994. The same phenomenon is ascertained (by an inspection of Fig. 8.17(a) of Ref.[27]) before the deadly Chiapas 8.2 EQ, which is Mexico’s largest EQ in more than a century.
References
- Carlson et al. [1994] J. M. Carlson, J. S. Langer, and B. E. Shaw, Dynamics of earthquake faults, Rev. Mod. Phys. 66, 657 (1994).
- Holliday et al. [2006] J. R. Holliday, J. B. Rundle, D. L. Turcotte, W. Klein, K. F. Tiampo, and A. Donnellan, Space-time clustering and correlations of major earthquakes, Phys. Rev. Lett. 97, 238501 (2006).
- Varotsos et al. [2011] P. A. Varotsos, N. V. Sarlis, and E. S. Skordas, Natural Time Analysis: The new view of time. Precursory Seismic Electric Signals, Earthquakes and other Complex Time-Series (Springer-Verlag, Berlin Heidelberg, 2011).
- Huang [2008] Q. Huang, Seismicity changes prior to the Ms8.0 Wenchuan earthquake in Sichuan, China, Geophys. Res. Lett. 35, L23308 (2008).
- Huang [2011] Q. Huang, Retrospective investigation of geophysical data possibly associated with the Ms8.0 Wenchuan earthquake in Sichuan, China , Journal of Asian Earth Sciences 41, 421 (2011).
- Telesca and Lovallo [2009] L. Telesca and M. Lovallo, Non-uniform scaling features in central Italy seismicity: A non-linear approach in investigating seismic patterns and detection of possible earthquake precursors, Geophys. Res. Lett. 36, L01308 (2009).
- Lennartz et al. [2008] S. Lennartz, V. N. Livina, A. Bunde, and S. Havlin, Long-term memory in earthquakes and the distribution of interoccurrence times, EPL 81, 69001 (2008).
- Lennartz et al. [2011] S. Lennartz, A. Bunde, and D. L. Turcotte, Modelling seismic catalogues by cascade models: Do we need long-term magnitude correlations?, Geophys. J. Int. 184, 1214 (2011).
- Rundle et al. [2012] J. B. Rundle, J. R. Holliday, W. R. Graves, D. L. Turcotte, K. F. Tiampo, and W. Klein, Probabilities for large events in driven threshold systems, Phys. Rev. E 86, 021106 (2012).
- Turcotte [1997] D. L. Turcotte, Fractals and Chaos in Geology and Geophysics, 2nd ed. (Cambridge University Press, Cambridge, 1997).
- Varotsos and Alexopoulos [1984a] P. Varotsos and K. Alexopoulos, Physical Properties of the variations of the electric field of the Earth preceding earthquakes, I, Tectonophysics 110, 73 (1984a).
- Varotsos and Alexopoulos [1984b] P. Varotsos and K. Alexopoulos, Physical Properties of the variations of the electric field of the Earth preceding earthquakes, II, Tectonophysics 110, 99 (1984b).
- Varotsos et al. [1986] P. Varotsos, K. Alexopoulos, K. Nomicos, and M. Lazaridou, Earthquake prediction and electric signals, Nature (London) 322, 120 (1986).
- Varotsos and Lazaridou [1991] P. Varotsos and M. Lazaridou, Latest aspects of earthquake prediction in Greece based on Seismic Electric Signals, Tectonophysics 188, 321 (1991).
- Varotsos et al. [2003a] P. A. Varotsos, N. V. Sarlis, and E. S. Skordas, Electric fields that “arrive” before the time derivative of the magnetic field prior to major earthquakes, Phys. Rev. Lett. 91, 148501 (2003a).
- Sarlis and Varotsos [2002] N. Sarlis and P. Varotsos, Magnetic field near the outcrop of an almost horizontal conductive sheet, J. Geodynamics 33, 463 (2002).
- Varotsos [2005] P. Varotsos, The Physics of Seismic Electric Signals (TERRAPUB, Tokyo, 2005) p. p. 338.
- Varotsos et al. [2019a] P. A. Varotsos, N. V. Sarlis, and E. S. Skordas, Phenomena preceding major earthquakes interconnected through a physical model, Ann. Geophys. 37, 315 (2019a).
- Varotsos and Alexopoulos [1986] P. Varotsos and K. Alexopoulos, Thermodynamics of Point Defects and their Relation with Bulk Properties (North Holland, Amsterdam, 1986).
- Varotsos et al. [1993] P. Varotsos, K. Alexopoulos, and M. Lazaridou, Latest aspects of earthquake prediction in Greece based on Seismic Electric Signals,II, Tectonophysics 224, 1 (1993).
- Stanley [1999] H. E. Stanley, Scaling, universality, and renormalization: Three pillars of modern critical phenomena, Rev. Mod. Phys. 71, S358 (1999).
- Uyeda et al. [2009] S. Uyeda, T. Nagao, and M. Kamogawa, Short-term earthquake prediction: Current status of seismo-electromagnetics, Tectonophysics 470, 205 (2009).
- Varotsos et al. [2002a] P. A. Varotsos, N. V. Sarlis, and E. S. Skordas, Long-range correlations in the electric signals that precede rupture, Phys. Rev. E 66, 011902 (2002a).
- Varotsos et al. [2003b] P. A. Varotsos, N. V. Sarlis, and E. S. Skordas, Long-range correlations in the electric signals the precede rupture: Further investigations, Phys. Rev. E 67, 021109 (2003b).
- Varotsos et al. [2003c] P. A. Varotsos, N. V. Sarlis, and E. S. Skordas, Attempt to distinguish electric signals of a dichotomous nature, Phys. Rev. E 68, 031106 (2003c).
- Varotsos et al. [2001] P. A. Varotsos, N. V. Sarlis, and E. S. Skordas, Spatio-temporal complexity aspects on the interrelation between seismic electric signals and seismicity, Practica of Athens Academy 76, 294 (2001), http://physlab.phys.uoa.gr/org/pdf/p3.pdf.
- Varotsos et al. [2023a] P. A. Varotsos, N. V. Sarlis, and E. S. Skordas, Natural Time Analysis: The new view of time, Part II. Advances in Disaster Prediction using Complex Systems (Springer Nature Switzerland AG, Cham, 2023).
- Varotsos et al. [2002b] P. A. Varotsos, N. V. Sarlis, and E. S. Skordas, Seismic Electric Signals and Seismicity: On a tentative interrelation between their spectral content, Acta Geophys. Pol. 50, 337 (2002b), http://physlab.phys.uoa.gr/org/pdf/d35.pdf.
- Varotsos et al. [2005a] P. A. Varotsos, N. V. Sarlis, H. K. Tanaka, and E. S. Skordas, Similarity of fluctuations in correlated systems: The case of seismicity, Phys. Rev. E 72, 041103 (2005a).
- Sarlis et al. [2015a] N. V. Sarlis, E. S. Skordas, P. A. Varotsos, T. Nagao, M. Kamogawa, and S. Uyeda, Spatiotemporal variations of seismicity before major earthquakes in the Japanese area and their relation with the epicentral locations, Proc. Natl. Acad. Sci. USA 112, 986 (2015a).
- Varotsos et al. [2005b] P. A. Varotsos, N. V. Sarlis, H. K. Tanaka, and E. S. Skordas, Some properties of the entropy in the natural time, Phys. Rev. E 71, 032102 (2005b).
- Varotsos et al. [2007] P. A. Varotsos, N. V. Sarlis, E. S. Skordas, and M. S. Lazaridou, Identifying sudden cardiac death risk and specifying its occurrence time by analyzing electrocardiograms in natural time, Appl. Phys. Lett. 91, 064106 (2007).
- Sarlis et al. [2015b] N. V. Sarlis, S.-R. G. Christopoulos, and M. M. Bemplidaki, Change of the entropy in natural time under time reversal: Complexity measures upon change of scale, EPL 109, 18002 (2015b).
- Sarlis et al. [2013] N. V. Sarlis, E. S. Skordas, P. A. Varotsos, T. Nagao, M. Kamogawa, H. Tanaka, and S. Uyeda, Minimum of the order parameter fluctuations of seismicity before major earthquakes in Japan, Proc. Natl. Acad. Sci. USA 110, 13734 (2013).
- Varotsos et al. [2021] P. A. Varotsos, N. V. Sarlis, E. S. Skordas, T. Nagao, and M. Kamogawa, The unusual case of the ultra-deep 2015 Ogasawara earthquake (MW7.9): Natural time analysis, EPL 135, 49002 (2021).
- Tanaka et al. [2004] H. K. Tanaka, P. A. Varotsos, N. V. Sarlis, and E. S. Skordas, A plausible universal behaviour of earthquakes in the natural time-domain, Proc. Jpn. Acad. Ser. B Phys. Biol. Sci. 80, 283 (2004).
- Kanamori [1978] H. Kanamori, Quantification of earthquakes, Nature 271, 411 (1978).
- Lifshitz and Slyozov [1961] I. Lifshitz and V. Slyozov, The kinetics of precipitation from supersaturated solid solutions, Journal of Physics and Chemistry of Solids 19, 35 (1961).
- Wagner [1961] C. Wagner, Theorie der alterung von niederschlägen durch umlösen (ostwald-reifung), Zeitschrift für Elektrochemie, Berichte der Bunsengesellschaft für physikalische Chemie 65, 581 (1961).
- Varotsos et al. [2018] P. A. Varotsos, N. V. Sarlis, and E. S. Skordas, Tsallis Entropy Index q and the Complexity Measure of Seismicity in Natural Time under Time Reversal before the M9 Tohoku Earthquake in 2011, Entropy 20, 757 (2018).
- Tsallis [1988] C. Tsallis, Possible generalization of Boltzmann-Gibbs statistics, J. Stat. Phys. 52, 479 (1988).
- Sarlis et al. [2018] N. V. Sarlis, E. S. Skordas, and P. A. Varotsos, A remarkable change of the entropy of seismicity in natural time under time reversal before the super-giant M9 Tohoku earthquake on 11 March 2011 , EPL 124, 29001 (2018).
- Olami et al. [1992] Z. Olami, H. J. S. Feder, and K. Christensen, Self-organized criticality in a continuous, nonconservative cellular automaton modeling earthquakes, Phys. Rev. Lett. 68, 1244 (1992).
- Ramos et al. [2006] O. Ramos, E. Altshuler, and K. J. Måløy, Quasiperiodic events in an earthquake model, Phys. Rev. Lett. 96, 098501 (2006).
- Burridge and Knopoff [1967] R. Burridge and L. Knopoff, Model and theoretical seismicity, Bull. Seismol. Soc. Am. 57, 341 (1967).
- Varotsos et al. [2019b] P. A. Varotsos, N. V. Sarlis, and E. S. Skordas, Natural time analysis: Important changes of the order parameter of seismicity preceding the 2011 M9 Tohoku earthquake in Japan , EPL 125, 69001 (2019b).
- Penrose et al. [1978] O. Penrose, J. L. Lebowitz, J. Marro, M. H. Kalos, and A. Sur, Growth of clusters in a first-order phase transition, Journal of Statistical Physics 19, 243 (1978).
- Ye et al. [2016] L. Ye, T. Lay, Z. Zhan, H. Kanamori, and J.-L. Hao, The isolated 680 km deep 30 May 2015 Mw 7.9 Ogasawara (Bonin) Islands earthquake, Earth and Planetary Science Letters 433, 169 (2016).
- Varotsos et al. [2023b] P. A. Varotsos, T. Nagao, and N. V. Sarlis, A complexity measure identifying the accumulation of stresses before major earthquakes (2023b), arXiv:2312.02900v1 (5 Dec 2023) [physics.geo-ph] .