Capillary driven flows in the absence of gravity
Abstract
This work investigates the capillary rise dynamics of highly wetting fluid in a divergent U-tube in microgravity conditions. This configuration produces a capillary-driven channel flow. We use image recording in backlight illumination to characterize the interface dynamics and dynamic contact angle of HFE7200 and Di-Propylene Glycol. For the case of HF7200, we complement the interface measurements with Particle Tracking Velocimetry (PTV) to characterize the velocity fields underneath the moving meniscus. In the experiments with Di-propylene Glycol, the liquid column reaches different heights within various experiments, and the measurements show a sharp reduction of the meniscus curvature when the contact line moves from a pre-wet to a dry substrate. In experiments with HFE7200, the interface always moves on a pre-wet surface. Yet a curvature reduction is observed due to the inertial forces on the underlying accelerating flow. The PTV measurements show that the distance from the interface within which the velocity profile adapts to the meniscus velocity shortens as the interface acceleration increases.
keywords:
Capillary flows, Contact lines, Wetting and wicking1 Introduction
The capillary behaviour of a liquid results from the shape of the gas-liquid interface and the wetting interaction with the solid substrate. The dynamic contact angle formed by the interface with the substrate models this interaction and sets the boundary condition at the substrate for any model of the interface shape.
Early investigations (Voinov (1976); Kistler (1993)) showed that the dynamic contact angle depends on the hydrodynamics of the flow near the contact line and the capillary number: Ca (with , the liquid’s dynamic viscosity and gas-liquid surface tension and the velocity of the interface’s contact line with the substrate). These studies are primarily based on the assumption of a steady, two-dimensional, viscous-dominated flow near the contact line. Recent work seeks to extend the description of capillary-driven flows to more general scenarios where gas-liquid interfaces are dominated by inertial forces (Varma et al. (2021); Fiorini et al. (2022, 2023c)). These investigations show the impact of the flow further away from the contact line on the interface shape and its motion. Levine et al. (2015) analyzes capillarity and dynamic contact angle in the absence of gravity, where the motion of the gas-liquid interface primarily results from the balance of capillary and inertial forces. To this end, the capillary dynamics of fluids for micro-gravity applications are investigated using prototype test cases such as the capillary rise in tubes and micro-gravity platforms. Among these studies, the pioneering investigations by Stange et al. (2003) and Gerstmann & Dreyer (2007) characterized the capillary rise of various highly wetting liquids in a drop tower. These studies compare the capillary rise with a theoretical model based on the dynamic contact angle correlation provided by Jiang et al. (1979) and demonstrate that the interface is spherical under microgravity conditions. However, no direct measurement of the contact angle was reported, and the characterization of the gas-liquid interface was limited to qualitative evaluation of video recordings.
In this work, we extend the previous experimental studies on capillary flow under microgravity conditions with three main contributions. First, we present detailed measurements of the gas-liquid interface evolution, allowing to retrieve the evolution of the dynamic contact angle and thus analyze its relation to the contact-line velocity and acceleration. Second, we complement the interface characterization with image velocimetry underneath the interface to analyze the interaction between velocity fields and interface shape. Finally, we conducted our experiments in a novel configuration, which we refer to as the Divergent U-tube (DUT) and a parabolic flight platform. Compared to the experiments in Stange et al. (2003), this configuration offers a longer microgravity phase while at the same time allowing much larger accelerations than those observed in capillary experiments on ground. Moreover, it offers the advantages of a U-tube configuration (Fricke et al., 2023), namely avoiding the challenges in modeling the entrance effect and allowing for deriving much simpler reduced order models (Fiorini et al., 2023b).
This short communication extends the preliminary results in Fiorini et al. (2023a) by adding new experiments, a second fluid, and a more advanced characterization of the velocity fields.
2 Methodology
The DUT configuration and the experimental set-up are shown in Figure 1, together with sample images from the recording in back-lighting and image velocimetry acquisitions. The DUT (picture Figure 1a) consists of a U-shaped tube in which the radius grows linearly in the streamwise direction (see schematics in Figure 1d and 1e). Once microgravity is produced, the different sizes and the divergence of the tube produced an unbalanced capillary force which makes the liquid rise on the side with smaller diameter.
The radius of the tube is constant on the bottom part, where the axis of the tube bends by . The tube is partially filled with a liquid of volume , delimited by the two interfaces and with the radial coordinate. We denote with and the spatially averaged interface position of the two interfaces along . Referring to Figure 1e, we define the interface shape and its spatial average shifted so that corresponds to the initial position. The assembly is installed on a breadboard containing the entire equipment (Figure 1c). The ullage volume is closed by a flexible connection (not shown in Figure 1), which allows for achieving fully saturated conditions before the experiments begin. Monitoring the over-pressure in the ullage gas and assessing that this equals the saturation pressure of the fluid at the corresponding temperatures allows to rule out the effect of evaporation.
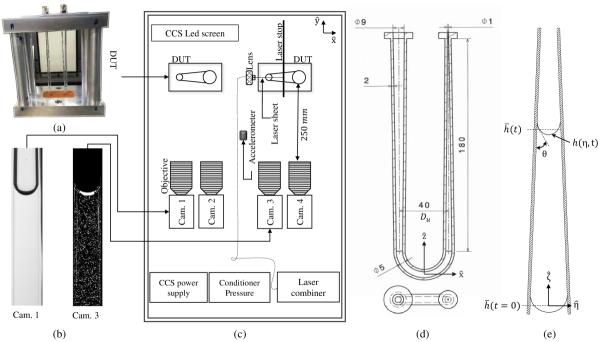
Two experiments were performed in parallel, with four cameras acquiring grey-scale images at 300 fps on each side of the two tubes. All cameras mount objectives with 105mm focal lenses and are positioned to acquire the entire gas-liquid interface while spanning the largest possible tube length. The scaling factor of all images is pixel/mm.
Two visualization techniques were employed separately. The first technique is high speed visualization in backlighting conditions and is carried out using a LED screen behind the DUTs. This technique allows to characterize the shape of the gas-liquid interface with the highest possible resolution during the full capillary rise. Two fluids have been analyzed in this configuration: HFE7200 and Di-Propylene Glycol (DPG). The relevant liquid properties are reported in Table 1.
The second visualization technique is Particle Tracking Velocimetry (PTV), aimed at characterizing the velocity field near the gas-liquid interface in the smaller side of the tube. This acquisition was carried out only for the HFE7200 due to time constraints. The illumination for this technique is provided by a laser sheet on one side of the tube. The liquid was seeded with FMR-1.3 1-5 Red Fluorescent Miscospheres from Cospheric. The impact of the particles on the fluid properties was analyzed on ground in classic capillary-rise experiments and was found to be negligible.
| density | dynamic viscosity | surface tension | static contact angle | |
|---|---|---|---|---|
| HFE7200 | 1423.00 | 0.64 | mN/m | |
| Di-propylene glycol | 1022.18 | 62.54 | mN/m |
The experiments were carried out in the 78th ESA parabolic flight campaign. Each experiment starts with the announcement of the plane being at inclination. Shortly after, the gravity levels drop from approximately 1.8 to approximately 0. The recordings are pre-processed by compensating for the vibrations of the camera objective (as in Fiorini et al. (2023a)) and optical distortions due to light refraction (as in Fiorini et al. (2022)). The PTV images are pre-processed using the POD-based background removal introduced by Mendez et al. (2017) while the PTV interrogation was carried out using the Tractrac processing tool (Heyman, 2019). A dynamic Region of Interest (DROI) for the processing was identified by performing a gradient-based edge detection on the POD-filtered images to detect the gas-liquid interface and computing the average velocity (see Fiorini et al. (2023a); Ratz et al. (2023)). Nevertheless, the PTV acquisitions do not allow for precise detection of the gas-liquid interface, which is carried out solely from the recordings in backlight configuration.
The PTV measurements were enhanced using the constrained Radial Basis Function approach developed by Sperotto et al. (2022) and released in the open-source software SPICY (Sperotto et al., 2023). The regression was carried out on an ensemble of three consecutive frames to increase the vector density.
3 Results
3.1 Capillary rise
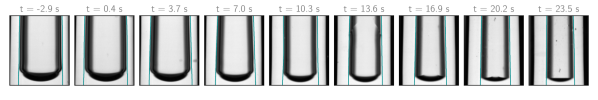
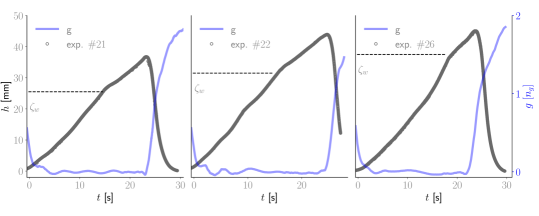
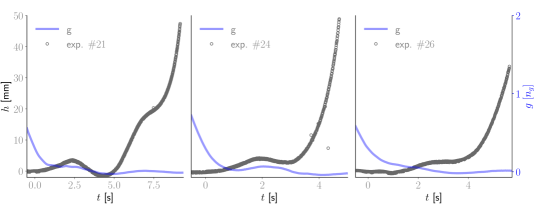
Figure 2(a) presents snapshots at several interface positions along the tube’s axis recorded during the capillary rise experiments with DPG. The time is set when the vertical acceleration profile drops below , with . Figure 2(b) shows the capillary rise of DPG for three experiments and the envelope of gravitational acceleration along the z-axis for each experiment, based on the axis convention of Figure 1. The gas-liquid interface rises slowly along the tube’s axis, remaining within the camera’s field of view. A sharp reduction of the interface curvature occurs after crossing the position . This condition occurs at for exp. , at for and at for . Crossing this position produces a visible change of the interface shape as illustrated in the snapshots of Figure 2(a) between s and s. Figure 2(b) reveals a change in the capillary rise profile’s slope at and a higher final interface position with each rise. Correspondingly, the value of increases over time.
This behaviour is due to a residual film of DPG covering part of the inner surface of the tube. This makes the interface advance over a pre-wetted portion of the tube, which increases at each run, as shown by the dashed line in Figure 2(b). For , the capillary rise evolves over a dry surface with a significant increase in contact angle and reduction in the interface curvature. Figure 2(b) illustrates how the pre-wetted height of the tube increases with the number of repetitions. The snapshot at s captures the transition between the pre-wetted and dry surfaces.
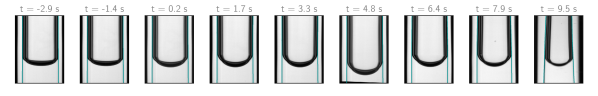
Figures 3(a) and 3(b) present the same analysis for experiments conducted with HFE7200. In this case, a separation between “wet” and “dry” surface regions could not be identified. However, the wetting behaviour of the fluid suggests a “pre-wet” solid surface throughout the entire capillary rise experiment. Comparing to the viscous DPG, Figure 3(b) illustrates that the capillary rise of HFE7200 is heavily dependent on the vertical acceleration profile specific to the parabolic maneuver performed by the plane. Common features are observed in all experiments. As the vertical acceleration decreases, the capillary rise does not start immediately. Instead, the interface exhibits one or more oscillations until gravity levels drop to about . Then, the capillary rise is initiated, and the interface accelerates continuously until it leaves the camera’s field of view. In the case of HFE7200, the interface flattens at the latest stages of the experiment, as shown by the frames in Figure 3(a). This condition is addressed to the interface acceleration and is later analysed using PTV.
3.2 Interface shape and contact angle
Figure 4 presents a comparison between the interface shapes of DPG (Figure 4(a)) and HFE7200 (Figure 4(b)), along with the results of the regression with two interface models at various time steps during the experiment. The plots show both the regression with the spherical cap on the right side and a Support Vector Regression (SVR) (Platt (1999)) with RBF kernels on the left side. Remarkably, both fluids maintain a spherical shape throughout the entire microgravity phase, even when the interface flattens due to the different dynamics previously discussed for DPG and HFE7200. Therefore, the interface shape can be described given the tube radius and the dynamic contact angle. On the other hand, the SVR with RBF kernels allows identifying spatial scales of the order of mm as the smallest that allows describing the interface shape.
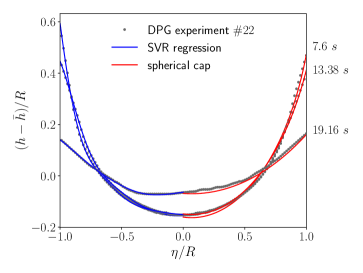
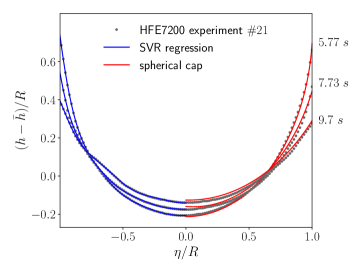
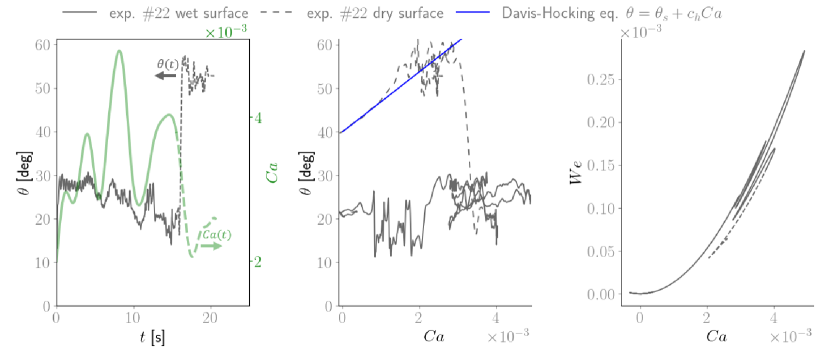
Figure 5 compares the interface contact angle obtained by extrapolating the SVR model to the solid surface with the capillary number for the experiment with DPG. The other runs exhibit similar behaviour. The experimental points are distinguished with different line styles associated with the different wetting conditions of the tube. In Figure 5a, the transition from the wetted (solid line) to the dry region (dashed line) is evident, accompanied by a sharp increase of the contact angle. Figure 5b shows the contact angle decreasing during the capillary rise on the wetted surface. No clear correlation with the capillary number, i.e. the contact-line velocity, is observed. On the other hand, in the dry region, the contact angle exhibits a linear relationship with the capillary number, as hypothesized by Davis (1980) and Hocking (1987) and shown by the dark blue line in Figure 5b. The same relationship was also observed by Xia & Steen (2018) and Fiorini et al. (2023c). Figure 5c plots the Weber number at the interface, computed as , and the capillary number. The different trajectories for interface motion along ”dry” and ”pre-wet” surfaces are visible, with the first characterized by a slower interface for the same tube radius.
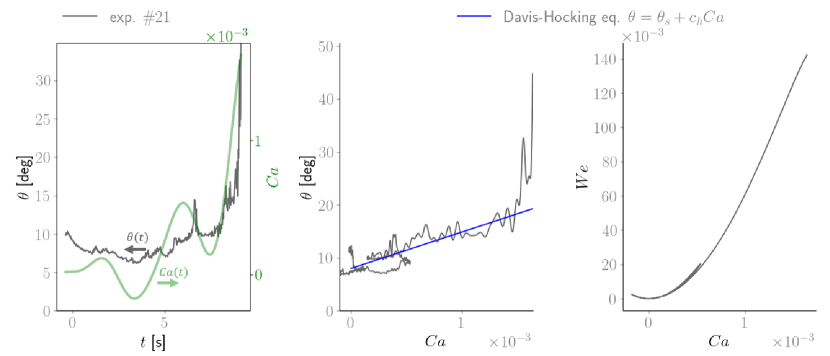
In Figure 6, the same analysis is presented for the experiment with HFE7200. Figure 6a shows the dynamic contact angle initially decreases, analogously to the case of DPG, then increases rapidly at the latest stages of the capillary rise. From a different perspective, Figure 6b shows that the linear relationship between the contact angle and the capillary number changes after where the Weber number exceeds . In the case of HFE7200, the rapid reduction of interface curvature is addressed to its sudden acceleration. The next section analyzes this dynamics with the PTV measurements. The plane of in Figure 6c shows that the experiment with HFE7200 approximately follows the same curve throughout the observation period, given the absence of a transition between ”wet” and ”dry” regions.
(a)
(b)
(c)
(a)
(b)
(c)
3.3 Flow dynamics in the vicinity of the interface
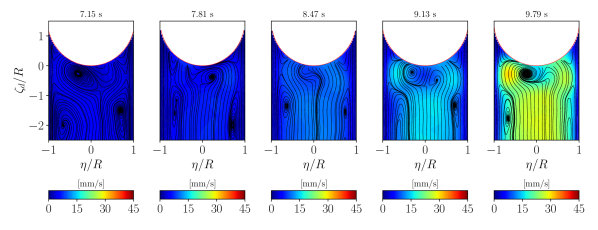
To examine the velocity field near the liquid interface, we use the test case introduced in Fiorini et al. (2023a), where the capillary rise of HFE7200 seeded with fluorescent polymer particles was presented, and a parabolic velocity profile was shown at distances from the interface greater than 2 mm. Figure 7 shows the position of the interface for the considered test case analogously to the experiments illustrated by Figure 3(b). In this analysis, we focus on the velocity field within 2 mm below the interface and introduce a reference frame moving with the velocity of the meniscus and with . Figure 8 displays the velocity fields in this region in terms of absolute magnitude and the flow streamlines computed using the moving reference frame. The red curve represents the detected interface within each image.
Figure 8 illustrates both the presence of counter-rotating vortices underneath the interface, akin to configurations observed by Dussan E. B. V. Davis (1974) and Ratz et al. (2023), and larger re-circulation zones at a further distance. In the reference frame moving with the interface, the meniscus is slower than the fluid along the centerline. As a result, the interface behaves as an obstacle: the fluid must decelerate and move towards the contact line, producing the swirling motion depicted by the streamlines in Figure 8.
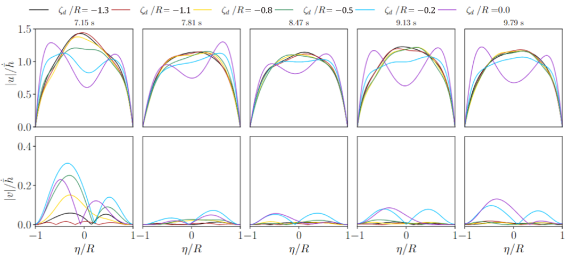
Regarding the streamwise and radial velocity profiles, indicated as and , respectively, Figure 9 illustrates their variation for decreasing distances from the meniscus, . Both quantities are made dimensionless with respect to the meniscus velocity . At low interface accelerations ( s), the streamwise velocity profile at from the interface is relatively flat, with the centerline velocity decreasing as it moves towards the interface. At larger accelerations ( s), the parabolic profile appears closer to the interface. The shape of the velocity profile changes gradually from the parabolic shape at to an approximately square profile at and finally accelerating towards the contact line at the bottom of the interface (). For , the radial velocity component can be considered flat compared to the streamwise velocity.
Closer to the interface, we observe the flow increasing velocity towards the side of the tube. This is necessary to adapt the shape of the streamwise velocity profile to the uniform velocity of the meniscus. A local maximum of the profile can be localized at the positions . However, the radial profile tends to lose axial symmetry at short distances from the interface. At the latest stage of the capillary rise, when the interface velocities increase, the radial profile progressively flattens compared to the cases at lower interface velocities.
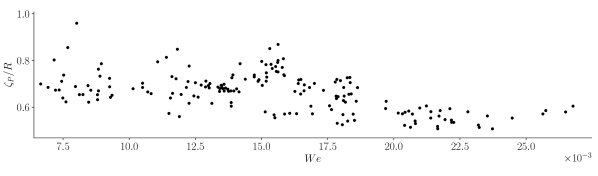
The progressive reduction of the distance at which the streamwise velocity profile ceases to be parabolic can be correlated with the increase of contact angle for the high Weber number discussed in the previous section. This can be characterized with the degree of parabolicity defined as:
| (1) |
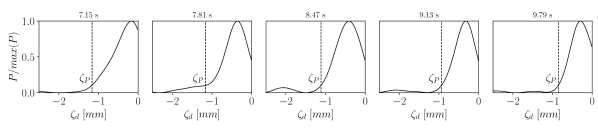
where corresponds to the theoretical parabolic velocity profile. Figure 10 shows the evolution of the -norm of , indicated with , normalized with its maximum along the axis of the tube. We define a distance at which exceeds the standard deviation from the average far from the interface ( mm), rounded to . The figure shows that after the difference with the parabolic profile increases rapidly, leading to a peak near the interface. The figure also shows the value of gradually reducing with time. Figure 11 shows the evolution of against . For increasing , reduces. At higher , we expect a deformation of the interface shape due to the inertial forces produced by the velocity deceleration. This explains the rapid increase of the contact angle observed in Figure 6.
4 Concluding remarks
This work investigated the capillary-driven flow of HFE7200 and Di-Propylene Glycol in microgravity conditions. The experiments combined backlighting and image processing for interface tracking and PTV for velocimetry. The experiments showed that, despite the different conditions, liquid properties, and wetting behaviour the shape of the interface remains spherical and can be fully described by its dynamic contact angle. This was shown to be a linear function of the capillary number unless the liquid inertia became dominant. In the case of Di-Propylene Glycol, the flow strongly depends on whether the surface is dry or pre-wet resulting in different speeds. In the case of HFE7200, where inertia quickly becomes predominant, the correlation between contact angle evolution and contact-line velocity is less evident. At the largest contact-line velocities, inertia tends to increase the contact angle and flatten the interface. The PTV measurements show that inertial forces are produced as the liquid at the centre of the channel becomes faster than the meniscus and exerts a dynamic pressure on the interface.
References
- Davis (1980) Davis, S. H. 1980 Moving contact lines and rivulet instabilities. part 1. the static rivulet. Journal of Fluid Mechanics 98 (2), 225–242.
- Dussan E. B. V. Davis (1974) Dussan E. B. V. Davis, S. H. 1974 On the motion of a fluid-fluid interface along a solid surface. Journal of Fluid Mechanics 65 (1), 71–95.
- Fiorini et al. (2023a) Fiorini, D., Carbonnelle, L., Simonini, A., Steelant, J., Seveno, D. & Mendez, M. A. 2023a Characterization of a capillary driven flow in microgravity by means of optical technique. Multiphase Science and Technology .
- Fiorini et al. (2023b) Fiorini, D., Mendez, M. A., Seveno, D. & Gosset, A. 2023b On the capillary rise of cryogenic liquids in microgravity: numerical analysis and experiments. In Proceedings of 10th European Conference for Aeronautics and Space Sciences. EUCASS.
- Fiorini et al. (2022) Fiorini, D., Mendez, M. A., Simonini, A., Steelant, J. & Seveno, D. 2022 Effect of inertia on the dynamic contact angle in oscillating menisci. Physics of Fluids 34 (10), 102116.
- Fiorini et al. (2023c) Fiorini, D., Simonini, A., Steelant, J., Seveno, D. & Mendez, M. A. 2023c Dynamic wetting experiments with nitrogen in a quasi-capillary tube. Accepted in Physical Review Fluids .
- Fricke et al. (2023) Fricke, M., Raju, S., von Klitzing, R., De Coninck, J. & Bothe, D. 2023 An analytical study of capillary rise dynamics: Critical conditions and hidden oscillations. Physica D: Nonlinear Phenomena 455, 133895.
- Gerstmann & Dreyer (2007) Gerstmann, J. & Dreyer, M. E. 2007 The dynamic contact angle in the presence of a non-isothermal boundary condition. Microgravity Science and Technology 19, 96–99.
- Heyman (2019) Heyman, J. 2019 Tractrac: A fast multi-object tracking algorithm for motion estimation. Computers & Geosciences 128, 11–18.
- Hocking (1987) Hocking, L.M. 1987 The damping of capillary–gravity waves at a rigid boundary. Journal of fluid mechanics 179, 253–266.
- Jiang et al. (1979) Jiang, T.-S., Soo-Gun, O.H. & Slattery, J. C. 1979 Correlation for dynamic contact angle. Journal of Colloid and Interface Science 69 (1), 74–77.
- Kistler (1993) Kistler, S. F. 1993 Hydrodynamics of wetting. In Wettability (ed. John Berg), chap. 6, pp. 311–430. New York: Marcel Dekker, New York.
- Levine et al. (2015) Levine, D., Wise, B., Schulman, R., Gutierrez, H., Kirk, D., Turlesque, N., Tam, W., Bhatia, M. & Jaekle, D. 2015 Surface tension and contact angle analysis with design of propellant measurement apparatus. Journal of Propulsion and Power 31 (1), 429–443.
- Mendez et al. (2017) Mendez, M.A., Raiola, M., Masullo, A., Discetti, S., Ianiro, A., Theunissen, R. & Buchlin, J-M 2017 Pod-based background removal for particle image velocimetry. Experimental Thermal and Fluid Science 80, 181–192.
- Platt (1999) Platt, J. 1999 Probabilistic outputs for support vector machines and comparisons to regularized likelihood methods. Advances in large margin classifiers 10 (3), 61–74.
- Ratz et al. (2023) Ratz, M., Fiorini, D., Simonini, A., Cierpka, C. & Mendez, M. A. 2023 Analysis of an unsteady quasi-capillary channel flow with time-resolved piv and rbf-based super-resolution. Journal of Coatings Technology and Research 20 (1), 27–40.
- Sperotto et al. (2022) Sperotto, P., Pieraccini, S. & Mendez, M. A. 2022 A meshless method to compute pressure fields from image velocimetry. Measurement Science and Technology 33 (9), 094005.
- Sperotto et al. (2023) Sperotto, P., Ratz, M. & Mendez, M. A. 2023 Spicy: a python toolbox for meshless assimilation from image velocimetry using radial basis functions. Accepted in Journal of Open Source Software .
- Stange et al. (2003) Stange, M., Dreyer, M. E. & Rath, H. J. 2003 Capillary driven flow in circular cylindrical tubes. Physics of fluids 15 (9), 2587–2601.
- Varma et al. (2021) Varma, A., Roy, A. & Puthenveettil, B. A. 2021 Inertial effects on the flow near a moving contact line. Journal of Fluid Mechanics 924, A36.
- Voinov (1976) Voinov, O.V. 1976 Hydrodynamics of wetting. Fluid dynamics 11 (5), 714–721.
- Xia & Steen (2018) Xia, Y. & Steen, P. H. 2018 Moving contact-line mobility measured. Journal of Fluid Mechanics 841, 767–783.