Airdrops: Giving Money Away Is Harder Than It Seems
Abstract.
Airdrops are used by blockchain applications and platforms to attract an initial user base, and to grow the user base over time. In the case of many airdrops, tokens are distributed to select users as a “reward” for interacting with the underlying platform, with a long-term goal of creating a loyal community that will generate genuine economic activity well after the airdrop has been completed. Although airdrops are widely used by the blockchain industry, a proper understanding of the factors contributing to an airdrop’s success is generally lacking.
In this work, we outline the design space for airdrops, and specify a reasonable list of outcomes that an airdrop should ideally result in. We then analyze on-chain data from several larger-scale airdrops to empirically evaluate the success of previous airdrops, with respect to our desiderata. In our analysis, we demonstrate that airdrop farmers frequently dispose of the lion’s share of airdrops proceeds via exchanges. Our analysis is followed by an overview of common pitfalls that common airdrop designs lend themselves to, which are then used to suggest concrete guidelines for better airdrops.
1. Introduction
Blockchain platforms commonly create reward schemes to lure new customers and maintain the loyalty of existing users. In recent years, giving platform-minted tokens to users, or airdropping tokens, has proven itself as a particularly popular scheme (Makridis et al., 2023). Although the use of airdrops is prevalent in the blockchain world, we present preliminary findings showing there is no significant correlation between performing an airdrop and a platform’s popularity relative to available alternatives. Intuitively, this is not optimal, and may result in wasting funds that can be used to improve the Quality-of-Service (QoS)offered by the platform.
While the basic premise of airdrops is relatively straightforward, the design space for such reward schemes is large, and may depend on the characteristics of the platform designing the airdrop. For example, some airdrop mechanisms target power-users and endow them with a generous amount of rewards in the hopes that these users will generate valuable economic activity, and thus attract other users as well.
To understand why previous airdrops did not always achieve their goals and to quantify their success, we first articulate a set of reasonable desired outcomes for airdrops. Armed with a basic desiderata, we then go over previous airdrops, see how they measure up, and uncover some interesting insights in the process. Specifically, we analyze the data pertaining to four recent airdrops and conclude that the majority of proceeds (as high as 95%, typically only within a couple of transfer steps) have been sold via exchanges, implying that the airdrops fall short of their intended purpose and benefit mostly airdrop farmers as opposed to regular users. This comparison is followed by a description of common pitfalls faced by airdrops in the past. Given that the blockchain ecosystem is still quite young, it is to be expected that the theory and practice of blockchain airdrops is still in its infancy, and thus that previous airdrops may have not been entirely successful. Finally, we use our analysis to suggest potential ways to create better airdrop mechanisms which are more fair to honest users.
1.1. Contributions
Arbitrum study. We perform a comprehensive case study of the Arbitrum (Kalodner et al., 2018) airdrop by measuring elements such as transaction volume, token, distribution structure, and token value before and after the airdrop period.
Quantitative analysis. We quantitatively analyze airdrops executed by ENS (ENS, 2023), dYdX (Juliano, 2018), Gemstone (Haig, 2023; lingland09, 2023), and 1inch (Bukov and Melnik, 2020). We show that most of the funds received through these airdrops are sold on exchanges, instead of being used to create dapp or platform engagement on the part of end-users.
Qualitative analysis. We qualitatively analyze previous airdrops, and propose guidelines for developing future airdrops in an effort to avoid some of the pitfalls in the airdrops we analyze.
2. Airdrop Desiderata
Airdrops are typically used to bootstrap a community of users. We break down this overarching high-level goal into multiple sub-goals. These sub-goals are not necessarily orthogonal, and furthermore, there may be others that are worthwhile to pursue; we focus on them as they serve to illustrate interesting issues faced by common airdrop mechanisms.
1. Attract users in the short-term. Historically, airdrops were used by new blockchain platforms to create an initial user base. In particular, decentralized platforms commonly become more useful and attractive to users as a function of the amount of economic activity taking place.
2. Foster long-term involvement. Bootstrapping an initial base of users is important, but not enough for sustaining a high degree of economic activity over time. Ideally, platform users should become regular, everyday users. This can be achieved by issuing rewards that can only be used within the platform, similarly to frequent-flyer points. For example, in layer 2 blockchains (L2s) (Sguanci et al., 2021), one may award discounts on future transactions. Other measures that may help are having multiple airdrops, and rewarding users who perform “quests” that expose them to all that the platform has to offer. For example, Linea’s airdrop quests gave users an in-depth tour of the platform’s various features and use-cases (Labs, 2023a).
3. Target value-creating users. An airdrop should ideally focus on users who can contribute the most to the long-term sustainability of the platform. In the context of platforms that rely on user-based liquidity provisioning, this may refer to users who provide the most liquidity to lending pools (Yaish et al., 2022) and decentralized exchanges (DEXs) (Yaish et al., 2023), or across a variety of tokens. In rollups, one may consider so-called “creators” who deploy popular and useful contracts as particularly valuable. Such users provide additional use-cases for a platform, and thus serve to attract other users.
| Airdrop | Start date | End date | Blockchain |
|---|---|---|---|
| ENS | October 2021 | May 2022 | Ethereum |
| dYdX | September 2021 | Still active | Ethereum |
| 1inch | December 2020 | Still active | Ethereum |
| Gemstone | July 23, 2023 | July 31, 2023 | zkSync Era |
3. Exchange Aftermarket Analysis
The motivation for our quantitative analysis in this paper comes from the following observation: airdrop recipients quickly sell tokens and jump ship, which obviously defeats the point of airdrops in the first place. Analyses performed on DEXairdrops show that airdrop recipients sometimes sell all of their tokens shortly after receiving them. Thus, 75% of the recipients of Uniswap’s airdrop dumped all of their tokens within a week of receiving them (jhackworth, 2022), and 61% have sold their tokens shortly after the drop in the case of ParaSwap (Fan et al., 2023). In both cases, recipients mostly stopped using the corresponding platforms within months. This behavior indicates that the airdrop did not succeed in retaining recipients, or that recipients are mostly sybil accounts. Furthermore, a quick sell-off may alarm the market, if it is interpreted as a sign of a lack of belief in the long-term success of the platform.
Below we consider data related to the four airdrops (ENS, dYdX, Gemstone, and 1inch) in Table 1 that were collected from an Ethereum and zkSync Era archive nodes. We have made available both our data collection and analysis scripts, along with the dataset itself (Messias et al., 2023b). To identify exchanges, we use a list of 484 exchange account addresses on Ethereum’s mainnet obtained from Dune using the query:
select * from addresses_ethereum.dex
| Platform | Token | Tokens | % sold at | # of recipient | Tokens received per address | ||||
|---|---|---|---|---|---|---|---|---|---|
| supply | distributed | exchanges | addresses | Mean | Std. | Median | Min | Max | |
| ENS | 36.51% | ||||||||
| dYdX | 35.35% | ||||||||
| 1inch | 53.47% | ||||||||
| Gemstone | 95.01% | 0 | |||||||
3.1. Tokens Distributed Over Time
Table 2 proves some numbers on how airdropped tokens are spread across the user base. We observe that the number of recipients is quite high for every analyzed airdrops, which may indicates some effort on the part of airdrop farmers (column 3). Moreover, the data indicates that the tokens were often traded on exchanges, as evident from the fact that the first transfer made by the addresses after the airdrop was a sale in an exchange (column 10). Gemstone stands out from the rest, with 95% of its tokens ending up on exchanges.
Furthermore, Gemstone’s airdrop stands out significantly in terms of the number of tokens distributed compared to other airdrops. This substantial distribution also results in a notably higher median number of airdrops per recipient when compared to the other airdrops. Remarkably, Gemstone allocated the lion’s share, specifically 99.53%, of their total token supply during their airdrop campaign. It is important to highlight that Gemstone was executed primarily as a sybil attack rather than a legitimate airdrop.
| Platform | Airdrop recipients | # of hops | ||||||
|---|---|---|---|---|---|---|---|---|
| Total | # sent to exchanges | % sent to exchanges | Mean | Std. | Median | Min. | Max. | |
| ENS | 83.79% | 1.75 | 1.06 | 2 | 1 | 50 | ||
| dYdX | 96.81% | 2.25 | 0.59 | 2 | 1 | 18 | ||
| 1inch | 96.57% | 1.85 | 0.64 | 2 | 1 | 7 | ||
| Gemstone | 99.93% | 1 | 1 | 1 | 1 | 1 | ||
Focusing on Table 3, we computed the shortest path taken from each recipient address of an airdrop to any of the exchange address in our set. Our findings reveal that the transfer of tokens to exchanges typically takes only a few steps, suggesting that airdrop farmers, in general, are not making significant efforts to hide their activities. The outlier is Gemstone where in all cases tokens were sold within only one hop. Surprisingly, the majority of accounts managed to reach an exchange with a relatively low number of intermediating hops. This observation underscores the prominent role that exchanges play within the crypto ecosystem.
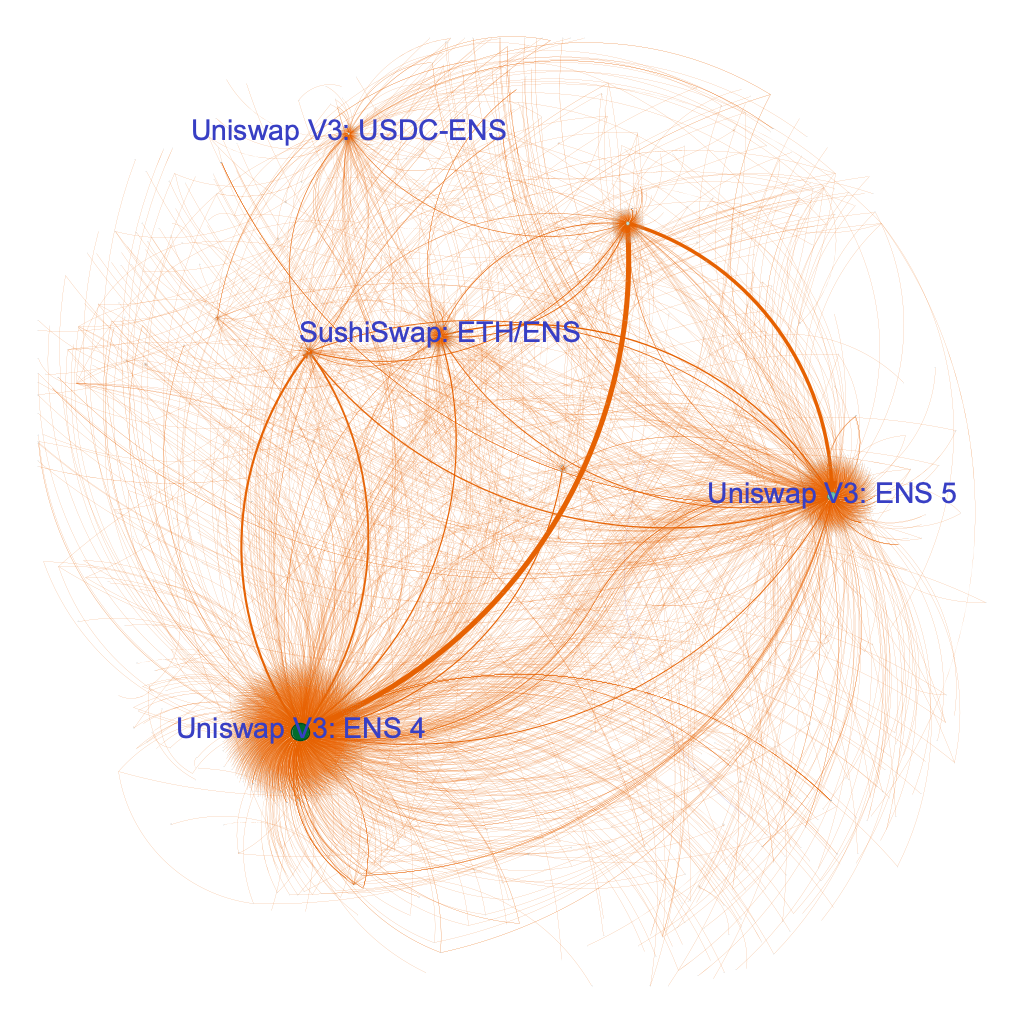
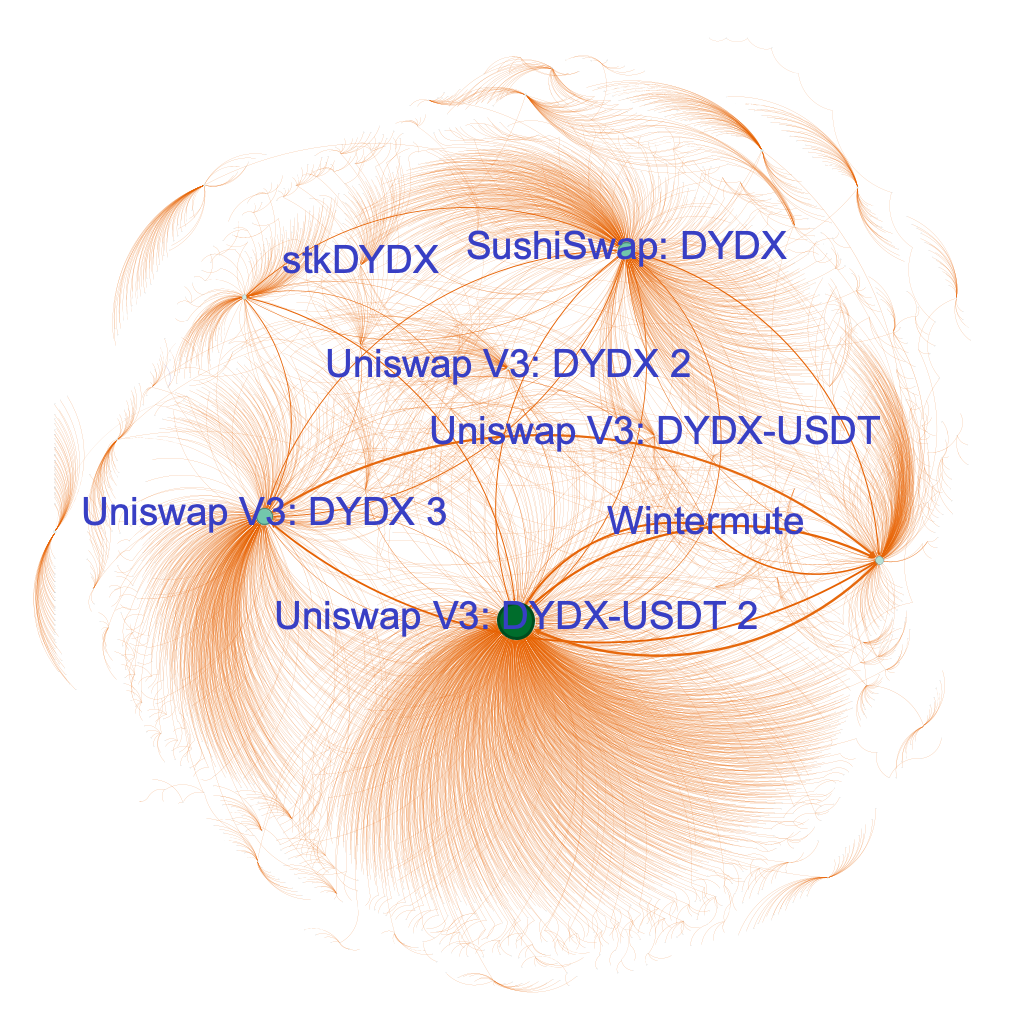
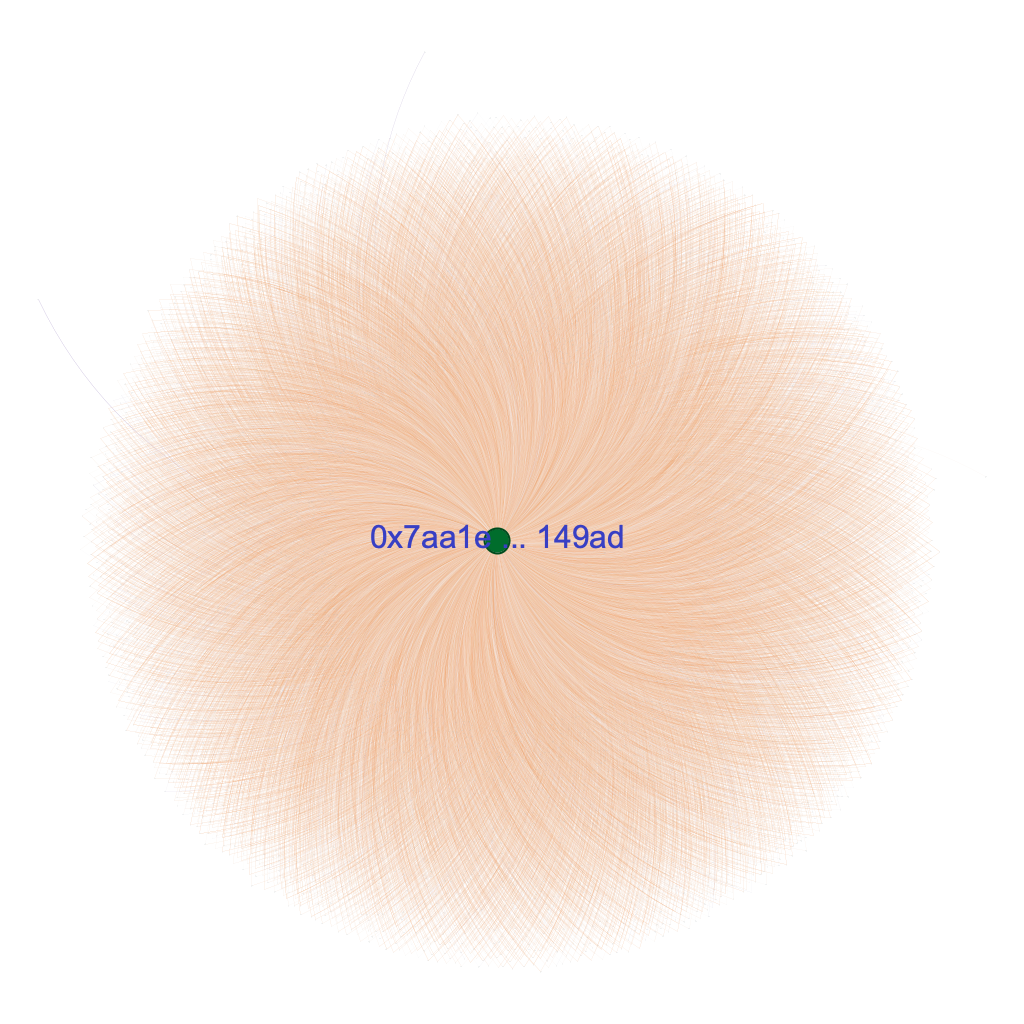
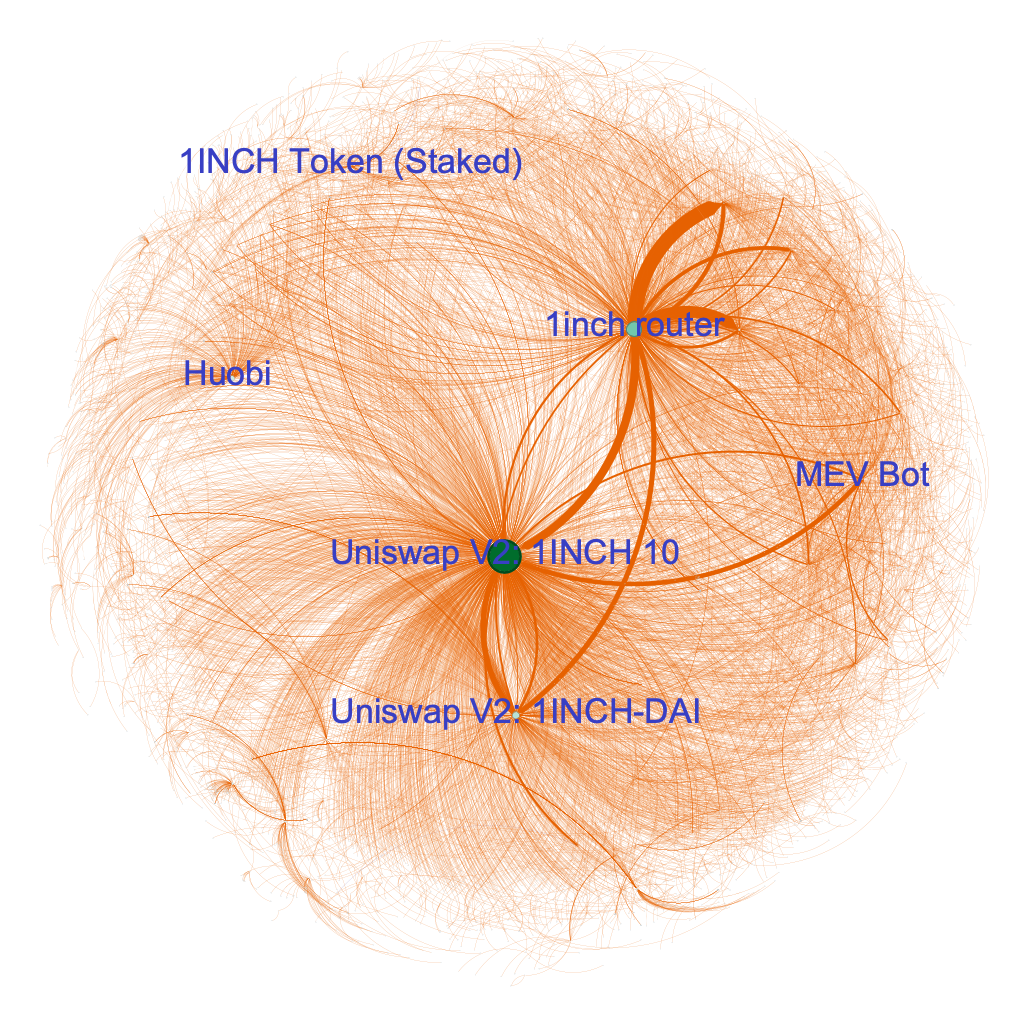
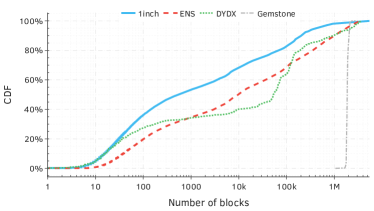
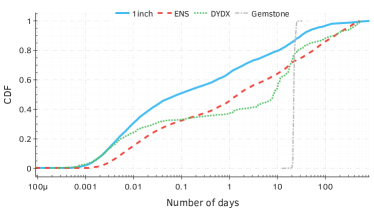
Figure 1 shows the CDFs that demonstrate how quickly tokens are sold at changes. Per Figure 1(a), we see that within about a million blocks, the majority of tokens are gone. For Gemstone the number of blocks significantly higher than others because of a delay introduced by airdrop farmers. As the block generation is quite different for Ethereum (a new block is created every 15s on average) and zkSync, we normalized the blocks in terms of the number of days. Per Figure 1(b), within a single day, 64.67% of the 1inch tokens were sent to an exchange. In comparison, ENS had a transfer rate of 45.86%, while dYdX stood at 37.41%. This does not align with one of the primary objectives of a protocol when conducting an airdrop, which is to promote sustained user engagement, as discussed in Section 2.
3.2. Token Distribution Graphs
To better understand the structure of the transfers that happened after each address received the airdrop tokens, we analyzed the transfer network. Denoted as G(V, E), every node (V) represents an address, and an edge (E) is established when tokens are transferred from one address to another. Specifically, the ENS network consists of nodes and edges, the dYdX network comprises nodes and edges, the Gemstone network encompasses nodes and edges, and the 1inch network features nodes and edges.
To make these graphs more visually readable, we limited the number of hops in the data to one hop from any address that received the protocol airdropped the first few hours after the airdrop and plot their largest component in Figure 2. We manually labeled the higher in-degree nodes using labels provided by Etherscan, a popular blockchain explorer. We show that for all protocols but Gemstone, Uniswap is the decentralized exchange that received the majority of transfers (measured in terms of in-degree) from the addresses receiving the airdrops, followed by SushiSwap.
In the case of Gemstone, all tokens were consistently sent to the address 0x7aa49ad111The contract 0x7aa1ed8fb5e820e38c86cf3dd0a9eb0169a149ad was deployed on zkSync Era on August 4, 2023. in just a single hop. On the other hand, in dYdX, the airdrop utilized a more diverse set of exchange addresses. Notably, as depicted in Table 2, a portion of the airdrop recipients chose to sell their tokens on an exchange. We see some common exchanges like Uniswap and Wintermute.
4. Measuring the Airdrop Lift
Empirical evidence suggests that some airdrops excel in attracting users in the short-term, at least superficially. Although there is some preliminary data showing that airdrops fail in achieving the other goals, there is a dearth of solid research on the topic. In this section, we examine this through the lens of some relevant metrics applied to the Arbitrum airdrop. We rely on data source from Growthepie (Growthepie, 2023) and list details in Section A in appendix.
4.1. Unique Active Addresses
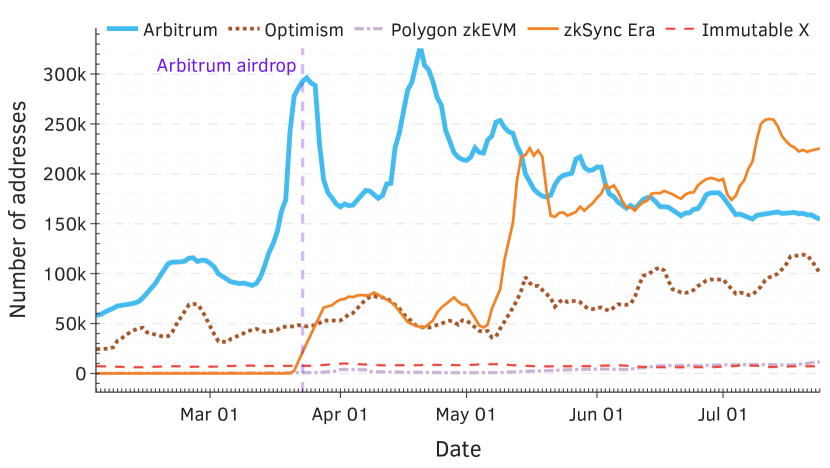
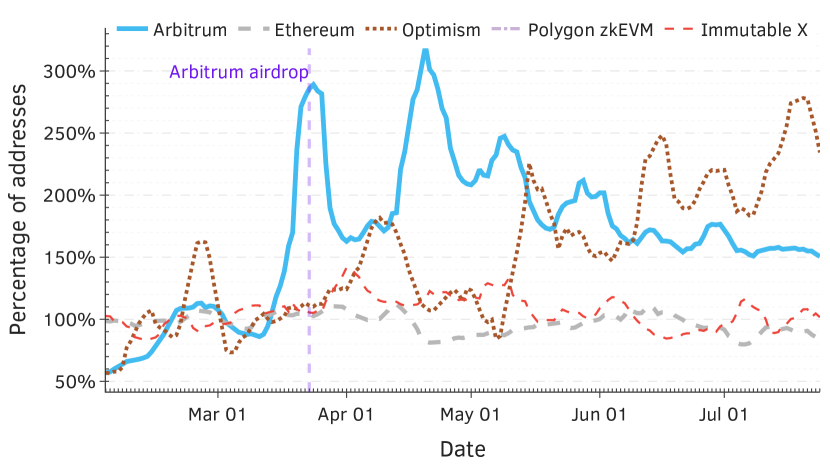
Figure 3 examines the number of unique addresses that were active on each platform using two different approaches. The Figure 3(a) depicts the absolute number of addresses. The Figure 3(b) shows the relative amount of unique daily active addresses for each platform, when compared to the same platform’s average number of unique daily active addresses for the period between February 1st 2023 and March 22nd 2023 (Rustgi, [n. d.]). This latter date is particularly interesting, as a day later Arbitrum distributed its airdrop to network users (Barthere, 2023).
Observation 1: others outperformed Arbitrum, without an airdrop. The absolute number of addresses has increased for Arbitrum post-airdrop, and remained at least 50% higher than its pre-airdrop level in the four months since then. But, by looking at other platforms, it becomes apparent that a similar result can be attained without an airdrop. This is demonstrated by Optimism’s trajectory in Figure 3(b), which exhibits an even larger increase in the number of addresses shortly after the beginning of May, perhaps in anticipation of Optimism’s Bedrock launch in the beginning of June 2023 (Nijkerk, 2023). This is further exemplified by zkSync Era overtaking Arbitrum’s in Figure 3(a), two months after the airdrop.
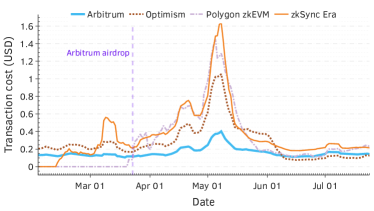
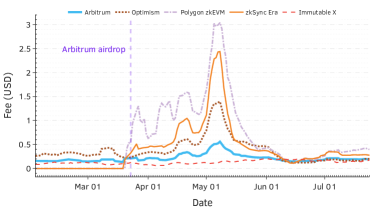
Observation 2: fees may explain the closing bap between Arbitrum and Optimism. Arbitrum leads over Optimism with respect to the number of unique daily active addresses. While in the 50 days before the airdrop Arbitrum has enjoyed an average of 2.6 times more unique daily active addresses than Optimism, this gap has recently started to close: the average over the last 50 days in our dataset is considerably lower, and is equal to 1.83 times more. Optimism’s slightly lower daily median transaction fees since the beginning of June may partly explain their catching up with Arbitrum, as depicted in Figure 4.
Observation 3: the number of unique addresses oscillates over time. Some of the previous observations exhibit oscillatory behavior, in particular in Figure 3(b) depicting the relative amount of unique addresses: rising, reaching a peak, and then subsequently dropping, all in rapid succession. In particular, the phases of Optimism and Arbitrum are inverted regarding the relative amount of unique addresses. One may attempt to explain this by reasoning that when a peak is reached in one of the platforms, fees should increase due to the load, thus prompting cost-conscious users to turn to a different platform. But, when considering the median transaction fees paid per day (per Figure 4), it is apparent that fees do not have corresponding peaks and dips. In fact, Arbitrum consistently had lower median fees mid-May.
Caveat: the unique address metric is gameable. The overall picture painted so far is that with regard to the daily unique account metric, Arbitrum’s airdrop did not succeed in generating long-lasting user involvement. An important caveat of this metric is that in blockchains, users can typically costlessly create and use multiple addresses. This practice is also called a sybil attack, with attackers also known as sybils. Sybil attacks may benefit users, as some airdrops limit the amount of tokens that a single address can receive. Thus, using the number of unique addresses as a metric may paint an incomplete picture: the large changes we observed may be caused by sybil attackers. Although some employ sophisticated tools to identify sybil addresses, these are heuristic in nature and may fail to capture all of them. Thus, we need to consider other metrics that are hopefully more sybil-resistant and representative of genuine user activity.
4.2. Transaction-related Metrics
A natural next step is to examine transaction-related metrics. In particular, these may serve as a proxy for “real” economic activity which users are willing to pay for, as sending a transaction requires paying some minimal fee (Gafni and Yaish, 2022), when ignoring retroactive rebates or the possibility of platforms operating at a loss (Optimism, 2023).
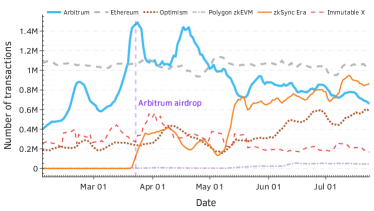
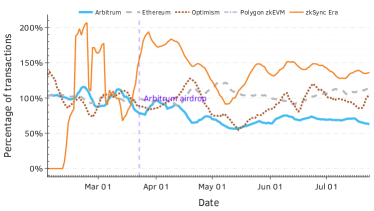
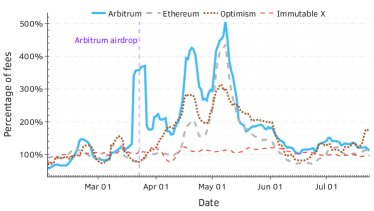
Observation 4: the Arbitrum-Optimism gap is smaller, when considering transactions. Figure 5(a) depicts the absolute daily transaction count per platform, and Figure 5(b) shows the relative amount of transaction count for each platform compared to the same platform’s average transaction count for the period between February 1st and March 22nd, 2023. These figures are quite similar to the corresponding ones for the unique address count metric.
Some notable differences are that with respect to transaction counts, the gap between Arbitrum and Optimism has nearly closed entirely by the end of July. Furthermore, Figure 5(b) shows that the daily transaction count for Immutable X has almost halved since Arbitrum’s airdrop. Contrast this with the corresponding figure for unique addresses, which shows that on average that metric for Immutable X did not change much, hinting that users have become less engaged with the platform.
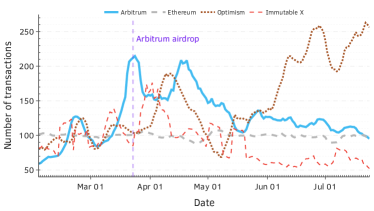
Observation 5: Arbitrum’s per address transaction count dropped since the airdrop. To better understand how Arbitrum’s airdrop affected user engagement in other platforms, we now present the Figure 6, which depicts the relative average daily transaction count per unique address. The figure shows that since the drop, Arbitrum’s per-user transaction count has fallen to less than 75% of its pre-airdrop level.
Caveat: transaction counts are inaccurate when ignoring fees. Relying on the previous metrics may be inaccurate: a high transaction count does not necessarily signal high user engagement. In particular, some platforms require users to perform a certain number of transactions over some time frame to become eligible for their airdrops. Thus, if fees are low, a high number of transactions per account may be caused by users who perform economically-useless transactions, for the sole purpose of receiving the drop. This brings to mind Goodhart’s law (Manheim and Garrabrant, 2019), which posits that “when a measure becomes a target, it ceases to be a good measure”.
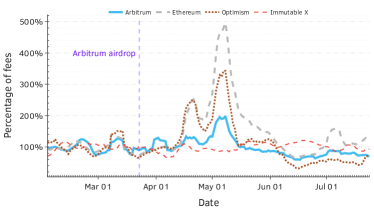
Observation 6: since June, average transaction fees are similar for all platforms. Conceptually, good metrics should measure a user’s amount of skin in the game. A possible proxy for that is the amount of funds the user is willing to expend for interacting with the platform. When considering the relative metrics, such as the average fee per transaction or the average fees unique address, one can observe that since June, all platforms are quite similar in both regards. Furthermore, when comparing the average fee per transaction to the median one (per Figures 4 and 7), it is apparent that the median fee may be slightly more useful when trying to discern causes for shifts in user behavior.
Another interesting metric is the relative average fees per address, compared to the average in the 50 days preceding Arbitrum’s airdrop, shown in Figure 8. One can observe that Arbitrum’s user engagement was not significantly influenced by the airdrop, and usually behaves similarly to other platforms.
Observation 7: Arbitrum’s total daily fees spiked around the time of the airdrop. Figure 9 shows that Arbitrum’s airdrop did not confer a substantial advantage over its competitors when it comes to its income stream from transaction fees. Although the total amount of fees it earned on the day of the drop reached a peak, this was momentary.
Indeed, at the relative lead, Arbitrum held over Optimism with respect to this metric, in the 50 days before the airdrop Arbitrum earned on average 1.96 times more from transaction fees per day, while in the last 50 days of our data set this has shrunk to 1.74.
4.3. Total Value Locked
The Total Value Locked (TVL) of a platform is a metric that measure the combined value of all assets stored in that platform.
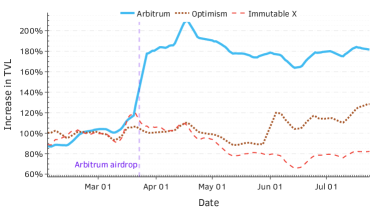
Observation 8: Arbitrum’s airdrop had a lasting impact on its TVL. Among all examined metrics, TVL is the only one that showed a long-lasting improvement following an airdrop: Arbitrum’s TVL increased by over 50% immediately afterward, and has not dropped significantly since, as shown in Figure 10. It is perhaps surprising, as Arbitrum’s airdrop distribution strategy considered only user activity performed before February 6, 2023 (Foundation, 2023a).
5. Common Pitfalls
Airdrops share similarities with traditional loyalty programs, such as newcomer bonuses offered to new customers by banks and credit card companies. Furthermore, they also share some common pitfalls. The blockchain setting and the mechanics adopted by most airdrops may exacerbate these pitfalls, or introduce new ones.
Airdrop farmers. Sophisticated users known as airdrop farmers employ elaborate tactics to maximize the amounts of airdrop tokens they receive. Blockchain platforms have adopted various measures to curb the possibility of airdrop farmers gaming the system and obtaining an inappropriate amount of rewards. For example, a popular approach is to limit the amount of rewards that a single user can receive. Alas, a single user can pose as multiple users, in a move called a sybil attack.
Thus, platforms resort to Proof-of-Humanity services, such as Gitcoin passport. These usually assign a numeric score to users based on a certain metric, where a higher score means that there is more certainty that the corresponding user is indeed human. Gitcoin passport’s metric is based on a list of tasks, such as connecting a user’s social media accounts, or being in possession of some amount of ETH (Gitcoin, 2023). Such methods can be augmented by analyzing on-chain data to detect sybils and exclude them from the drop (Barthere, 2023), but this may lead to false negatives (X-explore, 2023). There are some recent examples of platforms like Celestia considering using sybil resistance solutions (Labs, 2023c).
There are other farming mitigation techniques, such as requiring users to perform tasks, ranging from sending a certain type of transactions (Protocol, 2023), to sharing posts on social media (Labs, 2023b). These tasks sometimes appear arbitrary, leading to frustration among users.
The problem with the aforementioned methods is that they are easy to automate (Jumper-sketch, 2023) and cheaply fooled, even more-so when platforms offer retroactive rebates on transaction fees (Optimism, 2023). Furthermore, the reliance of many platforms on a limited number of Proof-of-Humanity services means that a one-time investment by an airdrop farmer can result in large profits from multiple airdrops. Even using biometric identification does not guarantee sybil-proofness (TrustaLabs, 2023). A different approach used by platforms is to announce airdrops that retroactively reward users that were active before the announcement. But, farmers can prepare in advance by interacting with these platforms even when no airdrop is officially announced (Copeland, 2023), as was the case in dYdX’s airdrop (Edwards, 2022).
The phenomena of reward farming is not limited to crypto-related airdrops, and similar ones can be found in “traditional” loyalty programs. In particular, the practice of credit card churning, where users apply for credit cards for the sole purpose of receiving the rewards bestowed upon newcomers, only to cancel the cards once the rewards were received. Given that similar problems exist even in traditional contexts, where users can be easily identified and penalized, it seems that reward farming cannot be solved easily.
Distributing governance tokens may be dangerous. Some platforms airdrop governance tokens, as a means to decentralize their governance process. Such tokens allow holders to vote in the platforms’ underlying governance mechanisms, but usually can be exchanged for other tokens, and thus may potentially have monetary value (Dotan et al., 2023).
There is some empirical evidence that suggests that airdrops of governance tokens may be more successful than airdrops of non-governance tokens. In a recent analysis of the market capitalization of crypto tokens performed by Makridis et al. (Makridis et al., 2023), the authors found that if an airdrop is of a governance token, the token’s market capitalization growth rate can increase by relative to governance tokens that were not airdropped. But, the authors acknowledge that this effect is statistically insignificant when using common benchmarks.
Unfortunately, airdropping governance tokens runs the risk of giving too much power to some users, leading to an unfair distribution of decision-making power in the system (Messias et al., 2023a; Feichtinger et al., 2023; Sharma et al., 2023). Also, to users that do not have the platform’s best interests in mind, and may even act to the determent of the platform.
6. Design Guidelines
The pitfalls outlined earlier, while indeed sobering, may inform platforms embarking on the airdrop journey, and can shed light on the path to potential success.
Alternative incentives may better sustain user engagement. An airdrop’s long-term benefit to a platform can be tricky to measure, given that the potential benefits may be indirect and hard to quantify in advance, while expenses are partially immediate and irrevocable, e.g., the value of airdropped tokens is transferred from platforms to users and is thereafter no longer available for other uses. Furthermore, some costs and effects cannot be easily foreseen, like those arising from distributing governance tokens to users.
Instead of using airdrops, a community could adopt other measures which have a more predictable relation between costs and benefits. For example, a very natural alternative to airdrops is for the community to vote to programmatically reward power users with discounts on future interactions. When considering L2s, these discounts can be given on transaction fees. Thus, if a user receives this reward, it necessarily has to use the platform again in the future to benefit from the incentive, thus effectively fostering continued user engagement. Furthermore, this incentive mechanism, although not completely resistant to airdrop farming, does fare better: the discounts have no intrinsic value outside the platform, and the platform’s costs go solely towards users actively using the system.
Nevertheless, while fee discounts are more focused towards incentivizing continued interaction with the platform, they are not without their own challenges. For example, one should carefully design a proper discount mechanism, covering both the eligibility criteria for users, and the height of awarded discounts. Furthermore, it is not immediately apparent that discounts can attract users to a similar degree as the more immediate and tangible rewards offered by airdrops. Another option is to perform multiple airdrops over a relatively long period of time, instead of a single one.
Target well-known, reputable entities. Instead of rewarding pseudonymous users, one can target DAOs that are building relevant apps. In Arbitrum’s airdrop, 1.13% of airdropped tokens were allocated to DAOs (Foundation, 2023a). Arbitrum provides additional incentives besides its airdrop for specific populations of interest, such as university students (Foundation, 2023c) or members of the technical community (Foundation, 2023b) who wish to take part in research and build tools relevant to the platform. Another approach was advanced by Optimism, that directed some of its revenue to retroactively fund successful projects, essentially bringing the concept of a startup exit to the blockchain world (Foundation, 2021).
Proactive oversight and community engagement. While the airdrop is ongoing, the platform’s data should be carefully analyzed to verify that no one is attempting to game the system. A good example was put forth by Linea, whose team uncovered a vulnerability (Liena, 2023) that allowed users to cheat their incentive mechanism. The prompt discovery prevented cheaters from obtaining over one-third222A dashboard is available on Dune at https://dune.com/rusty378/guildxyz-pins. of non fungible tokens (NFTs)offered as incentives.
A complementary approach is to engage the community and to open communication channels and bug bounties for those who wish to disclose vulnerabilities (Team, 2023), whether these are actively used or not. For example, a disclosure by an AzukiDAO community member allowed the platform to mitigate a vulnerability relatively quickly (MetaSleuth, 2023). A platform’s oversight should extend beyond on-chain data. In particular, social media is rife with scammers who advertise “fake” airdrops for their platforms, where users are promised to receive rewards by connecting their wallets to some innocent-looking site, which actually drains user funds. Even platforms that are not planning an airdrop are targeted by such ploys.
Actively engaging with the community regarding technical matters can prove beneficial, as well. For example, zkSync Era’s NFTdrop was retroactively analyzed by cygaar (cygaar, 2023), who found that it could be implemented more cost-effectively.
Starkware’s governance team have so far performed admirably in this regard (Chevet, 2023). The team organized “town hall meeting”-esque discussions and workshops, and actively invited community members to come, participate and voice their opinions. These events provide an effective and transparent communication channel, directly reaching active community members. Operating transparently and giving the community visibility into the inner-workings of the platform can assure that even if technical issues arise, they are met with understanding by users.
Rewards should scale with costs. The ramifications of Goodhart’s law are readily observable in previous airdrops. For example, some airdrops attempt to incentive user engagement by publicly announcing that eligibility for rewards is determined according to the number of times users interact with the platform in the past. Consequently, users can game the system by performing meaningless wash-trading transactions, meaning that the eligibility criteria does not serve as an effective measure of a user’s genuine engagement with the platform.
This is further compounded by the fact that action-based metrics used by airdrops do not usually account for the actual costs incurred by users for each action. For instance, if the number of transactions is used as a metric, one should consider that if transaction fees are low, an airdrop farmer may cheaply perform the required amount of transactions. On the other hand, high fees can eat into the rewards received by users, thereby diminishing the appeal of the airdrop. To remedy these issues, rewards should scale with the costs that are incurred by users.
7. Related Work
The majority of recent papers on airdrops concern themselves with post-factum analysis of prior airdrops, as well as with suggestions on how to run airdrop campaigns.
Studies. Makridis et. al. (Makridis et al., 2023) investigate the role of airdrops for DEXgrowth using a sample of 51 exchanges. They find that airdrops of governance tokens, in particular, are positively associated with growth in market capitalization and volume.
Lommers et. al. (Lommers et al., 2023) offer a broad treatment of the different kinds of airdrops used in practice (plain vanilla, holder-based, past value-based, future value-based). They offer examples of projects like Blur and the pitfalls of their airdrops, together with some advice on airdrop implementation strategies. In particular, they explore how eligibility criteria, signaling, and implementation strategy of the airdrop affect its success and we provide practical guidance on how to toggle these.
Fan et. al.(Fan et al., 2023) study the ParaSwap DEXas an example to propose a role taxonomy methodology through a data-driven study to understand the characteristic of community members and the effectiveness of airdrop. They find that users receive more rewards tend to take positive actions towards the community. They summarize several arbitrage patterns and confirm the current detection is not sufficient in screening out airdrop hunters. They use an unsupervised hierarchical clustering method to capture the behaviors of eligible airdrop addresses after receiving rewards and to divide them into interpretable categories.
Allen (Allen, 2023) examines airdrop design as co-evolutionary process and makes three contributions. First, applying a co-evolutionary lens to airdrops, where participants learn and adapt their strategies (e.g., new criteria, on-chain farming) both within and between web3 ecosystems. Second, nine airdrop cases studies (e.g., Optimism, Arbitrum, Blur) that demonstrate the expanding set of airdrop strategies (e.g., task-based claiming). Third, implications for airdrop design including more feedback loops to facilitate learning (e.g., multi-round airdrops), ongoing innovation in airdrop criteria (e.g., randomness), and a reversion back to simple designs for some projects (because of the costs of airdrop design).
Allen et. al.(Allen et al., 2023) consider why projects might choose this unusual and costly means of token distribution. It considers a selection of high-profile airdrops as case studies between 2014 and 2022. This is the first comprehensive analysis of the rationales and mechanisms of Web3 token airdrops. We find that two primary rationales for airdrops are marketing (to attract new users and to maintain a community) and decentralisation of ownership and control of a project (building community, providing regulatory protection, and enhancing security). While many commentators describe airdrops as primarily for marketing, they claim that marketing is a weak rationale for airdropping tokens and the evidence of successful marketing-driven airdrops lacking.
Technical Aspects of Airdrops. Frowis et. al. (Fröwis and Böhme, 2019) point out that efficient transfers to a large number of recipients in the case of airdrops present issues on Ethereum. They find that cost savings of a factor of two are in fact possible, but require specific provisions in the smart contract implementing the token system. Pull-based approaches, which use on-chain interaction with the recipients, promise moderate savings for the distributor while imposing a disproportional cost on each recipient. Total costs are broadly linear in the number of recipients independent of the technical approach.
Wahby et. al. (Wahby et al., 2020) point out that current airdrops offer no recipient privacy: they leak which recipients have claimed the funds, and this information is easily linked to off-chain identities. In this work, the authors address this issue by defining a private airdrop and describing concrete schemes for widely-used user credentials (ECDSA and RSA). Private airdrop for RSA builds upon a new zero-knowledge argument of knowledge of the factorization of a committed secret integer, which may be of independent interest. Their fastest implementation takes 40–180 ms to generate and 3.7–10 ms to verify an RSA private airdrop signature.
8. Conclusions
In this work we conducted analysis for of the common pitfalls of airdrops and propose concrete ways to improve the situation. Specifically, we analyze the data pertaining to four recent airdrops and conclude that the majority of proceeds (as high as 95%, typically only within a couple of transfer steps) have been sold via exchanges, implying that the airdrops fall far short of their intended purpose. We hope that the suggestions in this paper provide inspiration for researchers and practitioners alike.
References
- (1)
- Allen et al. (2023) Darcy W.E. Allen, Chris Berg, and Aaron M. Lane. 2023. Why airdrop cryptocurrency tokens? Journal of Business Research 163 (2023), 113945. https://doi.org/10.1016/j.jbusres.2023.113945
- Allen (2023) Darcy W E Allen. 2023. Crypto Airdrops: An Evolutionary Approach. SSRN Electronic Journal (2023). https://doi.org/10.2139/ssrn.4456248
- Barthere (2023) Aurelie Barthere. 2023. “All for One and One for All” - An on-chain distribution model for the Arbitrum community. https://www.nansen.ai/research/an-on-chain-distribution-model-for-the-arbitrum-community
- Bukov and Melnik (2020) Anton Bukov and Mikhail Melnik. 2020. Mooniswap by 1inch. exchange.
- Chevet (2023) Sylve Chevet. 2023. Starknet Governance in 10 min. https://www.youtube.com/watch?v=GKSGuwdU95Y&t=240s.
- Copeland (2023) Tim Copeland. 2023. “We made close to $1 million”: Inside the murky world of airdrop farming. https://www.theblock.co/post/225215/we-made-close-to-1-million-inside-the-murky-world-of-airdrop-farming
- cygaar (2023) cygaar. 2023. zkSync just airdropped NFTs to 10000 wallets. https://twitter.com/0xcygaar/status/1680214224411426816
- Dotan et al. (2023) Maya Dotan, Aviv Yaish, Hsin-Chu Yin, Eytan Tsytkin, and Aviv Zohar. 2023. The Vulnerable Nature of Decentralized Governance in DeFi. In Proceedings of the 2023 Workshop on Decentralized Finance and Security (<conf-loc>, <city>Copenhagen</city>, <country>Denmark</country>, </conf-loc>) (DeFi ’23). Association for Computing Machinery, New York, NY, USA, 25–31. https://doi.org/10.1145/3605768.3623539
- Edwards (2022) James Edwards. 2022. Retroactive airdrop farming: How to prepare yourself for 2022. https://web.archive.org/web/20220120123746/https://www.finder.com.au/retroactive-airdrop-farming-2022.
- ENS (2023) ENS. 2023. Ethereum Name Service (ENS). https://docs.ens.domains
- Fan et al. (2023) Sizheng Fan, Tian Min, Xiao Wu, and Wei Cai. 2023. Altruistic and Profit-oriented: Making Sense of Roles in Web3 Community from Airdrop Perspective. In Proceedings of the 2023 CHI Conference on Human Factors in Computing Systems. ACM, Hamburg Germany, 1–16. https://doi.org/10.1145/3544548.3581173
- Feichtinger et al. (2023) Rainer Feichtinger, Robin Fritsch, Yann Vonlanthen, and Roger Wattenhofer. 2023. The Hidden Shortcomings of (D)AOs – An Empirical Study of On-Chain Governance. arXiv:2302.12125 [cs.CY]
- Foundation (2023a) Arbitrum Foundation. 2023a. $ARB airdrop eligibility and distribution specifications. https://docs.arbitrum.foundation/airdrop-eligibility-distribution#initial-token-allocation–airdrop-distribution
- Foundation (2023b) Arbitrum Foundation. 2023b. Arbitrum embassador program. https://arbitrum.foundation/ambassador.
- Foundation (2023c) Arbitrum Foundation. 2023c. Introducing the Arbitrum Ambassador Program: Phase 1. https://arbitrumfoundation.medium.com/introducing-the-arbitrum-ambassador-program-phase-1-cf89d51a4dd9.
- Foundation (2021) Optimism Foundation. 2021. Retroactive Public Goods Funding. https://medium.com/ethereum-optimism/retroactive-public-goods-funding-33c9b7d00f0c.
- Fröwis and Böhme (2019) Michael Fröwis and Rainer Böhme. 2019. The Operational Cost of Ethereum Airdrops. In Data Privacy Management, Cryptocurrencies and Blockchain Technology (Lecture Notes in Computer Science), Cristina Pérez-Solà, Guillermo Navarro-Arribas, Alex Biryukov, and Joaquin Garcia-Alfaro (Eds.). Springer International Publishing, Cham, 255–270. https://doi.org/10.1007/978-3-030-31500-9_17
- Gafni and Yaish (2022) Yotam Gafni and Aviv Yaish. 2022. Greedy Transaction Fee Mechanisms for (Non-)myopic Miners. https://doi.org/10.48550/ARXIV.2210.07793
- Gitcoin (2023) Gitcoin. 2023. How is Gitcoin Passport’s score calculated? https://support.gitcoin.co/gitcoin-knowledge-base/gitcoin-passport/common-questions/how-is-gitcoin-passports-score-calculated
- Growthepie (2023) Growthepie. 2023. API – Growthepie. https://docs.growthepie.xyz/api.
- Haig (2023) Samuel Haig. 2023. zkSync Airdrop Farmer Deploys 21,877 Wallets. https://finance.yahoo.com/news/zksync-airdrop-farmer-deploys-21-020118990.html
- jhackworth (2022) jhackworth. 2022. The Uniswap Airdrop - Lessons for the Industry. https://dune.com/blog/uni-airdrop-analysis
- Juliano (2018) Antonio Juliano. 2018. dydx: A standard for decentralized margin trading and derivatives. URl: https://whitepaper. dydx. exchange (2018).
- Jumper-sketch (2023) Jumper-sketch. 2023. WeAreCrypto – GitHub repository. https://github.com/Jumper-sketch/WeAreCrypto.
- Kalodner et al. (2018) Harry Kalodner, Steven Goldfeder, Xiaoqi Chen, S. Matthew Weinberg, and Edward W. Felten. 2018. Arbitrum: Scalable, private smart contracts. In 27th USENIX Security Symposium (USENIX Security 18). USENIX Association, Baltimore, MD, 1353–1370. https://www.usenix.org/conference/usenixsecurity18/presentation/kalodner
- Labs (2023a) Bullet Labs. 2023a. Linea | Galxe. Accessed on August 1st, 2023.
- Labs (2023b) Bullet Labs. 2023b. Linea Voyage - Social Campaign. https://galxe.com/Linea/campaign/GCPRsUEZhR.
- Labs (2023c) Trusta Labs. 2023c. Trusta’s AI and Machine Learning Framework for Robust Sybil Resistance in Airdrops. https://medium.com/@trustalabs.ai/trustas-ai-and-machine-learning-framework-for-robust-sybil-resistance-in-airdrops-ba17059ec5b7
- Liena (2023) Liena. 2023. Update on the Human Verification Campaign of Linea Voyage. https://twitter.com/LineaBuild/status/1680160944306130945.
- lingland09 (2023) lingland09. 2023. Warning: 21877 sybil wallets by one person #zkSync. https://twitter.com/lingland09/status/1700970363713167450
- Lommers et al. (2023) Kristof Lommers, Christos Makridis, and Lieven Verboven. 2023. Designing Airdrops. https://doi.org/10.2139/ssrn.4427295
- Makridis et al. (2023) Christos A. Makridis, Michael Fröwis, Kiran Sridhar, and Rainer Böhme. 2023. The rise of decentralized cryptocurrency exchanges: Evaluating the role of airdrops and governance tokens. Journal of Corporate Finance 79 (2023), 102358. https://doi.org/10.1016/j.jcorpfin.2023.102358
- Manheim and Garrabrant (2019) David Manheim and Scott Garrabrant. 2019. Categorizing Variants of Goodhart’s Law. arXiv:1803.04585 [cs.AI]
- Messias et al. (2023a) Johnnatan Messias, Vabuk Pahari, Balakrishnan Chandrasekaran, Krishna P. Gummadi, and Patrick Loiseau. 2023a. Understanding Blockchain Governance: Analyzing Decentralized Voting to Amend DeFi Smart Contracts. arXiv:2305.17655 [cs.CR]
- Messias et al. (2023b) Johnnatan Messias, Aviv Yaish, and Benjamin Livshits. 2023b. Datasets and scripts used to analyze on-chain data from several larger-scale airdrops. https://drive.google.com/drive/folders/1lm0UNtSLbnX0AtyRFh8Ol_6eDKYcnyl1.
- MetaSleuth (2023) MetaSleuth. 2023. AzukiDao’s governance token contract (bean) AzukiDAO has been exploited due to a contract vulnerability. https://twitter.com/MetaSleuth/status/1675783739174166528
- Nijkerk (2023) Margaux Nijkerk. 2023. Optimism Completes ‘Bedrock’ Hard Fork, in Pursuit of Superchain. https://www.coindesk.com/tech/2023/06/06/optimism-completes-bedrock-hard-fork-in-pursuit-of-superchain
- Optimism (2023) Optimism. 2023. Airdrop 2. https://community.optimism.io/docs/governance/airdrop-2
- Protocol (2023) HAPI Protocol. 2023. Hapi - Send Transactions, Investigate and Post: Create the L Letter! https://galxe.com/credential/287125319526817792
- Rustgi ([n. d.]) Nivesh Rustgi. [n. d.]. Speculators flock to Arbitrum IOU tokens ahead of this week’s ARB airdrop. https://cointelegraph.com/news/speculators-flock-to-arbitrum-iou-tokens-ahead-of-this-week-s-arb-airdrop.
- Sguanci et al. (2021) Cosimo Sguanci, Roberto Spatafora, and Andrea Mario Vergani. 2021. Layer 2 Blockchain Scaling: a Survey. arXiv:2107.10881 [cs.DC]
- Sharma et al. (2023) Tanusree Sharma, Yujin Kwon, Kornrapat Pongmala, Henry Wang, Andrew Miller, Dawn Song, and Yang Wang. 2023. Unpacking How Decentralized Autonomous Organizations (DAOs) Work in Practice. arXiv:2304.09822 [cs.CY]
- Team (2023) CheatSheets Series Team. 2023. Vulnerability Disclosure Cheat Sheet. https://cheatsheetseries.owasp.org/cheatsheets/Vulnerability_Disclosure_Cheat_Sheet.html
- TrustaLabs (2023) TrustaLabs. 2023. Sybil attacks hit Worldcoin. https://twitter.com/TrustaLabs/status/1684144715661455360
- Wahby et al. (2020) Riad S. Wahby, Dan Boneh, Christopher Jeffrey, and Joseph Poon. 2020. An Airdrop that Preserves Recipient Privacy. In Financial Cryptography and Data Security, Joseph Bonneau and Nadia Heninger (Eds.). Springer International Publishing, Cham, 444–463.
- X-explore (2023) X-explore. 2023. Advanced Analysis For Arbitrum Airdrop. https://mirror.xyz/x-explore.eth/AFroG11e24I6S1oDvTitNdQSDh8lN5bz9VZAink8lZ4
- Yaish et al. (2023) Aviv Yaish, Maya Dotan, Kaihua Qin, Aviv Zohar, and Arthur Gervais. 2023. Suboptimality in DeFi. Cryptology ePrint Archive, Paper 2023/892. https://eprint.iacr.org/2023/892 https://eprint.iacr.org/2023/892.
- Yaish et al. (2022) Aviv Yaish, Saar Tochner, and Aviv Zohar. 2022. Blockchain Stretching & Squeezing: Manipulating Time for Your Best Interest. In Proceedings of the 23rd ACM Conference on Economics and Computation (Boulder, CO, USA) (EC ’22). Association for Computing Machinery, New York, NY, USA, 65–88. https://doi.org/10.1145/3490486.3538250
Appendix A Reproducibility
To ensure complete reproducibility of our empirical analysis, we have openly shared both our dataset and scripts (Messias et al., 2023b). The primary data source employed in Section 3 comprises blockchain data extracted from both Ethereum and zkSync Era archive nodes. We meticulously collected all blocks, transactions, and events associated with the contracts of the four airdrops under study.
For Section 4, we sourced data from Growthepie.xyz (Growthepie, 2023). This platform provided various metrics (daily transaction count, daily active addresses, median transaction cost, total value locked, fees paid by users, stablecoin market cap) for several key platforms (zkSync Era, OP Mainnet, Arbitrum, Immutable X, Polygon zkEVM). All these metrics were smoothed using a 7 day moving average.