The Ebb and Flow Phenomenon: Pitfall of Intuitive Strategy
Abstract
In decision-making, individuals often rely on intuition, which can occasionally yield suboptimal outcomes. This study examines the impact of intuitive decision-making in the job application process. Our model posits that individuals’ decisions to apply or withdraw from limited job positions are determined by the relative ratio between the previous year’s admission rate and the intuitively perceived application rate sampled from the current year’s population. Our investigation uncovers the emergence of the “ebb and flow” phenomenon: When competition is intense in a preceding year, it tends to wane in the subsequent year, and vice versa. This phenomenon can result in significant inefficiencies in resource allocation. Empirical experiments also unveil variations in individuals’ reliance on intuition, indicating the presence of inherent adventurous and conservative inclinations. To navigate these intricate dynamics, we introduce a modification factor that enhances our model’s ability to capture a spectrum of individual behaviors within the application process. This study yields valuable insights into resource allocation, particularly within the context of the competitive job market.
keywords:
Decision-making , Ebb and Flow , Resource allocation , Competition , Cognitive bias , Job market[inst1]organization=International Academic Center of Complex Systems, addressline=Beijing Normal University, city=Zhuhai, postcode=519087, country=China
[inst3]organization=Research Center for Complexity Sciences, addressline=Hangzhou Normal University, city=Hangzhou, postcode=311121, opinion=Zhejiang, country=China
[inst5]organization=Faculty of Education, addressline=Beijing Normal University, city=Beijing, postcode=100875, country=China
[inst6]organization=Research Center for Mathematics, addressline=Beijing Normal University, city=Zhuhai, postcode=519087, country=China
[inst2]These authors contribute equally. \affiliation[inst4]Corresponding authors: shengchen@bnu.edu.cn; yu.ernest.liu@bnu.edu.cn.
1 Introduction
In the realm of decision-making, particularly within the context of college admissions, competitive job applications, scholarship opportunities, and other intricate selection processes, individuals are frequently confronted with a remarkable phenomenon known as the “ebb and flow” effect. Originating from the analogy of tides rhythmically retreating (ebb) and advancing (flow), this term can metaphorically describe the cyclic variability in competition levels across successive periods. Specifically, it highlights the pattern wherein if the competition was intense in the preceding year, it tends to wane in the subsequent year, and vice versa. This pattern has garnered the attention of scholars and observers, prompting inquiries into the underlying mechanisms driving these fluctuations and the potential ramifications they carry.
The human mind operates within a multifaceted interplay between rationality and bias [1]. While rationality serves as the guiding star we aspire to follow, the pervasive presence of biases, deeply ingrained within our cognitive framework, remains an undeniable facet of reality [2]. These cognitive biases profoundly influence the choices and decisions that shape our lives. In turn, the decisions we make, whether consciously or unconsciously, not only mold our individual trajectories [3] but also reverberate through the collective outcomes of society [4]. Amidst this intricate cognitive terrain, cognitive biases stemming from inadequate sampling size have garnered significant scholarly attention [5]. For example, the information richness phenomenon wherein certain individuals are better able to acquire, process and utilize information than are other individuals in the organization [6]. Such cognitive biases arise when individuals derive sweeping conclusions or decisions from a sample size that does not represent the broader population adequately [7]. This can lead to an inaccurate representation of the overall frequency or prevalence of an event within a population, ultimately leading to misleading or incorrect conclusions [8]. One major contributor to this bias is the potential for certain groups or individuals to be disproportionately over-represented or underrepresented, skewing the derived conclusions [9].
While Big Data Analytics is acknowledged for its potential to enable well-informed strategic decisions, as highlighted in the study by [10], individuals frequently rely on intuitive and sensible approaches when assessing the viability of their applications in the dynamic landscape of competition - assessing their perceived likelihood of success [11]. This assessment frequently relies on past enrollment rates or predetermined admission quotas set by institutions, both of which provide indicative measures of the likelihood of success. Additionally, individuals endeavor to estimate the proportion of applicants within the present cycle, serving as an indicator of the intensity of competition [11]. Nonetheless, achieving a comprehensive understanding based on a full population sample is often unattainable [12, 13]. Consequently, individuals resort to localized information and heuristic methodologies, such as random sampling [14, 15, 16], consultations with peers, or engagement in surveys, as proxies for broader trends [17]. Yet, this approach implicitly assumes a direct equivalence between local and global probabilities, often leading to significant biases that skew the estimation process [18].
The current paper embarks on a quantitative expedition into the decision-making process, employing numerical simulations, analytical modeling, and small-scale social experiments as its vehicles. Specifically, it addresses a series of pivotal questions:
-
1.
To what extent do individuals adopt the aforementioned intuitive strategy, and how does this strategy encompass elements of risk-taking?
-
2.
Considering the presence of cognitive biases induced by limited sampling size, does the intuitive strategy yield benefits for both individuals seeking opportunities and the institutions orchestrating selections? In cases where the intuitive strategy falls short, to what extent does it contribute to sub-optimal outcomes for individuals and society at large?
-
3.
Does cognitive bias serve to amplify or attenuate the observed effects of the decision-making process?
By delving into the intricacies of decision-making under the dynamic context of fluctuating competition, this paper aspires to contribute to the expanding tapestry of research aimed at comprehending human behavior within the realm of selection processes. Through meticulous empirical investigations and rigorous theoretical analyses, we endeavor to illuminate the complexities inherent in decision-making strategies, cast light on the interplay between individual conduct and societal consequences, and provide insights that may inform policy and interventions crafted to optimize selection processes across diverse domains.
2 Model
In our model, we present an organizational plan aimed at hiring a specific number of individuals from a targeted population with a total size of . Therefore, the admission rate can be denoted by . Initially, we assume that a certain number of of individuals have the inclination to apply for the position. This gives the initial application rate can be denoted by . All individuals will then attempt to gather information to aid in their decision-making. Specifically, each individual evaluates the degree of competition by the perceived application rate ; that is, they consult random individuals (excluding themselves) to find that the number of initial applicants is (including themselves). It is further assumed that individuals would employ an intuitive strategy when making decisions: If the perceived application rate exceeds the admission rate , i.e., , the individual would feel that the competition is too intense and finally decide to give up the application; Otherwise, the applicant proceeds with the application.
Note that consulting an insufficient subset of the total population, i.e., , can significantly skew evaluations of the true value of . This can lead to phenomena like the majority illusion [19] or perception bias [20, 21]. Specifically, when , individuals tend to overestimate the fraction of applicants. On the other hand, when , they tend to underestimate this fraction.
Our investigation focuses on the interplay between the admission rate, the initial application rate, the perceived application rate, and the final application rate , which can be expressed as , where represents the final number of applicants.
3 Results
To facilitate understanding, we have collected the parameters and variables involved in the aforementioned model as follows:
-
1.
: the total population size.
-
2.
: the number of available positions.
-
3.
: the admission rate, i.e., .
-
4.
: the number of initial applicants, i.e., applicants with initial inclinations.
-
5.
: the initial application rate, i.e., .
-
6.
: the number of random consultations.
-
7.
: the number of initial applicants among consultations plus itself.
-
8.
: the perceived application rate, i.e., .
-
9.
: the final number of applicants.
-
10.
: the final application rate, i.e. .
3.1 Analytical Results
To assess the final application rate, we consider two scenarios:
(1) For the scenario where the individual has the initial inclination to apply, we calculate the probability that the individual finds individuals who have the initial inclination to apply after conducting consultations. This probability is given by
| (1) |
The term represents the number of ways to choose individuals from the who have the initial inclination, and represents the number of ways to choose individuals from the remaining individuals without initial inclination. The denominator denotes the total number of ways to choose individuals from the entire population excluding the individual.
(2) For the scenario where the individual does not have the initial inclination to apply, we calculate the probability that the individual finds individuals who have the initial inclination to apply after conducting consultations. This probability is given by
| (2) |
The term represents the number of ways to choose individuals from the individuals who have the initial inclination, and represents the number of ways to choose individuals from the remaining individuals without initial inclination. Again, the denominator denotes the total number of ways to choose individuals from the entire population excluding the individual.
Combined with the above two scenarios, the probability that the individual finally decides to apply for the position can be obtained by
| (3) |
Finally, we calculate the expected final application rate by summing the probabilities for all as follows
| (4) |
Here we discuss specific scenarios that arise under particular conditions as follows:
When or , the outcomes are well-defined. On the one hand, if , it indicates that no individuals will be hired, and then all individuals in the population will certainly forego the application, i.e., . On the other hand, if , it implies that all individuals will be hired, prompting nearly every individual to apply, i.e., .
When , the final application rate is solely determined by the difference between and . If , suggesting that the initial inclination application rate is equal to or greater than the admission rate, the entire population will abstain from applying for the position, i.e., . Conversely, if , indicating that the initial inclination application rate is lower than the admission rate, the entire population will opt to proceed with the application, i.e., .
These situations underscore that an extreme value of the admission rate or random consultations could result in the emergence of malicious competition or extreme pessimism, both detrimental to resource-efficient allocation. The efficiency of resource allocation can be measured by the difference between and , which we call matching index , that is,
| (5) |
where . A matching index value of 0 represents the most efficient resource allocation. In other words, the admission and application numbers of individuals can be perfectly matched. If , it indicates that there is a certain amount of resource waste.
3.2 Simulation Results
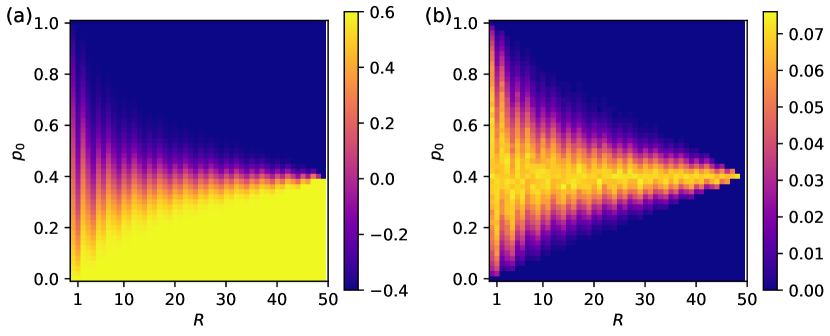
We demonstrate the impact of the admission rate , the initial application rate , and the number of consultations on the matching index by simulation results and visualizing the heatmaps. From Fig. 1(a), it is evident that for fixed admission rate (e.g., ), extreme higher or lower initial application rate results in extreme pessimism or fierce competition, which inefficiently allocates resources. This effect does not change regardless of the value of . Furthermore, a larger value of implies that the higher efficiency area becomes smaller, which suggests that the individuals’ decision-making becomes increasingly extreme. This trend is confirmable by the standard deviations in Fig. 1(b). This trend is detrimental to resource-efficient allocation.
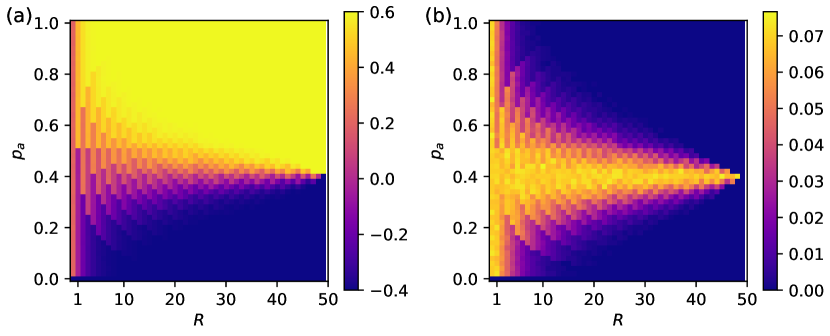
In addition, in Fig. 2, it is clearly observed that the effect of admission rate and initial application rate on the matching index are reversed. Specifically, for the smaller admission rate and initial application rate, extremely high or low values result in fierce competition or extreme pessimism, which inefficiently allocates resources. Additionally, a larger number of consultations also causes the higher efficiency area to shrink. This trend is confirmable by the standard deviations in Fig. 2(b). This trend is also detrimental to resource-efficient allocation.
The results of the study have significant implications for the population, given the intuitive strategy. With a larger , we may see more intense competition for limited positions or more negative emotions among individuals. These two outcomes can lead to inefficient resource allocation and the waste of limited information. Therefore, knowing more information, but with a naive strategy, is not always beneficial.
3.3 Field Experiments
To verify the validity of the performance of our model, we conducted a field experiment. The experimental procedure can be listed as follows. The experiment was conducted during graduation season, where students had to decide whether to compete for a specific position based on the information provided. Participants were assigned points based on their choices: 0 points for not participating, 1 point for successfully getting the position, and point for participating but failing to get the position. The objective of the students in the experiment was to maximize the highest score possible.
To ensure that the collected data reflected the genuine psychological thoughts of the participants when making decisions, appropriate training was provided prior to the formal experiment. This training included an explanation of the rules, an introduction to reward schemes, and a simulated game environment experience. The experiment was conducted using a WeChat mini-program specifically developed for this purpose. The experiment comprised four rounds, with each round involving the participation of 50 students from Beijing Normal University, following a voluntary participation principle. Within each round, students were required to make 30 decisions regarding whether to apply for a position. Their choices were based on three key pieces of information: the number of potential competitors () which remained constant at 50, the number of available positions (), the number of initial applicants , and the number of consultations in this session. The number of available positions () varied across rounds, presenting normal (), hard (), and easy () levels of application competition. The dataset of detailed settings of our experiment can be found in the supplementary table.
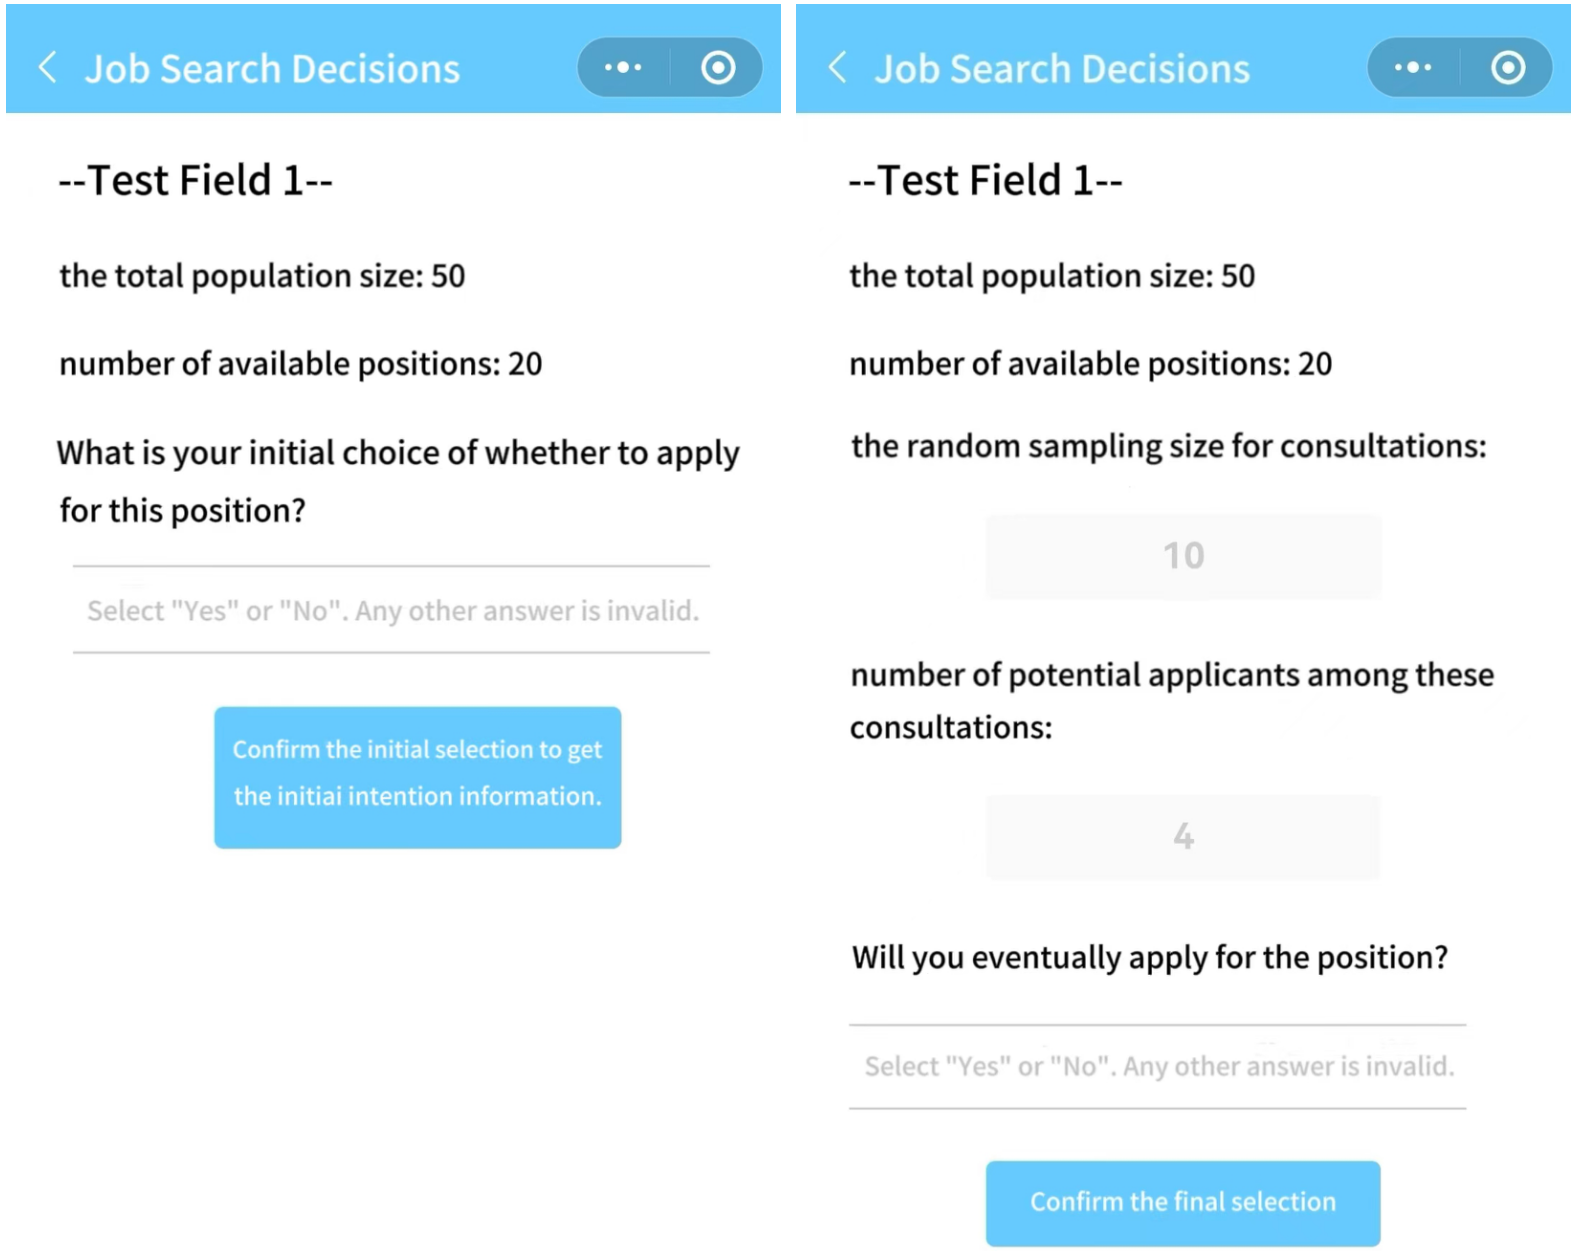
The formal experiment proceeded in two steps: (1) Students were initially presented with a page with information on the total population size () and the number of available positions (), prompting students to make a preliminary decision regarding their intention to apply for the position (see the left panel of Fig. 3). Once finished, students were immediately directed to a page where their final decision would be evaluated. (2) The next page displays additional information: first is the random sampling size for consultations, and the second is the number of people that have the initial inclination to apply (namely, ), which is pre-set by the system. According to the provided information, testers evaluated the competition to make the final decision. When a final selection is submitted, the initial selection page for the next experiment is immediately displayed.
The actual experimental data and the simulation are in general agreement overall. Comparison of these reveals that (referring to the supplementary table for the original data): (1) In the “normal” scenario, that is when there is a middle level of available positions (), the actual and simulated data are generally consistent except for the 4th and 5th case. In these cases, equals 40, which indicates an anticipated intense competition. Under intense competition, intuitively, most people are reluctant to apply. As a result, the number of individuals scoring 0 points would be significantly higher than those scoring 1 point. This was indeed observed in the simulations, which represent the most extreme situation where all individuals ultimately chose not to apply. In the actual experiments, the results were not as extreme, but we did observe from the data that the number of individuals scoring 0 points was significantly higher than those scoring 1 point.
(2) In the “hard” scenario, the actual and the simulated data are generally consistent in all cases except the 8th, 9th, and 12th cases. Likewise, in these inconsistent cases, is exceptionally large. The reason is similar to what was mentioned above: people anticipate intense competition. Nevertheless, in real situations, there are still some who are willing to take the risk, and so it is not as extreme as predicted. (3) In the “easy” scenario, the two sets of data are also generally consistent except for the 15th case, where, again, the competition is extremely intense. To summarize, the reason for the discrepancies in some specific cases may be that when , some individuals in the group still retain the courage to face the competition or have a strong desire for the position. This emotion is also an influencing factor that affects the decision-making behavior of individuals. In the following subsection, we will analyze and explain these factors that affect individual decision-making.
3.4 The Improved Model
In our original model, the simple decision-making method involves comparing the perceived application rate with the admission rate . Specifically, we address the issue directly through a critical point , and participants base their decisions solely on the sign of this critical point . However, real-world scenarios introduce complexities, as individuals become aware of sample bias and consider factors such as the psychological status of others near the critical point. More intricate strategies emerge in proximity to the critical point. To precisely describe participants’ decision tendencies, we introduce an enhancement factor to the term or in Eqs. (1) and (2).
The weight function can be designed as
| (6) |
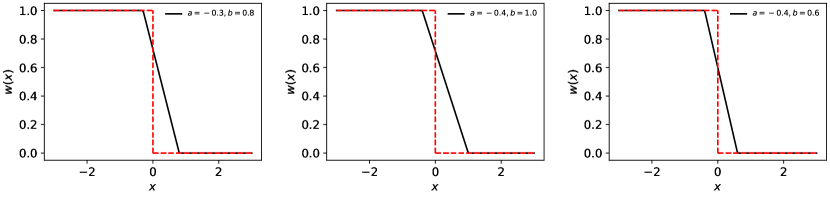
where . Here is the difference between the perceived application rate and the actual admission rate . In addition, parameters and collaboratively govern the range of conservative and adventurous inclinations (see Fig. 4).
Thus, we can improve Eq. (4) as follows
| (7) |
By examining the influence of weight functions, we reveal the optimal parameters and to characterize the adventurous and conservative tendencies of individuals, respectively. From Fig. 4, our findings indicate that individuals are more inclined to undertake risks regardless of the application competition. Furthermore, in the context of hard and easy application competition, individuals appear to be more conservative, whereas, in the scenario of normal application, they are willing to take the most adventurous route. These findings have important implications for understanding individual decision-making under diverse conditions of application competition.
4 Conclusion
As we delve into specific scenarios arising under distinct conditions, our study provides a clearer understanding of the decision-making process in resource allocation. Through the introduction of a model, we have delved deep into the dynamics of behavioral motivations in the context of application processes. In this paper, we not only analyze outcomes under particular circumstances but also provide explanations for the mechanisms driving these outcomes, offering novel perspectives on understanding human decision-making.
Starting with the cases where the admission rate is either 0 or 1, we arrive at unequivocal conclusions. When , it signifies that no individuals will be hired, leading the entire population to opt for application abandonment. Conversely, when , it signifies that all individuals will be hired, resulting in nearly every individual opting to apply. This highlights how individuals make decisions in extreme scenarios, with either complete abandonment or application, contingent on extreme values of the admission rate.
Moving forward to cases where the number of consultations is equal to the population size , we uncover that the final application rate is entirely determined by the relative ratio between the initial inclination application rate and the admission rate . Should , the entire population will collectively opt to abandon applications. Conversely, when , the entire population will lean towards applying for the position. This situation emphasizes the impact of the relationship between initial inclination application rates and admission rates on decision-making, particularly in scenarios with global information. Additionally, we observe that an increase in may potentially lead to the emergence of malicious competition or extreme pessimism, possibly leading to suboptimal resource allocation, especially when admission rates are situated around moderate levels. All these factors contribute to the often-observed “ebb and flow” phenomena in the job market.
Furthermore, we delve into the influence of individual decision-making styles on the model. By introducing the modification factor , we account for individual tendencies towards adventurousness and conservatism. This nuanced approach bridges the gap between the model and real-world experiments, enhancing the model’s applicability. We discern that distinct decision-making styles among individuals significantly impact the decision-making process, adding explanatory power to the model.
To summarize, our study uncovers the intricate dynamics of decision-making under specific conditions. The model not only explains outcomes in special circumstances but also elucidates the mechanisms at play, offering fresh insights into the decision-making process. By incorporating individual decision-making styles, we enhance the model’s realism, bolstering its accuracy and explanatory capacity. Our findings hold valuable implications for resource allocation and decision-making, providing practical guidance. Future research could explore the impact of different factors on the decision-making process and validate the model’s efficacy and applicability through real-world applications.
Data Availability
All original data can be found in the supplementary table.
Conflict of Interest Statement
The authors declare no conflict of interest.
Acknowledgements
We thank Zhehang Xu and Zhengming Xu who improved this paper with relevant comments. This work is supported by the National Natural Science Foundation of China (Grant No. 12205012, No. 61773148, and No. 52374013), and the Youth Talent Strategic Program (Grant No. 28705-310432106, No. 28704-310432104) from Beijing Normal University.
References
- [1] Ana Rita Jordão, Renato Costa, Álvaro Lopes Dias, Leandro Pereira, and José Pedro Santos. Bounded rationality in decision making: an analysis of the decision-making biases. Business: Theory and Practice, 21(2):654–665, 2020.
- [2] Benedetto De Martino, Dharshan Kumaran, Ben Seymour, and Raymond J Dolan. Frames, biases, and rational decision-making in the human brain. Science, 313(5787):684–687, 2006.
- [3] Laura Wray-Lake, Ann C Crouter, and Susan M McHale. Developmental patterns in decision-making autonomy across middle childhood and adolescence: European american parents’ perspectives. Child Development, 81(2):636–651, 2010.
- [4] Todd M Gureckis and Robert L Goldstone. How you named your child: Understanding the relationship between individual decision making and collective outcomes. Topics in Cognitive Science, 1(4):651–674, 2009.
- [5] Michelle C Baddeley, Andrew Curtis, and Rachel Wood. An introduction to prior information derived from probabilistic judgements: elicitation of knowledge, cognitive bias and herding. Geological Society, London, Special Publications, 239(1):15–27, 2004.
- [6] Charles R McClure. The information rich employee and information for decision making: Review and comments. Information Processing & Management, 14(6):381–394, 1978.
- [7] Gustavo Saposnik, Donald Redelmeier, Christian C Ruff, and Philippe N Tobler. Cognitive biases associated with medical decisions: a systematic review. BMC Medical Informatics and Decision Making, 16(1):1–14, 2016.
- [8] David RB Stockwell and A Townsend Peterson. Effects of sample size on accuracy of species distribution models. Ecological Modelling, 148(1):1–13, 2002.
- [9] Jin-Ling Tang. Weighting bias in meta-analysis of binary outcomes. Journal of Clinical Epidemiology, 53(11):1130–1136, 2000.
- [10] Yanfang Niu, Limeng Ying, Jie Yang, Mengqi Bao, and CB Sivaparthipan. Organizational business intelligence and decision making using big data analytics. Information Processing & Management, 58(6):102725, 2021.
- [11] W Brian Arthur. Inductive reasoning and bounded rationality. The American Economic Review, 84(2):406–411, 1994.
- [12] Georgia Robins Sadler, Hau-Chen Lee, Rod Seung-Hwan Lim, and Judith Fullerton. Recruitment of hard-to-reach population subgroups via adaptations of the snowball sampling strategy. Nursing & Health Sciences, 12(3):369–374, 2010.
- [13] Barun Kumar Nayak. Understanding the relevance of sample size calculation. Indian Journal of Ophthalmology, 58(6):469, 2010.
- [14] WC Noble, HA Valkenburg, and Caroline HL Wolters. Carriage of staphylococcus aureus in random samples of a normal population. Epidemiology & Infection, 65(4):567–573, 1967.
- [15] R Iliyasu and I Etikan. Comparison of quota sampling and stratified random sampling. Biom. Biostat. Int. J. Rev, 10(1):24–27, 2021.
- [16] Vance W Berger and Jialu Zhang. Simple random sampling. Encyclopedia of Statistics in Behavioral Science, 2005.
- [17] Anita S Acharya, Anupam Prakash, Pikee Saxena, and Aruna Nigam. Sampling: Why and how of it. Indian Journal of Medical Specialties, 4(2):330–333, 2013.
- [18] Peter A Biro. Are most samples of animals systematically biased? consistent individual trait differences bias samples despite random sampling. Oecologia, 171(2):339–345, 2013.
- [19] Kristina Lerman, Xiaoran Yan, and Xin-Zeng Wu. The" majority illusion" in social networks. PLoS One, 11(2):e0147617, 2016.
- [20] Eun Lee, Fariba Karimi, Claudia Wagner, Hang-Hyun Jo, Markus Strohmaier, and Mirta Galesic. Homophily and minority-group size explain perception biases in social networks. Nature Human Behaviour, 3(10):1078–1087, 2019.
- [21] Hao Yu, Bin Xue, Jianlin Zhang, Run-Ran Liu, Yu Liu, and Fanyuan Meng. Opinion cascade under perception bias in social networks. Chaos: An Interdisciplinary Journal of Nonlinear Science, 33(11), 2023.