The Belle Collaboration
Search for the semileptonic decays at Belle
Abstract
Using the full data sample of 980 collected with the Belle detector at the KEKB asymmetric energy electron-positron collider, we report the results of the first search for the rare semileptonic decays ( or . No significant signals are observed in the invariant-mass distributions. Taking the decay as the normalization mode, we report 90% credibility upper limits on the branching fraction ratios and based on the phase-space assumption for signal decays. The 90% credibility upper limits on the absolute branching fractions of and are found to be and , respectively.
I Introduction
In the Standard Model (SM), the weak-current interaction has an identical coupling to all lepton generations, which allows Lepton Flavor Universality (LFU) to be tested in the semileptonic decays of the hadrons. Theoretically, the study of semileptonic decays of baryons has complications that are not present in the study of analogous decays of mesons as the contributions from -exchange transitions lead to sensitivity to the helicity structure of the effective Hamiltonian Xic02xi0llTheoryPrediction ; theory1 ; theory2 ; theory3 . Furthermore, the hadronic form factors are not as well known for baryons as they are for mesons. Thus, the experimental results on baryonic semileptonic decays give important inputs for lattice quantum chromodynamics and other theoretical models.
Experimentally, few baryonic neutrino-less semileptonic decays have been observed. Of the light-baryon octet and bottom baryon decays, the branching fractions for , , and have been measured Xi02LambdaeeNA482007 ; Sigmap2pmumuHyperCP2005 ; Lambdab02lambdamumuCDF2011 ; Lambdab02lambdamumuLHCb2013 ; Lambdab02lambdamumuLHCb2015 . However, no evidence has been found for similar decays of charmed baryons. Among these decays, only ( or ) decays were searched for. Upper limits on the branching fractions, at 90% credibility, were first set by the BaBar collaboration at and Lambdacp2pllBARBAR2011 . LHCb then placed a much tighter limit, at the 90% confidence level, on at Lambdacp2pmumuLHCb2018 . Particularly, the decays receive both single-quark transition via the Flavor Changing Neutral Current (FCNC) process and -exchange contributions.
The FCNC process is forbidden at tree level in the SM by the Glashow-Iliopoulos-Maiani mechanism gem . However, some tensions have been reported recently in meson decays involving the processes via LFU observables and angular analysis RKplusLHCb2021 ; RKplusLHCb2019 ; RKplusLHCb2014 ; RKstar0LHCb2017 ; AngB02Kstar0LHCb2020 ; AngBplus2KstarplusLHCb2021 , whereas recently LHCb reported the disappearance of the anomaly on LFU RKLHCb2023 . Hence, the study of semileptonic decays of baryons provides an opportunity to test the SM, and also can help in the understanding of the recent anomalies in meson FCNC processes.
The lack of studies on semileptonic decays of charmed baryons provides a strong motivation for further research on these decays. The decays, which are related to the -exchange contribution in decays under SU(3) flavor symmetry, have not been experimentally measured yet. Measurement of both and decay rates would also allow an LFU test to be performed. Based on the SU(3) flavor symmetry and the recent experimental result on Lambdacp2pmumuLHCb2018 , the upper limits at the 68.3% confidence level on the branching fractions of the Cabibbo-favored modes are predicted to be and Xic02xi0llTheoryPrediction .
In this paper, we show the results of the first search for the decays using the full data sample of 980 collected with the Belle detector BELLEdetector . The decay is used as the normalization mode.
II The data sample and the belle detector
This analysis is based on data recorded at or near the () resonances by the Belle detector BELLEdetector at the KEKB asymmetric energy electron-positron collider KEKBcollider . The Belle detector is a large solid-angle magnetic spectrometer consisting of a silicon vertex detector, a 50-layer central drift chamber (CDC), an array of aerogel threshold Cherenkov counters (ACC), a barrel-like arrangement of time-of-flight scintillation counters (TOF), an electromagnetic calorimeter (ECL) comprised of CsI(Tl) crystals located inside a superconducting solenoid coil that provides a magnetic field, and an iron flux return placed outside the coil, which is instrumented to detect mesons and to identify muons (KLM).
Signal Monte Carlo (MC) events are generated using EVTGEN evtgen to determine signal shapes, optimize the selection criteria, and calculate the reconstruction efficiencies. The generated events are simulated using pythia pythia with a specific Belle configuration. The particles in signal MC simulation decay to , , and using a phase-space model. These events are processed by a detector simulation based on geant3 geant . The Belle generic MC samples, which contain the MC samples of decays, , , and at center-of-mass (c.m.) energies, , of 9.46, 10.024, 10.355, 10.52, 10.58, and 10.867 GeV with two times the total integrated luminosity of data, are used to study possible peaking backgrounds and verify the event selection criteria.
III Event selection criteria
For well-reconstructed charged tracks, except those from and decays, the impact parameters perpendicular to and along the beam direction with respect to the nominal interaction point (IP) are required to be less than 0.1 cm and 2 cm, respectively. Particle identification (PID) is applied to the reconstructed tracks. Pions, kaons, and protons are distinguished based on specific ionisation in the CDC, time measurement in the TOF, and the response of the ACC: this information is combined to form a likelihood for each particle hypothesis , where = , , or . Related likelihoods are used to identify leptons: electron identification also includes a comparison of track and ECL cluster information, and muon identification is based on an extrapolation of the particle track, and hits in the KLM BellePID1 ; BellePID2 ; BellePID3 .
The candidates are reconstructed via decay using a Kalman filter b2fit with fitted probability, , greater than 0. The reconstructed mass should be within 3.5 MeV/ of the nominal mass pdg , corresponding to approximately 2.5 times of the mass resolution (). The transverse distance for reconstructed vertex with respect to the IP is required to be greater than 0.35 cm. A loose PID requirement is applied on the proton with 0.2 and 0.2. And is required to be larger than 0. Hereinafter, is defined as the angle between the vector from the IP to the fitted decay vertex and the momentum vector of the reconstructed particle ; is defined as the angle between the projections of these vectors on the plane perpendicular to the beam direction.
Each candidate is reconstructed from a pair of photons with energy larger than 30 MeV in the barrel region of the ECL () or larger than 50 MeV in the endcaps ( or ). Here, is the polar angle with respect to the detector axis, with the direction aligned approximately with the beam. The reconstructed invariant mass of the candidates is required to be within 17.4 MeV/ () of the nominal mass. A mass-constrained fit is applied to the candidates, and the momenta of the fitted candidates in the laboratory frame are required to exceed 0.15 GeV/.
The decays are selected using the following criteria. The track is required to have a transverse momentum higher than 50 MeV/. A TreeFit algorithm b2fit which performs global decay chain vertex fitting for a particular process has been applied to the decay chain with 0 required. The decay chain is required to satisfy 0 and 1.006. The distances of the decay vertices of the reconstructed candidates from the IP, denoted as , should satisfy cm. The reconstructed mass should be within 5 MeV/ () of the nominal mass pdg .
The is reconstructed by combining the selected and candidates. A TreeFit b2fit ; hyperons to the decay chain is applied with 0 required. Since the from decay has negligible vertex position information, the fit is performed with the following steps. Firstly, taking the IP as the point of origin of the , the point of intersection of the trajectory and the reconstructed trajectory is found. Then, this position is taken as the decay location of the hyperon, and the is then re-made using this position as its point of origin. Only those combinations with the decay location of the indicating a positive path length are retained. The decay chain is also required to satisfy 0, , and cm. The reconstructed mass should be within 12 MeV/ () of the nominal mass. Backgrounds are studied using sideband samples: candidates whose invariant mass differs by between 20 and 44 MeV/ from the nominal value pdg .
For the normalization channel , the selected hyperons are combined with selected candidates identified with 0.2 and 0.2. To reconstruct the signal modes , the candidate is combined with a pair of lepton tracks, or , which are identified with 0.9 and 0.9 for electrons and muons, respectively, where is the likelihood for non-electron tracks. The candidates should be consistent with originating from the IP and pass the vertex and mass-constrained fits with 0.01 to the whole decay chain including the intermediate states, , , , and b2fit . To reduce combinatorial background, especially those from meson decays, the scaled momentum for the candidate, , is required to be greater than 0.5, where is the momentum of candidate in the c.m. frame and is the invariant mass of the candidate. To suppress background from photon conversion for decay, the pair is required to have invariant mass greater than 0.1 GeV/. Each of the electron candidates is also combined with every opposite-charged particle in the event, using the electron hypothesis: the invariant mass of all such pairs is required to be greater than 0.1 GeV/. In events where there is at least one candidate, the average number of candidates is about 1.3. All candidates are retained.
The selection criteria on the invariant mass of the electron pair, for the decay chain, and scaled momentum in this analysis are optimized by maximizing the Punzi figure-of-merit, PunziFOM . Here, ‘’ is the desired significance level, is the detection efficiency of the mode based on signal MC simulation, and is the number of the normalized generic MC events in the signal range, GeV/ ( 95% signal events retained). These requirements are also found to be optimal for , so they are applied for both channels.
IV branching fraction measurement
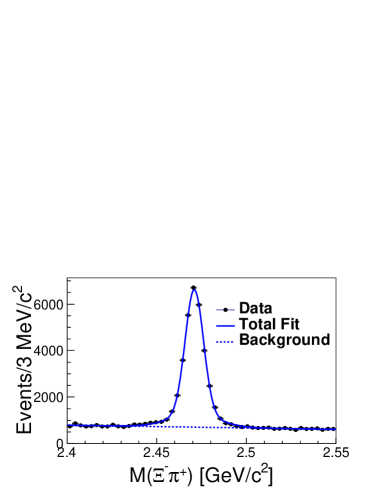
For the reference mode, , the above selection criteria for and candidates are applied. Figure 1 shows the invariant-mass distribution of combinations from data, together with the result of an unbinned extended maximum-likelihood (EML) fit. In the fit, the signal shape of candidates is parameterized by a double-Gaussian function, and the background shape is described by a first-order polynomial. The parameters are free in the fit. The fitted signal yield is 28937272.
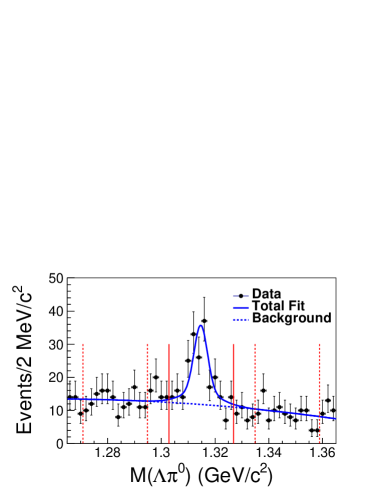
After applying the selection criteria introduced in the last section, Fig. 2 shows the invariant-mass spectrum for the reconstructed candidates before combining with the lepton pairs in the selected signal regions from data, together with the fit result. Here, a double-Gaussian function is used to model the signal shape, and a second-order polynomial is used for the background. The signal shape parameters are fixed to the values found in signal MC, while the background parameters are free in the fit.
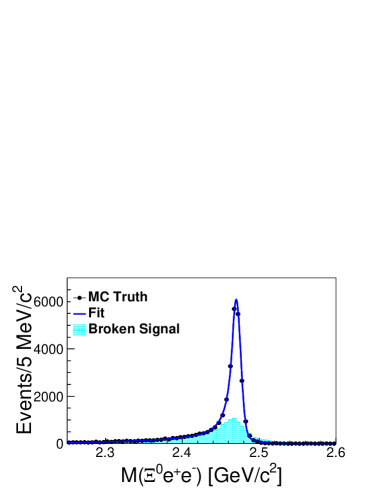
The invariant-mass distributions of and from signal MC simulations and data are shown in Fig. 3 and Fig. 4, respectively, together with the unbinned EML fit results to the true signal distributions from signal MC events and spectra from data. To take energy loss due to bremsstrahlung into account, the shapes of correctly reconstructed candidates are described by two Crystal Ball functions cbfunction for the di-electron mode, while a double-Gaussian function is used as the signal shape for the di-muon mode. Incorrectly reconstructed signal candidates (“broken signal”) have a broader distribution in signal MC simulation, shown by the cyan-shaded histograms in Fig. 3. Broken signal is mainly due to incorrectly selected photons in reconstruction. Similar to the treatment in Ref. brokenSignal , we extract the shape of the broken signal from MC simulation via rookeyspdf rookeyspdf , and treat it as a distinct component in the final signal yield extraction.
The peaking background components are determined using the algorithm of Ref. topoana , and we find them negligible.
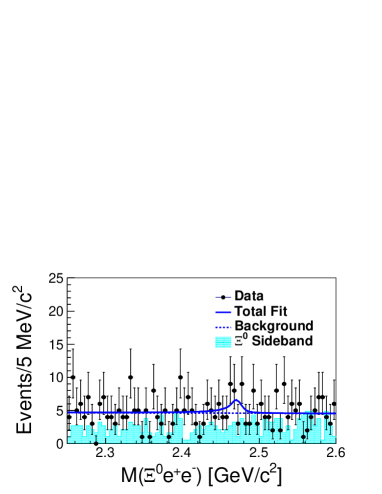
No significant signals are observed in the data. The cyan shaded histograms in Fig. 4 indicate the normalized sidebands. For the fits to data, the signal shapes are taken from the fits to the signal MC samples above with all the parameters fixed. Here, the width of the signal shape is multiplied by a correction factor , where and are the fitted resolutions of shapes from data and MC simulation, respectively. The broken signal shape is taken from the MC simulation as described above, and the ratio of the broken signal to correctly reconstructed signal events, , is fixed at 0.50 (0.46) for the mode according to MC simulation. Linear functions with free parameters are used for the smooth background shapes. The fitted signal yields are 9.17.1 with a significance of 1.4 and 0.92.1 for and decays, respectively.
| Modes | ||
|---|---|---|
| Efficiency (%) | 1.58 | 0.53 |
| 9.17.1 | 0.92.1 | |
| 19.9 | 4.5 | |
| 6.7 | 4.3 | |
| 9.9 | 6.5 |
Assuming the signal branching fraction has a uniform prior probability density function, the Bayesian upper limit at 90% credibility on the number of signal events () is determined by solving the equation , where is the number of fitted signal events and is the likelihood function in the fit to data. The upper limits at 90% credibility on the relative branching fractions are calculated by
| (1) |
separately for and . Here, and are the upper limits on signal yield in data and the reconstruction efficiencies according to MC simulations, respectively, of decays, and are the number of observed events in data and the reconstruction efficiency, respectively, of decay, and the branching fractions are taken as , , and % pdg . To take into account the systematic uncertainties detailed in the next section, the likelihood curve is convolved with a Gaussian function whose width equals the corresponding total multiplicative systematic uncertainty. The calculated 90% credible upper limits on the numbers of signal events, and relative and absolute branching fractions in data, are summarized in Table 1. The muon identification criterion used in this analysis effectively excludes tracks with a momentum too low to reach the KLM BellePID3 : this leads to a reconstruction efficiency in the di-muon channel that is a factor of three lower than in the di-electron channel.
V Systematic Uncertainties
The systematic uncertainties in the measurements of the branching fractions are divided into two categories: multiplicative and additive systematic uncertainties.
The sources of multiplicative systematic uncertainties include detection-efficiency-related uncertainties, branching fractions of intermediate states, and the fitting uncertainty for the normalization mode . The additive systematic uncertainties are the uncertainties in the fits to extract signal yields for decays.
The detection-efficiency-related uncertainties include those for tracking efficiency, PID efficiency, and selection efficiencies, and are estimated based on the simulated MC samples. Since there are four charged tracks in the final states for both signal and reference decay modes, the uncertainty in tracking efficiency cancels in this analysis. The proton PID uncertainties are found to be 0.6% and 1.1% for and modes, respectively, by taking into account the proton momentum differences with the normalization mode. Since the decay is reconstructed in each decay mode and no PID requirement is assigned for the pion track decay from , the other sources of selection uncertainties cancel. Using the control samples of with , the PID uncertainties are estimated to be 0.5% and 0.6% for pions from and decays, respectively, and are added linearly to be 1.1% for the pion tracks in decay. Based on the study of decay, the uncertainties from lepton identification are determined to be 3.2% for electrons and 5.2% for muons. The PID uncertainties here are summed in quadrature for different decay modes, assuming that those uncertainties are independent for and decays. The total PID systematic uncertainties for and decays are determined to be 3.5% and 5.5%, respectively. The systematic uncertainties for momentum-weighted selection efficiency are estimated to be 3.3% and 3.0% for and decays, respectively, according to a study of a control sample. Assuming these uncertainties to be uncorrelated, the uncertainties from PID and efficiencies are added in quadrature to yield the total multiplicative systematic uncertainties.
For the measurements of ratios of branching fractions , the uncertainties associated with branching fractions of intermediate states and are 0.035% and 0.012% pdg , respectively, which are negligible. In the measurements of absolute branching fractions, the uncertainty on is 22.4% pdg , which is the dominant contribution.
In the fit to the distribution from data for decay, we change the fit range by 10% and the order of the polynomial for the background shape, and the relative differences of the fitted signal yields are taken as the uncertainties. These uncertainties are added in quadrature: the total is 0.7%.
Additive systematic uncertainties due to the invariant-mass fits are considered by re-performing the fits with all combinations of the following options: (1) change the resolution scale factor by of its uncertainty; (2) change the fit range by 10%, (3) change the polynomial describing the background shape from first-order to second-order; and (4) multiply the fixed ratios by the correction factors of 1.43 and 0.93 for wrong combinations in di-electron and di-muon modes, respectively, which are calculated according to the ratios of the number of events in sidebands from data over that from generic MC samples.
For the measurements of the upper limits at 90% credibility on the relative and absolute branching fractions of decays, the systematic uncertainties are taken into account in two steps. First, based on the study of the additive systematic uncertainties, the most conservative upper limits at 90% credibility on the numbers of signal events are 25.6 and 4.6 for di-election and di-muon modes, respectively. Then, the likelihood function of the case with the most conservative upper limit is convolved with a Gaussian function whose width equals the corresponding total multiplicative systematic uncertainty for each decay to get the final upper limit. The multiplicative systematic uncertainties from different sources are summarized in Table 2.
| Source | ||
|---|---|---|
| Particle ID | 3.5 | 5.5 |
| selection | 3.3 | 3.0 |
| 22.4 | 22.4 | |
| Fit of reference mode | 0.7 | 0.7 |
| Total [] | 4.9 | 6.3 |
| Total [] | 23.0 | 23.3 |
In this analysis, the simulated decays are generated by the phase space model, since the exact physics models for the decays are unknown, and no significant signals are observed in data. Thus, no systematic uncertainty due to the choice of the decay model is included. Instead, we provide the reconstruction efficiencies in (, ) bins, which are shown in Table 3 and Table 4 for the di-electron and di-muon modes respectively.
| ( GeV ) | |||||||||
|---|---|---|---|---|---|---|---|---|---|
|
[1.4, 2.1] | [2.1, 2.8] | [2.8, 3.5] | [3.5, 4.2] | [4.2, 4.9] | [4.9, 5.6] | [5.6, 6.3] | ||
| [0,0.15] | 0.39 0.01 | 0.98 0.01 | 1.53 0.01 | 1.69 0.01 | 1.57 0.01 | 1.03 0.01 | 0.39 0.01 | ||
| [0.15,0.3] | 0.65 0.01 | 1.20 0.01 | 1.65 0.01 | 1.78 0.01 | 1.63 0.01 | 1.08 0.01 | 0.51 0.01 | ||
| [0.3,0.45] | 0.92 0.01 | 1.32 0.01 | 1.68 0.01 | 1.78 0.01 | 1.60 0.01 | 1.06 0.01 | 0.90 0.03 | ||
| [0.45,0.6] | 1.19 0.01 | 1.48 0.01 | 1.77 0.01 | 1.83 0.01 | 1.62 0.01 | 1.15 0.01 | … | ||
| [0.6,0.75] | 1.30 0.02 | 1.61 0.01 | 1.87 0.01 | 1.91 0.01 | 1.63 0.01 | 1.17 0.01 | … | ||
| [0.75,0.9] | … | 1.72 0.01 | 1.97 0.01 | 1.96 0.01 | 1.56 0.01 | 1.80 0.07 | … | ||
| [0.9,1.05] | … | 1.80 0.01 | 2.07 0.01 | 1.95 0.01 | 1.53 0.01 | … | … | ||
| [1.05,1.2] | … | 1.75 0.01 | 2.04 0.01 | 1.81 0.01 | 1.42 0.02 | … | … | ||
| [1.2,1.35] | … | 1.60 0.02 | 1.78 0.01 | 1.67 0.01 | … | … | … | ||
| ( GeV) | |||||||
|---|---|---|---|---|---|---|---|
|
[2.1, 2.8] | [2.8, 3.5] | [3.5, 4.2] | [4.2, 4.9] | [4.9, 5.6] | ||
| [0,0.15] | 0.33 0.01 | 5.87 0.04 | 11.15 0.05 | 6.66 0.04 | 0.46 0.01 | ||
| [0.15,0.3] | 0.56 0.01 | 6.68 0.03 | 9.99 0.04 | 6.01 0.03 | 0.35 0.01 | ||
| [0.3,0.45] | 1.19 0.01 | 7.05 0.03 | 9.03 0.04 | 5.38 0.03 | 0.36 0.01 | ||
| [0.45,0.6] | 1.75 0.02 | 7.05 0.03 | 8.30 0.03 | 4.60 0.03 | 0.38 0.01 | ||
| [0.6,0.75] | 2.33 0.02 | 7.11 0.03 | 7.69 0.03 | 3.82 0.02 | 0.38 0.02 | ||
| [0.75,0.9] | 3.02 0.02 | 6.92 0.03 | 7.20 0.03 | 3.38 0.02 | 1.55 0.40 | ||
| [0.9,1.05] | 3.90 0.03 | 6.84 0.03 | 6.67 0.03 | 3.60 0.03 | … | ||
| [1.05,1.2] | 5.24 0.05 | 7.20 0.03 | 6.59 0.03 | 4.26 0.11 | … | ||
| [1.2,1.35] | 6.59 0.16 | 7.87 0.04 | 7.56 0.06 | … | … | ||
VI conclusion
In summary, using the entire data sample of 980 collected with the Belle detector, we searched for the semileptonic decays . No significant signals are observed in the invariant-mass distributions. We determine 90% credible upper limits on the relative branching fraction ratios and . Taking pdg , 90% credible upper limits on the absolute branching fractions and are determined to be and respectively.
Comparing with the theoretical predictions of the upper limits on the branching fractions of decays, and Xic02xi0llTheoryPrediction , the experimental upper limits reported in this paper using a uniform-phase-space distribution are higher by an order-or-magnitude than those calculated using theoretical arguments and input from other experimental results. A more precise analysis based on larger data samples collected by Belle II is expected in the future.
VII ACKNOWLEDGMENTS
This work, based on data collected using the Belle detector, which was operated until June 2010, was supported by the Ministry of Education, Culture, Sports, Science, and Technology (MEXT) of Japan, the Japan Society for the Promotion of Science (JSPS), and the Tau-Lepton Physics Research Center of Nagoya University; the Australian Research Council including grants DP210101900, DP210102831, DE220100462, LE210100098, LE230100085; Austrian Federal Ministry of Education, Science and Research (FWF) and FWF Austrian Science Fund No. P 31361-N36; National Key R&D Program of China under Contract No. 2022YFA1601903, National Natural Science Foundation of China and research grants No. 11575017, No. 11761141009, No. 11705209, No. 11975076, No. 12135005, No. 12150004, No. 12161141008, and No. 12175041, and Shandong Provincial Natural Science Foundation Project ZR2022JQ02; the Czech Science Foundation Grant No. 22-18469S; Horizon 2020 ERC Advanced Grant No. 884719 and ERC Starting Grant No. 947006 “InterLeptons” (European Union); the Carl Zeiss Foundation, the Deutsche Forschungsgemeinschaft, the Excellence Cluster Universe, and the VolkswagenStiftung; the Department of Atomic Energy (Project Identification No. RTI 4002), the Department of Science and Technology of India, and the UPES (India) SEED finding programs Nos. UPES/R&D-SEED-INFRA/17052023/01 and UPES/R&D-SOE/20062022/06; the Istituto Nazionale di Fisica Nucleare of Italy; National Research Foundation (NRF) of Korea Grant Nos. 2016R1D1A1B02012900, 2018R1A2B3003643, 2018R1A6A1A06024970, RS202200197659, 2019R1I1A3A01058933, 2021R1A6A1A03043957, 2021R1F1A1060423, 2021R1F1A1064008, 2022R1A2C1003993; Radiation Science Research Institute, Foreign Large-size Research Facility Application Supporting project, the Global Science Experimental Data Hub Center of the Korea Institute of Science and Technology Information and KREONET/GLORIAD; the Polish Ministry of Science and Higher Education and the National Science Center; the Ministry of Science and Higher Education of the Russian Federation, Agreement 14.W03.31.0026, and the HSE University Basic Research Program, Moscow; University of Tabuk research grants S-1440-0321, S-0256-1438, and S-0280-1439 (Saudi Arabia); the Slovenian Research Agency Grant Nos. J1-9124 and P1-0135; Ikerbasque, Basque Foundation for Science, and the State Agency for Research of the Spanish Ministry of Science and Innovation through Grant No. PID2022-136510NB-C33 (Spain); the Swiss National Science Foundation; the Ministry of Education and the National Science and Technology Council of Taiwan; and the United States Department of Energy and the National Science Foundation. These acknowledgements are not to be interpreted as an endorsement of any statement made by any of our institutes, funding agencies, governments, or their representatives. We thank the KEKB group for the excellent operation of the accelerator; the KEK cryogenics group for the efficient operation of the solenoid; and the KEK computer group and the Pacific Northwest National Laboratory (PNNL) Environmental Molecular Sciences Laboratory (EMSL) computing group for strong computing support; and the National Institute of Informatics, and Science Information NETwork 6 (SINET6) for valuable network support.
References
- (1) R. M. Wang, Y. G. Xu, C. Hua, and X. D. Cheng, Phys. Rev. D 103, 013007 (2021).
- (2) Y.-M. Wang, Y. Li, and C.-D. L, Eur. Phys. J. C 59, 861 (2009).
- (3) T. Mannel and S. Recksiegel, J. Phys. G 24, 979 (1998).
- (4) G. Hiller, M. Knecht, F. Legger, and T. Schietinger, Phys. Lett. B 649, 152 (2007).
- (5) J. R. Batley et al. (NA48 Collaboration), Phys. Lett. B 650, 1 (2007).
- (6) H. Park et al. (HyperCP Collaboration), Phys. Rev. Lett. 94, 021801 (2005).
- (7) T. Aaltonen et al. (CDF Collaboration), Phys. Rev. Lett. 107, 201802 (2011).
- (8) R. Aaij et al. (LHCb Collaboration), Phys. Lett B 725, 25 (2013).
- (9) R. Aaij et al. (LHCb Collaboration), J. High Energy Phys. 06 (2015), 115.
- (10) J. P. Less et al. (BaBar Collaboration), Phys. Rev. D 84, 072006 (2011).
- (11) R. Aaij et al. (LHCb Collaboration), Phys. Rev. D 97, 091101 (2018).
- (12) S. Glashow, J. Iliopoulos, and L. Maiani, Phys. Rev. D 2, 1285 (1970).
- (13) R. Aaij et al. (LHCb Collaboration), Nat. Phys. 18, 277-282 (2022).
- (14) R. Aaij et al. (LHCb Collaboration), Phys. Rev. Lett. 122, 191801 (2019).
- (15) R. Aaij et al. (LHCb Collaboration), Phys. Rev. Lett. 113, 151601 (2014).
- (16) R. Aaij et al. (LHCb Collaboration), J. High Energy Phys. 08 (2017), 055.
- (17) R. Aaij et al. (LHCb Collaboration), Phys. Rev. Lett. 125, 011802 (2020).
- (18) R. Aaij et al. (LHCb Collaboration), Phys. Rev. Lett. 126, 161802 (2021).
- (19) R. Aaij et al. (LHCb Collaboration), Phys. Rev. Lett. 131, 051803 (2023).
- (20) A. Abashian et al. (Belle Collaboration), Nucl. Instrum. Methods Phys. Res., Sect. A 479, 422 117 (2002); also, see detector section in J. Brodzicka et al., Prog. Theor. Exp. Phys. 2012, 04D001 (2012).
- (21) S. Kurokawa and E. Kikutani, Nucl. Instrum. Methods Phys. Res., Sect. A 499, 1 (2003), and other papers included in this volume; T. Abe et al., Prog. Theor. Exp. Phys. 2013, 03A001 (2013), and references therein.
- (22) D. J. Lange, Nucl. Instr. and Methods Phys. Res. Sect. A 462, 152 (2001).
- (23) T. Sjstrand, P. Edn, C. Friberg, L. Lnnblad, G. Miu, S. Mrenna, and E. Norrbin, Comput. Phys. Commun. 135, 238 (2001).
- (24) R. Brun et al., CERN Report No. DD/EE/84-1, 1984.
- (25) E. Nakano, Nucl. Instrum. Methods Phys. Res., Sect. A 494, 402 (2002).
- (26) K. Hanagaki, H. Kakuno, H. Ikeda, T. Iijim, and T. Tsukamoto, Nucl. Instrum. Methods Phys. Res., Sect. A 485, 490 (2002).
- (27) A. Abashian et al. (Belle Collaboration), Nucl. Instrum. Methods Phys. Res., Sect. A 491, 69 (2002).
- (28) J.-F. Krohn et al., Nucl. Instrum. Methods Phys. Res., Sect. A 976, 164269 (2020).
- (29) R. L. Workman et al. (Particle Data Group), Prog. Theor. Exp. Phys. 2022, 083C01 (2022).
- (30) J. Yelton et al. (Belle Collaboration), Phys. Rev. D 97, 032001 (2018).
- (31) G. Punzi, eConf C030908, MODT002 (2003).
- (32) J. E. Gaiser, Ph. D. thesis, Stanford Linear Accelerator Center, Stanford University, Report No. SLAC-R-255, 1982.
- (33) S. X. Li et al. (Belle Collaboration), Phys. Rev. D 107, 032003 (2023).
- (34) K. S. Cranmer, Comput. Phys. Commun. 136, 198 (2001).
- (35) X. Y. Zhou, S. X. Du, G. Li, and C. P. Shen, Comput. Phys. Commun. 258, 107540 (2021).