The Environments of Fast Radio Bursts Viewed Using Adaptive Optics
Abstract
We present GeMS/GSAOI observations of five fast radio burst (FRB) host galaxies with sub-arcsecond localizations. We examine and quantify their spatial distributions and locations with respect to their host galaxy light distributions, finding a median host-normalized offset of 2.09 and in fainter regions of the host. When combined with the FRB sample from Mannings et al. (2021), we find that FRBs are statistically distinct from Ca-rich transients in terms of light and from SGRBs and LGRBs in terms of host-normalized offset. We further find that most FRBs are in regions of elevated local stellar mass surface densities in comparison to the mean global values of their hosts. This, in combination with the combined FRB sample trace the distribution of stellar mass, points towards a possible similarity of the environments of CC-SNe and FRBs. We also find that 4/5 FRB hosts exhibit distinct spiral arm features, and the bursts originating from such hosts tend to appear on or close to the spiral structure of their hosts, with a median distance of 0.53 kpc. With many well-localized FRB detections looming on the horizon, we will be able to better characterize the properties of FRB environments relative to their host galaxies and other transient classes.
1 Introduction
Fast Radio Bursts (FRBs) are luminous millisecond-duration bursts of radio waves that originate from extragalactic sources. FRBs were first discovered in 2007 (Lorimer et al., 2007), but it was not until 2017 that the first FRB — FRB20121102A — was precisely localized and associated with a host galaxy at = 0.19, providing the first direct evidence of their cosmological origins (Chatterjee et al., 2017; Marcote et al., 2017; Tendulkar et al., 2017). However, despite the continued FRB detections, and subsequent host galaxy studies (e.g. Tendulkar et al., 2017; Heintz et al., 2020; Chittidi et al., 2021; CHIME/FRB Collaboration et al., 2021; Kirsten et al., 2022; Bhandari et al., 2023; Ryder et al., 2023; Law et al., 2023), the sources of FRBs remain largely a mystery.
While some FRBs are known to repeatedly burst (including periodically or within an activity window), most FRBs are only associated with a single burst and are considered apparent non-repeaters. Repetition aids in localization, as demonstrated by the fact that all of the first precisely localized FRBs were repeaters until the Commensal Real-time ASKAP Fast Transient (CRAFT) survey (e.g. Bannister et al., 2017; Marcote et al., 2017, 2020; Tendulkar et al., 2020; Bhandari et al., 2020a). However, with advances in FRB searches more broadly, the capability to localize apparent non-repeaters to sub-arcsecond scales is sharply increasing. A greater number of FRBs are now being detected with sub-arcsecond and even milli-arcsecond localizations by fast transient searches using radio interferometers (Driessen et al., 2023; Law et al., 2023). A high volume of well-localized FRB detections (multiple per day) from the CHIME Outriggers, CRACO on ASKAP (successor to CRAFT), and DSA-110 looms on the horizon (Kocz et al., 2019; Leung et al., 2021).
Though an FRB-like burst was localized to a galactic magnetar (SGR 1935+2154; Bochenek et al. (2020),) a great diversity of host galaxy characteristics and FRB locations could support the efficacy of multiple progenitor pathways. FRBs have been localized to a globular cluster (Bhardwaj et al., 2021; Kirsten et al., 2022), star-forming dwarf-galaxies (Marcote et al., 2017; Bhandari et al., 2023), and massive spiral galaxies with varying offsets and associations to underlying morphological structure (e.g. Chittidi et al., 2021; Marcote et al., 2020; Mannings et al., 2021; Dong et al., 2023). Thus, more well-localized FRB detections and host observations are necessary to create a larger sample from which we can derive meaningful statistics.
Local environment studies, in conjunction with the characterization of global host properties, have been transformative in our understanding of the origins of other transients such as short- and long-duration gamma-ray bursts (e.g. Fruchter et al., 2006; Fong & Berger, 2013) and various types of supernovae (e.g. Kuncarayakti et al., 2018; Hsu et al., 2023). In this study, we utilize AO imaging from the Gemini South Telescope to study the local environments of five FRBs along with their global host properties to help better understand FRBs and their origins.
Improvements in FRB detection rates and localization precision will have — and are already having — important implications for progenitor studies. A key to understanding FRB sources lies in our ability to characterize the local environments of these bursts. Many such studies have relied on space-based observations to achieve depth and resolution that reaches sub-arcsecond scales (Mannings et al., 2021, etc.). Unfortunately, as the sample of FRBs grows, it may not be feasible to follow up each event with space-based resources. Therefore, we find it necessary to develop a ground-based follow-up approach that utilizes adaptive optics as an alternative for accommodating high-spatial-resolution for high-volume follow-up efforts.
This paper is organized as follows: in Section 2 we describe the sample selection and observations. In Section 3, we present our analysis and results on the light of the host galaxy at the FRB location. In Section 4, we discuss the FRB physical locations and offsets relative to the structure of their host galaxies. We discuss these results in Section 5 and conclude in Section 6. Throughout the paper, we employ a Planck cosmology with km s-1 Mpc-1, , and (Planck Collaboration et al., 2016).
2 FRB Data and Sample Selection
2.1 Sample of FRB Host Galaxies
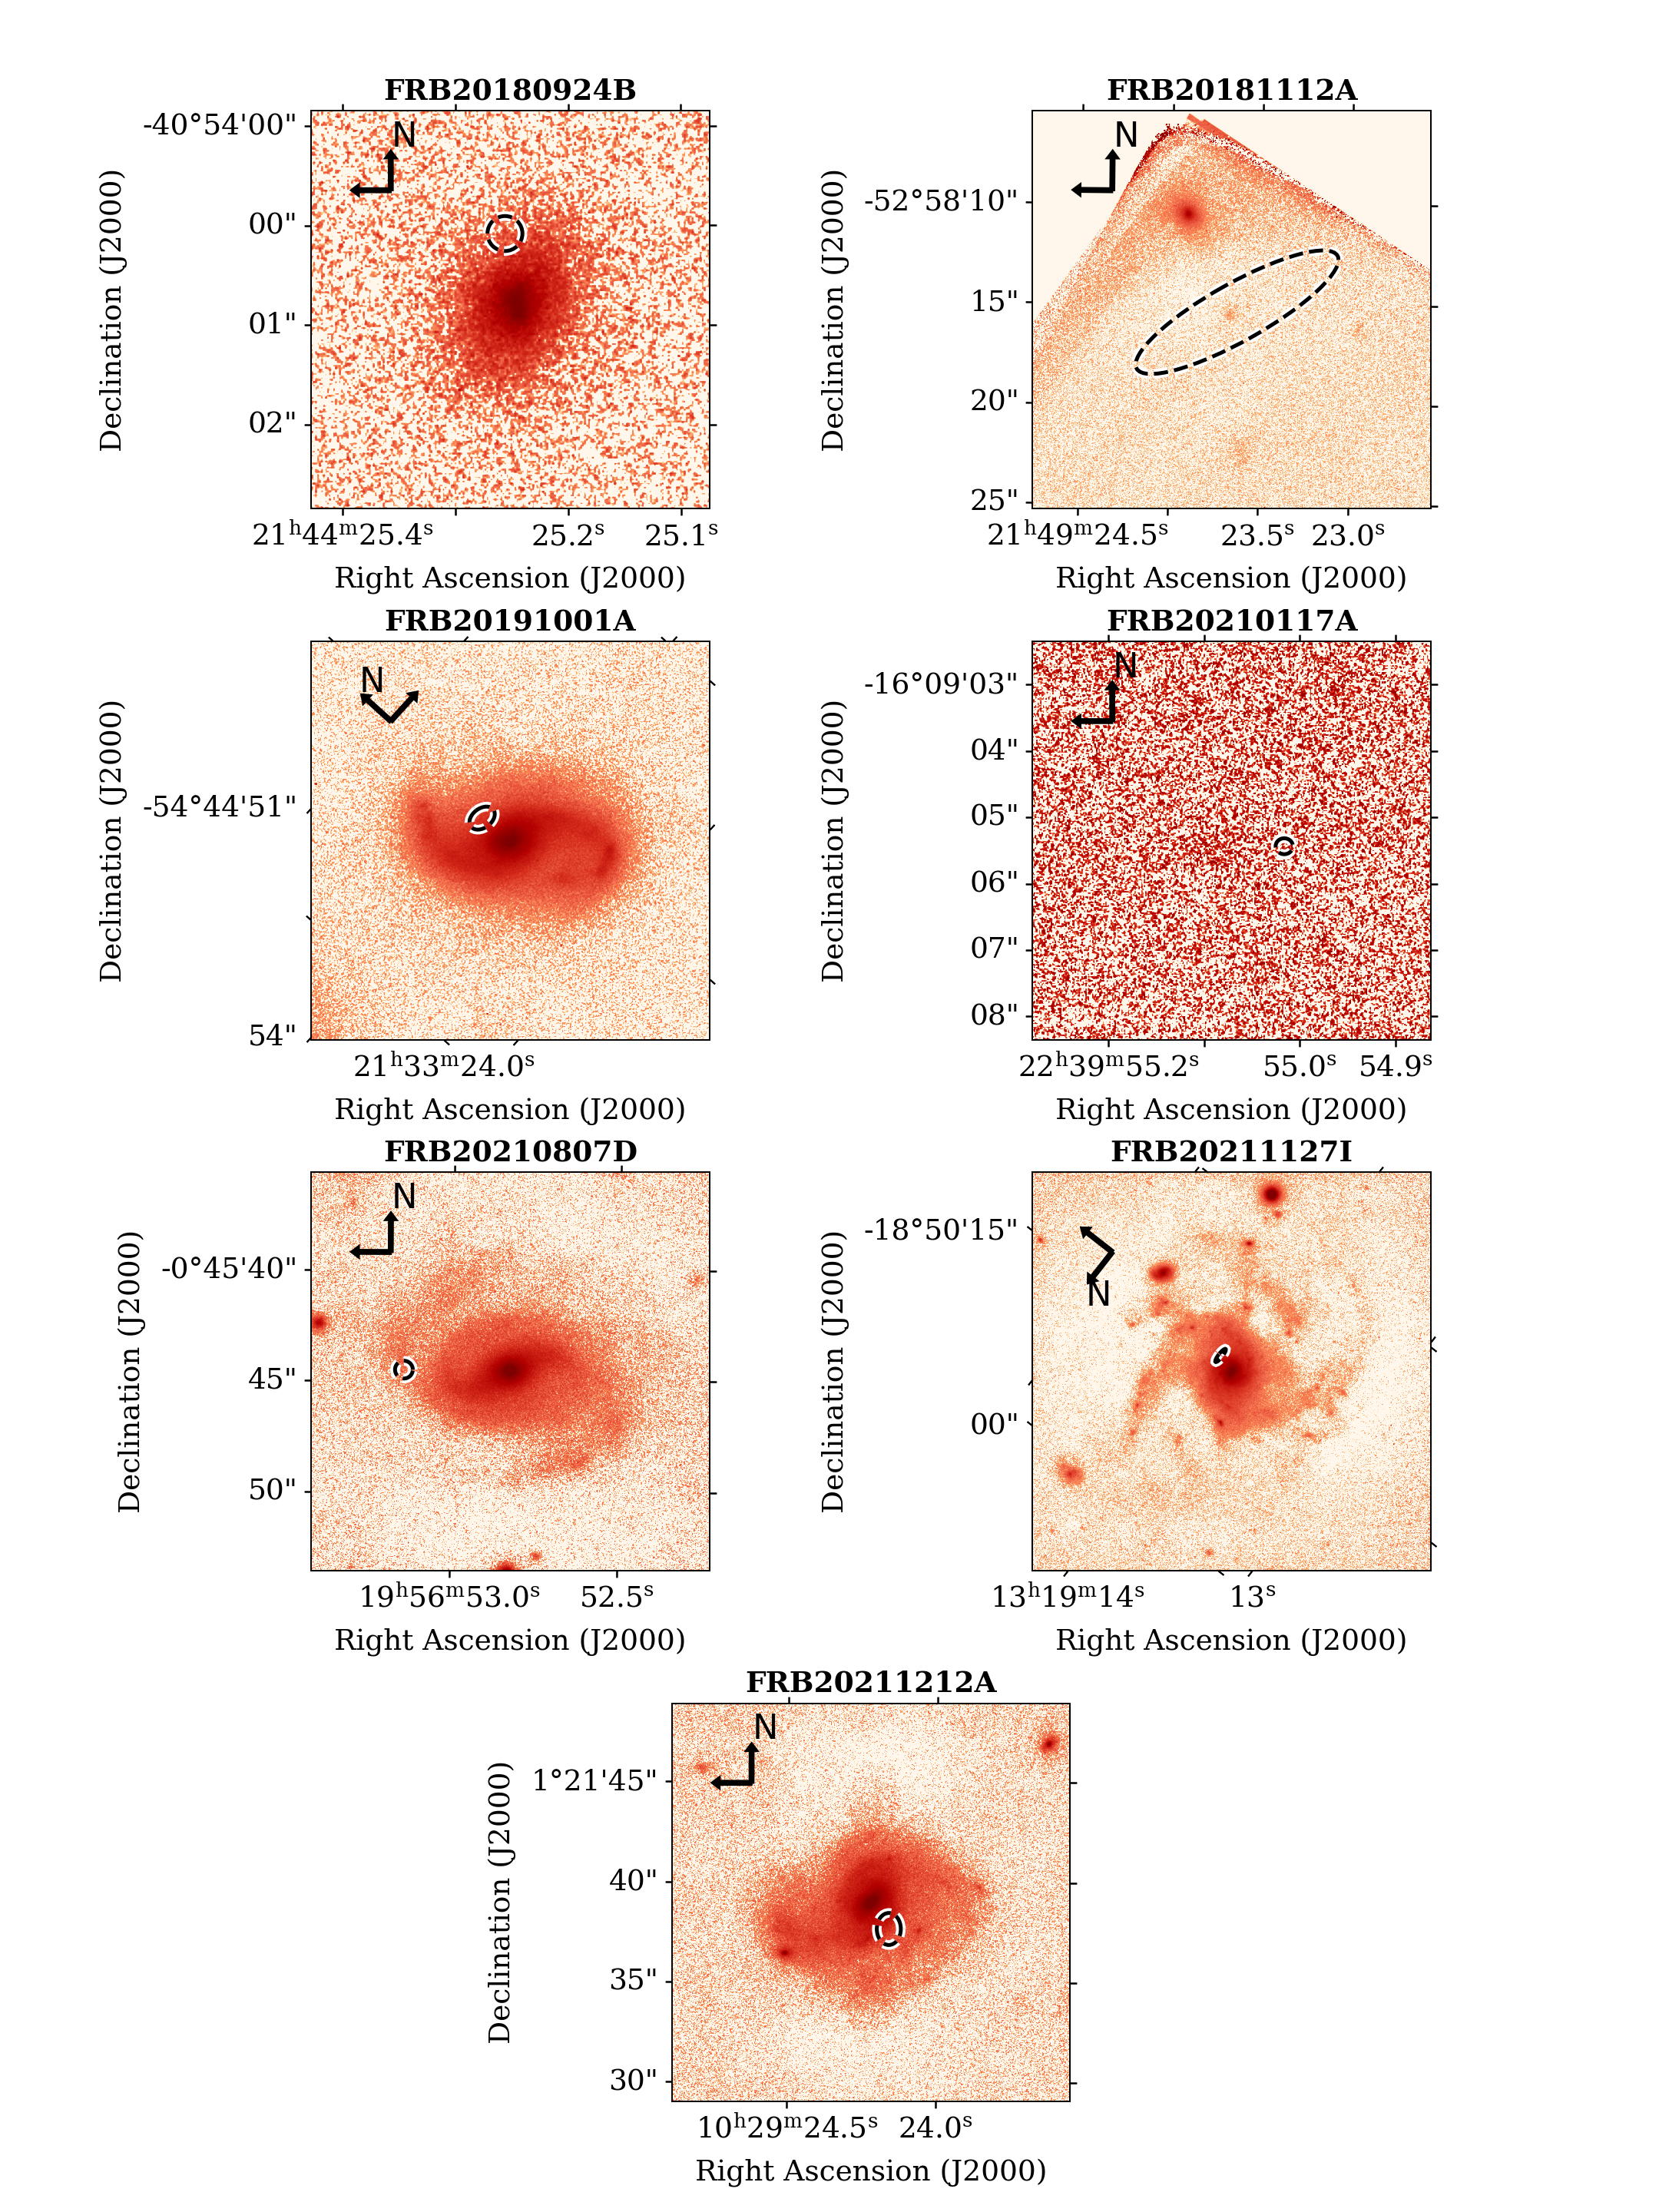
Here we present observations of seven FRB host galaxies obtained with the Gemini South Adaptive Optics Imager (GSAOI) with the Gemini Multi-conjugate adaptive optics System (GeMS) on Gemini South. The data for these FRB host galaxies were collected between July 2021 and April 2022 as part of the programs GS-2021A-C-2, GS-2021B-C-3, and GS-2022A-C-2.
All of the host galaxies in our sample have spectroscopically confirmed redshifts (Heintz et al., 2020; Bhandari et al., 2020a, 2023; Glowacki et al., 2023) and their FRBs were discovered with the Australian Square Kilometre Array Pathfinder (ASKAP) telescope through the CRAFT survey. These are considered secure associations with PATH (Aggarwal et al., 2021) posterior probabilities of . None of the bursts in this sample have yet been observed to repeat. Many of these FRBs have been presented in previous works (e.g. Prochaska et al., 2019; Heintz et al., 2020; Mannings et al., 2021; Bhandari et al., 2023; Glowacki et al., 2023), but the hosts of FRBs 20210807D and 20211212A are newly presented here. In a companion paper, we describe VLT imaging of the hosts of FRBs 20210807D, and 20211212A, including the FRB localization (Deller et al., in prep). To be included in this sample, the hosts also had to be in a field that satisfied the guide star requirements outlined in Section 2.2.
2.2 Host Observations
Laser guide star adaptive optics-assisted near-IR observations of the FRB host galaxies were obtained with GeMS/GSAOI on the 8.1 m Gemini South telescope. GSAOI is fed by GeMS and covers an field-of-view (FoV) with a pixel scale of pixel-1, delivering close to diffraction-limited images between 0.9 and 2.4 m. Uniform AO correction across the full GeMS FoV requires up to three natural guide stars (NGS) in addition to the five-point sodium laser guide star (LGS) pattern. However partial AO correction is still possible with two (or even one) NGS of sufficient brightness ( mag) within the patrol field of the wavefront sensor probes, as well as one on-detector guide window star ( mag) within the FoV of any of the four GSAOI detectors at all dither positions.
Each target was imaged in the filter using a nine-step dither pattern, with 2 coadds of 60 sec at each position and a step size large enough () to cover the gaps between the detectors. The targets were positioned within one of GSAOI’s four detectors, with the array orientation set by the locations of the NGS. Including overheads and interruptions due to aircraft and satellite avoidance, a complete observation required 1–1.5 hours. These observations are summarized in Table 1.
For 20210117A, the host was not detected with GeMS/GSAOI at the FRB coordinates and only 5/9 dithers were completed. This host is a faint dwarf galaxy as discussed by Bhandari et al. (2023); as is consistent with our non-detection.
| FRB | RAHost | DecHost | z | NGS | Date | Exposure Time | ||
|---|---|---|---|---|---|---|---|---|
| (J2000) | (J2000) | (arcsec) | () | (UT) | (s) | |||
| 20180924B | 21h44m25.24s | -40d54m00.86s | 0.13 | 24.55 | 3 | 2021 Aug 1 | 540 | |
| 20181112A | 21h49m23.66s | -52d58m15.28s | 0.13 | 7.41 | 1 | 2021 Aug 2 | 480 | |
| 20191001A | 21h33m24.43s | -54d44m54.29s | 0.29 | 53.70 | 2 | 2021 Aug 1 | 1860 | |
| 20210117A | 22h39m55.07s | -16d09m05.37s | - | 0.39 | 1 | 2021 Aug 2 | 240 | |
| 20210807D | 19h56m52.82s | -00d45m44.55s | 1.03 | 93.33 | 3 | 2021 Sep 13 | 1020 | |
| 20211127I | 13h19m13.95s | -18d50m16.13s | 0.28 | 24.55 | 3 | 2022 Apr 15 | 2040 | |
| 20211212A | 10h29m24.22s | +01d21m38.99s | 0.71 | 19.05 | 1 | 2022 Apr 15 | 1140 |
Note. — RAHost and DECHost are the host coordinates in the GeMS/GSAOI image WCS. was calculated by summing the RA and Dec errors in quadrature. For 20181112A represents the uncertainty in the host position due to astrometric corrections. For 20210117A no host was detected and the astrometry of the image was not corrected, thus we do not have a value for . NGS is the number of natural guide stars used during observation.
2.3 Image Processing
The data were retrieved from the Gemini Observatory Archive (GOA) at NSF’s NOIRLab. The data were reduced using the Gemini DRAGONS (Data Reduction for Astronomy from Gemini Observatory North and South; Labrie et al. 2019) package version 3.1.
The dark current is very low for GSAOI (), thus dark subtraction was not necessary. A master-flatfield was created from a series of lamp-on and lamp-off exposures. A stack was made for each, and the lamp-off stack was then subtracted from the lamp-on stack. This result was normalized. The static bad pixel masks (BPMs) were fetched from the GOA. The science files were then flatfield-corrected, aligned, and stacked. The final reduced images are shown in Figure 1.
2.4 Astrometry and Uncertainties
We performed absolute astrometry using the Gaia DR2 and Gaia DR3 catalogs. To do this, we utilized photutils.segmentation to create a segmentation map of each respective image. We then crossmatched these and centroids with the Gaia sources within 3 arcseconds of these coordinates. For the cases where the WCS information of the image is offset by more than 3 arcseconds, a manual correction was done by crossmatching the and centroid values with the determined Gaia sources based upon a visual (by-eye) association. A new WCS header was then created with this information. We calculated the RMS uncertainty of the astrometry of the images as .
Due to lack of Gaia sources in the fields for 20181112A and 20211212A, the process above was followed but using the Dark Energy Survey (DES) (Abbott et al., 2021) and Panoramic Survey Telescope and Rapid Response System (Pan-STARRS) (Chambers et al., 2016; Flewelling et al., 2020) respectively, as reference catalogs from which to extract stellar positions.
We then used galight (Ding et al., 2021) to determine the host galaxy centroid positions and their associated uncertainties (). Inputs for galight included the radius for cutout around the galaxy and guesses for the galaxy centroid position and position angle. The positions and values are listed in Table 1.
Since we analyze the host light at the FRB location, the associated localization uncertainty () is also incorporated into our calculations. () includes the statistical and systematic uncertainties from the FRB localizations (Table 2).
3 Light at FRB Locations
Placing transients in relation to light (both stellar, and from ionized gas) in their hosts can be an important piece of evidence for tying them to a source or progenitor event (Fruchter et al., 2006; Fong et al., 2010; Fong & Berger, 2013). In the infrared, we are most sensitive to the distribution of the older (more numerous) stellar populations. Here we complete morphological studies of each host and study the light at the location of the burst. In combination with one another, these analyses provide information on the local environment of the burst and therefore likely sources. For FRB 20191001A it was found that the coordinates published previously in other works were offset in the incorrect direction in declination. The coordinates presented in this paper are the updated coordinates.
3.1 Galaxy Light Profile Fitting
We use galight (Ding et al., 2021) to fit the light profile for five of the FRB hosts, to determine the half-light radii () and study low-surface brightness structures and host morphologies. Owing to the faintness of the hosts for FRBs 20181112A and 20210117A, we were unsuccessful at creating a segmentation image with galight and could not complete related analyses. These analyses are also limited by the relatively poor localization precision of FRB20181112A, where any relationship to the underlying sub-structure would be difficult to determine and, therefore, interpret.
Using galight, we first created a cutout around the host galaxy and masked any unwanted sources. We then defined the coordinates of at least four stars in the original image and created PSF models to choose from and utilize. We used the galight model to compute residuals from Sérsic profile fits, where the Sérsic index defines the steepness of the radial surface brightness profile. A larger value indicates a steeper inner profile and an extended outer wing. The hosts of FRB 20180924B, FRB 20211127I, and FRB 20211212A were fit using two Sérsic components, equating to a disc and a bulge. FRBs 20191001A and 20210807D were fit utilizing three Sérsic components.
The galight half-light radii are presented in Table 3. The values correspond to the effective radius of the disk component of the fit produced by galight. The values range from to . We then converted these angular offsets to physical offsets using the host redshifts and Planck 15 cosmology as detailed in Section 1. The physical effective radii range from 2.07 to 6.67 kpc, those values belonging to the host galaxies for FRB20180924B and FRB20191001A, respectively.
| FRB | RAFRB | DecFRB | PA | ||
|---|---|---|---|---|---|
| (J2000) | (J2000) | (arcsec) | (arcsec) | (degrees) | |
| 20180924B | 21h44m25.25s | -40d54m00.10s | 0.18 | 0.18 | 0 |
| 20181112A | 21h49m23.62s | -52d58m15.39s | 5.75 | 1.44 | 120 |
| 20191001A | 21h33m24.42s | -54d44m53.58s | 0.27 | 0.19 | 79 |
| 20210117A | 22h39m55.01s | -16d09m05.45s | 0.13 | 0.12 | 90 |
| 20210807D | 19h56m53.14s | -00d45m44.49s | 0.40 | 0.40 | 0 |
| 20211127I | 13h19m14.08s | -18d50m16.69s | 0.80 | 0.20 | 0 |
| 20211212A | 10h29m24.16s | +01d21m37.67s | 0.80 | 0.60 | 0 |
Note. — a refers to the angular size of the semi-major axis describing the 1 statistical () and systematic () uncertainties added in quadrature. The same applies to b, the semi-minor axis. PA refers to the position angle of the error ellipse on the sky. For FRB 20191001A it was found that the coordinates published previously in other works were offset in the incorrect direction. The coordinates presented here are the updated coordinates.
The residual images from the galight fits are shown in Figure 2. After removing the smooth light of the galaxies from the galight Sèrsic models, the spiral structure is quite apparent for four out of five hosts, with hints of spiral structure for the host of FRB 20180924B. This host provides a test case for comparisons between space- and ground-based imaging. Though the HST image (and associated residual) presented in Mannings et al. (2021) showed more extended, spiral structure, GeMS+GSAOI does somewhat recover the structure in this host as evidenced by Figure 2. The spiral structure for 20211212A is newly presented here with further discussion in Deller et al. (in prep). The spiral structure for 20180924B was previously known (Mannings et al., 2021), as well as the structures for 20191001A (Bhandari et al., 2020b), 20210807D, and 20211127I (Glowacki et al., 2023).
While the spiral structure is already apparent in Figure 1, the arms are more defined in the residual images and thus better for the spiral arm offset analysis described in Section 4.2. For each host, the FRB occurs either on or close to a spiral arm of the galaxy. The host of FRB 20211127I is now one of only four reported FRBs with a clear bar structure observed in the host galaxy (along with the hosts of FRB 20190608B, FRB 20201124A and FRB 20220319D; Chittidi et al., 2021; Dong et al., 2023; Ravi et al., 2023).
| FRB | i | Host Magnitude | Limiting Magnitude | |||
|---|---|---|---|---|---|---|
| (arcsec) | (kpc) | (degrees) | (AB mag) | (AB mag) | () | |
| 20180924B | 51 | 28.0 | ||||
| 20191001A | 59 | 26.4 | ||||
| 20210807D | 60 | 27.1 | ||||
| 20211127I | 33 | 28.0 | ||||
| 20211212A | 40 | 25.8 |
Note. — FRB20181112A and FRB20210117A are not included in these calculations due to the large FRB uncertainty relative to the size of the host and the detection not being significant enough for the host to be identified by galight (see §3.1). Limiting Magnitudes correspond to 5.

3.2 Stellar Mass Surface Density
Due to the high precision sub-arcsecond localizations of the FRBs in this sample as matched by the image resolution, photometric measurements could be made at the immediate burst position. The following photometric analysis was modeled after that performed by Mannings et al. (2021) on HST imaging in service of better understanding the local environment properties, and how they compare to global host properties.
We measured the stellar mass surface density () at the location of the FRB by determining the IR surface brightness within the FRB localization region. We account for the uncertainty in the FRB localization in our estimate. We do so by computing a weighted average where the relative weights are given by a 2D Gaussian probability distribution function (PDF) along the axes of the localization uncertainty. We create circular apertures with a radius of 3 pixels, equating to the size of the PSF, at each pixel within the FRB localization. These aperture sums are then weighted accordingly, with the resolution of the Gaussian grid and binning being limited by the image pixel scale. We then divide this weighted average by the area of the aperture to get an aperture sum per square arcsecond, or surface brightness.
We separately determine the magnitude of the host galaxies using the GSAOI zero-point and the corresponding flux. The magnitude of each host galaxy is presented in Table 3. We then calculate the ratio between the flux at the FRB site to the flux of the entire galaxy and adopt the total stellar mass estimates from Heintz et al. (2020) and Bhandari et al. (2020a) to estimate the host (Table 3). The relationship between the local stellar mass surface density at the FRB location and the average stellar mass surface density of the entire galaxy is shown in Figure 3.
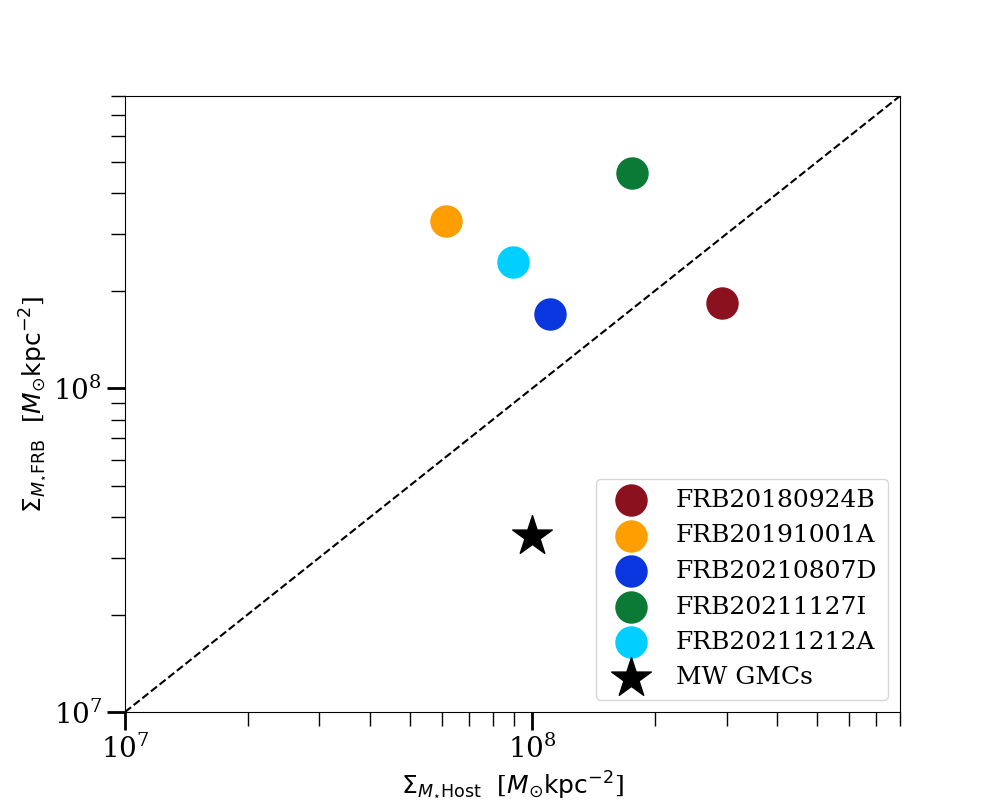
Figure 3 reveals that the stellar mass surface densities at the FRB locations are elevated compared to the global stellar mass surface densities of their host galaxies for 4/5 hosts. The other host (20180924B) has a stellar mass surface density lower at the FRB location in comparison to the galaxy as a whole, however this value is fairly close to the 1:1 line. Error bars for each of the points are significantly smaller than the marker size. We use Milky Way giant molecular clouds (GMCs; Lada & Dame 2020) as a means of comparing the locations of FRBs to sites of active star formation within the Milky Way. The stellar mass surface density at the FRB positions relative to their hosts is three times or more than that shown for the Galactic GMCs, which is ⊙ kpc-2 according to Lada & Dame (2020).
3.3 Luminosity Constraints on Background Galaxies
With hosts such as those of FRBs 20121102A (Tendulkar et al., 2017), 20190711A (Heintz et al., 2020) and 20210117A(Bhandari et al., 2023), associations show that FRBs can originate in less massive – and therefore fainter – hosts than the primarily massive, star-forming hosts shown in this sample. With our high-resolution, deep AO imaging, we may test the scenario in which the true host is a dwarf and possible companion to the putative host, along with the scenario where a higher-z, background galaxy may be the true host.
To put a constraint on a fainter host galaxy candidate at the FRB position, we use the galight residual images as shown in Figure 2, where the smooth elliptical components from the putative host have been removed to derive point-source limiting magnitudes (shown in Table 3) at the FRB position. We calculate the residual flux using a circular aperture of in diameter and compute the net standard deviation for the pixels within this aperture. We then take the flux measurement with five times the net standard deviation as the upper limit on any point source flux that could be detected from the residual images. Our limits and visual inspection of the images indicate that there are no galaxies brighter than an apparent magnitude of 26 at the FRB position. At these redshifts, the limits of are significantly deeper than the luminosity of even the faintest known dwarf galaxies associated to FRBs, namely (e.g. Bassa et al., 2017; Bhandari et al., 2023).
3.4 Fractional Flux
We next examine the location of the FRBs relative to their host galaxy light distributions, a measure known as fractional flux (). is independent of host size and morphology, as the measurement determines the fraction of host light fainter than the flux at the burst position. A value of 1 would indicate that the transient occurred in the brightest location within the host. This measure follows the calculation used in Fruchter et al. (2006), which was an important factor in differentiating Long Gamma Ray Bursts (LGRBs) from core collapse supernovae (CC-SNe) locations in their respective hosts. In the IR, as with the K-band images presented here, we are able to probe the relationship between FRBs and the distribution of stellar mass in their hosts. A higher fractional flux in this regime points towards FRB locations coincident with high concentrations of stellar mass — like the centers of galaxies.
To determine , we create a 2D cutout around each host galaxy large enough to include background pixels. We then identify the pixels that lie within the FRB localization ellipse. The fractional flux for a given (th) pixel within the localization ellipse is given by:
| (1) |
where is the flux value in pixel i. We then weight the values by the 2D Gaussian distribution of the FRB localization ellipse. The values for each FRB can be found in Table 4. The values range from 0.24 to 0.64 with a median of 0.59. The lower and upper limits were set by FRBs 20211127I and 20211212A, respectively.
We combine our sample with the Mannings et al. (2021) sample to determine the distribution of these values for a larger sample of FRBs. The additional hosts that were chosen are those with WFC3/IR F160W imaging that were not included in the sample imaged with Gemini (FRB 20121102A, FRB 20190102C, FRB 20190608B, FRB 20190711A, and FRB 20190714A). This will hereafter be referred to as the combined FRB sample, whereas the GeMS/GSAOI sample will be referred to as such.
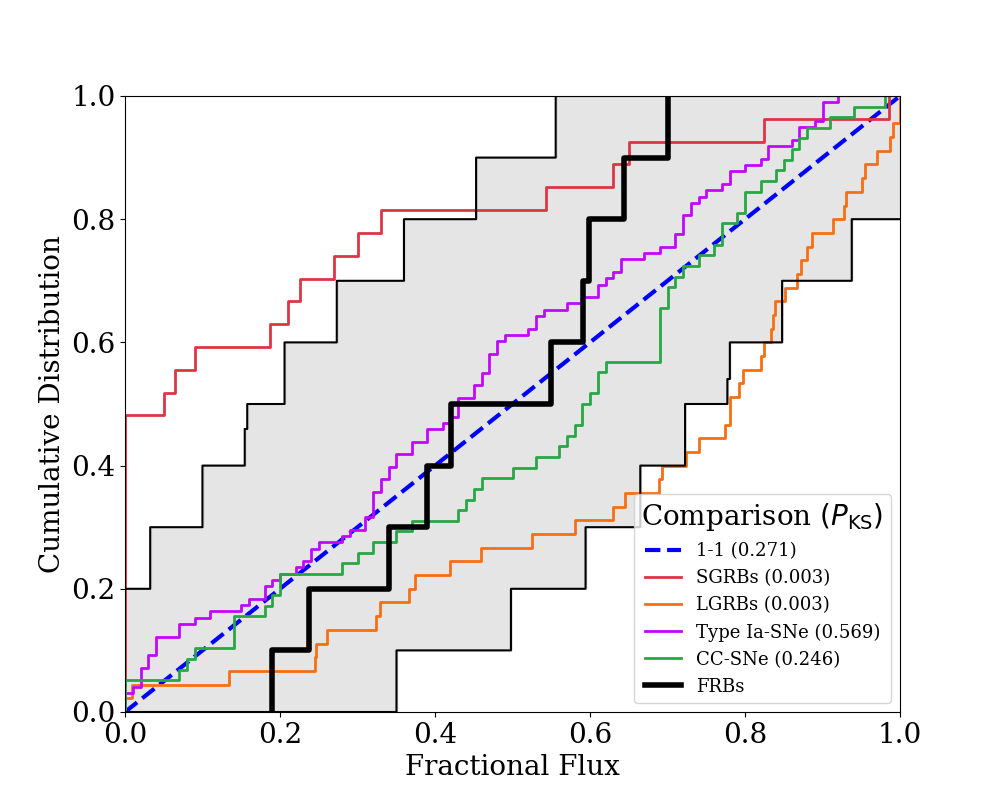
In order to determine the uncertainty on the cumulative distributions, we utilize the method of Heintz et al. (2020) to create realizations of asymmetric Gaussian PDFs using the calculated offset errors for each FRB. Finally, we use a bootstrap method to compute a cumulative distribution function (CDF) of the bootstrapped sample and calculate the median of these CDFs, in addition to the lower and upper bounds for each bin. Figure 4 shows the fractional flux CDF for the combined FRB sample along with the cumulative distributions of other transient class samples pulled from other publications (Fong et al., 2010; Fong & Berger, 2013; Wang et al., 2013; Lunnan et al., 2015; Blanchard et al., 2016).
In Figure 4 we can see that the FRB cumulative distribution (shown in black) differs markedly from the distributions of Short Gamma Ray Bursts (SGRBs, red) and LGRBs (orange). The FRB distribution appears similar to that of the 1-1 line (blue), Type-Ia SNe (purple) and CC-SNe (green). However, due to the small sample size (10 FRBs) and the FRB positional uncertainties, the overall uncertainty is substantial and cannot be ignored. We explore these relationships with more rigorous statistical testing.
Using the Kolmogorov-Smirnov (KS) test, we test the null hypothesis that FRBs do not come from the same underlying distribution as the samples of other transient classes shown here. We require in order to reject this null hypothesis. We test against CC-SNe, SGRBs, LGRBs, and Type Ia SNe. The resulting values are shown in the legend of Figure 4. We find that the KS-test rejects the null hypothesis that SGRBs or LGRBs are from the same underlying population as FRBs. CCSNe, and Type Ia-SNe could not be rejected.
4 FRB Physical Locations and Offsets
In this section, we study the locations of the FRBs in our sample with respect to their host galaxy centers and spiral structure. We introduce their angular and physical offsets ( and , respectively); their “host-normalized” offsets (/), which are normalized by the half-light radii of their host galaxies; and the locations with respect to the closest spiral arm of their host galaxy (spiral offset; SO). We then compare the galacto-centric offset distributions to distributions of other transient events as we did for in Section 3.4. We also investigate the relationship between FRBs and spiral arms and how this compares to other transient populations and previous FRB studies.
4.1 Galacto-centric Offsets
The shape, size, and orientation of FRB localization ellipses must be taken into account when determining the angular, physical, and host-normalized offsets from the center of their host galaxies. We define ellipsoidal regions representing the uncertainty in the FRB position relative to its host galaxy nucleus.
Following the scheme in Mannings et al. (2021), we apply a weighted 2D Gaussian probability distribution centered on the FRB localization ellipse to determine the mean and variance in . Because FRB 20210117A is a non-detection, it is not included in this analysis. FRB 20181112A is also not included due to (i) the large uncertainty relative to the size of the host and (ii) the host not being identified by galight at sufficient significance (see §3.1).
| FRB | R | SOmin | SOmin | |||
|---|---|---|---|---|---|---|
| (arcsec) | (kpc) | (arcsec) | (kpc) | |||
| 20180924B | ||||||
| 20191001A | ||||||
| 20210807D | ||||||
| 20211127I | ||||||
| 20211212A | ||||||
| Median |
The projected angular offsets () range between and , with a median value of . These values are included in Table 4. We then converted these angular offsets to physical offsets using the host redshifts and our cosmological model assumed (Section 1). The physical offsets range from 2.0 to 11.9 kpc, with a median value of 3.4 kpc. For comparison, we determine the median of the distribution of galactic globular clusters presented in Baumgardt & Vasiliev (2021), which is 7.7 kpc. Finally, we used the half-light radii (see Section 3.1) of the hosts to determine the host-normalized offsets . The median host-normalized offset for this sample is 2.1. This is larger than the median expected offset if FRBs traced the locations of stars in their disks and fell within the half-light radius of the host galaxy (i.e., ).
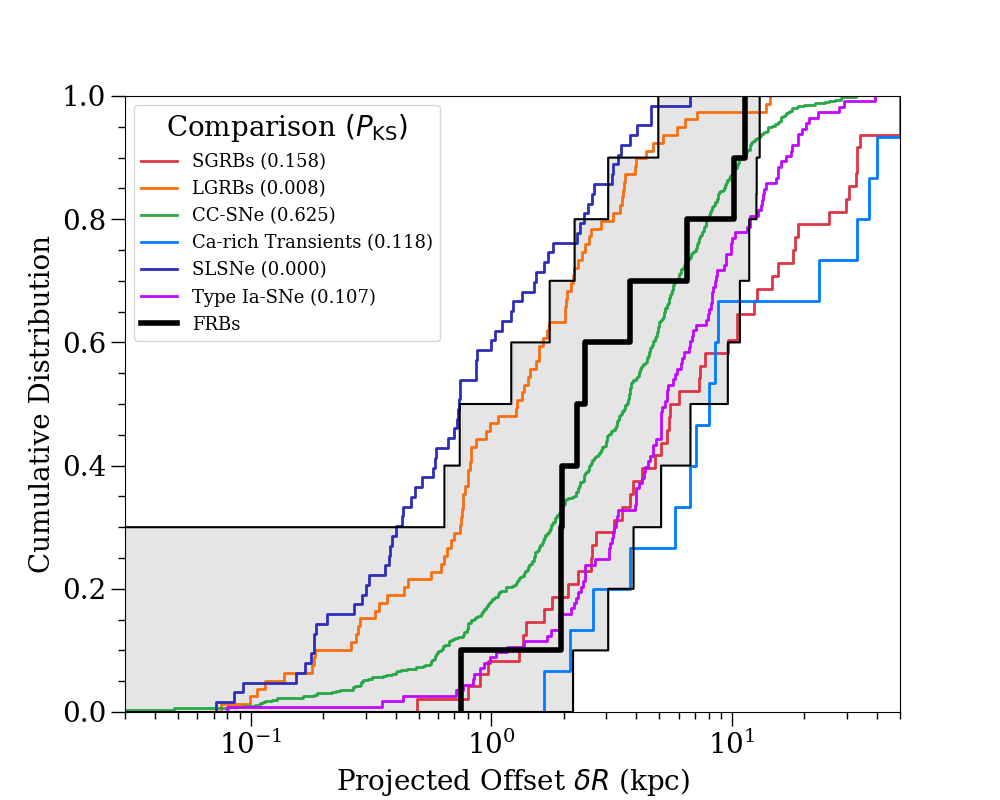
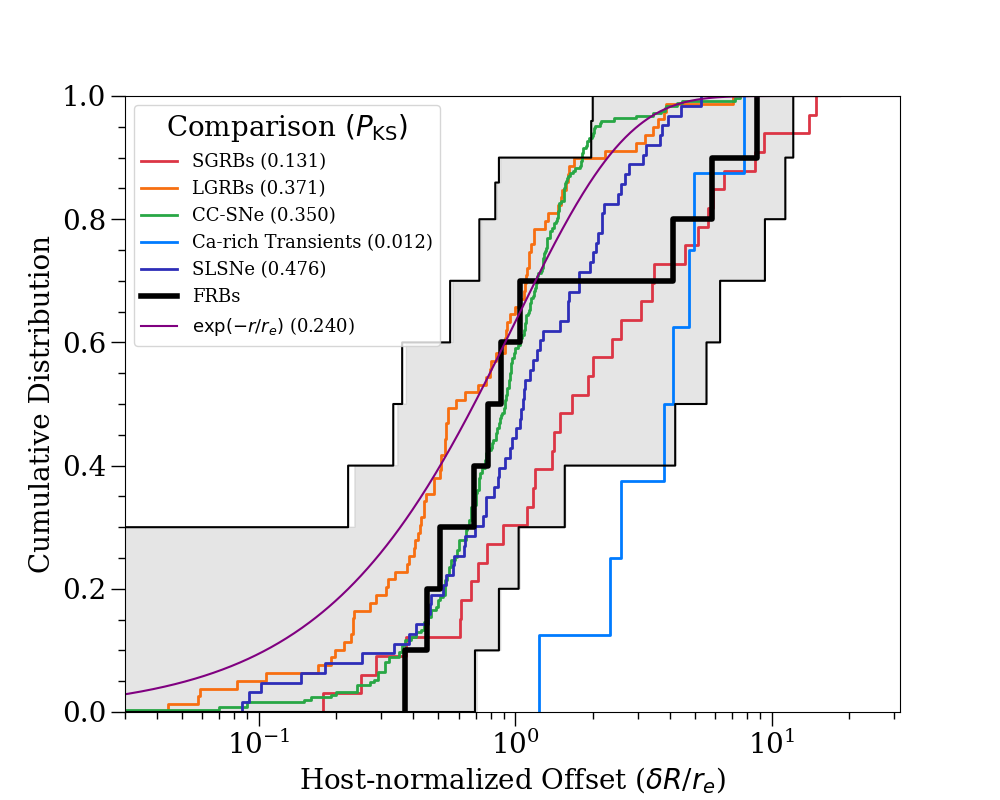
To determine the uncertainty on the cumulative distributions, we again utilize the method of Heintz et al. (2020) as described in Section 3.4. In Figure 5, the left panel shows the physical offset CDF for the combined sample, and the right panel shows the host-normalized CDF for the combined sample of FRBs. The gray shaded region depicts the uncertainty for each distribution.
Again, we utilize the KS test, with a requirement in order to reject the null hypothesis. We test against CCSNe Schulze et al. (2021)), SGRBs and LGRBs Fong et al. (2010); Fong & Berger (2013); Blanchard et al. (2016)), Ca-rich transients (Lunnan et al., 2017; De et al., 2020), Super-luminous Supernovae (SLSNe; Lunnan et al. (2015); Schulze et al. (2021)) and Type Ia supernovae (Uddin et al., 2020). We also test against a distribution of magnetars as modeled in Safarzadeh et al. (2020). The resulting values are shown in the legend of Figure 5.
We find that, with the resulting values, the KS-test rejects all transient samples except CC-SNe for projected offsets. In the case of host-normalized offsets, only Ca-rich transients are rejected.
4.2 Offset from Spiral Arms
To investigate the location of FRBs relative to the spiral arms of their host galaxies, we determined the minimum distance from the FRB to the closest projected spiral arm in the host galaxy. This spiral arm offset is referred to as SOmin.
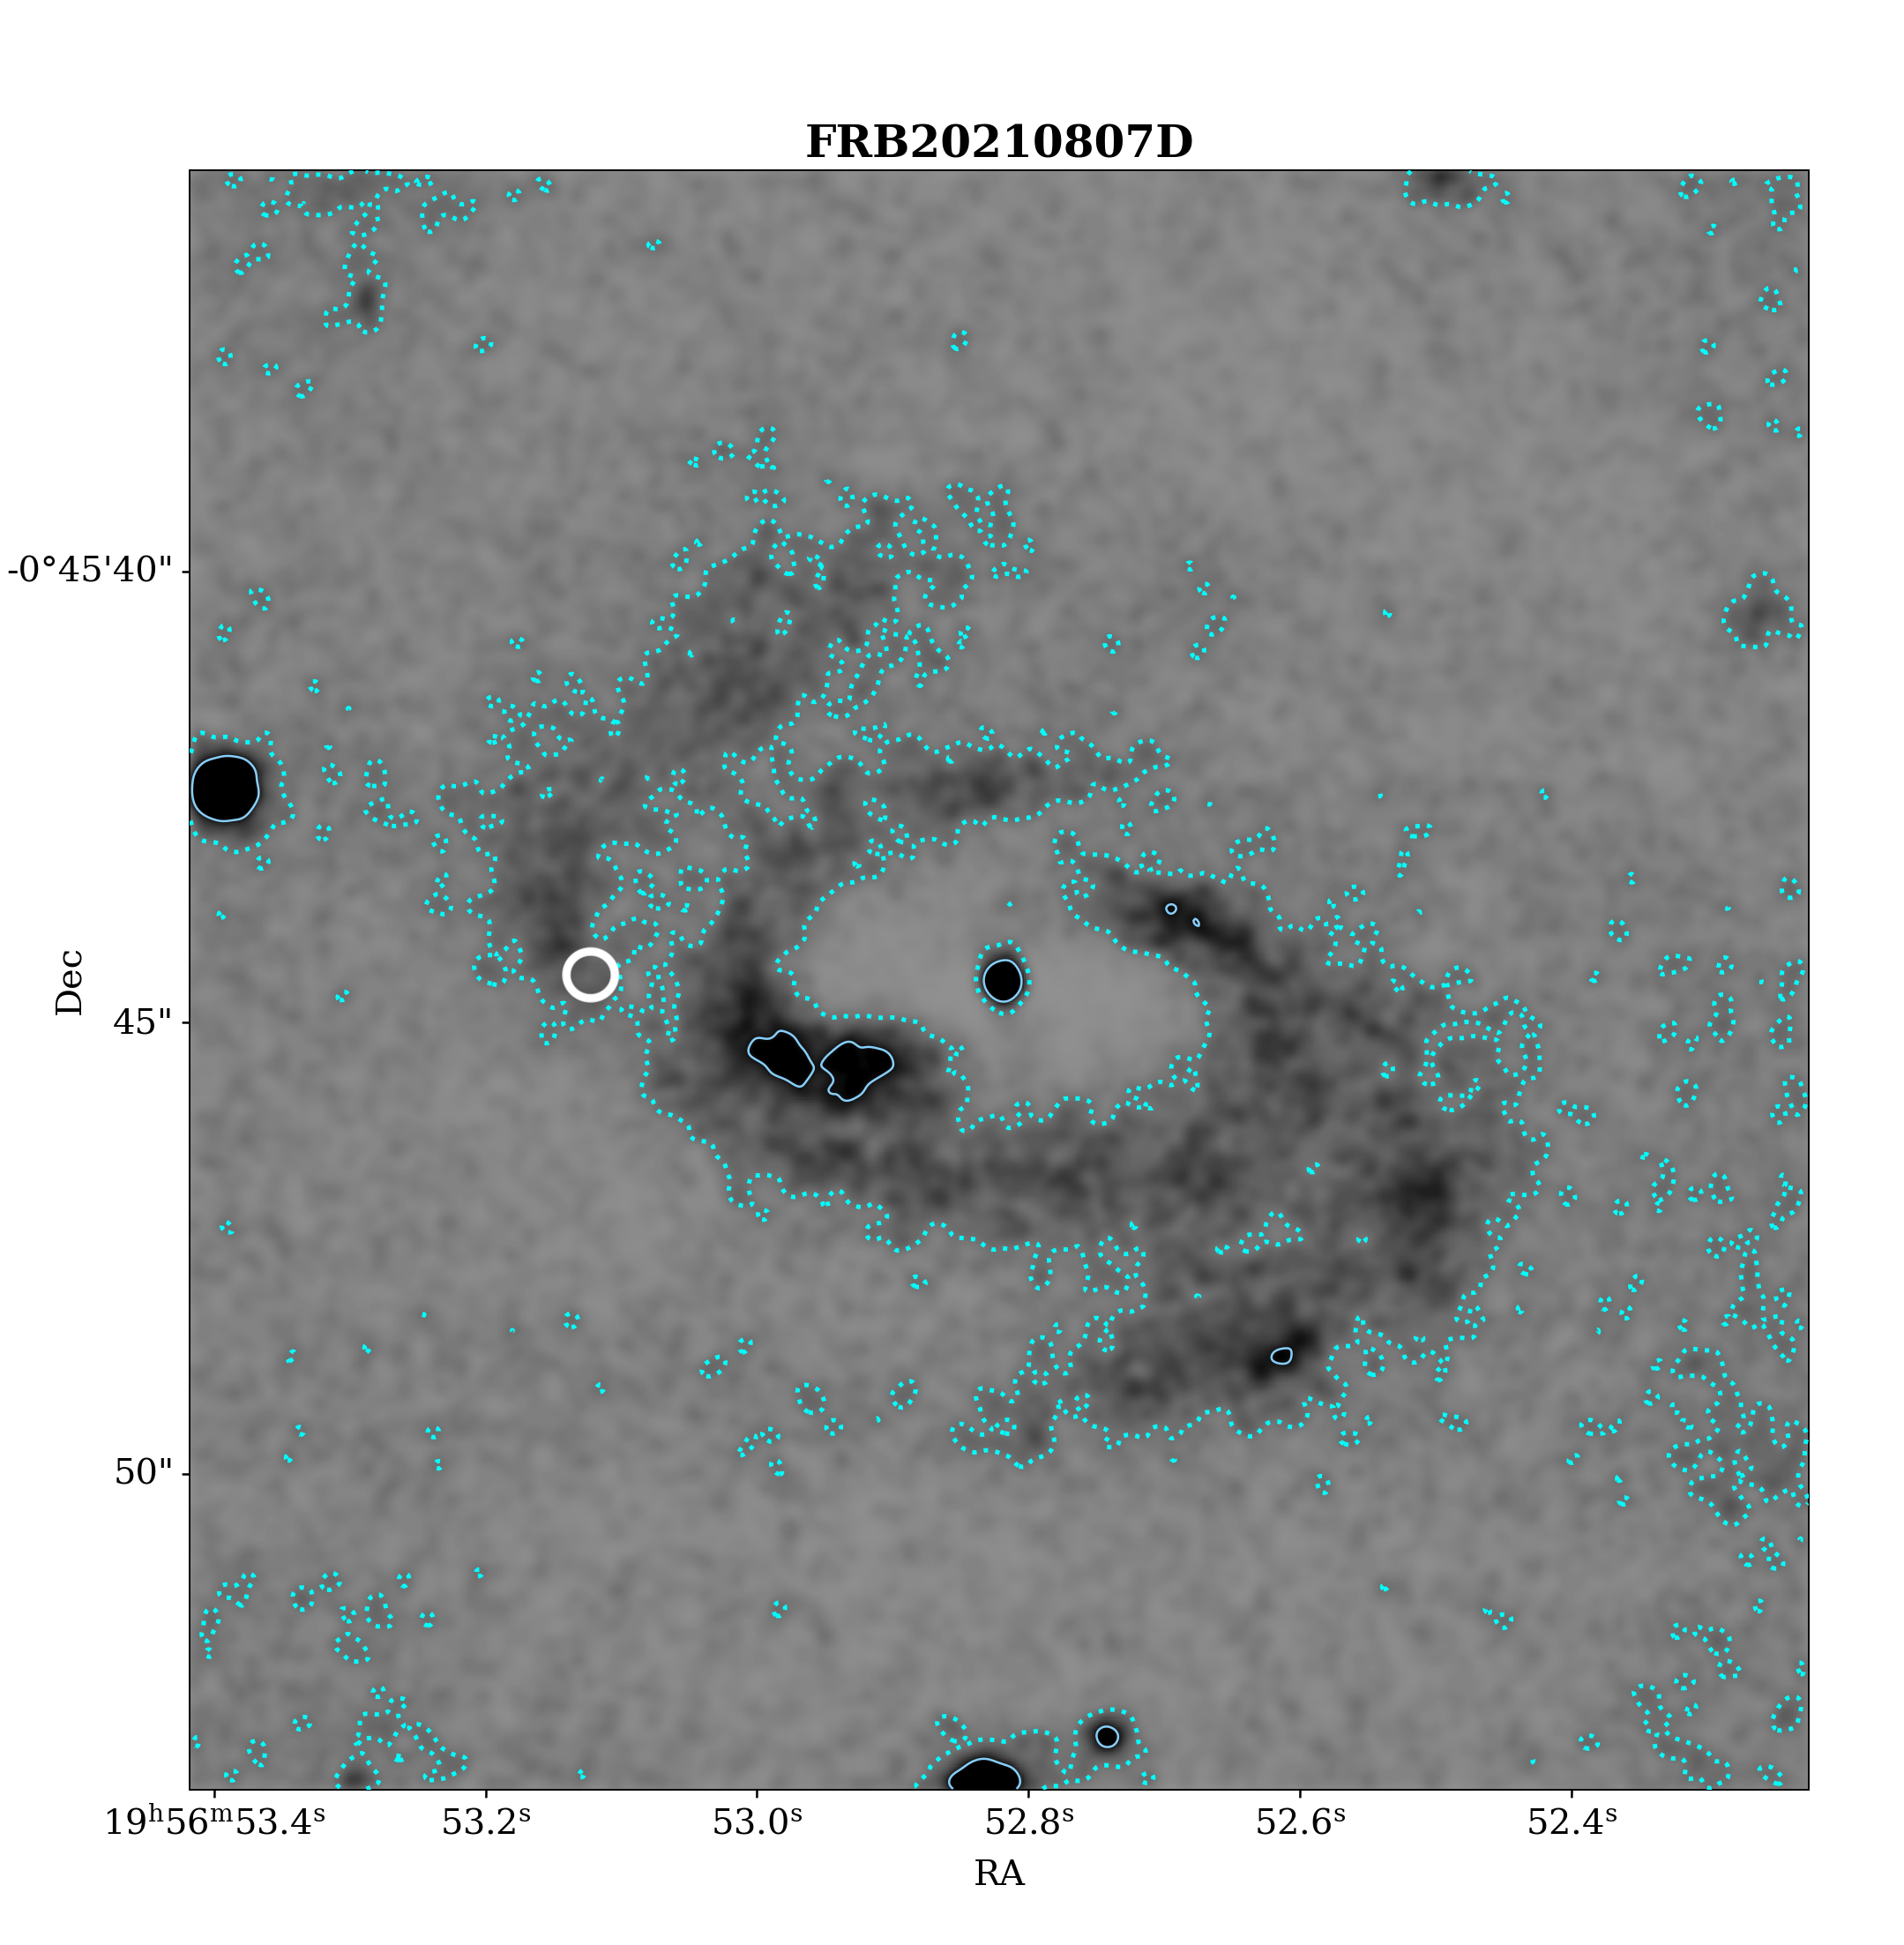
To estimate SOmin, we first convolve the galight residual image (the original image minus the galight model; see Section 3.1) using a smoothing kernel of 5 pixels. We then mask all values below a threshold of 0.6 — chosen after experimentation — to isolate pixels not associated with spiral arms. Custom masks were then created for each host to mask sources clearly not associated with the spiral arms of the host (e.g. nearby galaxies, or field stars in projection). All unmasked pixels were taken as part of the host galaxy spiral arm structure. We then calculated the minimum, 2D Gaussian weighted offset between the FRB and the nearest unmasked pixel. This methodology mirrors that of galacto-centric offset calculation. These SOmin values are reported in Table 4. We show an illustrative image of this analysis in Figure 6, where we define contours as the edges of the spirals.
The SOmin values range from to with a median value of or physical minimum separations of 0.11 to 2.36 kpc with a median value of 0.53 kpc. Two of the five FRBs (20210807D and 20211212A) have an SOmin value consistent with zero at 95% confidence.
5 Discussion
5.1 Using AO to Image FRB Host Galaxies
This dataset presents the first ground-based AO sample of FRB host galaxies. This demonstrates our ability to match space-based depth and resolution with ground-based resources in the near-IR. Given the increasing sample of precisely localized FRBs, it will be critical to include ground-based observations to complement more expensive, space-based surveys.
While ground-based observations are currently limited to IR wavelengths, these do provide a detailed look at the distributions of stellar mass in these hosts, morphologies, and the connections between bursts and older stellar populations. The 5 magnitude limits, indicating the deepest objects detectable in these images, are listed in Table 3. In comparison with the limiting magnitude calculations obtained with HST in Mannings et al. (2021), we have achieved a similar depth using GeMS/GSAOI with a fraction of the integration time (between 500 and 2000 seconds) in comparison to almost 3000 seconds with HST, thanks to the light gathering power of an 8 metre telescope. With HST in Mannings et al. (2021), the spatial resolution is 0.2, while our GeMS/GSAOI images had a delivered image quality of 0.06.
5.2 Spiral Structure in FRB Hosts
Four out of five hosts in the GeMS/GSAOI sample that were successfully imaged show clear spiral arm structure, even though these galaxies were not pre-selected based on known spiral arm morphology. These FRBs are all non-repeaters. The host galaxies are at a range of inclination angles from 33° (FRB20211127I) to 59° (FRB20210807D).
Using galight, we determined the half-light radii of these five host galaxies and produced residual images which further highlight the spiral and low surface-brightness structures in these hosts. Echoing the results of Mannings et al. (2021), we show that most of the bursts which occur in spiral hosts, also occur on or near the spiral structures. This proximity to regions of relatively concentrated stellar mass is also illustrated by the (see Figure 3) which shows more than half of the FRBs in the GeMS/GSAOI sample occurring in a region of elevated stellar mass density. This is in stark contrast to SGRBs, for example, as they occur at high offsets and are therefore separated from the stellar mass in their hosts (e.g., Fong et al., 2022).
Using the residual images, we determine the minimum distance of each FRB to the closest spiral arm in the host galaxy (designated SOmin). The SOmin values range from 0.11 to 2.36 kpc with a median value of 0.53 kpc. The FRBs are significantly closer to spiral arms of their host compared to the center of their host galaxy, with a median galacto-centric offset being 3.47 kpc. The FRBs tend to be on or near a spiral arm but not coincident with the brightest portions of the spiral arm. We discuss the light at the location of the FRB in more detail in Section 5.3.
The authors of Abdeen et al. (2022) find evidence supporting the existence of age gradients in spiral arms, as predicted by density wave theory (Lin et al., 1969). Stars between 0-10 Myr tend to closely map the spiral arms of the host galaxy, trailing the arm slightly (see Figures 3 and 4 of Abdeen et al. (2022)). Magnetars are a compelling theoretical source of FRBs due to their compact size and extreme magnetizations. Notably, they are included in this younger population of stars. Therefore, if a majority of FRBs are associated with young magnetars, we would expect these to occur on or slightly trailing a spiral arm. FRBs 20210807D and 20211212A, within their respective uncertainties, are potentially coincident with a spiral arm of their host. FRBs 20191001A and 20211127I could potentially be leading one spiral arm or trailing another arm.
Aramyan et al. (2016) map the locations of extremely well-localized SNe relative to the spiral arms of their host galaxies. The authors created radial light profiles from the center of the galaxy extending through the transient’s location. They were able to precisely determine the location of each SN within the spiral arm of the respective host galaxy. Each SN in their sample is within the inner and outer bounds of a spiral arm, which are defined by a zero threshold in the residual galaxy image. This residual image is found by subtracting a bulge+disc model from the original image, similar to what we have done in this study. However, there are variations according to each type of SNe. For example, SNe Ibc occur closer to the leading edges of the arms than do SNe II. In the future with the imminent increase in well-localized FRBs due to CHIME Outriggers, CRACO on ASKAP, and DSA-110 we hope to expand the study of spiral arm offsets in FRBs to obtain more precise measurements of the location of FRBs relative to the substructure of the spiral arms of their hosts.
5.3 FRB Galacto-centric Offsets and Light locations
We calculated the projected offset of the FRBs from their host centers. We combined this GeMS/GSAOI sample of FRBs with the FRBs from Mannings et al. (2021) to create Figure 5 with a larger sample of FRBs. At high statistical significance, all transients included (SGRBs, LGRBs, Ca-rich transients, Type Ia-SNe, and SLSNe) except for CCSNe are rejected as coming from the same underlying population as FRBs. In Heintz et al. (2020), CC-SNe are confidently not rejected.
We use the effective radius from galight to calculate the host-normalized projected offset of each FRB. Through a KS test shown in the right panel of Figure 5, Ca-rich transients are rejected as coming from the same underlying population as FRBs, while SGRBs, LGRBs, and CCSNe are not rejected. Similarly, Heintz et al. (2020) does not reject CC-SNe.
In terms of fractional flux, FRBs are distinctly different from LGRBs, which tend to occur in brighter regions of their host galaxies (e.g. Fruchter et al., 2006). The locations of FRBs with respect to their host’s brightness is also distinct from SGRBs (e.g. Fong et al., 2010). FRBs, however, are not distinguished from CCSNe and Type Ia-SNe in terms of fractional flux.
As shown in Figures 4 and 5, the hypothesis that FRBs and CCSNe are from the same underlying population is not rejected based on projected offset, host normalized offset, or fractional flux. Our findings on the local environment scale are consistent with the findings of Bochenek et al. (2021) which investigated global host properties. In Bochenek et al. (2021) they compared a sample of FRB host galaxies with the galaxies of CCSNe, LGRBs, and SLSNe-I. LGRBs and SLSNe-I were rejected as coming from the same underlying population as FRBs, while CCSNe were not rejected. The Milky Way magnetar population is dominated by magnetars born in CCSNe without central engines. Thus if magnetars are the dominant FRB progenitor, and the Milky Way magnetar population is representative of the magnetar population overall, then FRB host galaxies should be consistent with the host galaxies of CCSNe (Bochenek et al., 2021). However, while this connection appears true for this sample of FRBs presented in this paper, we cannot assume the Milky Way magnetar population is representative of all FRB progenitors. There are several exceptions to the typical spiral host galaxy, such as the FRB from a globular cluster (Bhardwaj et al., 2021, e.g.), FRBs in dwarf galaxies (Bhandari et al., 2023, e.g.), and various FRBs that are not coincident with star-forming regions in their host galaxies (Dong et al., 2023, e.g.), which is where we might expect more massive progenitors to be located. The possible magnetar connection — or more clearly,CC-SNe connection — seems relevant for this sample of FRBs specifically, but broad characteristics of FRB host galaxies overall might point towards a multitude of pathways.
6 Conclusions
In this paper, we use high-resolution images from GeMS/GSAOI to perform a detailed study of the environments of five FRBs. Using these data, we make measurements of galacto-centric offset (§4), fractional flux (§3.4), stellar mass surface density (§3.2), and offset from spiral arms (§4.2). We also demonstrate the feasibility of creating samples of high-resolution imaging of FRB hosts using AO-supported ground-based resources.
From each of these measures, we found that FRBs are located at moderate offsets (median host-normalized offset of 2.09 ), compared to other transient classes such as LGRBs and Ca-rich transients. These bursts also appear on or close to the spiral structure in their hosts, with a median distance of 0.53 kpc.
As for the light at the FRB location, the IR fractional flux demonstrated that the combined samples of FRBs trace the distribution of stellar mass, similar to CC-SNe. We also examined the FRB location in terms of stellar mass surface density, finding 4/5 FRB sites to be elevated in this quantity compared to the global value. In combination, these findings point towards a possible similarity between FRB local environments and those of CC-SNe. This is a finding supported by the conclusions of Bochenek et al. (2021), which finds similarities between the global properties of FRBs hosts and CC-SNe hosts.
With many well-localized FRB detections looming on the horizon due to upgraded experiments and new instruments coming online, we will be able to better characterize the properties of FRB environments relative to their host galaxies and other transient classes. Additionally, the increasing sensitivities of instruments will facilitate studies at higher redshifts. It is necessary that we utilize all resources available to prepare for and attend to the large number of incoming FRB detections and precise localizations. In combination with possible JWST, HST, and archival data, adaptive optics will prove to be an effective tool.
Acknowledgements
Based on observations obtained at the international Gemini Observatory, a program of NSF’s NOIRLab, which is managed by the Association of Universities for Research in Astronomy (AURA) under a cooperative agreement with the National Science Foundation on behalf of the Gemini Observatory partnership: the National Science Foundation (United States), National Research Council (Canada), Agencia Nacional de Investigación y Desarrollo (Chile), Ministerio de Ciencia, Tecnología e Innovación (Argentina), Ministério da Ciência, Tecnologia, Inovações e Comunicações (Brazil), and Korea Astronomy and Space Science Institute (Republic of Korea).
MNW and RAJ gratefully acknowledge support from NSF grants AST-2206492 and AST-2206490, and from the Nantucket Maria Mitchell Association. ATD acknowledges support through Australian Research Council Discovery Project DP220102305. CDK acknowledges partial support from a CIERA postdoctoral fellowship. MG is supported by the Australian Government through the Australian Research Council’s Discovery Projects funding scheme (DP210102103).
References
- Abbott et al. (2021) Abbott, T. M. C., Adamów, M., Aguena, M., et al. 2021, ApJS, 255, 20, doi: 10.3847/1538-4365/ac00b3
- Abdeen et al. (2022) Abdeen, S., Davis, B. L., Eufrasio, R., et al. 2022, MNRAS, 512, 366, doi: 10.1093/mnras/stac459
- Aggarwal et al. (2021) Aggarwal, K., Budavári, T., Deller, A. T., et al. 2021, ApJ, 911, 95, doi: 10.3847/1538-4357/abe8d2
- Aramyan et al. (2016) Aramyan, L. S., Hakobyan, A. A., Petrosian, A. R., et al. 2016, MNRAS, 459, 3130, doi: 10.1093/mnras/stw873
- Bannister et al. (2017) Bannister, K. W., Shannon, R. M., Macquart, J. P., et al. 2017, ApJ, 841, L12, doi: 10.3847/2041-8213/aa71ff
- Bassa et al. (2017) Bassa, C. G., Tendulkar, S. P., Adams, E. A. K., et al. 2017, ApJ, 843, L8, doi: 10.3847/2041-8213/aa7a0c
- Baumgardt & Vasiliev (2021) Baumgardt, H., & Vasiliev, E. 2021, Monthly Notices of the Royal Astronomical Society, 505, 5957, doi: 10.1093/mnras/stab1474
- Bhandari et al. (2020a) Bhandari, S., Sadler, E. M., Prochaska, J. X., et al. 2020a, ApJ, 895, L37, doi: 10.3847/2041-8213/ab672e
- Bhandari et al. (2020b) Bhandari, S., Bannister, K. W., Lenc, E., et al. 2020b, ApJ, 901, L20, doi: 10.3847/2041-8213/abb462
- Bhandari et al. (2023) Bhandari, S., Gordon, A. C., Scott, D. R., et al. 2023, ApJ, 948, 67, doi: 10.3847/1538-4357/acc178
- Bhardwaj et al. (2021) Bhardwaj, M., Gaensler, B. M., Kaspi, V. M., et al. 2021, ApJ, 910, L18, doi: 10.3847/2041-8213/abeaa6
- Blanchard et al. (2016) Blanchard, P. K., Berger, E., & Fong, W.-f. 2016, ApJ, 817, 144, doi: 10.3847/0004-637X/817/2/144
- Bochenek et al. (2020) Bochenek, C. D., Ravi, V., Belov, K. V., et al. 2020, Nature, 587, 59, doi: 10.1038/s41586-020-2872-x
- Bochenek et al. (2021) Bochenek, C. D., Ravi, V., & Dong, D. 2021, ApJ, 907, L31, doi: 10.3847/2041-8213/abd634
- Chambers et al. (2016) Chambers, K. C., Magnier, E. A., Metcalfe, N., et al. 2016, arXiv e-prints, arXiv:1612.05560, doi: 10.48550/arXiv.1612.05560
- Chatterjee et al. (2017) Chatterjee, S., Law, C. J., Wharton, R. S., et al. 2017, Nature, 541, 58, doi: 10.1038/nature20797
- CHIME/FRB Collaboration et al. (2021) CHIME/FRB Collaboration, Amiri, M., Andersen, B. C., et al. 2021, ApJS, 257, 59, doi: 10.3847/1538-4365/ac33ab
- Chittidi et al. (2021) Chittidi, J. S., Simha, S., Mannings, A., et al. 2021, ApJ, 922, 173, doi: 10.3847/1538-4357/ac2818
- De et al. (2020) De, K., Kasliwal, M. M., Tzanidakis, A., et al. 2020, arXiv e-prints, arXiv:2004.09029. https://arxiv.org/abs/2004.09029
- Ding et al. (2021) Ding, X., Birrer, S., Treu, T., & Silverman, J. D. 2021, arXiv e-prints, arXiv:2111.08721, doi: 10.48550/arXiv.2111.08721
- Dong et al. (2023) Dong, Y., Eftekhari, T., Fong, W.-f., et al. 2023, arXiv e-prints, arXiv:2307.06995, doi: 10.48550/arXiv.2307.06995
- Driessen et al. (2023) Driessen, L. N., Barr, E., Buckley, D., et al. 2023, arXiv e-prints, arXiv:2302.09787, doi: 10.48550/arXiv.2302.09787
- Flewelling et al. (2020) Flewelling, H. A., Magnier, E. A., Chambers, K. C., et al. 2020, ApJS, 251, 7, doi: 10.3847/1538-4365/abb82d
- Fong & Berger (2013) Fong, W., & Berger, E. 2013, ApJ, 776, 18, doi: 10.1088/0004-637X/776/1/18
- Fong et al. (2010) Fong, W., Berger, E., & Fox, D. B. 2010, ApJ, 708, 9, doi: 10.1088/0004-637X/708/1/9
- Fong et al. (2022) Fong, W.-f., Nugent, A. E., Dong, Y., et al. 2022, ApJ, 940, 56, doi: 10.3847/1538-4357/ac91d0
- Fruchter et al. (2006) Fruchter, A. S., Levan, A. J., Strolger, L., et al. 2006, Nature, 441, 463, doi: 10.1038/nature04787
- Glowacki et al. (2023) Glowacki, M., Lee-Waddell, K., Deller, A. T., et al. 2023, ApJ, 949, 25, doi: 10.3847/1538-4357/acc1e3
- Heintz et al. (2020) Heintz, K. E., Prochaska, J. X., Simha, S., et al. 2020, ApJ, 903, 152, doi: 10.3847/1538-4357/abb6fb
- Hsu et al. (2023) Hsu, B., Blanchard, P. K., Berger, E., & Gomez, S. 2023, arXiv e-prints, arXiv:2308.07271, doi: 10.48550/arXiv.2308.07271
- Kirsten et al. (2022) Kirsten, F., Marcote, B., Nimmo, K., et al. 2022, Nature, 602, 585, doi: 10.1038/s41586-021-04354-w
- Kocz et al. (2019) Kocz, J., Ravi, V., Catha, M., et al. 2019, MNRAS, 489, 919, doi: 10.1093/mnras/stz2219
- Kuncarayakti et al. (2018) Kuncarayakti, H., Anderson, J. P., Galbany, L., et al. 2018, A&A, 613, A35, doi: 10.1051/0004-6361/201731923
- Labrie et al. (2019) Labrie, K., Anderson, K., Cárdenes, R., Simpson, C., & Turner, J. E. H. 2019, in Astronomical Society of the Pacific Conference Series, Vol. 523, Astronomical Data Analysis Software and Systems XXVII, ed. P. J. Teuben, M. W. Pound, B. A. Thomas, & E. M. Warner, 321
- Lada & Dame (2020) Lada, C. J., & Dame, T. M. 2020, ApJ, 898, 3, doi: 10.3847/1538-4357/ab9bfb
- Law et al. (2023) Law, C. J., Sharma, K., Ravi, V., et al. 2023, arXiv e-prints, arXiv:2307.03344, doi: 10.48550/arXiv.2307.03344
- Leung et al. (2021) Leung, C., Mena-Parra, J., Masui, K., et al. 2021, AJ, 161, 81, doi: 10.3847/1538-3881/abd174
- Lin et al. (1969) Lin, C. C., Yuan, C., & Shu, F. H. 1969, ApJ, 155, 721, doi: 10.1086/149907
- Lorimer et al. (2007) Lorimer, D. R., Bailes, M., McLaughlin, M. A., Narkevic, D. J., & Crawford, F. 2007, Science, 318, 777, doi: 10.1126/science.1147532
- Lunnan et al. (2015) Lunnan, R., Chornock, R., Berger, E., et al. 2015, ApJ, 804, 90, doi: 10.1088/0004-637X/804/2/90
- Lunnan et al. (2017) Lunnan, R., Kasliwal, M. M., Cao, Y., et al. 2017, ApJ, 836, 60, doi: 10.3847/1538-4357/836/1/60
- Mannings et al. (2021) Mannings, A. G., Fong, W.-f., Simha, S., et al. 2021, ApJ, 917, 75, doi: 10.3847/1538-4357/ABFF56
- Marcote et al. (2017) Marcote, B., Paragi, Z., Hessels, J. W. T., et al. 2017, ApJ, 834, L8, doi: 10.3847/2041-8213/834/2/L8
- Marcote et al. (2020) Marcote, B., Nimmo, K., Hessels, J. W. T., et al. 2020, Nature, 577, 190, doi: 10.1038/s41586-019-1866-z
- Planck Collaboration et al. (2016) Planck Collaboration, Ade, P. A. R., Aghanim, N., et al. 2016, A&A, 594, A13, doi: 10.1051/0004-6361/201525830
- Prochaska et al. (2019) Prochaska, J. X., Neeleman, M., Kanekar, N., & Rafelski, M. 2019, ApJ, 886, L35, doi: 10.3847/2041-8213/ab55eb
- Ravi et al. (2023) Ravi, V., Catha, M., Chen, G., et al. 2023, ApJ, 949, L3, doi: 10.3847/2041-8213/acc4b6
- Ryder et al. (2023) Ryder, S. D., Bannister, K. W., Bhandari, S., et al. 2023, Science, 382, 294, doi: 10.1126/science.adf2678
- Safarzadeh et al. (2020) Safarzadeh, M., Prochaska, J. X., Heintz, K. E., & Fong, W.-f. 2020, ApJ, 905, L30, doi: 10.3847/2041-8213/abd03e
- Schulze et al. (2021) Schulze, S., Yaron, O., Sollerman, J., et al. 2021, ApJS, 255, 29, doi: 10.3847/1538-4365/abff5e
- Tendulkar et al. (2017) Tendulkar, S. P., Bassa, C. G., Cordes, J. M., et al. 2017, ApJ, 834, L7, doi: 10.3847/2041-8213/834/2/L7
- Tendulkar et al. (2020) Tendulkar, S. P., Gil de Paz, A., Kirichenko, A. Y., et al. 2020, arXiv e-prints, arXiv:2011.03257. https://arxiv.org/abs/2011.03257
- Uddin et al. (2020) Uddin, S. A., Burns, C. R., Phillips, M. M., et al. 2020, The Astrophysical Journal, 901, 143, doi: 10.3847/1538-4357/abafb7
- Wang et al. (2013) Wang, X., Wang, L., Filippenko, A. V., Zhang, T., & Zhao, X. 2013, Science, 340, 170, doi: 10.1126/science.1231502