Simulation of Charge Collection in a Boron-coated Straw Detector for Emerging Fuel Cycles
Abstract
Tristructural-isotropic (TRISO) fuel is currently one of the most mature fuel types for candidate advanced reactor types, namely pebble bed reactors (PBRs). In PBRs, TRISO-fueled pebbles can be re-introduced into the core several times before reaching their target burnup. Non-destructive techniques capable of assaying 235U mass in the pebble are therefore needed for nuclear material control and accountability during fuel recirculation. In this work, we have developed a new boron-coated straw (BCS) based neutron multiplicity counter (NMC) to estimate 235U mass in each pebble. BCS detectors are chosen for their inherent high insensitivity to gamma rays that will enable their use to assay also irradiated pebbles and high neutron detection efficiency, comparable to 3He detectors. The BCS-based NMC that we have designed was built by Proportional Technologies, Inc. (PTI) Houston, TX. In this work, we report the system-level simulation of the BCS-based NMC and the straw-level charge collection simulation coupled with a custom software to tally the detected pulse integral from the list mode energy deposited. We have developed a high-fidelity model of the NMC to simulate the response of a single straw detector to a 252Cf source. The simulated die-away time, single neutron count rate, and double neutron count rate agree well with measured values, with a relative difference within 0.4%. The simulated charge spectrum agrees well with the measured one in the case of a round straw. We plan to use the NMC to perform active and passive interrogation of fresh and spent fuel pebbles.
I Introduction
TRISO fuel is currently one of the most mature fuel types for advanced reactor types, namely the PBR. In PBRs, TRISO-fueled pebbles are cycled through the core continuously until they reach a target burnup. Quantifying the 235U mass in TRISO fuel pebbles is crucial for special nuclear material (SNM) accountability and for pebble tracking, when combined with computational methods [1]. Hence, knowledge of 235U mass is needed to validate the reactor simulations and for safeguards of SNM.
In this application, two constraints need to be met: high sensitivity to assay a small 235U mass and rejection of gamma rays to assay 235U and fissile fission products such as 244Cm in partially burned fuel. To meet these constraints, we have developed a BCS-based NMC. BCS, unlike 3He, are readily available and cost-effective. They show a faster response than 3He [2] and are insensitive to gamma rays, unlike organic scintillators, hence enabling the assay of partially spent pebbles. The BCS used in this work features a pie-shaped cross section with increased surface area compared to traditional round-shaped straws. To the best of our knowledge, this is the first NMC based on pie-shaped straws, which provides higher detection efficiency and shorter die-away time than the round straws.
In this paper, we will report the most relevant results of a high-fidelity model of the NMC experimentally validated with a 252Cf source at UIUC.
II Development and testing of the NMC
II-A Experimental methods
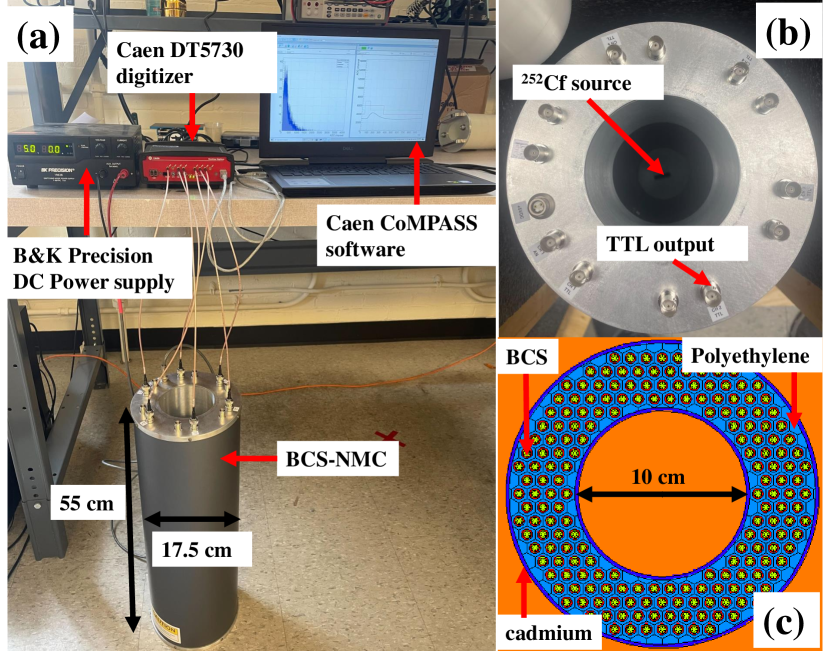
Fig. 2 shows the BCS-based NMC measuring a 185-kBq (activity date: 2022-02-15) 252Cf source. As shown in Fig. 2c, the NMC consists of 192 BCS detectors with 0.9091 cm inter-distance embedded in a high-density polyethylene (HDPE) matrix. The inner and outer radius of the NMC is 5 cm and 8.75 cm, respectively. The inner and outer surfaces of the NMC are coated with a layer of 0.5 mm-thick cadmium to prevent thermal neutron reentering the sample cavity. Each BCS detector is 40-cm long and has a 4.7-mm outer diameter. A 1.3-m thick layer of (96% 10B enrichment) is deposited on the inner surface of the straw to absorb the thermal neutrons. As shown in Fig. 5(a), there are 6 septa in the straw to increase the surface area in the volume, thus increasing the detection efficiency and reducing the system die-away time. A pair of 7Li/alpha ions are produced in the neutron absorption reaction:
| (1) |
The straw is filled with Ar/ (9:1) mixture gas at 0.7 atmosphere to detect 7Li/alpha ions. The alpha/Li-7 particles ionize the gas and the ionized electrons drift towards the anode wire under the electrical field in the straw space, which induces electrical signals on the anode wire. The bias voltage applied to the anode wire of the straw is 750V. Signals of 32 straws are bundled together to one TTL output and the six TTL outputs are connected to a 500MS/s DT5730 digitizer [3] for list mode data acquisition. During the measurement, a voltage threshold of 13 mV is applied in the BCS-based NMC to reject the low-amplitude gamma ray events, resulting in a neutron thresholding efficiency of 92% [4]. We have developed a program to perform real time analysis to calculate the die-away time and coincidence count rates using shift-register algorithms. In this work, we report the results using a signal-trigger shift register protocol [5].
II-B Simulation methods
II-B1 System-level model
We have developed a system -level model in MCNP 6.2 [6], as shown in Fig. 2c. The system model accurately reproduces the geometry of the BCS-based NMC. MCNP’s PTRAC card is used to record the energy deposition events by alpha/Li-7 particles in the straw’s sensitive volume. A custom-developed software is used to parse the PTRAC output and extract the information of alpha/Li-7 energy deposition events. To account for the neutron count loss due to the voltage threshold, an energy threshold of 57 keV is applied in the simulation.
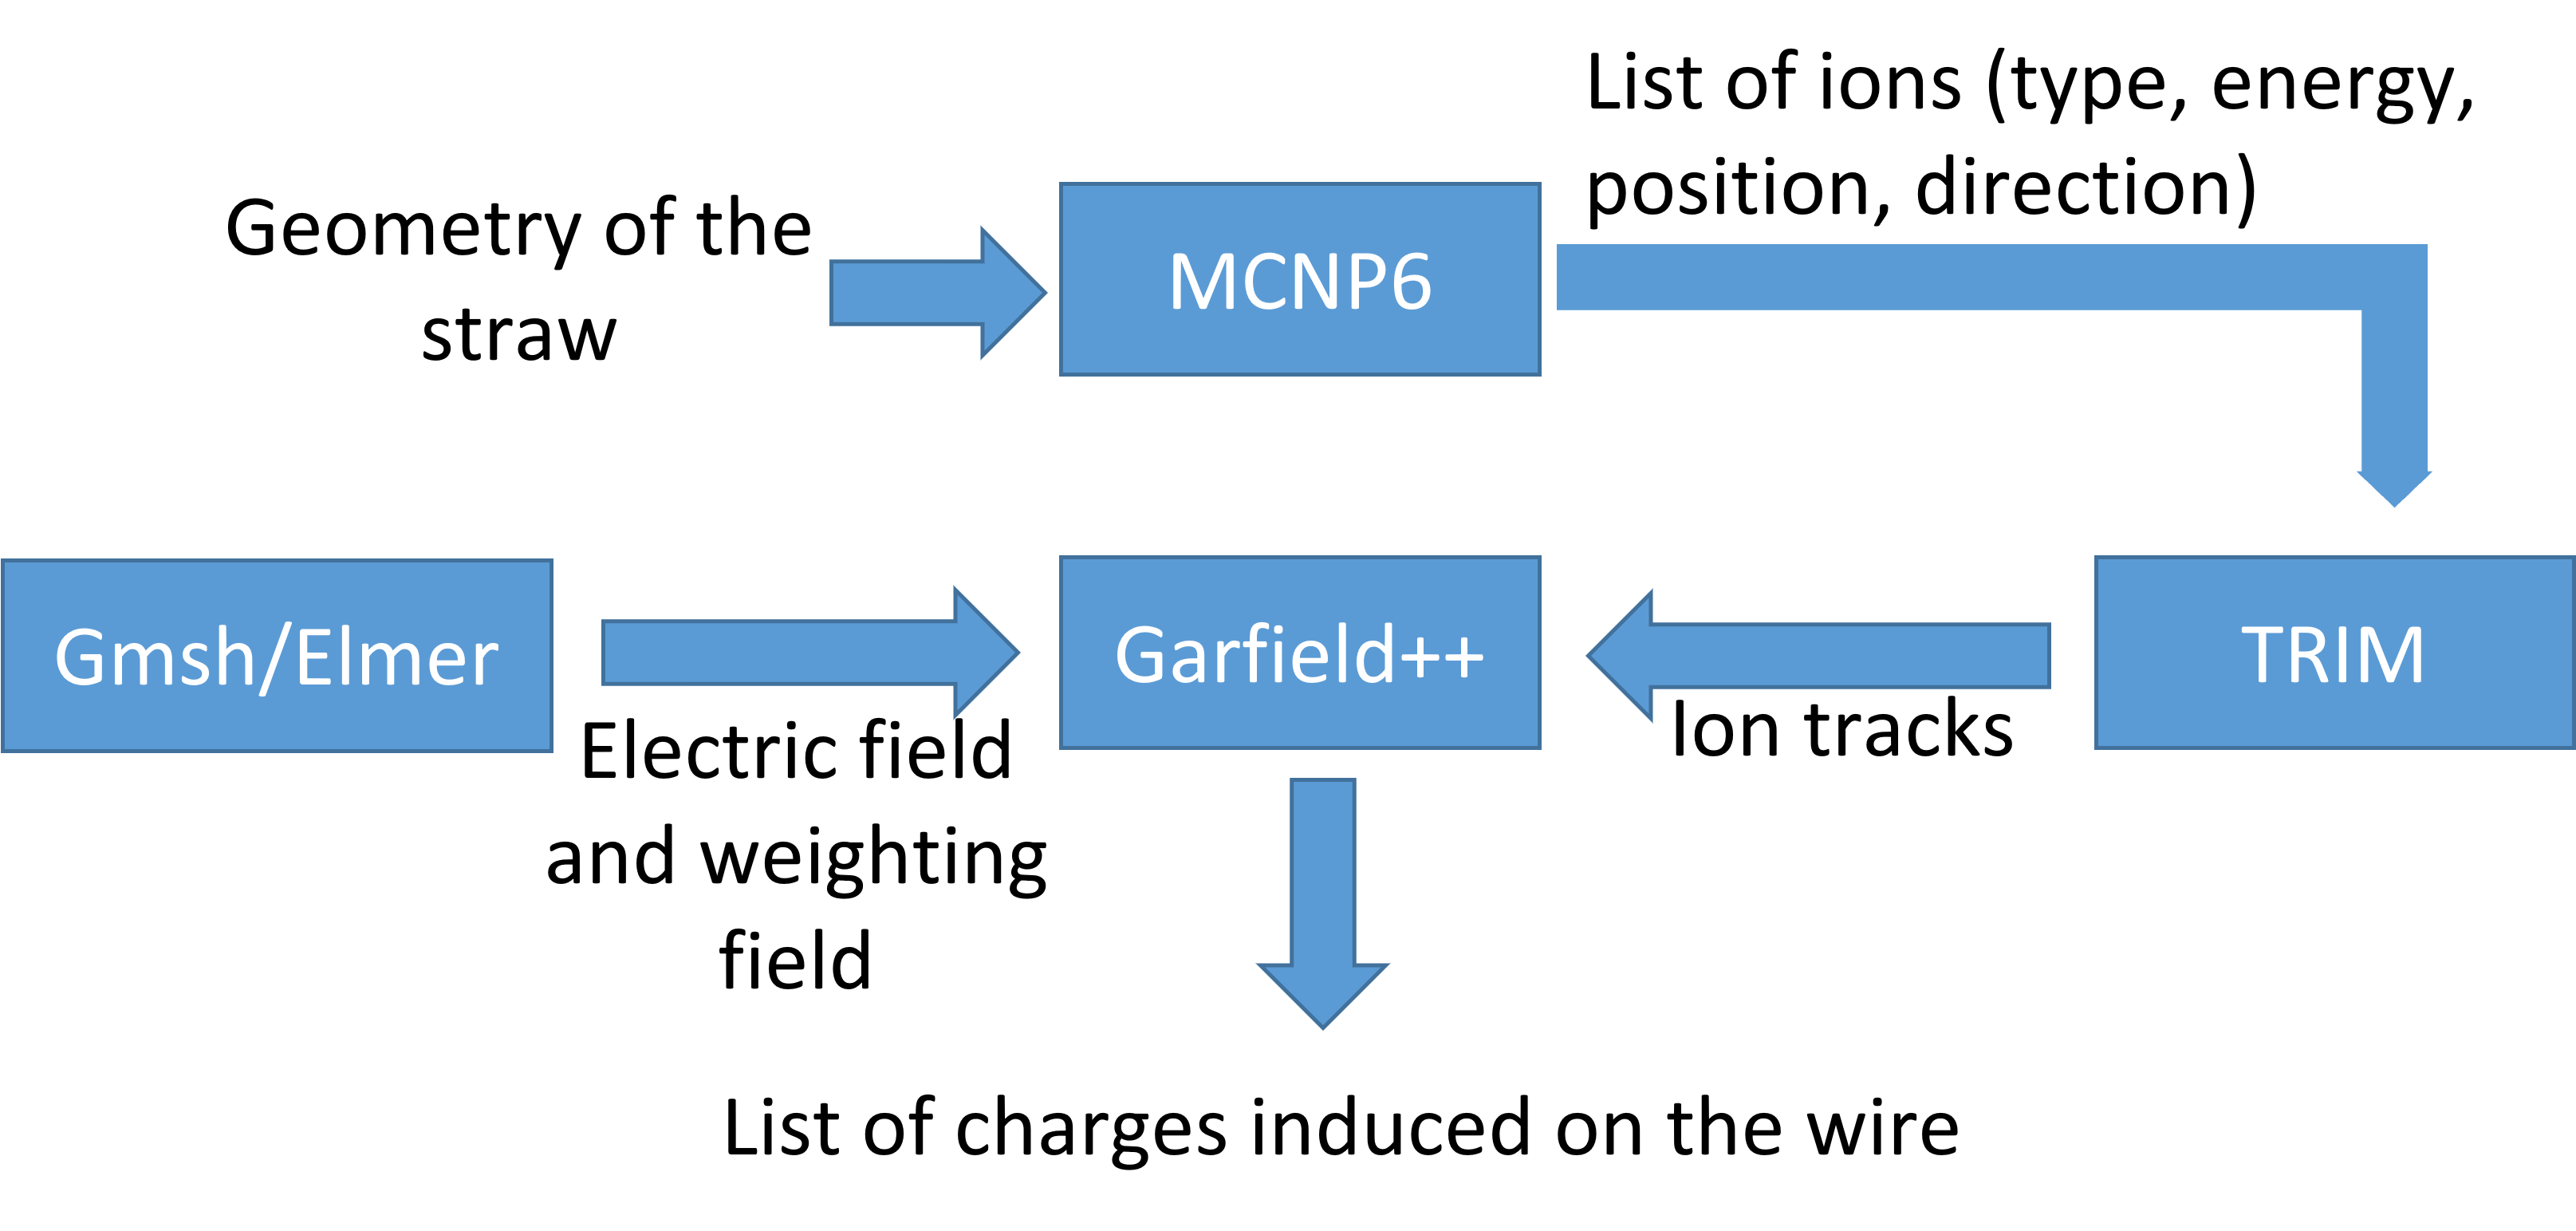
II-C Straw-level model
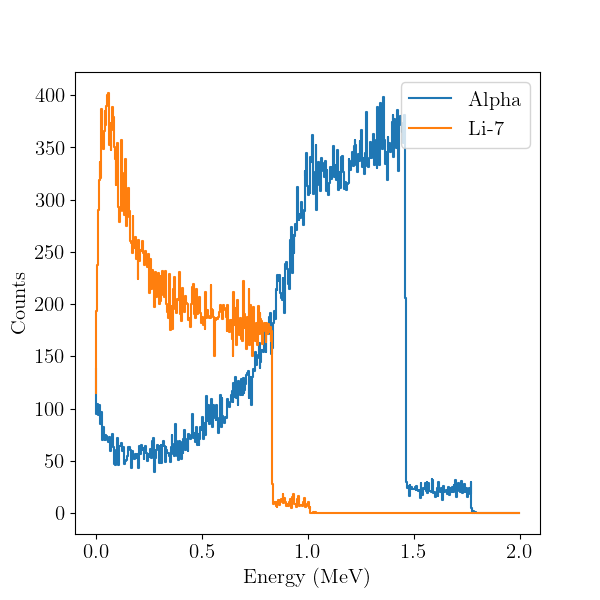
In the system-level model, the straw-level response, i.e., ionization and charge generation process, is not simulated. Consequently, an estimation of neutron thresholding efficiency is needed to convert the voltage threshold to deposited energy threshold. The energy deposited corresponding to a set voltage threshold can also be found through a direct comparison of simulated and measured BCS detector response. As shown in Fig. 1, we have developed a scheme to accurately simulate the response of the BCS detector. We first generate a list of 7Li/alpha ions entering the gas region by parsing the PTRAC output file from MCNP6.2 simulation. The ion’s initial energy, position, and moving direction are saved. Fig. 3(a) shows the initial position and moving direction of 100 alpha/Li-7 ions, and Fig. 3(b) shows the spectrum of the ions’ energy when they enter the gas region.
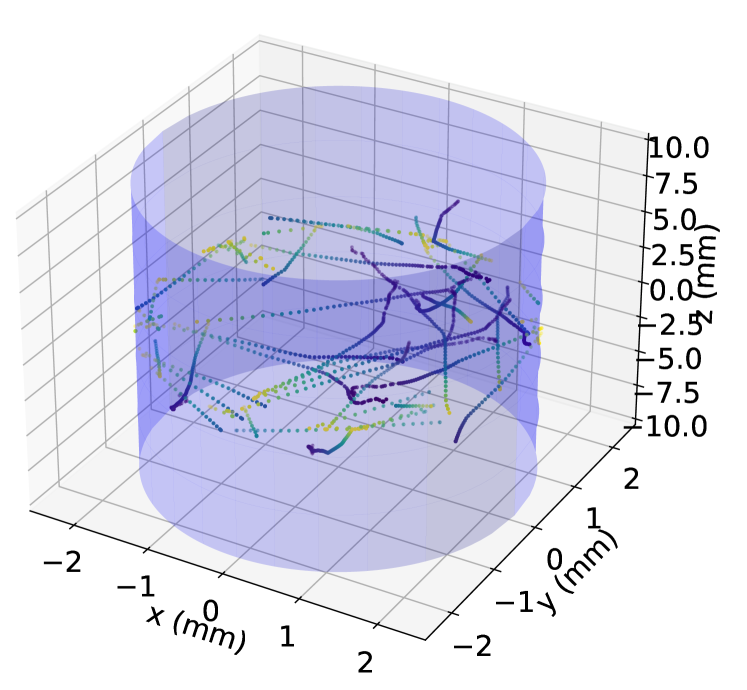
We then use the TRIM (Transport of Ions in Matter) [7] program to generate the ion tracks in the gas, using the automation tool pysrim [8]. TRIM simulates the track of an ion of a given energy starting at the origin and travels along the X-axis direction in a infinitely thick medium. A custom python program is developed to rotate/translate the track based on its initial position and moving direction, and terminate the track at the straw’s boundary. Fig. 4 shows 58 alpha tracks in the gas volume. The tracks start from the wall or septa and stop at the boundary or when the ion exhausts all of its energy.
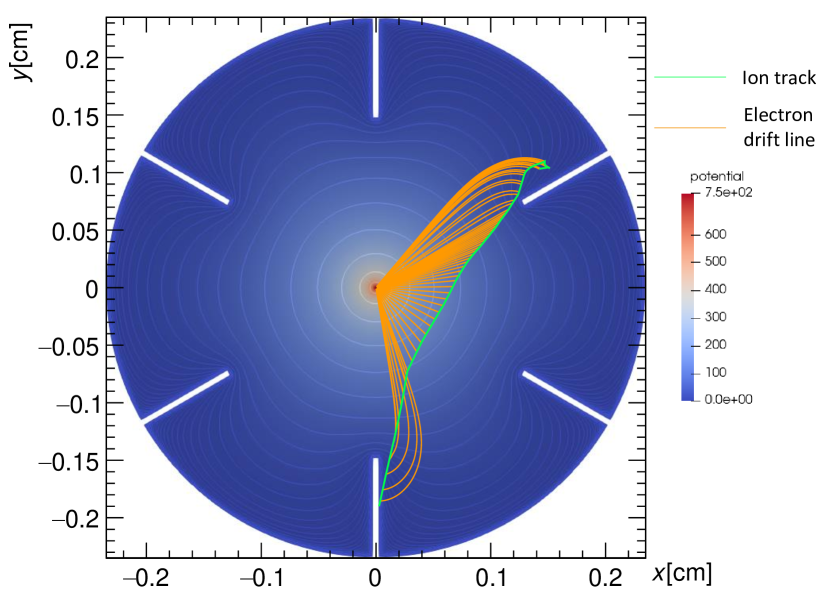
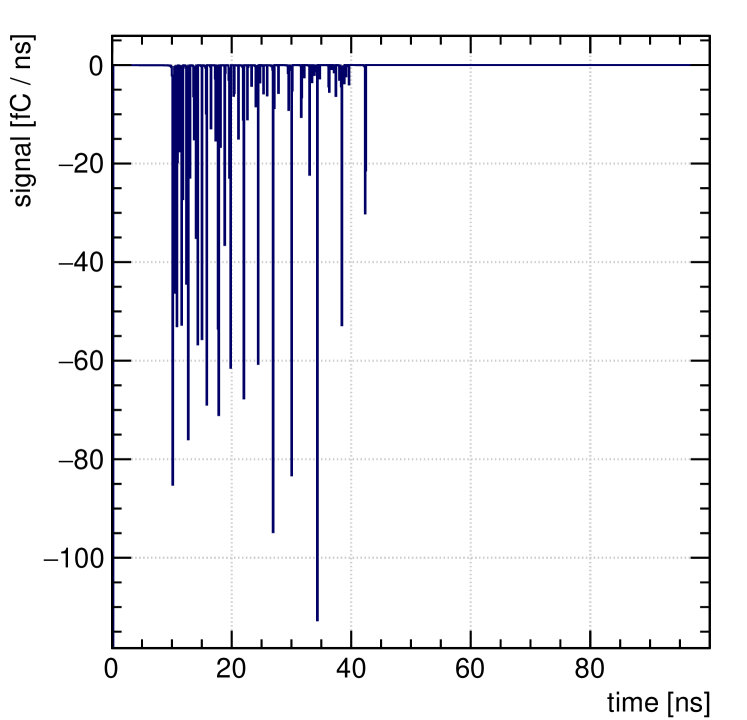
The corrected tracks are imported into Garfield++ program[9], which simulates electron avalanches in the gas volume and calculates signals induced on the wire. The electric field in the gas is solved using finite element method (FEM) tools Gmsh [10] and Elmer [11] due to the non-trivial geometry of the straw, and is imported into Garfield++. Fig. 5(a) shows the electric field calculated by Elmer, and the drift lines of electron clusters created by a 402-keV alpha. Fig. 5(b) shows the current signal induced on the wire due to the drift of electrons. The total collected charge is obtained by integrating the current signal.


III Results
III-A Validation of System-level Model
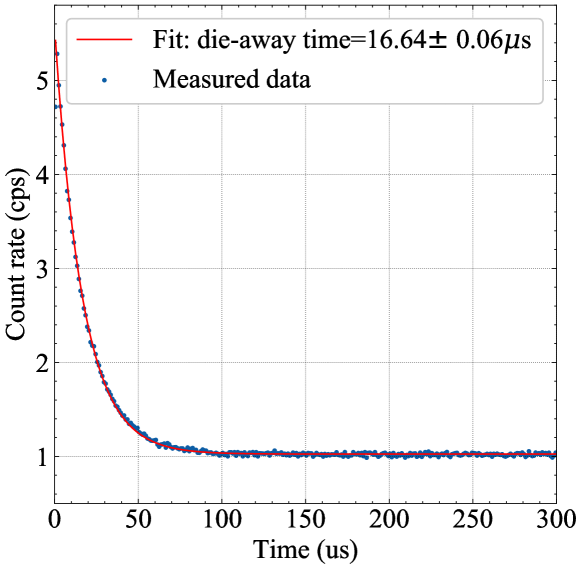
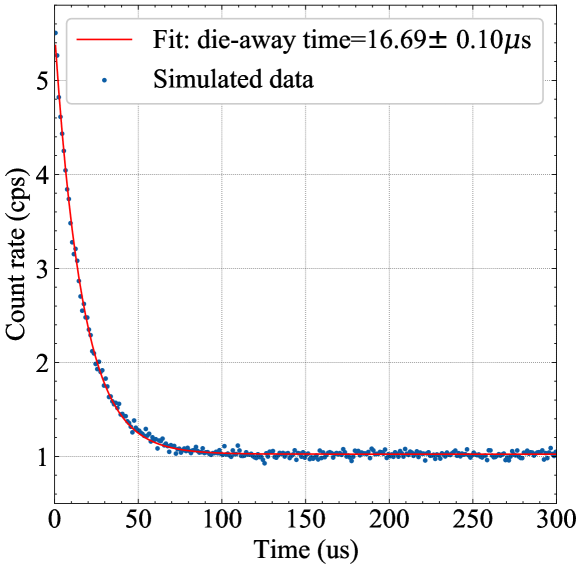
We generated two lists of pulse time stamps from the PTRAC file in MCNP6 simulation and the list mode data acquired in the experiment. We plotted the Rossi-alpha distribution in Fig. 6 and fitted the data to a single exponential model with a constant offset to determine the die-away time. Table I shows the comparison of the experimental and simulated die-away time and coincidence rates. The relative differences are all below 0.4%, demonstrating the high-fidelity of the NMC model.
| S (cps) | D (cps) | (s) | |
|---|---|---|---|
| Measurement | 1009.8 | 59.5 | 16.64 |
| Simulation | 1008.9 | 59.3 | 16.69 |
| Relative difference (%) | 0.09 | 0.34 | 0.30 |
III-B Validation of Straw-level model
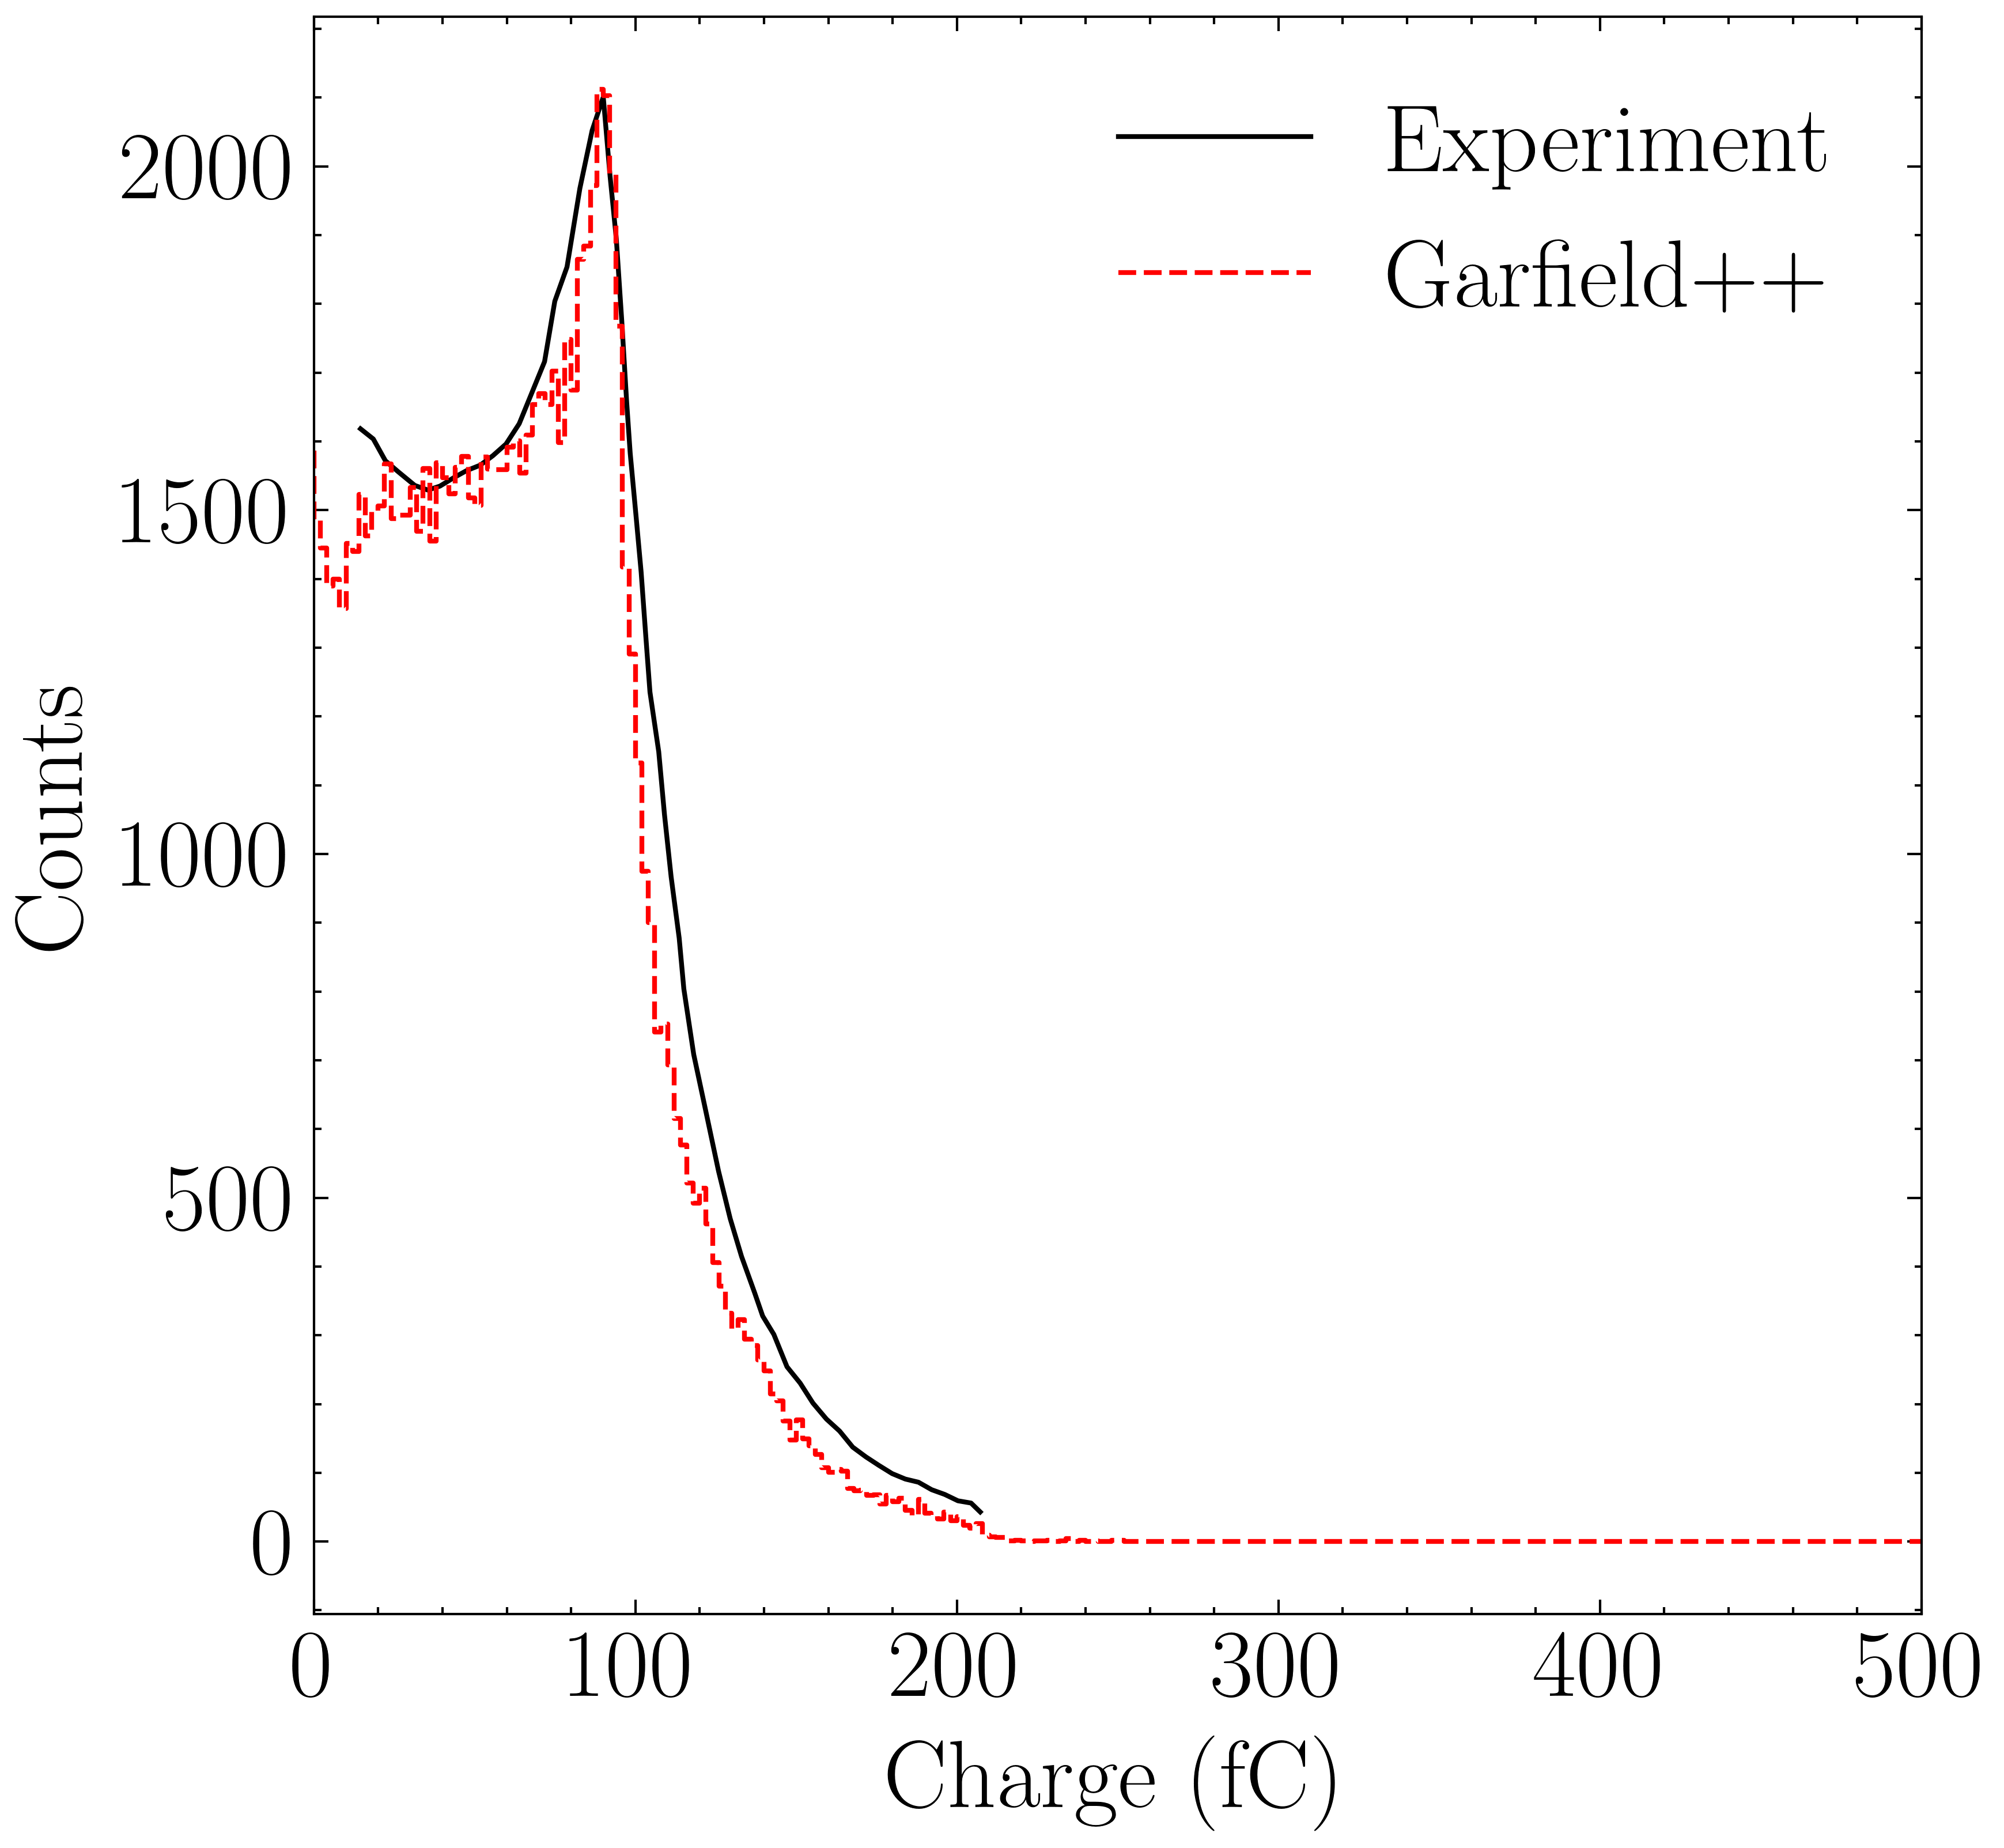
We simulated the distribution of collected charge in a 4-mm diameter round straw using the scheme in Fig. 1 and compared it to the experimental pulse height distribution [12]. The bias voltage applied to the annode wire is 700 V in this case. As shown in Fig. 7, the two spectra are in good agreement.
IV Conclusions and Future work
In this work, we have developed a BCS-based NMC for assay of TRISO-fueled pebbles in pebble bed reactors. A system-level Monte Carlo model of the NMC has been developed. The simulated response are in good agreement with the measurement in terms of die-away time and efficiency, with relative difference. A detailed simulation model of BCS was developed to simulate the charge spectrum obtained with BCS detectors. The simulated charge spectrum is in good agreement with the measurement, for a round BCS. In the future, we will account for the space charge effect and simulate the charge spectrum for pie-shaped BCS.
References
- [1] A. D. William Dick, “Multi-mode imaging for triso-fueled pebble identification,” 2021.
- [2] J. L. Lacy, A. Athanasiades, L. Sun, C. S. Martin, and G. J. Vazquez-Flores, “Boron coated straw detectors as a replacement for 3he,” in 2009 IEEE Nuclear Science Symposium Conference Record (NSS/MIC), 2009, pp. 119–125.
- [3] CoMPASS Multiparametric DAQ Software for Physics Applications, CAEN S.pA., 2022.
- [4] P. T. Inc., personal communication, 2022.
- [5] S. Croft, D. Henzlova, and D. Hauck, “Extraction of correlated count rates using various gate generation techniques: Part i theory,” NIMA, vol. 691, p. 152 – 158, 2012.
- [6] F. Brown, M. Rising, and J. Alwin, “What’s new with mcnp6. 2 and whisper-1.1,” LA-UR-17-27992, Tech. Rep., 2017.
- [7] J. F. Ziegler and J. P. Biersack, “The stopping and range of ions in matter,” in Treatise on heavy-ion science. Springer, 1985, pp. 93–129.
- [8] C. Ostrouchov, Y. Zhang, J. Weber et al., “Pysrim: automation, analysis, and plotting of srim calculations,” Journal of Open Source Software, vol. 3, no. 28, 2018.
- [9] R. Veenhof, “Garfield, a drift chamber simulation program,” in Conf. Proc. C, vol. 9306149. World Scientific, 1993, pp. 66–71.
- [10] C. Geuzaine and J.-F. Remacle, “Gmsh: A 3-d finite element mesh generator with built-in pre-and post-processing facilities,” International journal for numerical methods in engineering, vol. 79, no. 11, pp. 1309–1331, 2009.
- [11] J. Ruokolainen, M. Malinen, P. Råback, T. Zwinger, A. Pursula, and M. Byckling, “Elmersolver manual.”
- [12] J. L. Lacy, A. Athanasiades, L. Sun, C. S. Martin, T. D. Lyons, M. A. Foss, and H. B. Haygood, “Boron-coated straws as a replacement for 3he-based neutron detectors,” NIMA, vol. 652, no. 1, pp. 359–363, 2011.