Bridging Both Worlds in Semantics and Time: Domain Knowledge Based Analysis and Correlation of Industrial Process Attacks
Abstract.
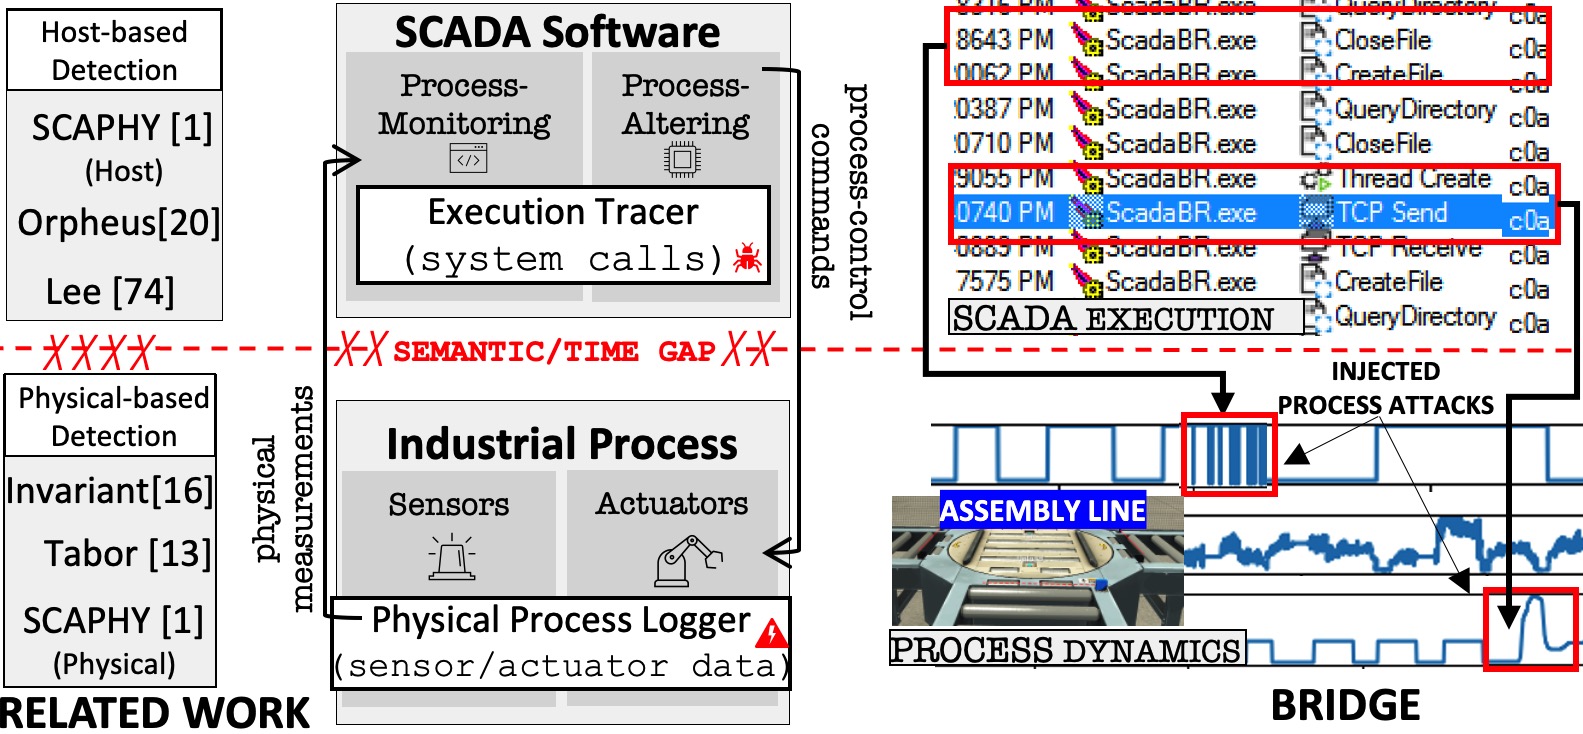
Modern industrial control systems (ICS) attacks infect supervisory control and data acquisition (Scada) hosts to stealthily alter industrial processes, causing damage. To detect attacks with low false alarms, recent work detects attacks in both Scada and process data. Unfortunately, this led to the same problem - disjointed (false) alerts, due to the semantic and time gap in Scada and process behavior, i.e., Scada execution does not map to process dynamics nor evolve at similar time scales. We propose Bridge to analyze and correlate Scada and industrial process attacks using domain knowledge to bridge their unique semantic and time evolution. This enables operators to tie malicious Scada operations to their adverse process effects, which reduces false alarms and improves attack understanding. Bridge (i) identifies process constraints violations in Scada by measuring actuation dependencies in Scada process-control, and (ii) detects malicious Scada effects in processes via a physics-informed neural network that embeds generic knowledge of inertial process dynamics. Bridge then dynamically aligns both analysis (i and ii) in a time-window that adjusts their time evolution based on process inertial delays. We applied Bridge to 11 diverse real-world industrial processes, and adaptive attacks inspired by past events. Bridge correlated 98.3% of attacks with 0.8% false positives (FP), compared to 78.3% detection accuracy and 13.7% FP of recent work.
1. Introduction
Industrial control systems (ICS) operate life-essential industrial processes such as water treatment and manufacturing plants. In ICS networks, supervisory control and data acquisition (Scada) hosts manage processes, comprised of actuators, sensors, and programmable logic controllers (PLCs). Processes are governed by the dynamics (or physics) of their actuators. Scada runs software and Human Machine Interfaces (HMI) to control processes (called process-control [Ike et al., 2022]). Unfortunately, modern attacks (e.g., Industroyer, Stuxnet [Case, 2016, stu, 2022]) infect Scada to disrupt processes [Miller et al., 2021, Fischer et al., 2018, Hemsley et al., 2018, ris, 2022, ics, 2022a]. For example, the 2021 Oldsmar water treatment attack infected a Scada HMI to alter process parameters and poison the water supply [Ike et al., 2022, flo, 2022a, b, Davies et al., 2022, Ocampo, 2021].
To accurately detect industrial process attacks, it is essential to connect the causal software action in Scada to the adverse physical effect on the process. On one hand, process anomaly detection [Lin et al., 2018, Urbina et al., 2016, Ghaeini et al., 2018] such as Invariant [Feng et al., 2019] can detect abnormal sensor data, but is evaded by small/stealthy process deviations by Scada adversaries, which over time causes damages [Kreimel et al., 2020, Korkmaz et al., 2016, Moussa et al., 2016]. On the other hand, host anomaly detection [Cheng et al., 2017, Lee and Hong, 2020] cannot know if abnormal Scada execution (e.g., system calls) has adverse process effects. Because these (disjointed) techniques cannot tie the Scada cause and process effect of attacks, they cause high false alarms due to benign faults and errors [Ike et al., 2022]. Further, PLC defenses (e.g., VetPLC [Zhang et al., 2019]) can detect altered PLC logic but are not suited for Scada adversaries, who can alter PLC parameters at run-time without touching its logic.
Identifying malicious Scada actions that cause adverse process effects, and tying them in time to the process behavior is challenging because Scada and industrial processes differ in semantics and time evolution. That is, while Scada runs discrete software at CPU speed, processes are governed by continuous physics laws, which constrain their actuation (e.g., inertial delays). A recent work, Scaphy [Ike et al., 2022], analyzed both Scada and process data to detect attacks. Scaphy used Open Platform Communication (OPC) events [ae, 2022, ae1, 2022, opc, 2022, Son and Yi, 2010, Mahnke, 2010] to induce system call signatures unique to Scada phases and physical states. However, its analysis in each domain was disjointed and not connected in semantics or time. This led to high false alarms from isolated alerts. In addition, Scaphy’s reliance on signatures limits it to only known attacks, i.e., it cannot detect unknown attacks. As demonstrated in our experiments, attacks that use normal Scada tools/system calls (e.g., Oldsmar) will evade Scaphy’s signatures.
Connecting Scada and processes semantically involves understanding process constraints in Scada operation, and alternatively, identifying Scada effects in process behavior. To control processes, Scada adheres to physics dependencies intrinsic to process tasks i.e., how actuators depend on each together to achieve a task [Green et al., 2017]. Therefore, an ideal semantic relationship can be formulated from this "process adherence" in software. However, discrete system calls (used in Scaphy) cannot capture process dynamics, which are continuous. At a high level, we first inspect relevant program-flow dependencies in process-control logic. For example, if Scada monitors device A to actuate device B, then B depends on A. Then, we statistically measure the continuous behavior of these dependencies in process-control executions. Through this, an attacker’s violations of intrinsic process constraints in Scada, will result in adverse process effects, which can now be selectively flagged in Scada.
To detect adverse process effects (i.e., due to Scada attack), neural networks such as autoencoders (AE) [Rumelhart et al., 1985, Bank et al., 2020] can learn normal process behavior via sensor-actuator time-series data. An AE aims to reconstruct its input as its output. Since there is compression in the AE inner layers, it is forced to learn relationships in the input distribution. This way, AEs trained on benign time series will have errors reconstructing anomalous sequences (via a loss function), allowing adverse change effects to be detected. However, training data are limited in practice, which can limit AE’s accuracy [Ahmed and Zhou, 2020, Mirsky et al., 2018].
Further, processes experience inertial forces (due to physics factors e.g., friction/momentum [Dissanayake et al., 2001]) which resists change in actuators. This introduces irregularities/noise to process dynamics [Dissanayake et al., 2001, Ma et al., 2008, Kan et al., 2020]. This not only impairs AE’s correctness but impedes the ability to analyze malicious Scada effects on processes, especially stealthy perturbations that blend with noise [Kreimel et al., 2020, Korkmaz et al., 2016, Moussa et al., 2016].
In addition, connecting Scada and processes in time aims to determine where or when a Scada attack can be noticeably detected in process behaviors. This is critical to tie both attacks in time. Recall that inertial forces can maintain process behavior for a while even when under attack. For example, a conveyor belt actuated by large discs will not stop/slow down at once after a stop command. As such, when Scada attacks are flagged, the adverse effect may not be present in the same time window, which leads to false negatives (when correlated), but later causes damage. Further, because AEs analyze process inputs sequentially, this causes more time discrepancies in correlating with the faster Scada side. We present Bridge, a domain knowledge-based analysis and correlation of Scada and industrial process attacks that bridges their unique semantic and time evolution. This enables operators to tie malicious Scada execution to their adverse process effects, which reduces false alarms and improves attack understanding. At the Scada side, Bridge analyzes the physical dependency constraints of Scada process-control and measures their statistical behavior such as control frequencies and bursts. Because process-control behavior vary based on a process setpoint (e.g., what level to fill a tank), Bridge develops a statistical solution based on coefficient of variations [Brown, 1998, Canchola et al., 2017], which aggregates measured constraints to work for processes regardless of their calibrated setpoints. Using these constraints, Bridge selectively monitors and flags a Scada attacker’s executions that violate intrinsic process semantics.
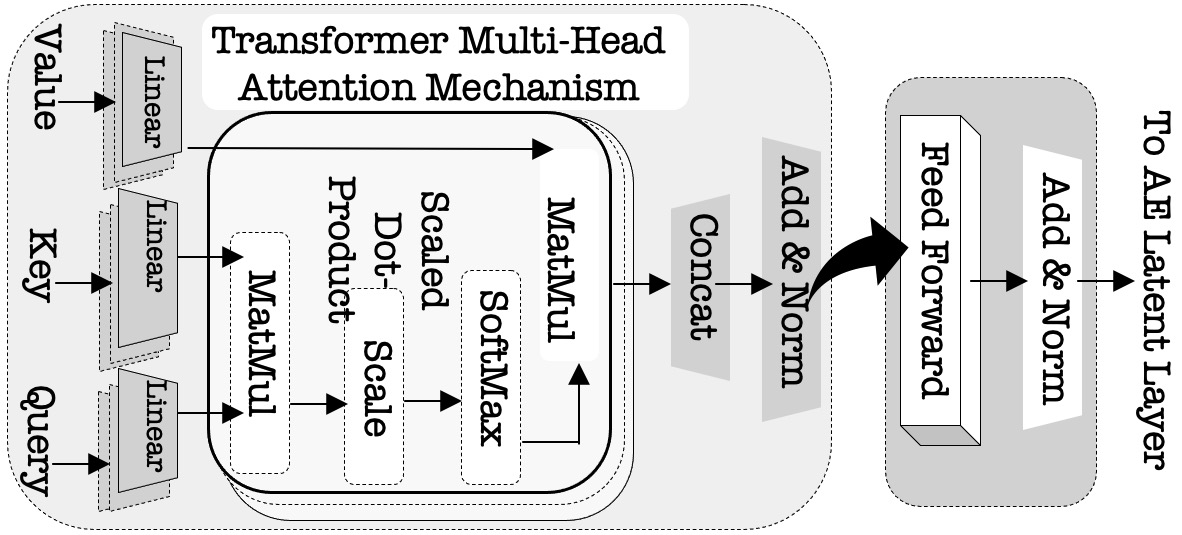
On the process side, Bridge develops a physics-informed neural network (PINN) [Cai et al., 2021, Cuomo et al., 2022] that embeds physical laws on inertial process dynamics via a partial differential equation (PDE) loss function. This facilitates it to capture the right solutions and generalize well even in limited data. To mitigate sequential delays in process time-series, Bridge implements the PINN in a Transformer-based architecture, which instantiates parallel Attention processes [Luong et al., 2015] for each sequence input, enabling timely correlation with Scada.
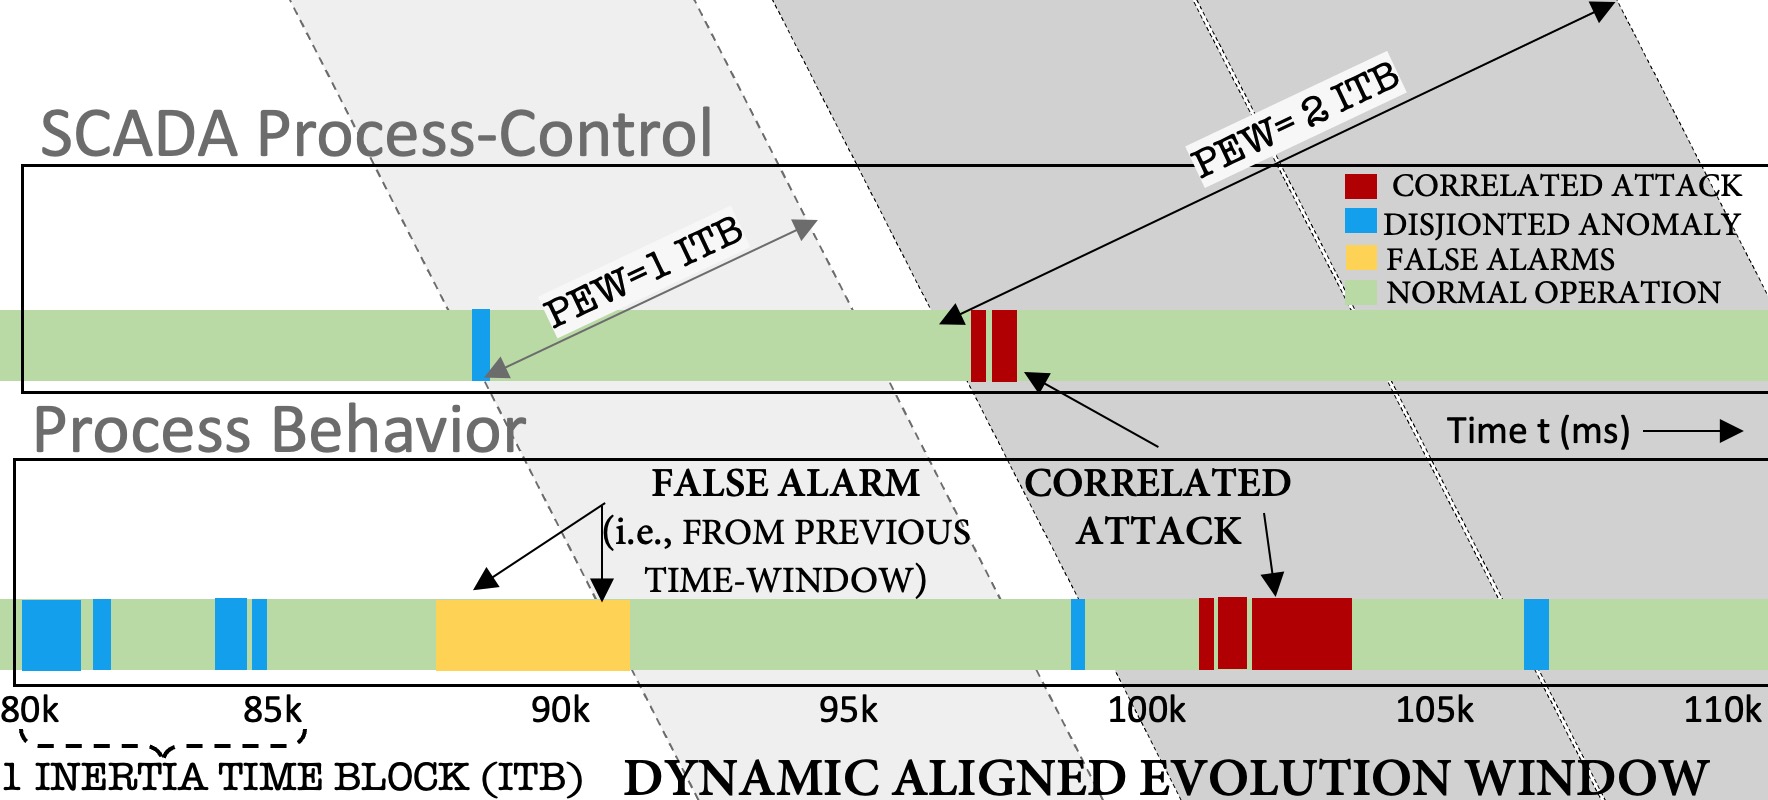
To align Scada and process evolution in time (to know where Scada attacks can be noticeably detected in processes), Bridge first uses a hybrid data-driven approach to derive the inertia delay associated with a process task, called inertia time-block (ITB). It does this by analyzing the rate of change of relevant process values. After a Scada attack is flagged, Bridge waits for one ITB before checking for process anomalies (i.e., process effects lag behind Scada by at least 1 ITB). Then, it continues to analyze anomalies using a dynamic process evolution window, which interleaves multiple ITBs until the process rate of change reaches a steady state (i.e., no change). Through this, Bridge derives an evolution window that bounds the temporal lifespan of Scada effects on processes.
Bridge’s correlation approach (shown in Fig. 1) detects attacks that current work miss such as attacks that infect benign Scada tools to stealthily alter processes (e.g., Oldsmar attack), but over time cause damages. In these stealthy attacks, recent tools such as Invariant and Scaphy will either discard the small deviation as false alarms or (if they narrow their thresholds), will trigger other benign deviations as attacks. This is because additional evidence (i.e., Bridge’s semantic connection of a prior Scada anomaly in the process evolution window) is needed to confirm the attack and discard false alarms by current (disjointed) analysis. Since modern attacks [Miller et al., 2021, Fischer et al., 2018, Hemsley et al., 2018, ris, 2022, ics, 2022a] infects Scada to attack processes, we leverage this real-world ICS threat-model to apply process anomalies as a filter for Scada attacks. That is, although process anomalies are analyzed, they are not used unless a Scada attack is flagged in the process evolution, i.e., the effect cannot happen before the cause.
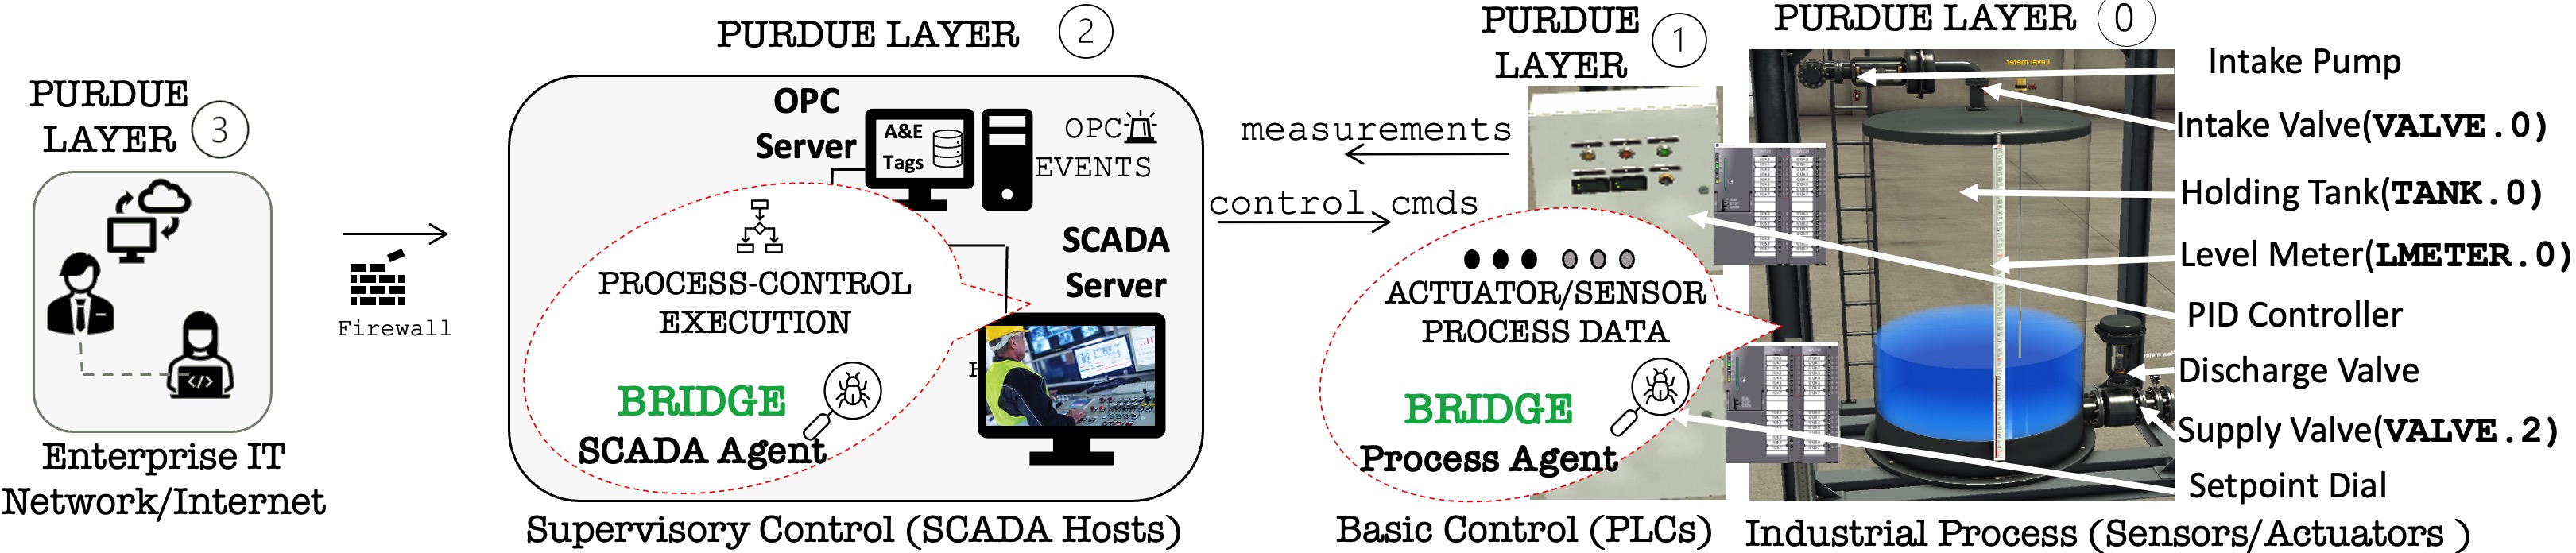
Since Bridge uses generic Scada and sensor/actuator data, it is device-agnostic and applies to industrial processes based on the widely-deployed ICS Purdue model [Automation, 2011]. Further, since inertia is a physics property of actuation systems, our PINN is generic to ICS processes but vital for correlation with Scada. Unlike Scaphy, which makes attack assumptions using signatures, Bridge generalizes attacks by detecting anomalies that violates intrinsic semantic constraints in industrial processes. We make these contributions:
-
(1)
We present a new technique to correlate Scada and process attacks both semantically and time-wise via domain knowledge that bridges their unique behavior and time evolution.
-
(2)
We introduce a physics-informed learning architecture that captures inertial dynamism in processes via a domain PDE loss function deployed in a Transformer-based AE. This not only increases the learning robustness in limited data, but enables it to timely and accurately correlate with Scada.
-
(3)
We propose a new technique to derive intrinsic process constraints from Scada execution, which works for unique processes regardless of their setpoint calibration.
-
(4)
We performed extensive experiments and case studies to validate Bridge using public real-world data from 11 diverse industrial processes111https://github.com/lordmoses/Scaphy and attacks inspired by past events. We compared Bridge to Scaphy [Ike et al., 2022] and Invariant [Feng et al., 2019]. Bridge correlated 98.3% of attacks with 0.8% false positives (FP), compared to 78.3% detection and 13.7% FP in the second best work, Scaphy. Bridge is available online222https://anonymous.4open.science/r/bridge/.
2. Background And Motivation
In this section, we describe ICS operations based on the Purdue network model. To motivate our problem, we use a real-world attack running example to show how Bridge is applied in the Scada and process sides. We then analyze the challenges of detecting modern attacks and existing work limitations in comparison to Bridge.
2.1. Industrial Processes and Control Operations
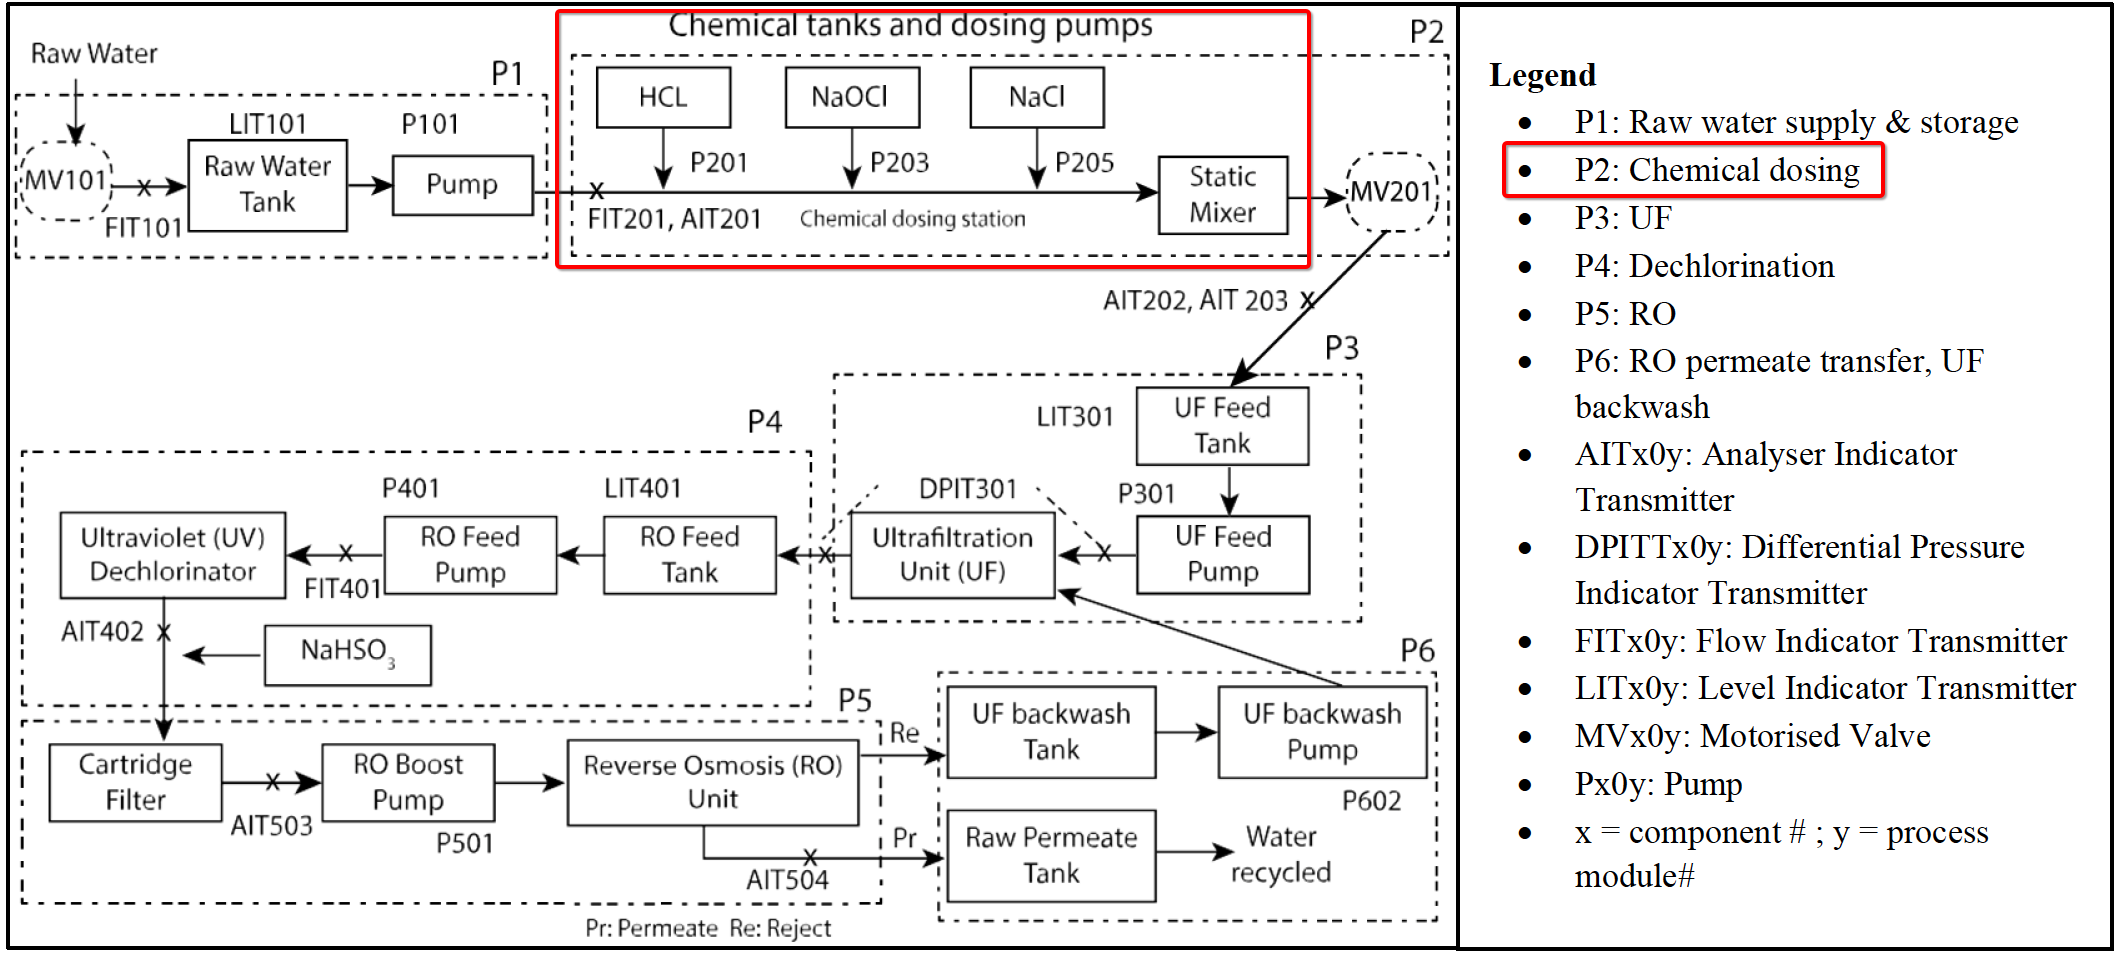
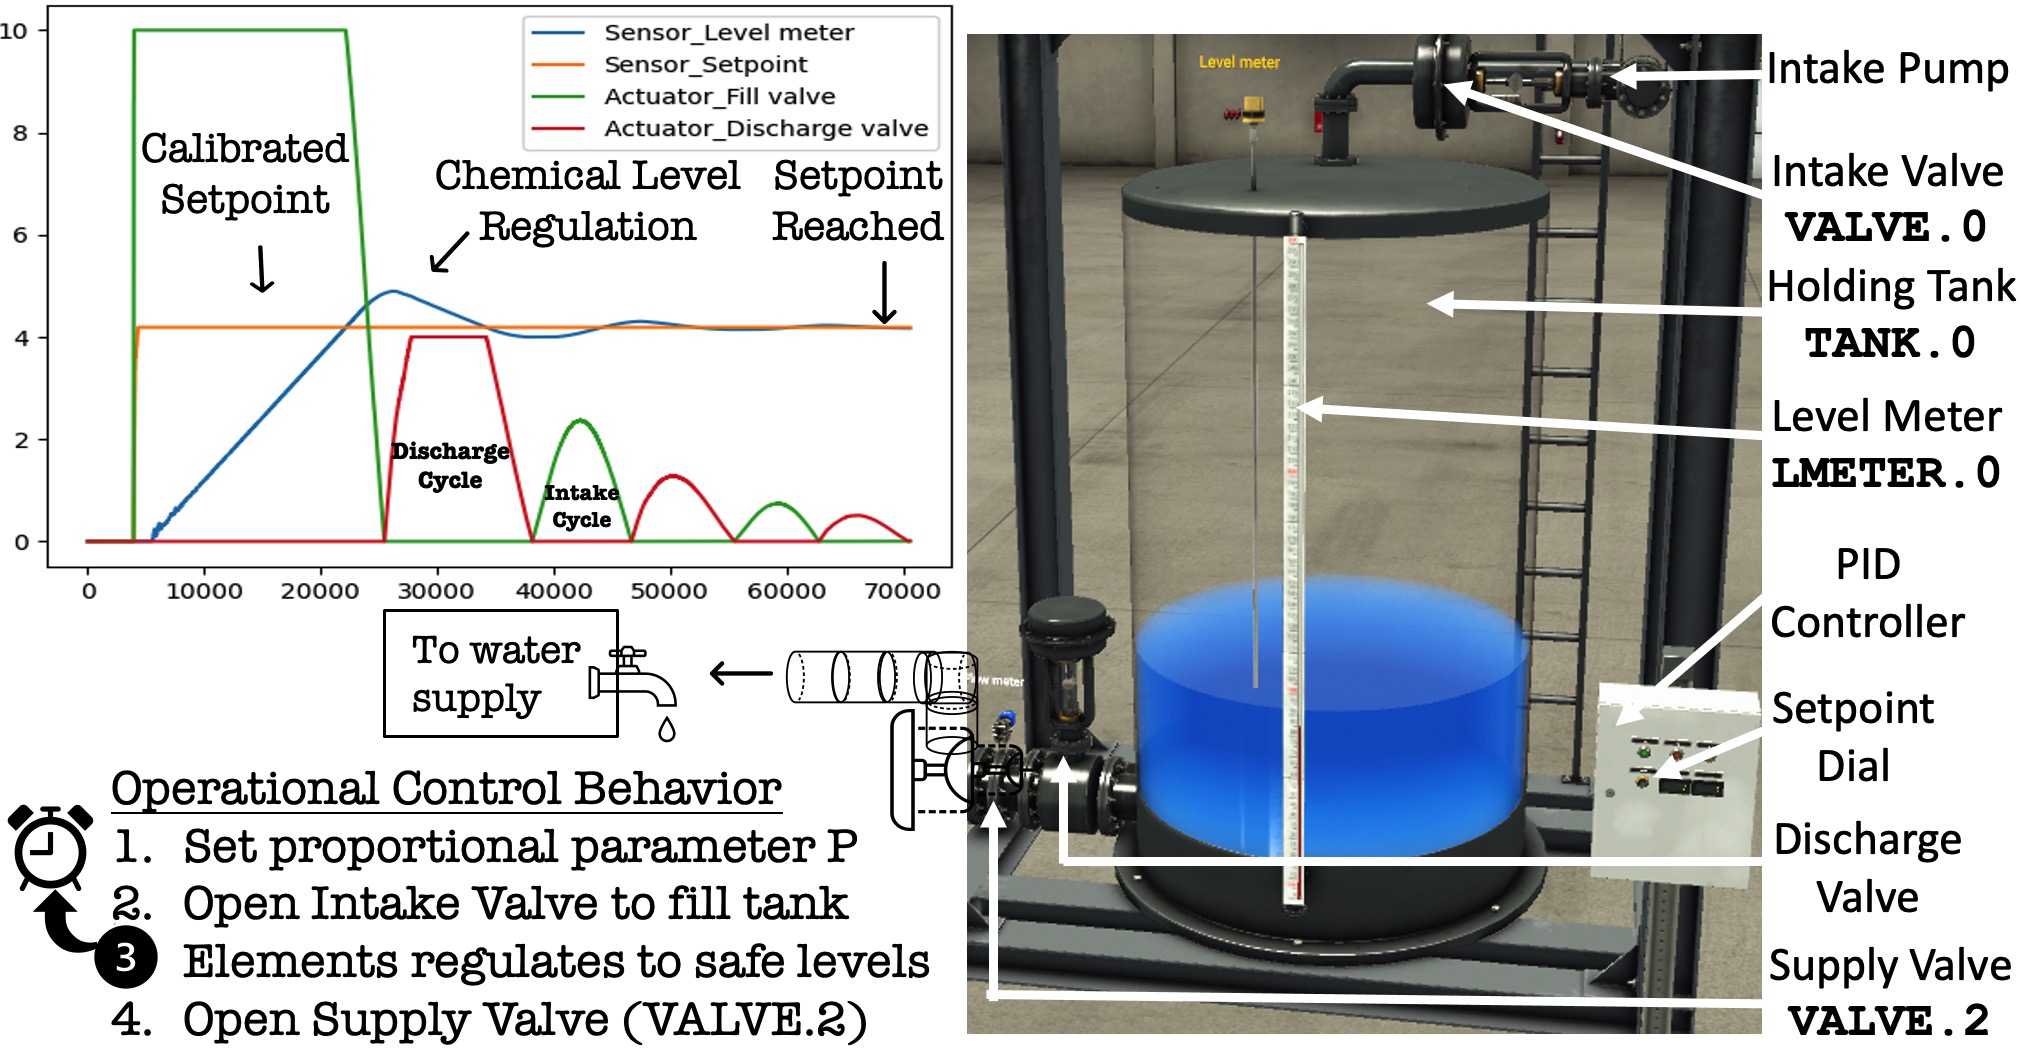
Physical tasks in industrial plants are called processes [Ike et al., 2022]. Without loss of generality, Fig. 2 describes the Scada and physical domain of ICS using a chemical dosing process in a real-world water treatment plant. Actuators (e.g., pumps, valves) at Purdue layer 0 work together to achieve the process task, such as filling a tank to a setpoint level (). Actuating systems are governed by physics laws such as inertia. For example, the opening (speed) of a solenoid valve depends on the strength of induced electromagnetic fields. These dynamic physics factors constrain industrial process behaviors (called process dynamics) and time evolution. Further, PLCs at layer 1 set the basic inputs of actuators at every scan cycle. Scada hosts at layer 2 perform supervisory control of all actuators and PLCs. They run special software to monitor/respond to process events and manage processes to achieve their task [Green et al., 2017, sie, 2022].
| ICS Traffic Analysis | Physical Behavior Analysis | PLC Logic Analysis | SCADA Host Exec. | |||||||||||||||||||||||||||||||||||
| Sequences | R. Learning | Process-Aware | + Physical | |||||||||||||||||||||||||||||||||||
| Techniques |
Critical [Carcano et al., 2011] |
State-IDS [Fovino et al., 2010] |
Pattern [Valdes and Cheung, 2009] |
SPEAR [Ahmadi-Assalemi et al., 2022] |
Yang [Yang et al., 2019] |
Ihab [Darwish and Saadawi, 2018] |
Ponoma. [Ponomarev, 2015] |
Diversity. [Bulle et al., 2020] |
Evolution. [Slowik, 2019] |
ML PIDS [Ayodeji et al., 2020] |
Experion [Shrestha et al., 2018] |
Blockchain [Maw et al., 2019] |
Kurt [Kurt et al., 2018] |
Zhong [Zhong et al., 2021] |
Panfili [Panfili et al., 2018] |
Chromik [Chromik et al., 2018] |
Nivethan [Nivethan and Papa, 2016] |
Remke [Chromik et al., 2016] |
Lin [Lin et al., 2016] |
Ghaeini [Ghaeini et al., 2018] |
Dina [Hadziosmanovic et al., 2014] |
Aoudi [Aoudi et al., 2018] |
OSCIDS [Al Balushi et al., 2016] |
Abbasi [Abbasi et al., 2017] |
Invariant [Feng et al., 2019] |
TABOR [Lin et al., 2018] |
Niang [Niang et al., 2017] |
Mulder [Mulder et al., 2013] |
Formby [Formby and Beyah, 2019] |
PLC-Sleuth [Yang et al., 2020] |
PLCDefend [Salehi and Bayat-Sarmadi, 2021] |
NoisePrint [Ahmed et al., 2018] |
TSV [McLaughlin et al., 2014] |
VETPLC [Zhang et al., 2019] |
Lee [Lee and Hong, 2020] |
Orpheus [Cheng et al., 2017] |
Scaphy [Ike et al., 2022] |
Bridge |
| Action Sequence | ||||||||||||||||||||||||||||||||||||||
| State Transitions | ||||||||||||||||||||||||||||||||||||||
| Event-based | ||||||||||||||||||||||||||||||||||||||
| ICS Traffic | ||||||||||||||||||||||||||||||||||||||
| Response Analysis | ||||||||||||||||||||||||||||||||||||||
| Physics Modelling | ||||||||||||||||||||||||||||||||||||||
| PLC Control Logic | ||||||||||||||||||||||||||||||||||||||
| Logic verification | ||||||||||||||||||||||||||||||||||||||
| Control register | ||||||||||||||||||||||||||||||||||||||
| Online POMDP | ||||||||||||||||||||||||||||||||||||||
| Reward weights | ||||||||||||||||||||||||||||||||||||||
| Multi-agent game | ||||||||||||||||||||||||||||||||||||||
| Rules/Signatures | ||||||||||||||||||||||||||||||||||||||
| Power-flow rules | ||||||||||||||||||||||||||||||||||||||
| Host Execution | ||||||||||||||||||||||||||||||||||||||
| Semantic Correlate | x | |||||||||||||||||||||||||||||||||||||
| Time Correlation | x | |||||||||||||||||||||||||||||||||||||
This is called process-control. For example, Siemens SIMATIC water systems manage entire transition operations in water treatment plants [Addeen et al., 2021, sie, 2022].
2.1.1. SCADA Event-Based Process-Control
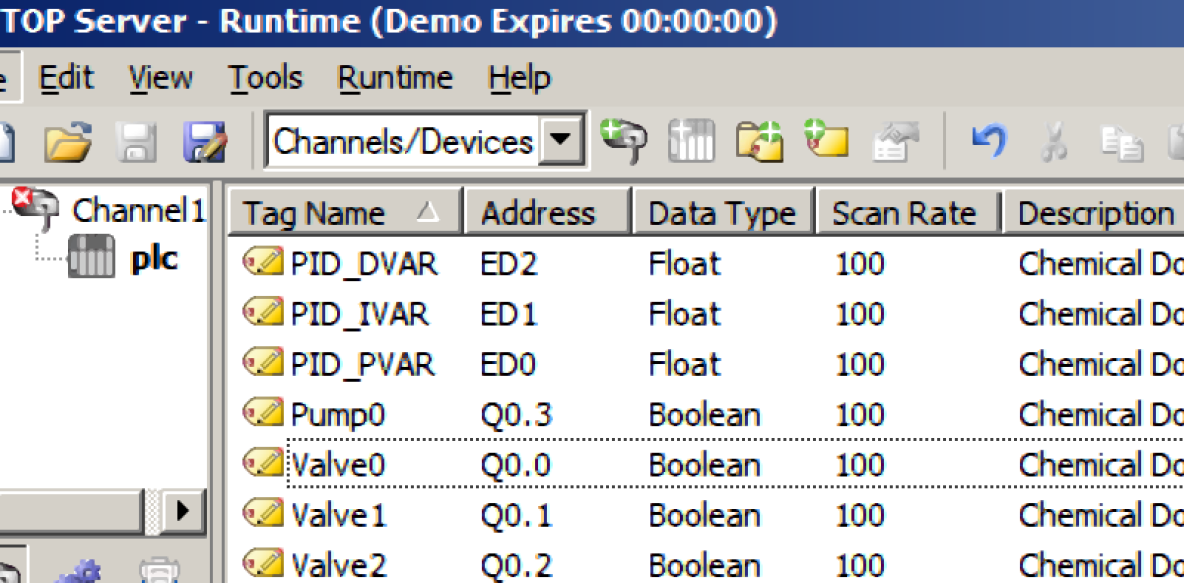
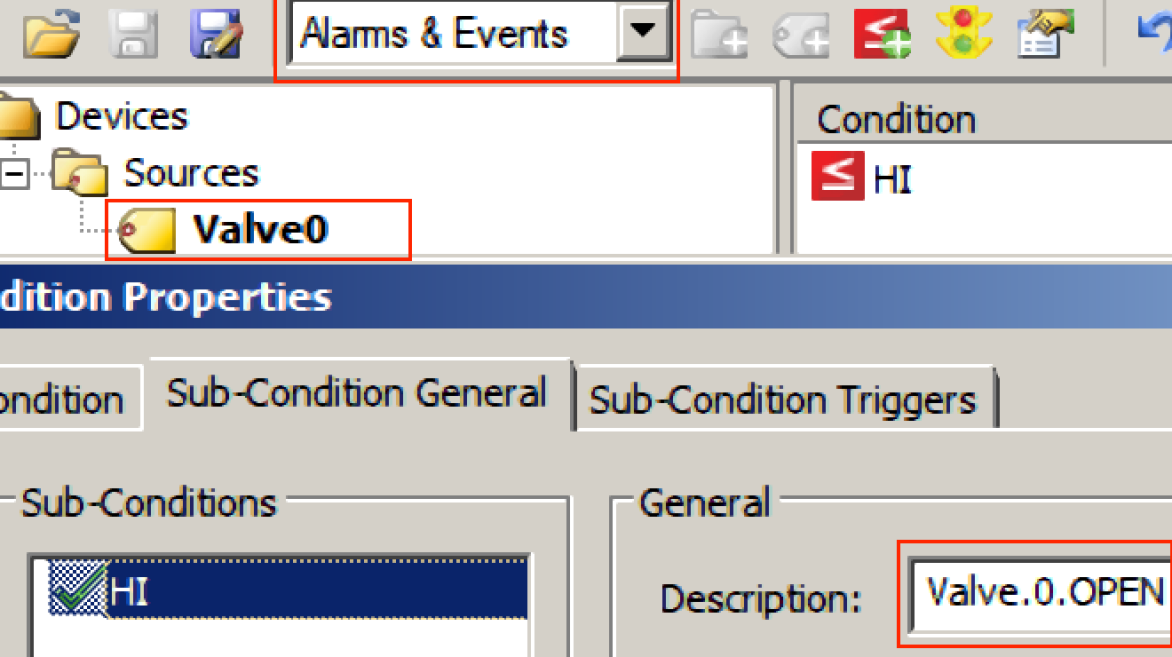
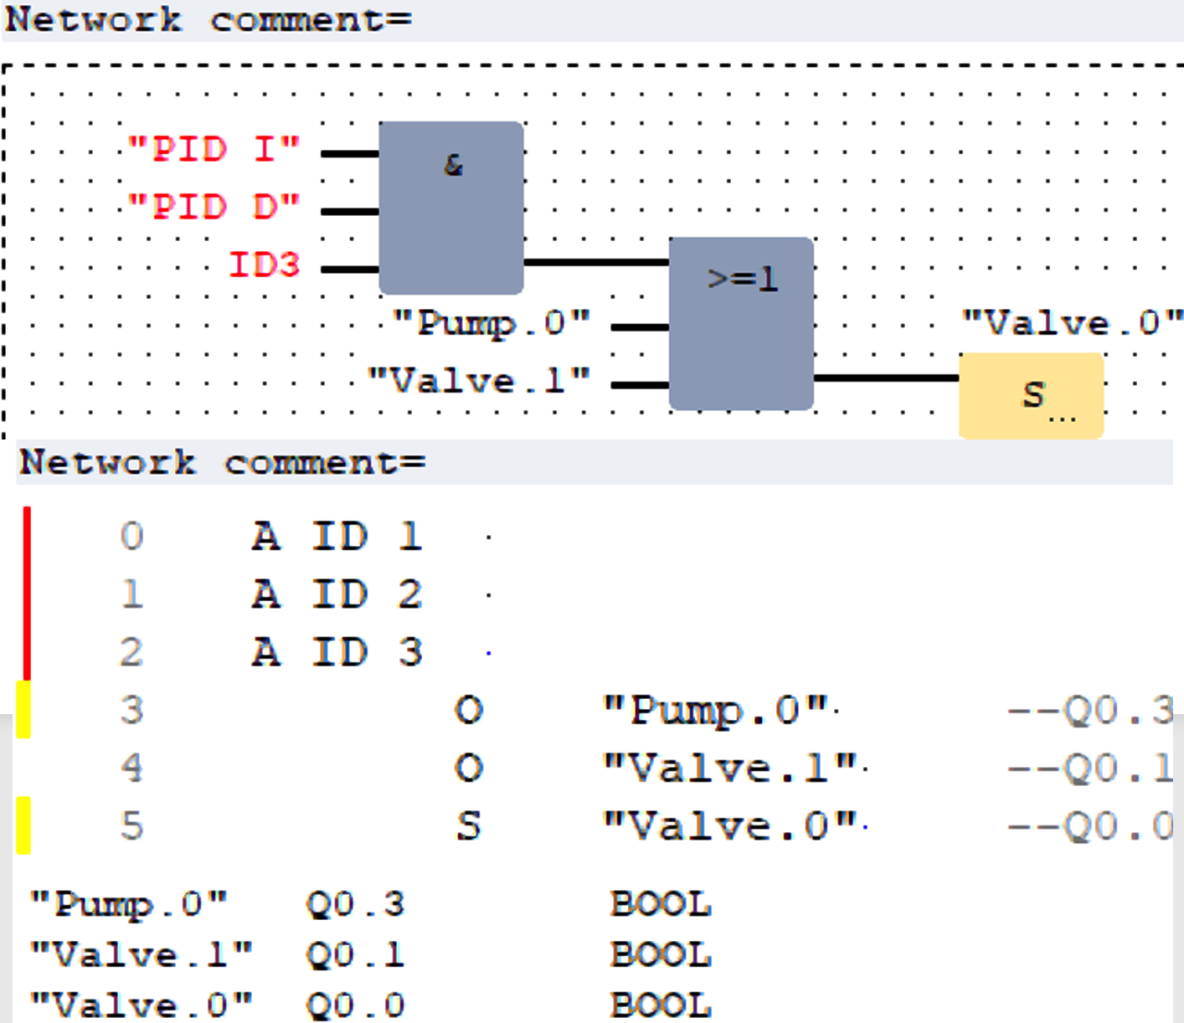
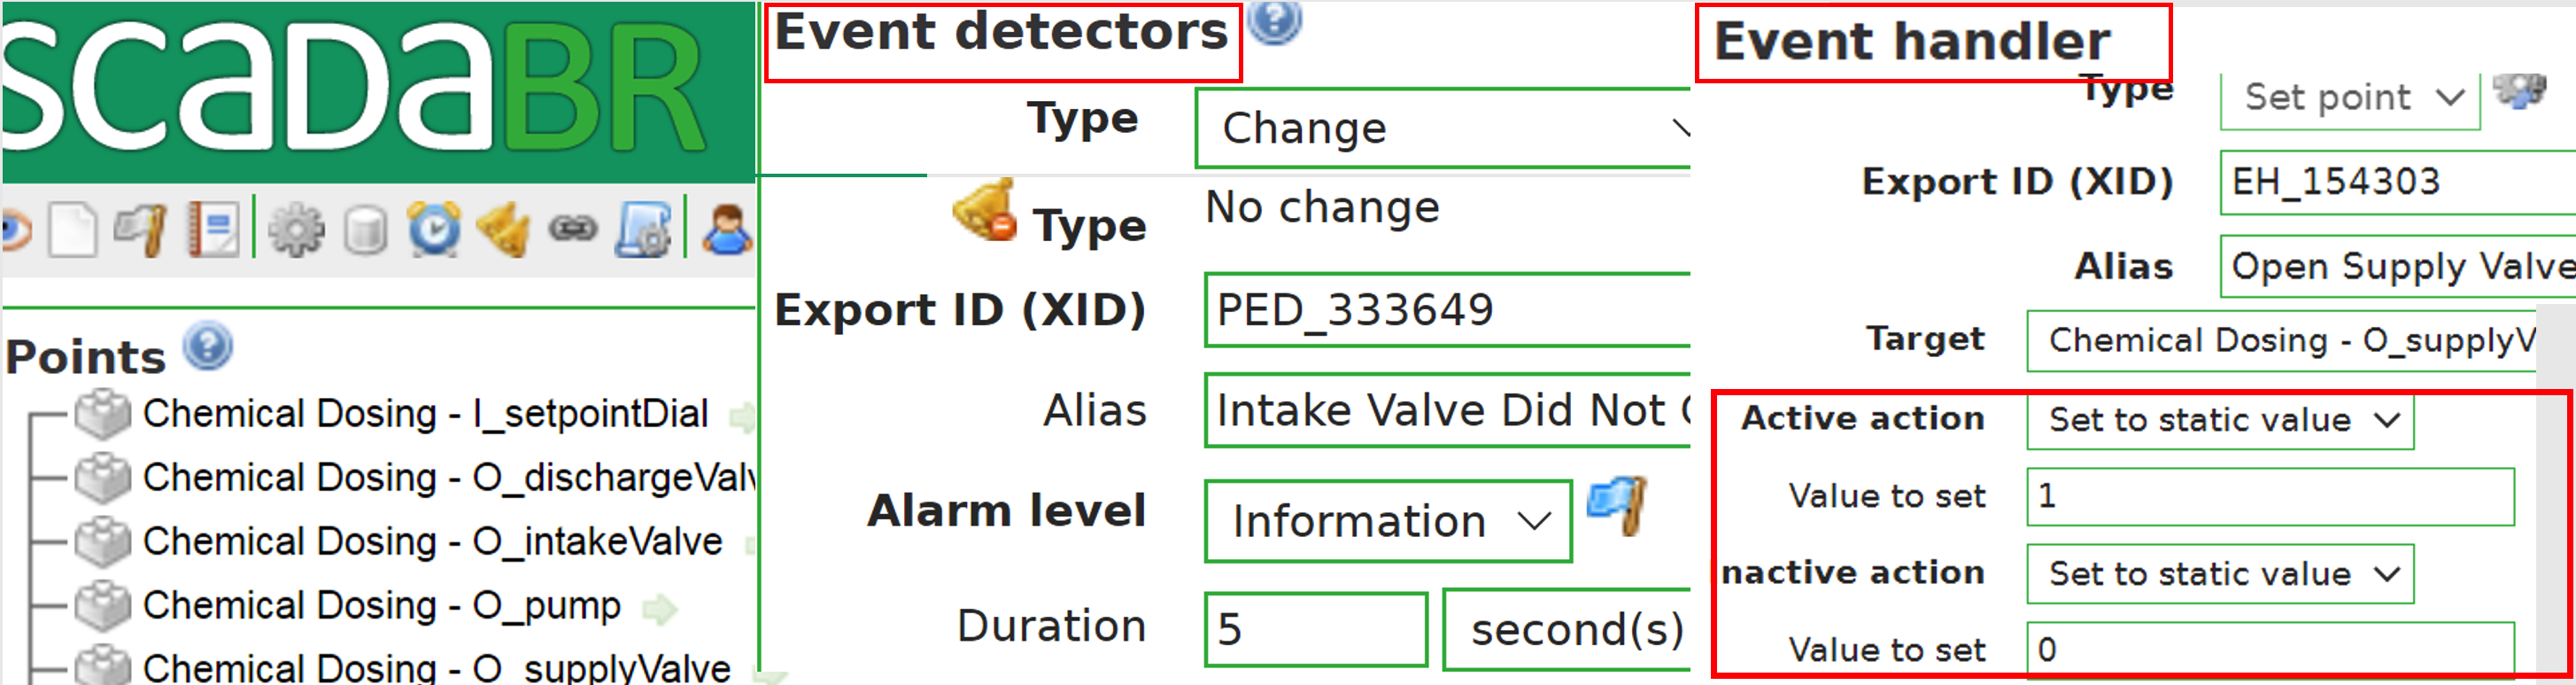
When process events occur, Scada executes event-handling process-control routines. This involves reading and writing relevant parameters to resolve the event (e.g., fault correction, process transition). As such, Scada events can be used to artificially induce its process-control execution, allowing it to be analyzed [Ike et al., 2022]. Scada events are specified using OPC event tags [ae, 2022, ae1, 2022]. OPC is a widely deployed service in ICS plants to enable data compatibility in common formats called tags [opc, 2022, Son and Yi, 2010, Mahnke, 2010]. As an example, Fig. 3 shows relevant Scada settings in a real-world chemical dosing process [Ike et al., 2022]. Fig. 3(a) shows the actuators and parameters. Fig. 3(b) shows the OPC event tags, one of which is Valve.0 (Intake Valve). The shown tag, Valve0.open, means that Scada responds to device states that trigger the Intake Valve to open (called event-trigger states). Fig. 3(c) shows a function block diagram (FBD) of the process. FBD is a graphical logic that describes how devices are connected and operated. FBD can be converted to readable text, called statement list (STL). As shown in Fig. 3(c), the STL logic evaluates to Valve.0. This means that Valve.0 is dependent on all devices in the STL block. Hence, the union of all states of these devices is the event states Scada responds to. Fig. 3(d) shows Scada event-handling settings for the water treatment example.
2.1.2. Real-World Attack Running Example
In 2021, an attacker compromised the Scada HMI in the City of Oldsmar’s water treatment plant via Teamviewer [flo, 2022a, b, Davies et al., 2022, Ocampo, 2021]. He then ran commands to raise the dosing rate of Sodium Hydroxide (NaOH) to toxic levels, endangering citizens. Water plants use NaOH to set water PH, but it is toxic in high doses. This Scada attack disrupted the chemical dosing process, increasing NaOH from 100 ppm level to 11,100 ppm [flo, 2022a, b, Davies et al., 2022, Ocampo, 2021].
2.2. Industrial Process Attacks and Challenges
Modern attacks on industrial processes are launched from infected Scada hosts to alter its parameters [Miller et al., 2021, Fischer et al., 2018, Hemsley et al., 2018, ris, 2022, ics, 2022a]. Scada adversaries evade detection by blending with normal host/network behavior while stealthily perturbing processes, which over time leads to damages [Green et al., 2017]. Stealthy attacks blend well with benign noise/faults, which triggers false alarms in current process anomaly detection tools. To reduce false alarms, it is vital for operators to connect process anomalies to the causal malicious Scada operation. This requires identifying Scada actions that have adverse process effects, and then tying these actions in time to the process behavior. This increases detection accuracy and improves attack understanding. Sadly, this is challenging because Scada and industrial processes differ in both semantics and time, i.e., their behavior does not map to each other nor evolve at similar time scales. This is because while Scada executes discrete software at CPU speed, processes follow continuous physics laws and are subject to inertial forces or delays.
Scada hosts have dedicated connections to devices via secured serial or TCP sessions [Ike et al., 2022]. As such, Scada attackers hitchhike on their normal operation to avoid triggering host anti-viruses such as terminating the Scada program and initiating a new session with devices. For example, Stuxnet [stu, 2022] infected Siemens Scada to re-program PLCs under the legitimate program context, and the Oldsmar attack used HMIs. Further, due to the presence of re-programmable third-party tools in Scada hosts, defenses such as code-signing may not be easily enforced, allowing attackers to infect Scada programs. Unlike in IT, Scada has many complex physical dependencies. As such, applying current program analysis tools [Alrawi et al., 2021, Chipounov et al., 2011] to assess them may be intractable due to hardware-constrained code paths and physical environment need.
2.3. Limitations of Current ICS Defenses
To accurately detect industrial process attacks with low false positives, it is necessary to tie the causal malicious Scada operation to the adverse process effect. Existing techniques inspect data in hosts, PLCs, and physical domains. However, most analyses are done in isolation (i.e., with no cross-domain correlation) as shown in Table 1. Physical anomaly detection [Lin et al., 2018, Urbina et al., 2016, Ghaeini et al., 2018, Feng et al., 2019, Chromik et al., 2018, Lin et al., 2016, Nivethan and Papa, 2016, Chromik et al., 2016, Janicke et al., 2015] including reinforcement learning [Kurt et al., 2018, Zhong et al., 2021, Panfili et al., 2018, Wilson et al., 2018] can detect anomalous process behavior but cannot tie it to their cyber cause, which leads to false alarms due to benign anomalies such as faults/noise. PLC defenses [McLaughlin et al., 2014, Zhang et al., 2019] detect altered PLC logic, but are not suited for Scada adversaries, who can modify PLC parameters/coils at run-time without altering its logic. Host anomaly detection [Cheng et al., 2017, Lee and Hong, 2020] can flag abnormal system calls, but cannot know if the flagged calls have adverse physical effects (i.e., discrete system calls does not map to the continuous process behavior). Network analysis tools [Yun et al., 2013, Halvorsen and Rrushi, 2017, Goldenberg and Wool, 2013, Singh et al., 2016, Al-Madani et al., 2019, Maglaras and Jiang, 2014, Stewart et al., 2017, Irvene et al., 2019] can detect unusual and noisy traffic (e.g., scans and illegal packet fields) but cannot catch semantic-based attacks (e.g., process perturbation) which can use normal tools to emit normal traffic.
2.3.1. SCADA and Process Correlation
Scaphy [Ike et al., 2022] is a recent work that combined Scada and process signatures to detect attacks. Scaphy used OPC events to induce and learn system calls unique to Scada phases. Then, it created physical signatures based on inconsistent device states. However, Scaphy’s analysis of Scada and process behavior were disjointed from each other or not connected either semantically or time-wise. For example, discrete calls do not map or capture any process dynamics behavior, which is continuous in nature. This led to high false alarms from its isolated alerts. In addition, Scaphy’s design of relying on signatures limits it to only known attacks, i.e., it cannot detect unknown attacks. In our experiments, we show that attacks that use normal system calls (e.g., infected Scada tools) will evade Scaphy’s signatures.
2.4. Threat Model and Assumptions
We assume a similar threat model as current works where an attacker has infected Scada programs and can execute commands to alter devices [Feng et al., 2019, Cheng et al., 2017, Ike et al., 2022]. Similar to recent work [Ike et al., 2022], Bridge comprise of two privileged agents that monitor executions in Scada, and another that logs sensor/actuator values from PLCs (depicted in Fig. 1/Fig. 2). As in these works, the agents are assumed to run in a Trusted Computing Base, hence cannot be tampered with. We do not consider non Scada-originated attacks such as side-channels [Han et al., 2017, Liu et al., 2016] or direct physical access to devices/PLCs. Based on public data [Miller et al., 2021, Fischer et al., 2018, Hemsley et al., 2018, ris, 2022, ics, 2022a], vast majority of in-the-wild attacks are launched from Scada [Ike et al., 2022]. We note that PLC Man-in-the-middle attacks have been addressed by previous work [Salehi and Bayat-Sarmadi, 2021, Yang et al., 2020] and in practice using non-PLC diode gateways [dio, 2022]. Hence it is outside of our scope.
2.5. Domain Knowledge Analysis of SCADA and Process Semantics and Time Evolution
Our idea to bridge the unique semantic and time evolution of Scada and industrial processes is to first understand process constraints in Scada, and alternatively, identify Scada effects on process dynamics. Then, we use knowledge of how physics factors constrain process time evolution to align it with Scada so their behaviors can be correlated in time. This approach is generic to industrial processes, i.e., only requires logs from actuators/sensors and Scada hosts. Through this, Bridge overcomes current limitations in detecting process attacks such as disjointed analysis (i.e., which causes false alerts) and signature-based detection (e.g. as in Scaphy).
2.5.1. Analyzing Process Constraints in SCADA
Since Scada process-control adheres to physics dependencies (i.e., how actuators operate and inter-depend on each other to achieve a physics-governed task) in managing industrial processes, we first used OPC events to induce process-control execution trace, which reveals program-flow dependency of Scada operations on processes. For example (without loss of generality), in a chemical dosing process, the Supply Valve depends on the Intake Valve state to operate and transition the water treatment operation [Ike et al., 2022]. In the process-control trace, we uncover this by tracing read calls on the Intake Valve followed by a predicate check, and then a write call on the Supply Valve (called Read-before-Write process-control constraint). Then, Bridge measures its continuous statistical behavior such as its frequency and bursts (or intermittence). Bridge then aggregates these constraints and uses them to selectively monitor the attacker’s process-targeted executions that violate intrinsic process constraints, which are as follows: (1) control-time or time-interval between two dependent write calls (2) control-burst or difference in the number of adjacent write calls on a single device, and (3) control-frequency of device write calls relative to others. Note that command calls are addressed to devices. Hence dependent commands imply dependent devices. In Windows OS, which dominates SCADA, write and read operations specify the communication session (e.g., serial or TCP) and the Device-Tag in their arguments.
2.5.2. Embedding Domain Knowledge on Process Dynamics
To analyze anomalous process behavior, Bridge develops a physics-informed architecture that embeds knowledge of inertial laws in actuating systems. It uses a PINN that integrates a PDE loss function to minimize inertial irregularities/noise in the process input distribution. This increases the learning algorithm’s correctness even in limited training data, facilitating it to detect injected subtle adverse effects. Through this, Bridge detects malicious Scada effects on processes, especially stealth perturbations, which would have been otherwise blended with noisy behaviors in process dynamics. Inertial measurement units (IMUs) in industrial plants can measure inertia delays in actuating systems [Dissanayake et al., 2001, Ma et al., 2008]. However, this can also be derived by analyzing the rate of change of process value logs using a data-driven approach. Specifically, for processes in motion (e.g., a moving conveyor/actuating valve), we measure the average time it takes to come to stop/de-energize after a stop command. For processes at rest, we measure the time it takes to attain a steady state (e.g., constant speed of conveyor) after a start command
2.5.3. Capturing Industrial Process Periodicity
Industrial actuating systems exhibit periodic/repetitive behavior, such as the up/down movement of a piston, cyclical motion of spinning discs, or off/on switching of regulator valves/pumps. Unlike other neural network applications where longer sequences are preferred, intuitively, sequence sizes that capture a process’s periodic nature will better learn its behavior and detect anomalous effects. Since inertia captures a process’s reaction time to changes, Bridge uses it to inform its PINN sequence sizes, which aptly fits its periodicity. For example, when stop commands are issued to spinning discs, inertial (centrifugal) forces may enable it to complete its rotation. Note that this differs from process to process e.g., a short piston may require a shorter sequence to encode its (periodic) up/down motion. To overcome delays in analyzing periodic sequences (i.e., one after another) and prioritize their causal relationships, Bridge implements its PINN in state-of-the-art Transformer architectures [Vaswani et al., 2017], which learns sequences at once and instantiates multiple Attention processes [Luong et al., 2015] for each input in the periodic sequence.
2.5.4. Aligning SCADA and Process Time Evolution
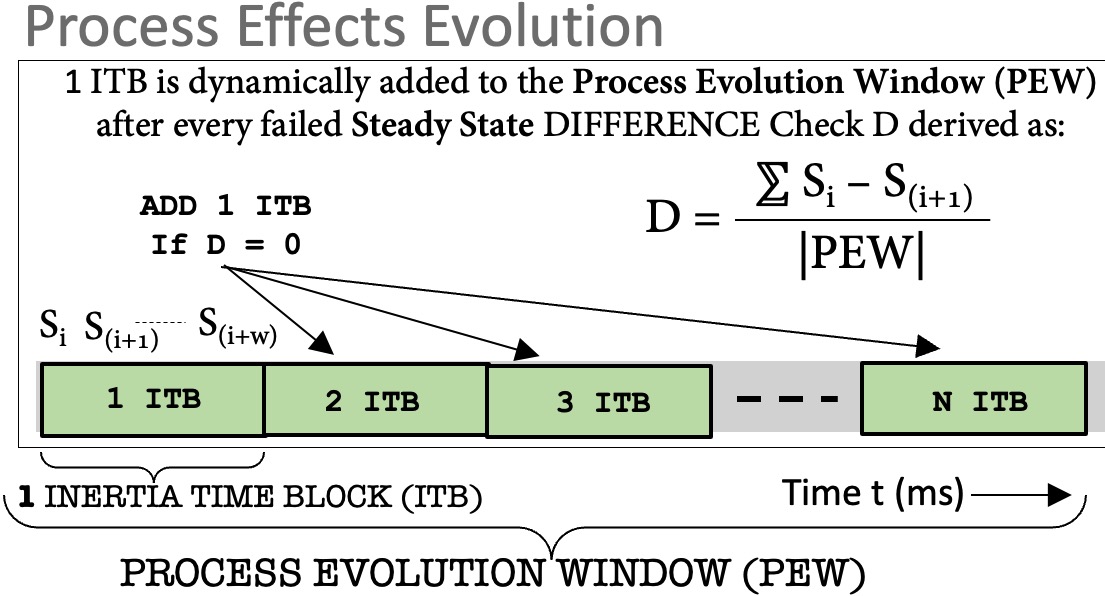
Because inertia causes processes to react slower to changes even after an attack, Bridge analyzes process inertia delays to inform its correlation of Scada and process time evolution. When a Scada attack is detected, we can expect the process effect to be noticeable after the inertia time has passed (called inertia time block or ITB in milliseconds). A process behavior within an ITB is captured by sensor/actuator time series within the ITB period. After 1 ITB has passed, the lifespan of the anomalous effect (called the process evolution window) will vary based on other state conditions. However, it is linear (i.e., non-increasing) for inertial systems [Dissanayake et al., 2001, Ma et al., 2008, Kan et al., 2020]. Hence, we analyze the rate of change of process values to know when it has reached a steady state (i.e. when the avg. difference in successive changes becomes negligible [Ike et al., 2022]). We use this to determine when a flagged Scada attack is done having an effect on a process. Since the ITB captures a process’ reaction time to changes, Bridge performs a steady-state checking after each ITB. If the steady state is not reached, Bridge adds 1 ITB to the process evolution window and continues to do so until the steady state is reached. This approach is depicted in Fig. 4. Through this, Bridge dynamically aligns a Scada attack to its resultant process effect, enabling them to be correlated in time.
2.5.5. Calibration-Agnostic Constraints
When a calibrated amount of physical task increases or decreases, dependent devices also increase or decrease their throughput by the same factor to maintain operational dependence [Ljung, 1998, Åström and Eykhoff, 1971]. When this happens, the absolute dependency value (e.g., the time interval) between two dependent devices may change, but the variation across different task calibrations remains the same. For example, in a chemical dosing process, no matter how high or low to fill a tank, the ratio of the time interval between Intake Valve and Supply Valve actions vary by the same factor. Therefore, it is possible to derive a single dependency variability that works for any calibration of the same process, as long as the inter-dependent devices remain the same. To do this, Bridge leverages an established mathematical foundation called the coefficient of variation () [Brown, 1998, Canchola et al., 2017], which succinctly embodies this physical phenomenon. measures the ratio of standard deviation to the mean to compare degrees of variation from one data series to another, even if their means are drastically different. Using , Bridge aggregate statistical values for each dependent device pair by computing their relative dependency (or ) for different runs of the process. Via , Bridge process constraints can be applied to detect Scada attacks in a calibration-agnostic way.
3. Design
In this section, we first describe Bridge’s end-to-end approach and its input and output. Then, we describe the formal design of its Scada-side and process-side analysis.
3.1. End-to-End Approach and Input/Ouput
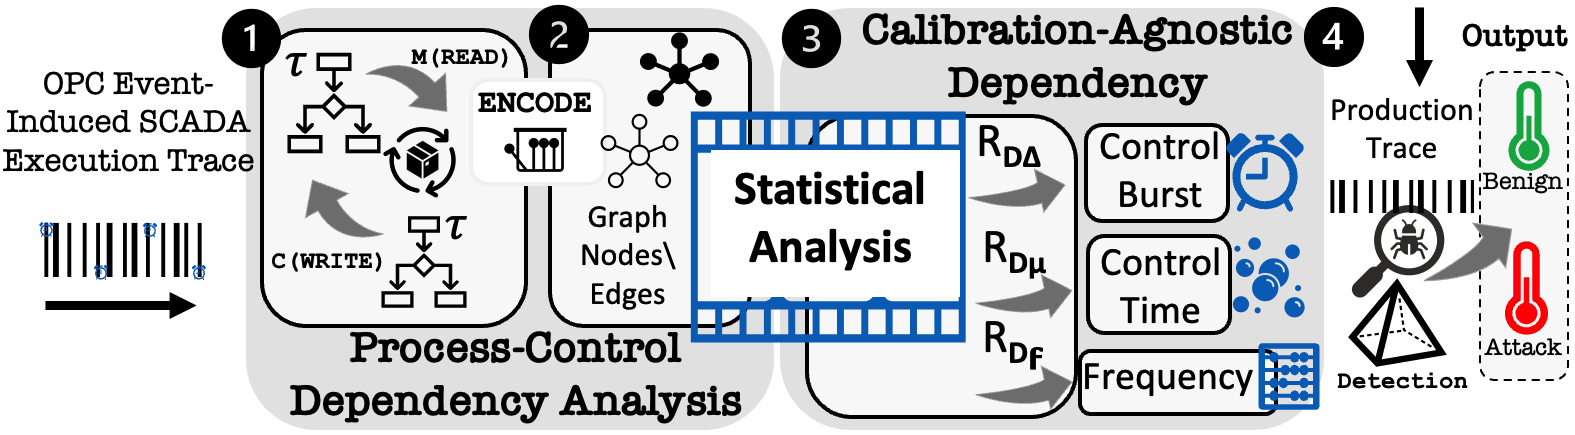
At the Scada side, Bridge takes as input, OPC event-induced Scada execution trace. It outputs 3 process-control constraints, which map each event to a relative dependency () measure used to detect Scada attacks, as follows: (I) event-to-control time (II) event-to-control burst, and (III) event-to-control frequency maps. An event-to-control time map, , means that the time-interval between dependent control commands on devices and due to event in an event set should not deviate from the benign control time variation , otherwise, it is anomalous. Similarly, event-to-control burst map, , means that the control burst between adjacent command bursts on device due to event should not deviate from the control-burst variation . An event-to-control frequency map, , means that the frequency of commands on due to event should not exceed the benign control frequency ratio . Bridge Scada analysis works in 4 phases shown in Fig. 6. It analyzes the input execution trace and extracts the process-control dependency operations (or Read-before-Write). For each dependency pair, it represents their frequency, burst, and time features in a graph, whereby directed edges connect devices in the direction of their dependency relationships. Bridge then aggregates these constraints using the calibration-agnostic relative dependency (or ) formulation. During production, Bridge analyzes process-control logs in Scada hosts to detect behaviors that violate the constraints.
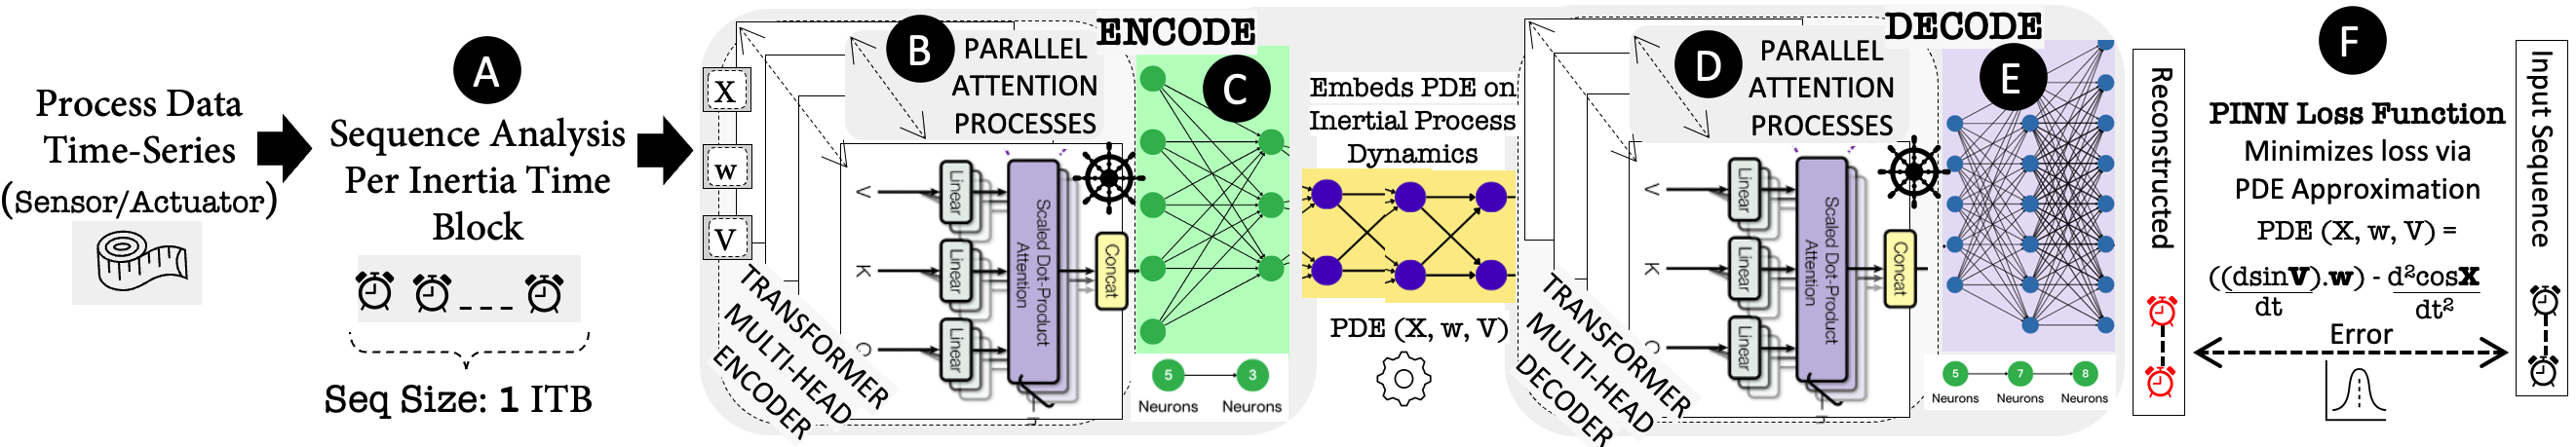
At the process side, Bridge takes as input, time-series of sensor/actuator data per second. It outputs a trained PINN model of the industrial process behavior tailored for correlation with Scada side attacks. Bridge process side analysis works in 6 phases shown in Fig. 5. Bridge pre-processes the input sequences (e.g., scaling, one-hot encoding,) and uses the derived inertia delay to inform the sequence size. It then feeds the input into its Transformer-based AE, which uses parallel multi-head attention blocks to process each sequence input. The output is then concatenated and compressed via the PINN. At the decode stage, the compressed data is processed again via the multi-head blocks, and then uncompressed. The output is reconstructed and the PINN/PDE loss function is applied to compute the error , and fed back to optimize the training. During production, Bridge processes sequences in the same inertia-informed size. As with existing tools [Rumelhart et al., 1985, Bank et al., 2020], it uses the 75th percentile as the threshold to detect anomalies.
3.2. Analyzing Process-Control Constraints
Bridge analyzes physical process dependency between two devices and based on control commands executed on them, and measures their frequency and time features. It then aggregates their relative statistical behavior (of dependent process-control commands) into 3 categories; control time, control burst, and control frequency.
3.2.1. Control Command Dependency
Control command dependency () exists when operation to alter device depends on device . In Bridge, control commands are WRITEs while Monitoring are READs. Scada invokes a monitoring command to read device state. To formulate control command dependency, we first define a process-control operation as a combination of control and monitoring commands due to event in the event set , as follows:
| (1) |
A control command is dependent on , denoted as ) if device was the last device to be read before device was written to, called Read-before-Write Adjacency and denoted with a comma as in (), and given as:
| (2) |
is a timestamp. This control dependency indicates that any alteration of device considers the state of before it is done.
Control-time is the time interval between two dependent commands. Bridge computes as;
| (3) |
where means absolute value.
A burst is a continuous execution of commands for the same device, without interruption.
Control-Burst is the difference in burst size between two adjacent bursts.
Bridge computes for a current burst and previous burst of , such that ts() < ts(), as follows:
| (4) |
Control Frequency is the number of specific control commands of in , computed as:
| (5) |
3.3. Calibration-Agnostic Measurements
We explain how Bridge aggregates the statistical behavior of control time, control-burst, and control-frequency using a relative dependency () modeling to derive process constraints for attack detection regardless of the setpoint calibration of the process task.
3.3.1. Formulation of Relative Dependency
To formulate , Bridge applies a statistical measure of dispersion called the coefficient of variation () [Brown, 1998, Canchola et al., 2017]. measures the ratio of standard deviation to the mean to compare
degrees of variation from one data series to another, even if their means are drastically different. Bridge leverages this property to model dependencies among dependent devices involved in physical task, whereby the inter-ratio of work between devices is the same regardless of the calibrated amount of work [Ljung, 1998, Åström and Eykhoff, 1971, Urbina et al., 2016]. enables Bridge to be setpoint-agnostic in detecting attacks. That is, Bridge does not analyze statistical values in absolute terms, (e.g., "time-interval of scan cycles is too short"). Rather, it analyzes the inter-dependent variations, or what ensures devices are always working in harmony regardless of the amount of setpoint which can increase/decrease the task duration. Further, devices can have more than one dependency relationship. To adjust for these loose dependency instances, Bridge measures 2 properties; the degree of dependency or , and degree of dominance or to adjust calculated statistical dependency value bounds. Specifically,
of a control command dependence measures how dependent a control command is to , based on the ratio of their occurrence to other ’s control dependencies. of a control burst size of commands measures how common or rare (i.e., a ratio) a specific control burst size is to other burst sizes.
In deriving control-time dependency, let := {} be the sequence of process-control commands induced by event in event set . is the degree of dependency. is all instances of time-intervals between subsequent commands for of in . and are the standard deviation and mean of . Bridge derives as:
| (6) |
In deriving control-burst dependency, let be the of in . Bridge derives as follows:
| (7) |
In deriving control-frequency dependency, let || be the no. of all instances of command in . It derives as:
| (8) |
3.4. Anomalous Process-Constraints Violation
For each event in ,
the model outputs three maps (i) event-to-control time (ii) events-to-control burst, and (iii) event-to-control frequency scores. Event-to-control time map is ,
where is the legitimate time-interval semantic dependency in terms of control time of dependent control command pair ().
Event-to-control burst map is ,
where is the legitimate frequency semantic dependency in terms of control burst of the control command .
Events-to-control frequency ratios map is given as
, where is the frequency semantic dependency in terms of control frequency ratio of .
\IfEndWithMalicious Control Execution.Malicious Control ExecutionMalicious Control Execution.
On observing , Bridge compute the observed control time metric :
| (9) |
. indicates timestamp. is anomalous if deviates the legitimate control time behavior mapped to by . Bridge will compute the observed control burst metric as follows:
| (10) |
is anomalous if deviates from legitimate control burst behavior mapped to by . Bridge computes the observed frequency ratio as:
| (11) |
is anomalous if the frequency ratio deviates the legitimate control-frequency behavior .
3.5. Domain Knowledge PINNs For Robust Learning of Industrial Process Behaviors
PINNs lie at the intersection of neural networks and physical modeling. Network networks loss functions to make robust predictions by learning to find optimal parameters to minimize the value of the loss function [Cai et al., 2021]. PINNs use partial derivative equations (PDE) to help the model learn from the intrinsic physical properties of the data at hand. This makes PINNs robust even in partial or noisy data due to the physics-based loss function which provides strong regularization terms that help prevent overfitting [Cai et al., 2021, Cuomo et al., 2022]. Bridge develops a physics-informed learning architecture tailored to learn and correlate behaviors in industrial processes and Scada. First, it designs a PINN to capture the inertial dynamism of industrial processes via a domain knowledge-based PDE loss function. This limits the space of admissible solutions and facilitates the learning algorithm to converge better and generalize well. Bridge then implements the PINN/PDE in a Transformer-based AE to instantiate multiple Attention processes for each process input sequence within an ITB. This enables the PINN to capture the periodicity of process and to timely correlate with the Scada side.
3.5.1. Embedding Inertial Properties of Processes
An AE is a neural network which consists of an encoder that compress an input sequence of symbols into an encoding , and a decoder , which reconstructs from a given to an output sequence of . When trained with the objective , an AE learns to summarize the distribution of where . AEs can detect anomalous sequences when trained on a benign distribution because will fail to reconstruct the features of x [Downing et al., 2021, Mirsky et al., 2018]. To detect an anomaly, given an input reconstruction , we calculate the mean-square error (MSE) and check if the output is above a threshold, as follows:
| (12) |
Bridge make use of a variational AE, which comprises a generative and latent loss. The generative loss penalizes the model for having differences between the input to the model and the output from the model. We set our generative loss as the MSE loss (or L2-loss). The latent loss compares the learned distribution of input data in the latent layer to that of a Gaussian/Normal distribution. We used the Kullback-Leibler (KL) divergence loss as our latent loss. Then, to embed the inertial properties of processes into our model, we develop and introduce a third term in our loss function based on knowledge of actuating systems under inertia [Dissanayake et al., 2001, Ma et al., 2008, Kan et al., 2020] as follows:
| (13) |
where is a vector of the process’ numerical features (e.g., the level of the tank), is a vector of the rate of change (with respect to time) of these features, and is a scaler of their inertia delay. The sin and cosines trigonometric functions capture their angular phase shifts. The goal of the PDE is to minimize the angular displacement (i.e., bring it to 0) in processes with inertia. To explain, without inertia, the second-order derivative of the angular positions of (or acceleration) should be equal to the first-order derivative of . That is, is the displacement. In order to incorporate the equation into our neural network, we extracted the first term of the equation from the reconstruction of the input data given by the model and the second term directly from the input data. Following this, we set our PINN loss function to be the mean squared difference between the first and second terms. This way, the network can learn parameters that minimize the difference between the two terms.
3.5.2. Attention Mechanism for Process Periodicity
Bridge uses the attention mechanism [Luong et al., 2015, Vaswani et al., 2017] to prioritize important causal relationships in actuators and sensor values in the ITB-sized input time series. In AEs, each step in reconstructing the input is auto-regressive, i.e., previously generated symbols are used as input when generating the next. To mitigate this sequential bottleneck, Bridge uses the Transformer multi-head attention architecture [Vaswani et al., 2017] to encode and decode each input in parallel. Each encode-decode pass finds a unique attention filter for the same input sequence. Bridge uses an attention function to compute a rank for each input in the sequence by applying the softmax function [Vaswani et al., 2017]. For each process, Bridge computes the rank on a set of simultaneous queries in the matrix of actuator/sensor vectors, Q, comprised of K and V matrices of their keys and values, as follows:
| (14) |
We provide more implementation details in Section 7
4. Evaluation
We evaluate Bridge’s ability to (i) detect and correlate Scada and process attacks, and (ii) outperform existing works in detection.
4.0.1. Implementation and Dataset
We used public real-world Scada and process data from 11 diverse industrial scenarios in water treatment, manufacturing, and shipping plants.333https://github.com/lordmoses/SCAPHY Unlike other datasets like SWAT [swa, 2022] (which only has process data), this data has execution traces of real Scada hosts during the process operations. We trained Bridge’s PINN on a NVIDIA GeForce RTX 2080 Ti GPU (300 lines of Python code), which outputs a model of an avg. size of 3-4 MB per process in training time of 1-4 mins per epoch. Each of the process data in the dataset comprises about 4-7 days of continuous process runs. Bridge’s Scada side comprises of 240 lines of python code. Both the Scada side and process detection ( lines of python code) runs in an Intel(R) Xeon(R) CPU E5-1620 v2 @ 3.70GHz (4 cores). Our implementation is provided online444https://anonymous.4open.science/r/bridge/.
| Industrial | Diverse | OPC Events | Scada Process-Control Dependency Analysis | Process Constraints | Process Behavior | |||||||||||
| Processes | Domains | (Per Process) | Process Task and Relevant Actuators | Proc Graph | (Statistical Averages) | (PINN Training using PDE) | ||||||||||
|
Scenario FileSize |
States/ Verify |
Description |
Task ID |
Key Actuator |
CMDs |
Nodes/ |
Analysis Time (mins) |
Inertia/ Seq Size |
Seq Size |
Precision /Recall |
F1 |
|||||
| 11.5K | 10/0 | level control | 2.1 | holding tank | 24 | 4/6 | 0.47 | 0.125 | 0.105 | 7.6 | 4.5/5 | 5 | 85/70 | 77 | ||
| Chemical Dosing | Water Treatm | 11.5K | 14/2 | dosing | 2.2 | dose valve | 22 | 5/9 | 0.419 | 0.111 | 0.344 | 7.5 | 4.5 | 5 | 94/87 | 90 |
| 29K | 20/0 | pallet alignment | 3.2 | Axes X,Z | 26 | 6 /4 | 0.41 | 0.133 | 0.088 | 12.4 | 5.1 | 5 | 95/93 | 94 | ||
| Auto warehouse | Manufacture | 29K | 36/1 | throughput | 3.2 | entry conveyor | 32 | 7/5 | 0.42 | 0.167 | 0.034 | 12.9 | 5.1 | 6 | 77/83 | 80 |
| 9.5K | 28/0 | product haul | 4.1 | clamp lid/base | 22 | 5/9 | 0.24 | 0.71 | 0.048 | 7.7 | 5.7 | 6 | 71/73 | 72 | ||
| Assembler | Manufacture | 9.5K | 11/1 | load balancing | 4.2 | conveyor2 | 17 | 4/3 | 0.686 | 0.14 | 0.05 | 9.3 | 5.1 | 6 | 88/93 | 90 |
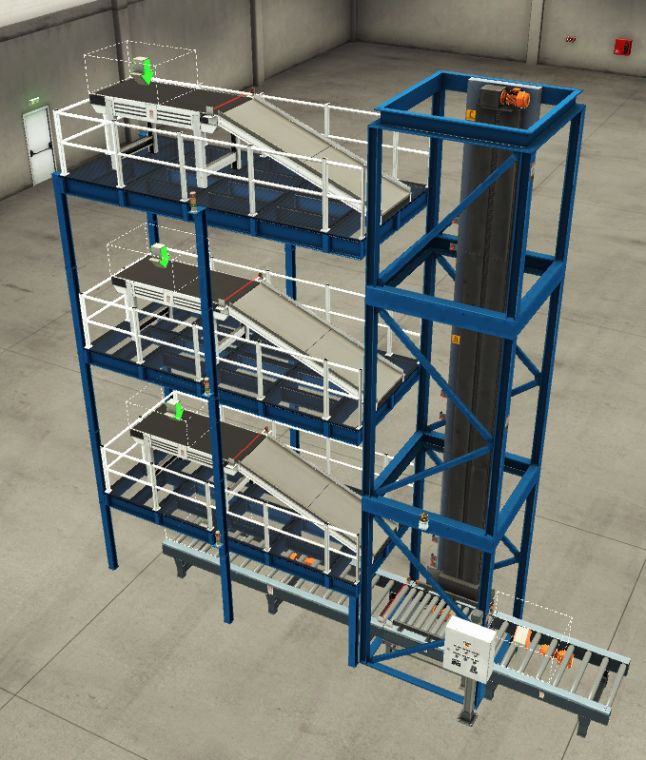
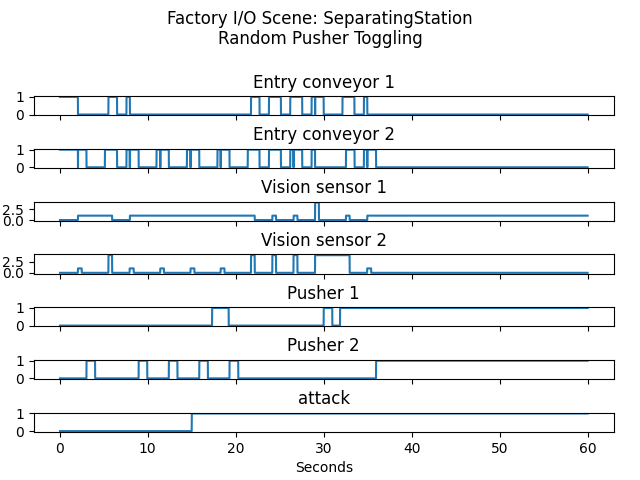
| 11K | 13/0 | prod safety | 11.1 | conveyor1-3 | 25 | 6/6 | 0.198 | 0.195 | 0.51 | 12.0 | 7.4 | 7 | 92/85 | 88 | ||
| Elevator | Manufacture | 11K | 12/0 | throughput | 11.2 | entry conveyor | 14 | 8/5 | 0.318 | 0.119 | 0.691 | 6.1 | 7.4 | 7 | 89/77 | 83 |
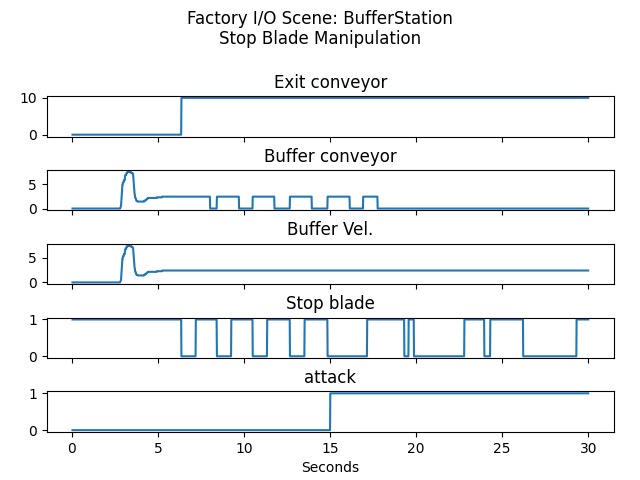
| 9K | 12/0 | spacing | 7.1 | buffer conveyor | 17 | 4/5 | 0.091 | 0.089 | 0.441 | 4.7 | 6.4 | 6 | 82/90 | 86 | ||
| Queue processor | Manufacture | 9K | 29/0 | throughput | 7.2 | entry conveyor | 32 | 8/4 | 0.358 | 0.678 | 0.224 | 12.1 | 6.4 | 6 | 88/95 | 91 |
| 6K | 18/0 | heat setpoint | 6.1 | room temp | 9 | 4/5 | 0.219 | 0.053 | 0.09 | 11.6 | 11.8 | 13 | 79/92 | 85 | ||
| HVAC | A/C | 6K | 17/1 | heat flow | 6.2 | vent | 23 | 5/5 | 0.178 | 0.410 | 0.065 | 10.2 | 11.8 | 13 | 88/83 | 85 |
| 7.8K | 21/1 | load alignment | 5.1 | push clamp | 33 | 9/4 | 0.289 | 0.845 | 0.717 | 14.6 | 4.1 | 4 | 80/88 | 84 | ||
| Palletizer | Shipping | 7.8K | 29/0 | prod protection | 5.2 | entry conveyor | 36 | 6/7 | 0.091 | 0.459 | 0.455 | 5.8 | 4.1 | 8 | 71/79 | 75 |
| 6.2K | 11/1 | path throughput | 7.1 | load/unload | 32 | 7/5 | 0.421 | 0.616 | 0.321 | 9.5 | 5.1 | 6 | 86/93 | 89 | ||
| Converge station | Shipping | 6.2K | 19/0 | alt throughput | 7.2 | transfer | 23 | 9/8 | 0.51 | 0.18 | 0.085 | 11.4 | 5.1 | 6 | 88/93 | 90 |
| 8.5K | 21/1 | alignment | 4.1 | control arm | 22 | 8/6 | 0.267 | 0.371 | 0.571 | 11.3 | 12.1 | 12 | 84/99 | 91 | ||
| Production line | Manufacture | 8.5K | 11/0 | throughput | 8.2 | conveyors | 25 | 5/5 | 0.211 | 0.098 | 0.0510 | 9.9 | 12.1 | 12 | 66/94 | 78 |
| 9K | 16/0 | sort accuracy | 9.1 | unloader | 22 | 8/7 | 0.4 | 0.335 | 0.118 | 15.1 | 5.5 | 6 | 92/93 | 92 | ||
| Sort station | Shipping | 9K | 16/0 | throughput | 9.2 | conveyor | 17 | 9/5 | 0.107 | 0.291 | 0.0821 | 10.6 | 5.5 | 6 | 97/70 | 89 |
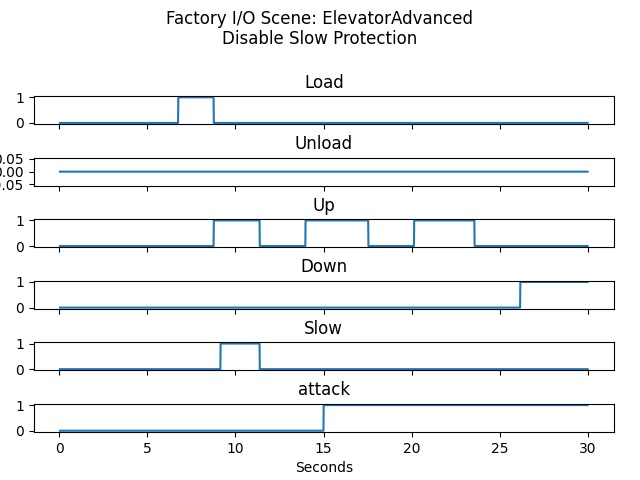
| 4.9K | 18/0 | accuracy | 10.1 | pusher1-2 | 26 | 11/8 | 0.132 | 0.439 | 0.264 | 12.0 | 7.6 | 8 | 89/73 | 81 | ||
| Separator | Shipping | 4.9K | 15/0 | throughput | 10.2 | conveyors | 27 | 8 /7 | 0.414 | 0.193 | 0.072 | 9.6 | 7.6 | 8 | 86/86 | 80 |
4.1. Modeling and Analysis Results
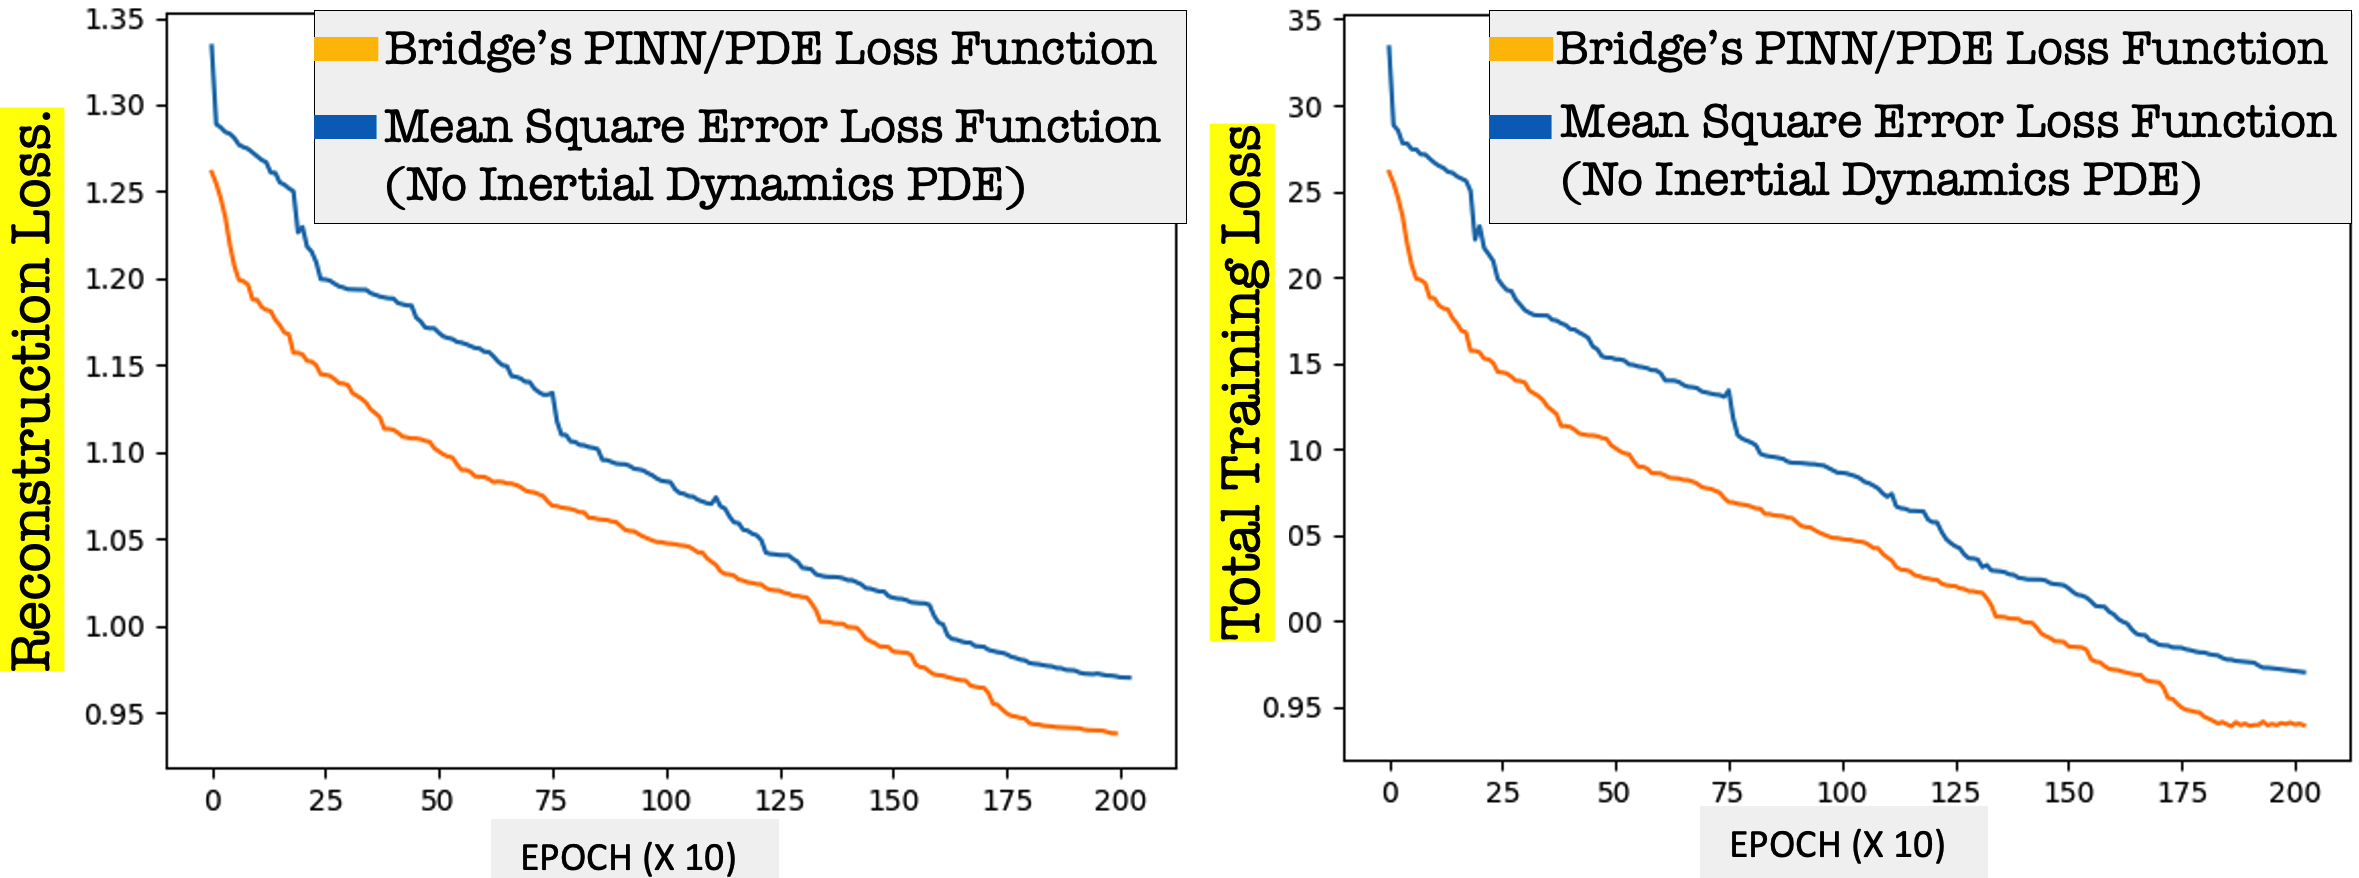
Table 2 presents results from Bridge’s analysis, at both the Scada and process aspects. We highlight important details. Columns 5, 6, and 7 show the key actuators for each process task. In column 4 totals for "States", we see that Bridge analyzed a total of 338 distinct process-control traces out of the 346 that were induced by the OPC event states (97.7% relevant behavior coverage). It missed 8 (column 4 totals for "Verify"). This is due to parsing errors when matching PLC/process device names to Scada OPC tags. We verified this via manual checking of the dataset. In the totals of columns 8 and 9 (i.e., CMD, Nodes/Edges), we see that the 338 traces generated 526 process constraints, 128 of which are from unique device pairs (i.e., total no. of Edges). This shows Bridge’s robust ability to derive process constraints from process-control executions. Columns 10, 11, and 12 are the statistical relative aggregates of the control-time, control-frequency, and control-burst constraint values. The Scada side analysis took 8̃ mins for each process, which is reasonable, based on the scenario sizes (column 3). The last 4 columns show the PINN training results. Bridge attained avg. of training precision and recall above the 85% mark. Further, the loss curves in Fig. 7 shows that Bridge’s PINN performs significantly better than MSE loss functions. The total training loss curve for different ITB runs shows that our model not only has lower training loss but also converges faster than a generic AE. This shows that Bridge’s PINN is robust. This is also the case in the reconstruction loss (left figure).
4.2. Adaptive Attacks and Detection Results
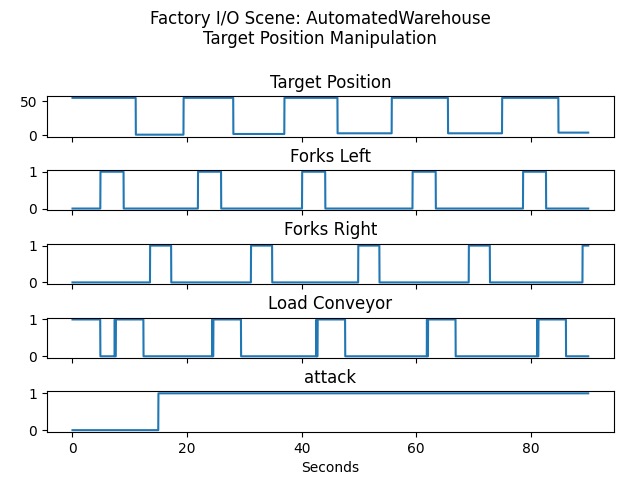
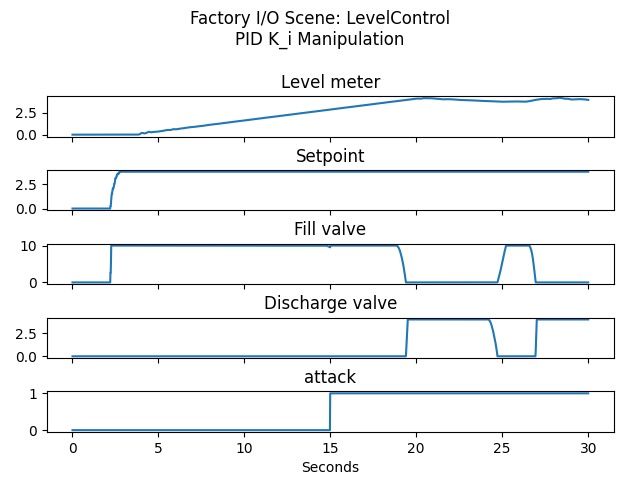
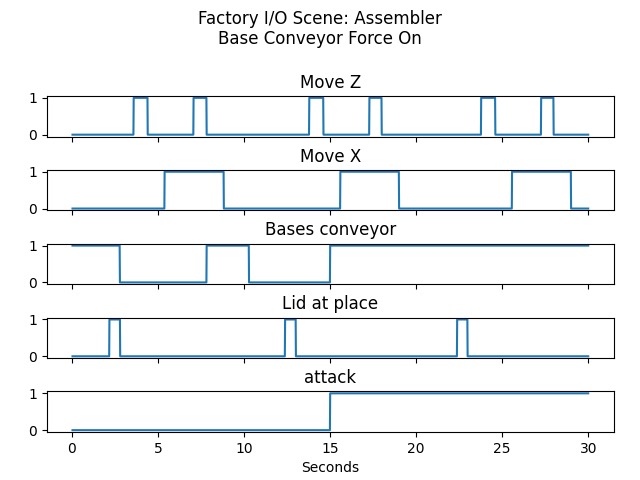
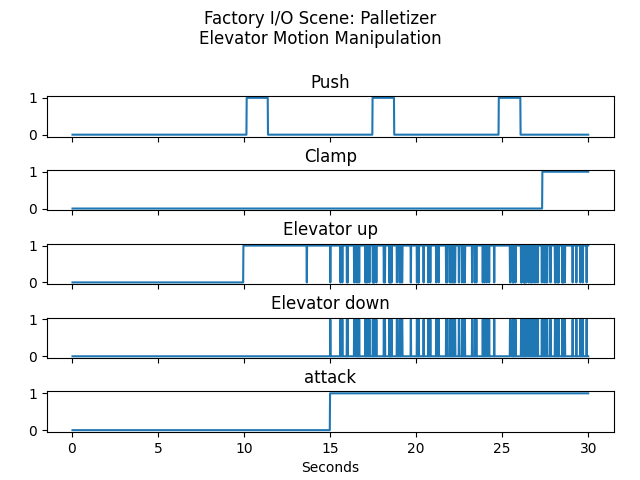
From the public attack dataset [Ike et al., 2022], we draw 50 attacks from five categories of past incidents as shown in Table 3, which also explains their attack TTP. Each category has 10 attack instances as follows: (I) Stuxnet-category (), (II) Industroyer-category (), (III) Oldsmar-category (), (IV) Triton-category (), (V) System crash-category (). Cat. I-IV attacks target specific actuators or parameters across all processes. They also used a stealthy approach [Kreimel et al., 2020, Urbina et al., 2016, Korkmaz et al., 2016, Moussa et al., 2016] to perturb processes. Specifically, for numeric parameters, they steadily increment the process value by a fraction of the current value at each step. For Boolean parameters, the attacks repeatedly toggled them at a slow pace. Cat V attacks (System crash-category) exploit device-specific targets [ics, 2022b].
| Attack | Total | Attacked Process (IDs in Table 2) | Process-Control | Process | ||||||||
| Category | Attacks | Attack | (2 attack injected per process ID) | Violations (Totals) | Anomalies | Correlated | Detect | |||||
| TTP ID | Description/ TTP Goal | C-TIME | C-BURST | C-FREQ | (Totals) | Attacks | TP | FP | Time (sec) | |||
| I. Stuxnet Cat. | 10 | T831 | CTRL Manipulation/Impact Control | 2.1, 10.2, 6.2, 9.1, 3.2 | 3 | 7 | 8 | 21 | 12 | 12 | 0 | 10.2 |
| II. Industroyer | 10 | T855 | Unauthorised CMD/Crash Process | 1.1, 8.2, 11.1, 7.1, 2.2 | 8 | 5 | 19 | 10 | 9 | 1 | 7.8 | |
| III. Oldsmar Cat. | 10 | T836 | Modify Parameter/Impact Contr | 4.1, 7.2, 10.1, 8.2, 11.2 | 17 | 11 | 35 | 24 | 24 | 0 | 5.4 | |
| IV. Triton Cat. | 10 | T801 | Corrupt State | 7.1, 6.2, 8.1, 5.1, 4.2 | 8 | 2 | 13 | 27 | 22 | 22 | 0 | 9.4 |
| T816 | Device shutdown/Inhibit Resp fxn | 7.1, 9.1, 2, 7.2 | 1 | 4 | 1 | 1 | 0 | 5.4 | ||||
| SPLOIT1.1 | stop Controller/Siemens Simatic-1200 | ICSA-11-186-01(Unprotected Port) | 1 | 1 | 1 | 1 | 1 | 1 | 0 | 7.4 | ||
| V. System- | SPLOIT1.2 | remote Code execution/QNX SDP 660 | CVE-2006-062(Buffer Overflow) | 1 | 1 | 1 | 1 | 1 | 0 | 9.2 | ||
| Crash Cat | 10 | SPLOIT1.3 | remote Device halt/Schneider Quantum | ICSA-13-077-01(I/O corruption) | 1 | 1 | 1 | 1 | 1 | 0 | 6.7 | |
| (High | SPLOIT1.4 | Crash RTOS service/QNX INETDd | CVE-2013-2687(Buffer Overflow) | 1 | 1 | 1 | 1 | 1 | 0 | 7.4 | ||
| Variance) | SPLOIT1.5 | RPC Device Crash/WindRiver VXWorks | CVE-2015-7599(Integer Overflow) | 1 | 1 | 1 | 1 | 1 | 0 | 12.6 | ||
| Attacks | SPLOIT1.6 | denial of service/Siemens S7-300/400 | CVE-2016-9158(Input Validation) | 1 | 1 | 1 | 1 | 1 | 1 | 0 | 7.2 | |
4.2.1. Attack Explanation and False Alarms
For Cat. I-IV, 10 attacks were injected in 5 processes, 2 each. For Cat. V, 4 of the 10 attacks are launched against processes. The remaining 6 use real-world exploit code from ICSSPLOIT [ics, 2022b]. For example, as shown, exploits of I/O corruption were used do shut down devices. However, because these are noisy attacks, they triggered high variance anomalies, especially the control-burst which is sensitive to chatty behaviors. In contrast, control-time behavior detected mostly semantic attacks (Cat I-IV). Overall, process anomalies were more rampant than Scada. However, since they are applied as a filter for Scada attack, it did not affect Bridge results. Although Bridge detected all 3 process-constraints violations in , , and in many combinations of targets, which also had FPs. However, in some cases, they were discarded since no process effects were seen. Via manual checking, we found that this FP was due to a Scada anomaly flagged around the same time a process error/noise exist on the system. To mitigate this rare phenomenon, Bridge can use the process evolution by discarding process anomalies that started before the flagged Scada anomaly. This is because they could not have been caused by Scada (i.e., the effect cannot happen before the cause) On average, Bridge’s time-to-detect is about 7-9 seconds (last column), which is practical for near-real time detection.
4.2.2. Discussions and Lesson Learned
We discuss how Bridge was impacted by the diverse physical processes used. We observe that processes with more actual devices than parameters (such as PID) are less prone to semantic attacks. Control parameters are typically set once during Scada operation, hence having fewer dependencies than actual devices. This is depicted in the no. of generated commands (column 9 of Table 2). As a real-world example, in the HVAC scenario (which uses soft parameters for A/C control), although 18 states were used to induce Scada, only 9 commands were executed, compared to a more physical system such as Queue Processor, which although generated fewer states, revealed more Scada commands and dependencies. However, processes with more actual devices are more prone to shutdown attacks () than the parameter-based ones. We found that soft parameters allow more automation than mechanical devices. These lessons can inform building secure processes (e.g., resilient to attack).
4.3. Case Study 1: Real-World Process Attack
We analyze the 2021 Oldsmar attack, which altered process parameters to dump excess chemicals into the water higher than the calibrated setpoint, while using normal Scada tools/system calls.
pp 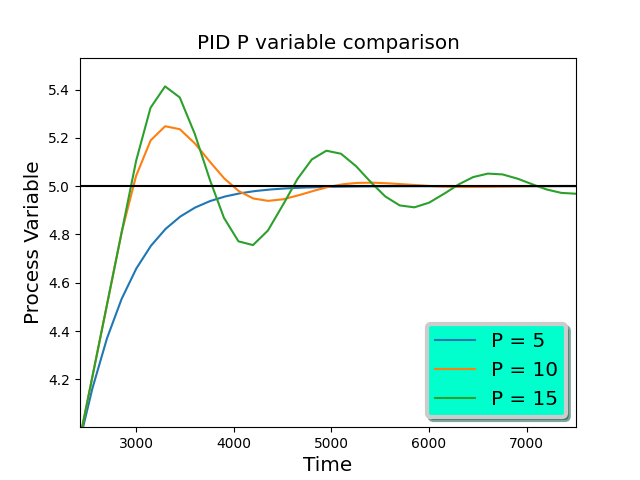
4.3.1. Chemical Dosing Operation and Injected Attack
Chemical dosing involves two processes: Level control (LV) and Dosing. Fig. 8 shows the HMI and main devices involved. LV regulates chemical in a holding tank, Tank.0, based on . When is reached, Dosing opens the Supply Valve, Valve.2 to let the chemical into the water supply. Level control is based on a physical domain Proportional Integral Derivative (PID) logic. Because cannot be reached in one shot, PID performs several "intake" and "discharge" cycles, (Fig. 8) whereby an Intake Pump Pump.0 and Intake Valve Valve.0 fills chemical into Tank.0, and a Discharge Valve Valve.1 remove excesses, until is achieved, shown in Fig. 8. A PID parameter , controls how aggressively the intake and discharge cycles are driven. E.g., a high pumps an initial excessive volume into Tank.0. Fig. 10(b) shows how different values affect how is reached. is set in the PLC hardware dial, so cannot be altered via Scada. To perform the attack, the attacker set to a high value, set Valve.0 to open, and then, opened Valve.2. Although this execution sequence is normal, the control time between opening the Intake Valve and Supply Valve is less than the operational time for LV to regulate the volume. This caused the initially filled excessive volume due to to be dumped into the water supply.
4.3.2. Evading Existing Techniques
The Scaphy work noted that it could not detect the Scada attack since benign system calls/HMI were used, which evades its signature approach [Ike et al., 2022]. On the process side, Scaphy flagged when the process went over the . However, we see that the attacker can stay just below the , but over time causes the same damages. Invariant misclassified the high value as an attack, which is a false alarm. Note that although the very high value seems anomalous, by itself, it is benign because with time, LV will regulate excessive volumes to safe levels. In addition, the attacker could incrementally perturb to be just below Invariant’s threshold, while still achieving the attack. In this case, since all other actuator sequences will be normal, Invariant will miss the attack.
| Max | Min | Average / Dispersion | Bridge Detection Resilience | |||||||
| Config | Config | Total | Detected | Missed | TP% | FN% | ||||
| Normal Calibration | 2.35 | 2.35 | 0. 0.092/- | 0.092/- | 0.25/- | 1 | 1 | 0 | 100 | 0 |
| Random Calibration Changes | 4.6 | 1.7 | 0.187/0.303 | 0.118/0.3744 | 0.25/0.443 | 53 | 51 | 2 | 96.2% | 3.8 |
| Uniform Calibration Changes | 10.0 | 1.0 | 0.293/0.427 | 0.156/0.418 | 0.25/0.593 | 53 | 48 | 5 | 90.6% | 9.4 |
| Reference | Attack/ | Semantics | Time | Detection Results | |||
| Work | Approach | Benign | Correlated | Correlated | TP | FP | FN |
| Scaphy | Scada + | 120/ | 0 (0%) | 71(75%) | 94 | 15 | 26 |
| [Ike et al., 2022] | Process | 268 | (disjointed) | (with maps) | 78.3% | 13.7% | 21.6% |
| Invariant | Process | 120/ | - | - | 89 | 17 | 31 |
| Rules [Feng et al., 2019] | Invariant | 268 | N/A | N/A | 74.2 | 16% | 25.8% |
| Scada + | 120/ | 119 (100%) | 119 (100%) | 118 | 1 | 2 | |
| Bridge | Process | 268 | (false=1) | (Avg. ITB=3) | 98.3% | 0.8% | 1.6% |
4.3.3. Bridge Analysis
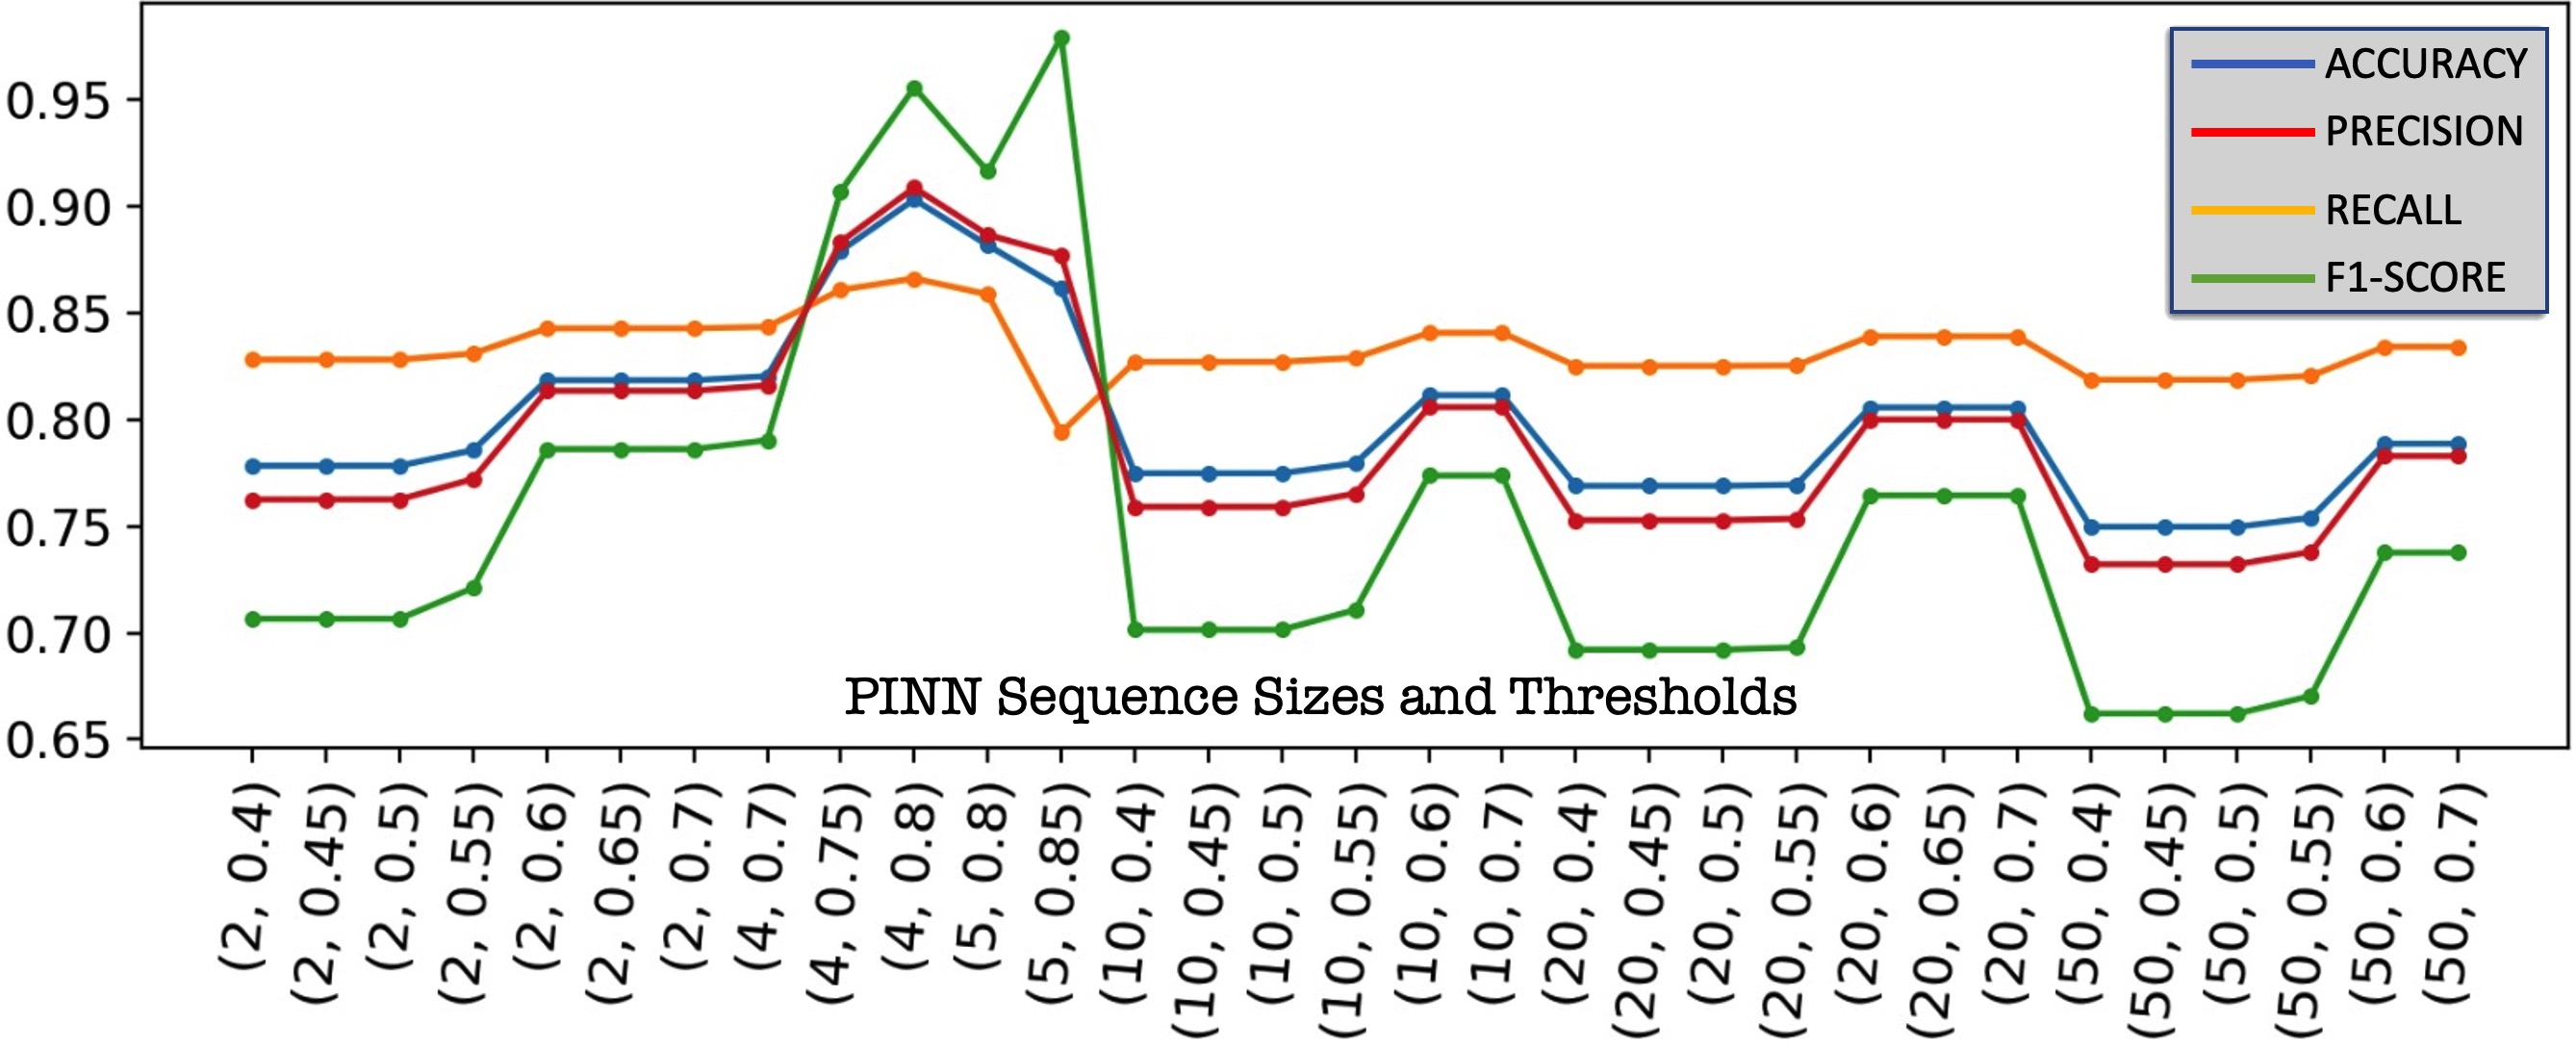
Bridge derives the chemical dosing inertia via the de-energizing time of Pump.0 and Valve.0, which took about 4.7 sec before the tank stops filling. Based on this, the ITB is 5. Fig. 9 shows the PINN performance of the with different sizes. As shown, several thresholds on sequence size 5 achieved the best results, which supports our hypothesis. The attack was injected around the 97-98th sec as shown in Fig. 11. It blends with normal operation by listening for the same events as Scada, which is Valve.0.Open.
4.3.4. Correlation and Detection
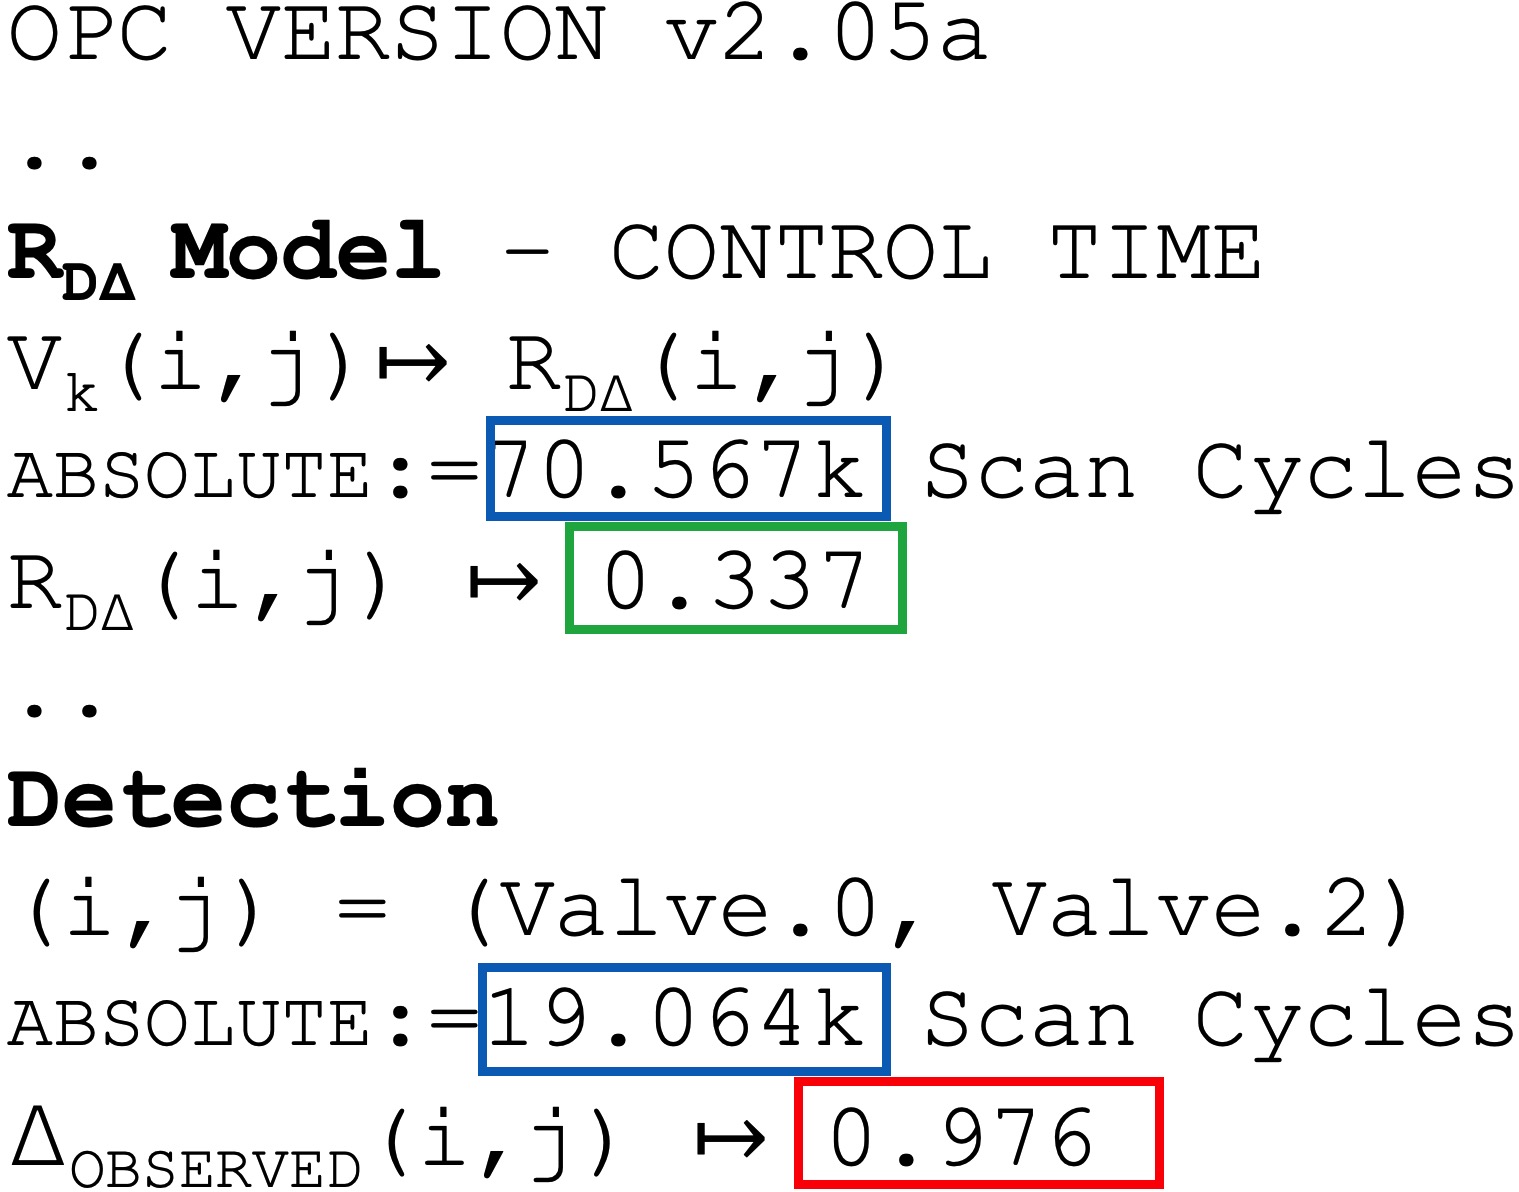
In Scada, Bridge detected an anomalous control-time dependency between Valve.0 and Valve.2. The output derivations are shown in Fig. 10(a). Bridge then waited for the inertia time of 4.7 sec before analyzing its process output. Steady-state was reached in one inertia time block (that is, only one inertia time block was added to the process evolution window). Bridge flagged an anomaly around the 101th sec. Since both anomalies exist on the correlated scada-physics time window, alarm is raised as an actual attack. Fig. 11 shows several isolated anomalies of the process (in blue). We captured a rare occasion around the 90th sec when false alarms arose in both Scada and Physics. However, Bridge filters it as a false alarm since the process anomaly permeated from the previous window (88th sec). As such, the process anomaly may not have not come from Scada (i.e., the effect cannot happen before the cause). The chemical dosing operation was induced by event Valve.0., via a read (tag.Valve.0) API call. Bridge detected calls that opened the Intake Valve as write (tag.Valve.0) (which begins the filling) and the Supply Valve opening as write (tag.Valve.2). That is, . Bridge then computes the observed time-interval for the dependent commands on as := , which deviates from the established , hence anomalous. Note that the absolute time-interval of 70k and 19k scan cycles shown in Fig. 10(a) is to illustrate time interval in absolute terms. However, Bridge computes relative dependency measure (i.e., = 0.337). Bridge’s alert to operators contains the affected devices (e.g., the Supply Valve and Intake Valve tags). This helps them better understand the attack and inform threat remediation at both Scada and physical.
4.4. Case Study 2: Real-World Mimicry Attack
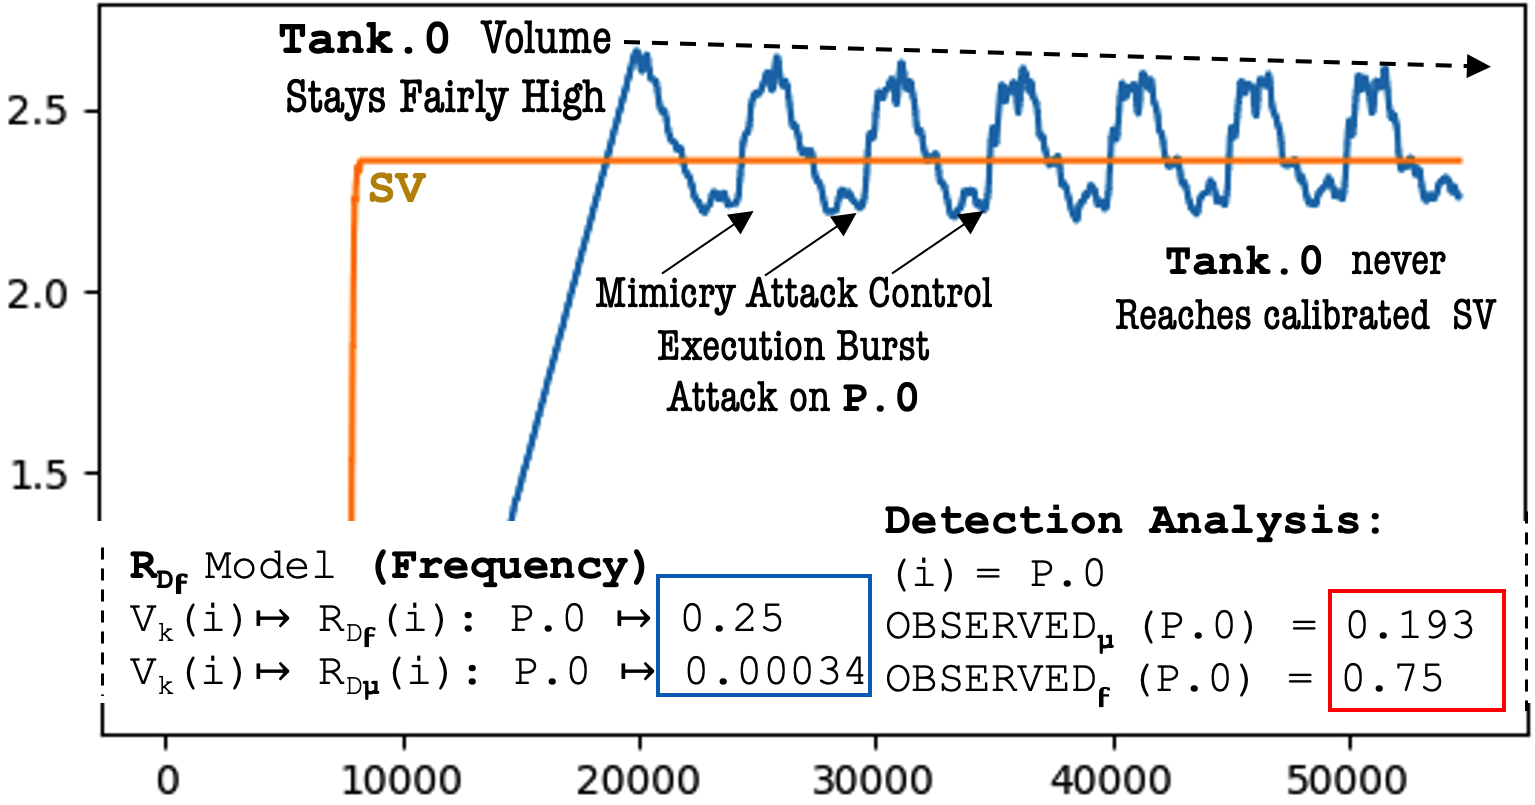
We used an advanced Oldsmar attack that mimics Bridge’s timing dependency behavior to evade Bridge and achieve its attack. This attack obeys the expected control-time between Valve.0 and Valve.2 by carefully incrementing parameter every few scan cycles, such that as the process gets close , process-control (based on ) still pumps excessive intake chemical. The attack uses the same semantic logic as process-control to monitor the difference between to to calculate how much to increment to keep high enough until Bridge’s control-time is satisfied. To explain this semantic attack, recall that PID process-control logic uses to compute how aggressively to fill the tank at every process (i.e., intake and discharge) cycle, which is about 9k scan cycles based on Fig. 8. Given that Level control takes 70k scan cycles to achieve , there’s room to manipulate to still poison the water. The attack commands kept high enough as shown in Fig. 12, and when Bridge’s expected is reached, it opened the dosing valve Valve.2 achieving the same attack goal. However, Bridge detected the attack based on control-burst and control-frequency behaviors, shown in Fig. 12. The attack incremented a total of 18 times out of 24 total commands leading to an anomalous control frequency ratio of 0.75 compared to 0.25. Further, the injection bursts of 2,3,2,3,2,3,3 led to a control burst behavior of 0.193 compared to =0.00004 (i.e., almost always have burst of 1). These Scada anomalies were validated by process in the same time window, but may evade isolated sensor analysis.
4.5. Case Study 3: Process Calibration Changes
We draw experiment data to evaluate Bridge resilience to changes. Recall that Bridge’s model is designed to work for different calibrated . In this experiment, we answer 2 questions (i) how much does Bridge’s disperse when derived from varying of the same CPS scenario, and (ii) how many attacks are missed due to new . We chose the chemical dosing scenario for this experiment because it provides many decimals, from which we generated 53 calibrations. Table 4 details our results. For (i), columns 4-6 show the average output of , , and , which are very close to their original derivation. To mathematically reason about their dispersion, we compute their standard deviation (SD). As shown, the low SDs indicate very low dispersion, showing that Bridge’s is very resilient to changes. For (ii) columns 5-8 show Bridge detection performance in new configs, with high 96.2% and 90.6% TP for randomly and uniformly generated changes. We found that slightly higher FN in uniformly generated changes is due to boundary limits rarely seen in the plant. We found that we can tune this behavior using Bridge’s degree of dependence and dominance ( and ), which are designed to tune dependencies that rarely occur.
4.6. Comparing Against Existing Work
We compare Bridge with current approaches as shown in Table 5, which are Invariant [Feng et al., 2019] and Scaphy [Ike et al., 2022]. Invariant mined invariant rules from predicates generated in sensor traces. These rules must be satisfied between the predicates and actuator states otherwise the states are deemed anomalous. Scaphy detects attacks in both Scada and processes. It learns system call signatures unique to Scada phases and created process signatures from observing disruptive physical impact. To compare Bridge against these works, we used the public dataset in [Ike et al., 2022]. Scaphy’s implementation is online. For Invariant, we used an open-source tool [inv, 2022] to first build a network graph of each process’ FBD/STL, and then generate rules from the time-series of sensor/actuator states that satisfy them.
4.6.1. Results
We draw experiments from the dataset whose behaviors are observable from both Scada and process traces, totaling 120 attacks and 268 benign instances. For the detection threshold, we used normalized average values based on the 75% percentile. Table 5 shows the results. Overall, Bridge achieved a 98.3% detection accuracy with 0.8% FP, compared to 78.3% detection and 13.7% FP of Scaphy, which had the second-best result. Bridge correlated all its detected attacks in both semantics and time (columns 4 and 5), with an average process evolution window of 3 ITBs for each process. Although Scaphy had 0% semantic correlation due to it’s inherent design flaw, when we provide it with our ITB evolution mappings, it correlated 75% of its detected attacks in time (column 5). Scaphy missed many attacks due to it’s use of known signatures. Further, its use of "outside setpoint" process anomaly signature caused false alarms. Invariant detected 89 attacks, i.e., 74.2% true positives (TP) with 17 FPs (16%). The high FP is due to flagged sensor deviations that are part of normal behaviors but misclassified by rules. For example, recall in Oldsmar, a high by itself is a benign behavior, but only malicious during the transition to the dosing task. In addition, rules constructed by invariants can be incomplete based on the training data [Aoudi et al., 2018]. Further, since Invariant is a process-only technique, it did not perform correlation with the Scada side, which impeded it’s detection results.
4.6.2. Sensor Invariant Rules vs. Process-Control Constraints
We drew a general experiment to compare Bridge’s process (dependency) constraints (i.e., how devices depend on each other to achieve a task) with invariant rules (i.e., properties that should hold in sensor readings). To draw up this experiment from the public data, we injected random perturbations in a normal process and Scada data of the water treatment scenario, similar to what was done in the [Feng et al., 2019] work. Results are shown in Table 6. For our evaluation metric, we derived a Noise-Ratio score by dividing the FP with the total dependency or rules generated. Overall, constraints from process-control had better results with low Noise-Ratio (15.1,9.6,12.5) compared to (41.4,30.6,41.3) of invariant rules. Intuitively, invariant rules may have hard predicates which semantic attacks can still satisfy while causing disruption [Aoudi et al., 2018]. For example,Invariant assumes that every update of actuator states is due to critical predicates. [Kiss et al., 2015, Aoudi et al., 2018] showed that such rules may be spurious or incomplete. In contrast, process-control behavior is task-driven, hence deviations from them have a high chance of violating intrinsic constraints.
4.7. Limitations and Discussions
4.7.1. Manual Effort Required
Due to the namespace difference between Scada OPC tags and process PLC/device names, we had to manually inspect the PLC FBD/STL files (i.e., shows how devices are connected) of each process to match process-side device names with the Scada side. However, in some scenarios, the namespace was similar (e.g., "VALVE.1" vs. "VAL-1"), which enabled us to use a semi-automated regular expression matching script. This manual activity took us under an hour to match device names in each process. However, it is only to be performed once per scenario.
4.7.2. Physical Changes
Since Bridge relies on physical dependencies, adding new devices will break its process constraints. Since Bridge is mostly automated, new dependencies can be re-learned.
4.7.3. Correlation Overhead
When Scada attacks are flagged, Bridge must wait for at least 1 ITB to check for the process effect. Although inertia helps to prevent instant damages, depending on the sensitivity, damages may occur before operators can respond. While this limitation applies to all process anomaly tools, we can explore early warning signs. Bridge detects attacks around 8s on avg., which is useful for near real-time detection (Section 4).
5. Related Work
Unlike in IT, industrial processes are governed by physics laws, whose normal behavior can be learned to detect attacks [Ljung, 1998, Hadziosmanovic et al., 2014, Ghaeini et al., 2018, Urbina et al., 2016, Aoudi et al., 2018]. In the wild, cyber-attacks originate from infected Scada hosts, which can inject stealthy process changes, but overtime leads to damages. Process anomaly techniques [Chromik et al., 2018, Hadziosmanovic et al., 2014, Ghaeini et al., 2018, Urbina et al., 2016, Aoudi et al., 2018, Lin et al., 2016, Nivethan and Papa, 2016, Chromik et al., 2016, Janicke et al., 2015] such as Invariant and Tabor [Feng et al., 2019, Lin et al., 2018] can detect process (sensor) changes but cannot identify the Scada cause, hence have false alerts due to noise/faults [Carcano et al., 2011]. Host anomaly tools such as Orpheus and Lee [Lee and Hong, 2020, Cheng et al., 2017] can detect abnormal system calls, but can’t know if it caused adverse process effects, which also causes false alarms. To counter false alarms, Scaphy [Ike et al., 2022] combined Scada and process anomaly data, but limited by both signature-based detection and false alarms because Scada execution does not map to process dynamics nor evolve at similar time-scales (i.e., semantic/time gap). Bridge uses domain knowledge in Scada process-control and process-tailored PINNs to bridge their unique semantic and time gap, which reduce false positives and improve attack understanding.
| Physical Actuator States Perturbed | |||||||||
| Fill Valve | Discharge Valve | Results | |||||||
| Approach | |
level (volts) |
Flow (cm/) |
level (volts) |
Flow (cm/) |
No. Of Trials |
DEPS/ |
FN | FP |
Noise |
| |@5 | 0.984 | @5 | -0.975 | 100 | 41 | 11 | 17 | 41.4% | |
| Invariants | |@1 | 0.1962 | @1 | -0.184 | 100 | 62 | 8 | 19 | 30.6% |
| Rules | |@10 | 1.968 | @10 | -2.025 | 100 | 29 | 12 | 12 | 41.3% |
| |@5 | 0.984 | @5 | -0.975 | 100 | 33 | 7 | 5 | 15.1% | |
| Process | |@1 | 0.1962 | @1 | -0.184 | 100 | 52 | 2 | 5 | 9.6% |
| Constraints | |@10 | 1.968 | @10 | -2.025 | 100 | 24 | 10 | 3 | 12.5% |
PLC Man-in-the-Middle (MITM) attacks such as Harvey [Garcia et al., 2017] can present false sensor data to Scada. [Salehi and Bayat-Sarmadi, 2021, Yang et al., 2020] proposed MITM mitigation such as using separate sensor channels channels and physics knowledge. [dio, 2022] uses non-PLC diode gateways to avoid MITM. VetPLC and TSV [Zhang et al., 2019, McLaughlin et al., 2014] can detect PLC logic alteration, but not suited for Scada attack which can alter PLC I/Os at runtime without touching its logic. Traffic analysis [Yun et al., 2013, Irvene et al., 2019, Ponomarev, 2015, Goldenberg and Wool, 2013, Halvorsen and Rrushi, 2017, Al-Madani et al., 2019, Maglaras and Jiang, 2014, Stewart et al., 2017, Fovino et al., 2010, Goldenberg and Wool, 2013, Carcano et al., 2011, Valdes and Cheung, 2009] are promising for abnormal traffic such as scans, but evaded by modern attacks which are semantic-based [Sun et al., 2021]. Reinforcement and Deep Learning [Kurt et al., 2018, Zhong et al., 2021, Panfili et al., 2018, Wilson et al., 2018] uses game theory to learn attack behaviors but requires known attacks and expert reward function, which may limit its diverse use in ICS. Bridge generalizes attacks by detecting anomalies that violates intrinsic dependencies in Scada and process operation.
6. Conclusion
Bridge is a domain knowledge-based correlation of Scada and industrial process behaviors that bridges their unique semantic and time evolution differences in detection ICS process attack. This reduces false alarms and improves attack understanding. Bridge achieved high accuracy and outperformed existing work.
References
- Ike et al. [2022] Moses Ike, Kandy Phan, Keaton Sadoski, Romuald Valme, and Wenke Lee. Scaphy: Detecting modern ics attacks by correlating behaviors in scada and physical. In 2023 IEEE Symposium on Security and Privacy (SP), pages 362–379. IEEE Computer Society, 2022.
- Case [2016] Defense Use Case. Analysis of the cyber attack on the ukrainian power grid. Electricity Information Sharing and Analysis Center (E-ISAC), 2016.
- stu [2022] W32.Stuxnet Dossier. https://www.wired.com/images_blogs/threatlevel/2011/02/Symantec-Stuxnet-Update-Feb-2011.pdf, 2022.
- Miller et al. [2021] Thomas Miller, Alexander Staves, Sam Maesschalck, Miriam Sturdee, and Benjamin Green. Looking back to look forward: Lessons learnt from cyber-attacks on industrial control systems. International Journal of Critical Infrastructure Protection, 35:100464, 2021.
- Fischer et al. [2018] Lars Fischer, Mathias Uslar, Doug Morrill, Michael Doring, and Edwin Haesen. Study on the evaluation of risks of cyber-incidents and on costs of preventing cyber-incidents in the energy sector. European Commission: Berlin, Germany, 2018.
- Hemsley et al. [2018] Kevin E Hemsley, E Fisher, et al. History of industrial control system cyber incidents. Technical report, Idaho National Lab.(INL), Idaho Falls, ID (United States), 2018.
- ris [2022] Risi online incident database, 2022. URL https://www.risidata.com/Database.
- ics [2022a] Operation technology cyber attack database, 2022a. URL https://icsstrive.com.
- flo [2022a] Oldsmar Water Treatment Facility Cyber Attack, 2022a. URL https://www.dragos.com/blog/industry-news/recommendations-following-the-oldsmar-water-treatment-facility-cyber-attack.
- flo [2022b] Dangerous Stuff: Hackers Tried to Poison Water Supply of Florida Town. https://www.nytimes.com/2021/02/08/us/oldsmar-florida-water-supply-hack.html, 2022b.
- Davies et al. [2022] Augustus W Davies, Joel B Dubow, George Collins, and John M Borky. Analyzing and mitigating water utility system vulnerabilities. Journal-American Water Works Association, 114(1):58–66, 2022.
- Ocampo [2021] Hector Rolando Ocampo. Municipal Governments and the Need for Cybersecurity. PhD thesis, 2021.
- Lin et al. [2018] Qin Lin, Sridha Adepu, Sicco Verwer, and Aditya Mathur. Tabor: A graphical model-based approach for anomaly detection in industrial control systems. In Proceedings of the 2018 on asia conference on computer and communications security, pages 525–536, 2018.
- Urbina et al. [2016] David I Urbina, Jairo A Giraldo, Alvaro A Cardenas, Nils Ole Tippenhauer, Junia Valente, Mustafa Faisal, Justin Ruths, Richard Candell, and Henrik Sandberg. Limiting the impact of stealthy attacks on industrial control systems. In Proceedings of the 2016 ACM SIGSAC conference on computer and communications security, pages 1092–1105, 2016.
- Ghaeini et al. [2018] Hamid Reza Ghaeini, Daniele Antonioli, Ferdinand Brasser, Ahmad-Reza Sadeghi, and Nils Ole Tippenhauer. State-aware anomaly detection for industrial control systems. In Proceedings of the 33rd Annual ACM Symposium on Applied Computing, pages 1620–1628, 2018.
- Feng et al. [2019] Cheng Feng, Venkata Reddy Palleti, Aditya Mathur, and Deeph Chana. A systematic framework to generate invariants for anomaly detection in industrial control systems. In NDSS, 2019.
- Kreimel et al. [2020] Philipp Kreimel, Oliver Eigner, Francesco Mercaldo, Antonella Santone, and Paul Tavolato. Anomaly detection in substation networks. Journal of Information Security and Applications, 54:102527, 2020.
- Korkmaz et al. [2016] Emrah Korkmaz, Andrey Dolgikh, Matthew Davis, and Victor Skormin. Ics security testbed with delay attack case study. In MILCOM 2016-2016 IEEE Military Communications Conference, pages 283–288. IEEE, 2016.
- Moussa et al. [2016] Bassam Moussa, Mourad Debbabi, and Chadi Assi. A detection and mitigation model for ptp delay attack in an iec 61850 substation. IEEE Transactions on Smart Grid, 9(5):3954–3965, 2016.
- Cheng et al. [2017] Long Cheng, Ke Tian, and Danfeng Yao. Orpheus: Enforcing cyber-physical execution semantics to defend against data-oriented attacks. In Proceedings of the 33rd Annual Computer Security Applications Conference, 2017.
- Lee and Hong [2020] Jae-Myeong Lee and Sugwon Hong. Keeping host sanity for security of the scada systems. IEEE Access, 8:62954–62968, 2020.
- Zhang et al. [2019] Mu Zhang, Chien-Ying Chen, Bin-Chou Kao, Yassine Qamsane, Yuru Shao, Yikai Lin, Elaine Shi, Sibin Mohan, Kira Barton, James Moyne, et al. Towards automated safety vetting of plc code in real-world plants. In 2019 IEEE Symposium on Security and Privacy (SP), pages 522–538. IEEE, 2019.
- ae [2022] Opc alarms and events overview, 2022. URL https://www.emerson.com/documents/automation/white-paper-opc-alarms-events-overview-deltav-en-56294.pdf.
- ae1 [2022] Alarm function blocks in iec 61131-3 programming, 2022. URL https://www.plcnext.help/te/Service_Components/Alarms/Alarm_Function_Blocks_IEC61131.htm.
- opc [2022] Opc foundation. opc unified architecture, 2022. URL https://opcfoundation.org.
- Son and Yi [2010] Mai Son and Myeong-Jae Yi. A study on opc specifications: Perspective and challenges. In International Forum on Strategic Technology 2010, pages 193–197. IEEE, 2010.
- Mahnke [2010] Wolfgang Mahnke. 2.4 opc unified architecture. Collaborative Process Automation Systems, page 86, 2010.
- Green et al. [2017] Benjamin Green, Marina Krotofil, and Ali Abbasi. On the significance of process comprehension for conducting targeted ics attacks. In Proceedings of the 2017 Workshop on Cyber-Physical Systems Security and PrivaCy, 2017.
- Rumelhart et al. [1985] David E Rumelhart, Geoffrey E Hinton, and Ronald J Williams. Learning internal representations by error propagation. Technical report, California Univ San Diego La Jolla Inst for Cognitive Science, 1985.
- Bank et al. [2020] Dor Bank, Noam Koenigstein, and Raja Giryes. Autoencoders. arXiv preprint arXiv:2003.05991, 2020.
- Ahmed and Zhou [2020] Chuadhry Mujeeb Ahmed and Jianying Zhou. Challenges and opportunities in cyberphysical systems security: a physics-based perspective. IEEE Security & Privacy, 18(6):14–22, 2020.
- Mirsky et al. [2018] Yisroel Mirsky, Tomer Doitshman, Yuval Elovici, and Asaf Shabtai. Kitsune: an ensemble of autoencoders for online network intrusion detection. arXiv preprint arXiv:1802.09089, 2018.
- Dissanayake et al. [2001] Gamini Dissanayake, Salah Sukkarieh, Eduardo Nebot, and Hugh Durrant-Whyte. The aiding of a low-cost strapdown inertial measurement unit using vehicle model constraints for land vehicle applications. IEEE transactions on robotics and automation, 17(5):731–747, 2001.
- Ma et al. [2008] Ou Ma, Hung Dang, and Khanh Pham. On-orbit identification of inertia properties of spacecraft using a robotic arm. Journal of guidance, control, and dynamics, 31(6):1761–1771, 2008.
- Kan et al. [2020] Congwen Kan, Chimay J Anumba, Yihai Fang, and John I Messner. Cps–based system for enhanced mobile crane safety. In Cyber-Physical Systems in the Built Environment, pages 193–213. Springer, 2020.
- Brown [1998] Charles E Brown. Coefficient of variation. In Applied multivariate statistics in geohydrology and related sciences, pages 155–157. Springer, 1998.
- Canchola et al. [2017] JA Canchola, Sh Tang, P Hemyari, E Paxinos, and E Marins. Correct use of percent coefficient of variation (% cv) formula for log-transformed data. MOJ Proteomics Bioinform, 6(4):316–7, 2017.
- Cai et al. [2021] Shengze Cai, Zhicheng Wang, Sifan Wang, Paris Perdikaris, and George Em Karniadakis. Physics-informed neural networks for heat transfer problems. Journal of Heat Transfer, 143(6), 2021.
- Cuomo et al. [2022] Salvatore Cuomo, Vincenzo Schiano Di Cola, Fabio Giampaolo, Gianluigi Rozza, Maziar Raissi, and Francesco Piccialli. Scientific machine learning through physics–informed neural networks: where we are and what’s next. Journal of Scientific Computing, 92(3):88, 2022.
- Luong et al. [2015] Minh-Thang Luong, Hieu Pham, and Christopher D Manning. Effective approaches to attention-based neural machine translation. arXiv preprint arXiv:1508.04025, 2015.
- Automation [2011] Rockwell Automation. Converged plantwide ethernet (cpwe) design and implementation guide., 2011.
- sie [2022] Plant-wide automation in the water industry, 2022. URL https://cache.industry.siemens.com/dl/files/869/109748869/att_928355/v7/109748869_Plant_Wide_Automation_Water_Industry_en.pdf.
- Carcano et al. [2011] Andrea Carcano, Alessio Coletta, Michele Guglielmi, Marcelo Masera, I Nai Fovino, and Alberto Trombetta. A multidimensional critical state analysis for detecting intrusions in scada systems. IEEE Transactions on Industrial Informatics, 7(2), 2011.
- Fovino et al. [2010] Igor Nai Fovino, Andrea Carcano, Thibault De Lacheze Murel, Alberto Trombetta, and Marcelo Masera. Modbus/dnp3 state-based intrusion detection system. In 2010 24th IEEE International Conference on Advanced Information Networking and Applications, pages 729–736. IEEE, 2010.
- Valdes and Cheung [2009] Alfonso Valdes and Steven Cheung. Communication pattern anomaly detection in process control systems. In 2009 IEEE Conference on Technologies for Homeland Security, pages 22–29. IEEE, 2009.
- Ahmadi-Assalemi et al. [2022] Gabriela Ahmadi-Assalemi, Haider Al-Khateeb, Gregory Epiphaniou, and Amar Aggoun. Super learner ensemble for anomaly detection and cyber-risk quantification in industrial control systems. IEEE Internet of Things Journal, 2022.
- Yang et al. [2019] Huan Yang, Liang Cheng, and Mooi Choo Chuah. Deep-learning-based network intrusion detection for scada systems. In 2019 IEEE Conference on Communications and Network Security (CNS), pages 1–7. IEEE, 2019.
- Darwish and Saadawi [2018] Ihab Darwish and Tarek Saadawi. Attack detection and mitigation techniques in industrial control system -smart grid dnp3. In 2018 1st International Conference on Data Intelligence and Security (ICDIS), pages 131–134, 2018. doi: 10.1109/ICDIS.2018.00028.
- Ponomarev [2015] Stanislav Ponomarev. Intrusion Detection System of industrial control networks using network telemetry. Louisiana Tech University, 2015.
- Bulle et al. [2020] Bruno B Bulle, Altair O Santin, Eduardo K Viegas, and Roger R dos Santos. A host-based intrusion detection model based on os diversity for scada. In IECON 2020 The 46th Annual Conference of the IEEE Industrial Electronics Society, pages 691–696. IEEE, 2020.
- Slowik [2019] Joseph Slowik. Evolution of ics attacks and the prospects for future disruptive events. Threat Intelligence Centre Dragos Inc, 2019.
- Ayodeji et al. [2020] Abiodun Ayodeji, Yong-kuo Liu, Nan Chao, and Li-qun Yang. A new perspective towards the development of robust data-driven intrusion detection for industrial control systems. Nuclear Engineering and Technology, 52(12):2687–2698, 2020.
- Shrestha et al. [2018] Roshan Shrestha, Hoda Mehrpouyan, and Dianxiang Xu. Model checking of security properties in industrial control systems (ics). In Proceedings of the Eighth ACM Conference on Data and Application Security and Privacy, 2018.
- Maw et al. [2019] Aung Maw, Sridhar Adepu, and Aditya Mathur. Ics-blockops: Blockchain for operational data security in industrial control system. Pervasive and Mobile Computing, 59:101048, 2019.
- Kurt et al. [2018] Mehmet Necip Kurt, Oyetunji Ogundijo, Chong Li, and Xiaodong Wang. Online cyber-attack detection in smart grid: A reinforcement learning approach. IEEE Transactions on Smart Grid, 10(5):5174–5185, 2018.
- Zhong et al. [2021] Kai Zhong, Zhibang Yang, Guoqing Xiao, Xingpei Li, Wangdong Yang, and Kenli Li. An efficient parallel reinforcement learning approach to cross-layer defense mechanism in industrial control systems. IEEE Transactions on Parallel and Distributed Systems, 2021.
- Panfili et al. [2018] Martina Panfili, Alessandro Giuseppi, Andrea Fiaschetti, Homoud B Al-Jibreen, Antonio Pietrabissa, and Franchisco Delli Priscoli. A game-theoretical approach to cyber-security of critical infrastructures based on multi-agent reinforcement learning. In 2018 26th Mediterranean Conference on Control and Automation (MED), pages 460–465. IEEE, 2018.
- Chromik et al. [2018] Justyna J Chromik, Anne Remke, and Boudewijn R Haverkort. Bro in scada: dynamic intrusion detection policies based on a system model. In 5th International Symposium for ICS & SCADA Cyber Security Research 2018 5, pages 112–121, 2018.
- Nivethan and Papa [2016] Jeyasingam Nivethan and Mauricio Papa. A scada intrusion detection framework that incorporates process semantics. In Proceedings of the 11th Annual Cyber and Information Security Research Conference, pages 1–5, 2016.
- Chromik et al. [2016] Justyna J Chromik, Anne Remke, and Boudewijn R Haverkort. What’s under the hood? improving scada security with process awareness. In 2016 Joint Workshop on Cyber-Physical Security and Resilience in Smart Grids (CPSR-SG), pages 1–6. IEEE, 2016.
- Lin et al. [2016] Hui Lin, Adam Slagell, Zbigniew T Kalbarczyk, Peter W Sauer, and Ravishankar K Iyer. Runtime semantic security analysis to detect and mitigate control-related attacks in power grids. IEEE Transactions on Smart Grid, 9(1):163–178, 2016.
- Hadziosmanovic et al. [2014] Dina Hadziosmanovic, Robin Sommer, Emmanuele Zambon, and Pieter Hartel. Through the eye of the plc: towards semantic security monitoring for industrial control systems. In Proc. ACSAC, volume 14, page 22. Citeseer, 2014.
- Aoudi et al. [2018] Wissam Aoudi, Mikel Iturbe, and Magnus Almgren. Truth will out: Departure-based process-level detection of stealthy attacks on control systems. In Proceedings of the 2018 ACM SIGSAC Conference on Computer and Communications Security, pages 817–831, 2018.
- Al Balushi et al. [2016] Abdullah Al Balushi, Kieran McLaughlin, and Sakir Sezer. Oscids: An ontology based scada intrusion detection framework. In SECRYPT, pages 327–335, 2016.
- Abbasi et al. [2017] Ali Abbasi, Thorsten Holz, Emmanuele Zambon, and Sandro Etalle. Ecfi: Asynchronous control flow integrity for programmable logic controllers. In Proceedings of the 33rd Annual Computer Security Applications Conference, pages 437–448, 2017.
- Niang et al. [2017] Mohamed Niang, Alexandre Philippot, François Gellot, Raphaël Coupat, Bernard Riera, and Sébastien Lefebvre. Formal verification for validation of pseel’s plc program. In ICINCO, 2017.
- Mulder et al. [2013] John Mulder, Moses Schwartz, Michael Berg, Jonathan Roger Van Houten, Jorge Mario, Michael Aaron King Urrea, Abraham Anthony Clements, and Joshua Jacob. Weaselboard: zero-day exploit detection for programmable logic controllers. Sandia report SAND2013-8274, Sandia national laboratories, 2013.
- Formby and Beyah [2019] David Formby and Raheem Beyah. Temporal execution behavior for host anomaly detection in programmable logic controllers. IEEE Transactions on Information Forensics and Security, 15:1455–1469, 2019.
- Yang et al. [2020] Zeyu Yang, Liang He, Peng Cheng, Jiming Chen, David KY Yau, and Linkang Du. Plc-sleuth: Detecting and localizing PLC intrusions using control invariants. In 23rd International Symposium on Research in Attacks, Intrusions and Defenses (RAID 2020), pages 333–348, 2020.
- Salehi and Bayat-Sarmadi [2021] Mohsen Salehi and Siavash Bayat-Sarmadi. Plcdefender: Improving remote attestation techniques for plcs using physical model. volume 8, pages 7372–7379, 2021.
- Ahmed et al. [2018] Chuadhry Mujeeb Ahmed, Martin Ochoa, Jianying Zhou, Aditya P Mathur, Rizwan Qadeer, Carlos Murguia, and Justin Ruths. Noiseprint: Attack detection using sensor and process noise fingerprint in cyber physical systems. In Proceedings of the 2018 on Asia Conference on Computer and Communications Security, pages 483–497, 2018.
- McLaughlin et al. [2014] Stephen E McLaughlin, Saman A Zonouz, Devin J Pohly, and Patrick D McDaniel. A trusted safety verifier for process controller code. In NDSS, volume 14, 2014.
- Addeen et al. [2021] Hajar Hameed Addeen, Yang Xiao, Jiacheng Li, and Mohsen Guizani. A survey of cyber-physical attacks and detection methods in smart water distribution systems. IEEE Access, 9:99905–99921, 2021.
- Alrawi et al. [2021] Omar Alrawi, Moses Ike, Matthew Pruett, Ranjita Pai Kasturi, Srimanta Barua, Taleb Hirani, Brennan Hill, and Brendan Saltaformaggio. Forecasting malware capabilities from cyber attack memory images. In 30th USENIX Security Symposium, 2021.
- Chipounov et al. [2011] Vitaly Chipounov, Volodymyr Kuznetsov, and George Candea. S2e: A platform for in-vivo multi-path analysis of software systems. Acm Sigplan Notices, 46(3):265–278, 2011.
- Janicke et al. [2015] Helge Janicke, Andrew Nicholson, Stuart Webber, and Antonio Cau. Runtime-monitoring for industrial control systems. Electronics, 4(4):995–1017, 2015.
- Wilson et al. [2018] David Wilson, Yufei Tang, Jun Yan, and Zhuo Lu. Deep learning-aided cyber-attack detection in power transmission systems. In 2018 IEEE Power & Energy Society General Meeting (PESGM), pages 1–5. IEEE, 2018.
- Yun et al. [2013] Jeong-Han Yun, Sung-Ho Jeon, Kyoung-Ho Kim, and Woo-Nyon Kim. Burst-based anomaly detection on the dnp3 protocol. International Journal of Control and Automation, 6(2):313–324, 2013.
- Halvorsen and Rrushi [2017] James Halvorsen and Julian L Rrushi. Target discovery differentials for 0-knowledge detection of ics malware. In 2017 IEEE 15th Intl Conf on Dependable, Autonomic and Secure Computing, pages 542–549. IEEE, 2017.
- Goldenberg and Wool [2013] Niv Goldenberg and Avishai Wool. Accurate modeling of modbus/tcp for intrusion detection in scada systems. international journal of critical infrastructure protection, 6(2):63–75, 2013.
- Singh et al. [2016] Chetna Singh, Ashwin Nivangune, and Mrinal Patwardhan. Function code based vulnerability analysis of dnp3. In 2016 IEEE International Conference on Advanced Networks and Telecommunications Systems, pages 1–6. IEEE, 2016.
- Al-Madani et al. [2019] Basem Al-Madani, Ahmad Shawahna, and Mohammad Qureshi. Anomaly detection for industrial control networks using machine learning with the help from the inter-arrival curves. arXiv preprint arXiv:1911.05692, 2019.
- Maglaras and Jiang [2014] Leandros A Maglaras and Jianmin Jiang. Intrusion detection in scada systems using machine learning techniques. In 2014 Science and Information Conference, pages 626–631. IEEE, 2014.
- Stewart et al. [2017] Barnaby Stewart, Luis Rosa, Leandros A Maglaras, Tiago J Cruz, Mohamed Amine Ferrag, Paulo Simoes, and Helge Janicke. A novel intrusion detection mechanism for scada systems which automatically adapts to network topology changes. EAI Endorsed Transactions on Industrial Networks and Intelligent Systems, 4(10), 2017.
- Irvene et al. [2019] Celine Irvene, Tohid Shekari, David Formby, and Raheem Beyah. If i knew then what i know now: On reevaluating dnp3 security using power substation traffic. In Proceedings of the Fifth Annual Industrial Control System Security (ICSS) Workshop, pages 48–59, 2019.
- Han et al. [2017] Yi Han, Sriharsha Etigowni, Hua Liu, Saman Zonouz, and Athina Petropulu. Watch me, but don’t touch me! contactless control flow monitoring via electromagnetic emanations. In Proceedings of the 2017 ACM SIGSAC conference on computer and communications security, pages 1095–1108, 2017.
- Liu et al. [2016] Yannan Liu, Lingxiao Wei, Zhe Zhou, Kehuan Zhang, Wenyuan Xu, and Qiang Xu. On code execution tracking via power side-channel. In Proceedings of the 2016 ACM SIGSAC conference on computer and communications security, pages 1019–1031, 2016.
- dio [2022] Prevent intrusion and maintain network integrity with Data Diodes. https://advenica.com/en/cds/data-diodes, 2022.
- Vaswani et al. [2017] Ashish Vaswani, Noam Shazeer, Niki Parmar, Jakob Uszkoreit, Llion Jones, Aidan N Gomez, Lukasz Kaiser, and Illia Polosukhin. Attention is all you need. Advances in neural information processing systems, 30, 2017.
- Ljung [1998] Lennart Ljung. System identification. In Signal analysis and prediction, pages 163–173. Springer, 1998.
- Åström and Eykhoff [1971] Karl Johan Åström and Peter Eykhoff. System identification—a survey. Automatica, 7(2):123–162, 1971.
- Downing et al. [2021] Evan Downing, Yisroel Mirsky, Kyuhong Park, and Wenke Lee. DeepReflect: Discovering malicious functionality through binary reconstruction. In 30th USENIX Security Symposium (USENIX Security 21), pages 3469–3486, 2021.
- swa [2022] Secure Water Treatment (SWaT). https://itrust.sutd.edu.sg/itrust-labs-home/itrust-labs_swat/, 2022.
- ics [2022b] ICSSPLOIT. https://github.com/dark-lbp/isf/tree/master/icssploit, 2022b.
- mit [2022] ATTACK for Industrial Control Systems, 2022. URL https://collaborate.mitre.org/attackics/index.php/Main_Page.
- met [2022] Metasploit Modules for SCADA-related Vulnerabilities. https://scadahacker.com/resources/msf-scada.html, 2022.
- inv [2022] Invariant-mutable-properties. https://github.com/AnyhowStep/ts-eslint-invariant-mutable-properties, 2022.
- Kiss et al. [2015] Istvan Kiss, Bela Genge, and Piroska Haller. A clustering-based approach to detect cyber attacks in process control systems. In 2015 IEEE 13th international conference on industrial informatics (INDIN), pages 142–148. IEEE, 2015.
- Garcia et al. [2017] Luis Garcia, Ferdinand Brasser, Mehmet Hazar Cintuglu, Ahmad-Reza Sadeghi, Osama A Mohammed, and Saman A Zonouz. Hey, my malware knows physics! attacking plcs with physical model aware rootkit. In NDSS, 2017.
- Sun et al. [2021] Ruimin Sun, Alejandro Mera, Long Lu, and David Choffnes. Sok: attacks on industrial control logic and formal verification-based defenses. In 2021 IEEE European Symposium on Security and Privacy (EuroS&P), pages 385–402. IEEE, 2021.
- Goh et al. [2016] Jonathan Goh, Sridhar Adepu, Khurum Nazir Junejo, and Aditya Mathur. A dataset to support research in the design of secure water treatment systems. In International conference on critical information infrastructures security, pages 88–99. Springer, 2016.
7. Appendix
7.1. More Details On Bridge’s Attention Design Implementation
An attention function can be described as mapping a query and a set of key-value pairs to an output, where the query, keys, values, and output are all vectors [Vaswani et al., 2017]. The output is computed as a weighted sum of the values, where the weight assigned to each value is computed by a compatibility function of the query with the corresponding key (shown in Fig. 13). Bridge uses the scaled dot-product attention developed in [Vaswani et al., 2017], whose input consist of queries and keys of dimension , and values of dimension . In Bridge, the query, key, and value matrices are simply copies of the input sequences, as shown in Fig. 13. Each is passed through different linear layers (layers with no activation), simply to map the input to the output and reduce dimensions and computational cost. The results of the query and key after being passed through the input layer are first multiplied (using dot product), scaled by dividing each by the square root of , and then passed through the softmax function. The output is called the attention filter. The attention filter is multiplied by the value matrix to obtain the weights on the values. The attention filter allows us to identify the important time series, i.e., actuator input and sensor outputs that have the most causal relationship. Bridge uses the attention function to compute a rank for each input in the sequence by applying the softmax function. In practice, Bridge compute the attention function on a set of queries simultaneously in the matrix Q. K and V are matrices of the keys and values.
| (15) |
is Bridge’s attention function that ranks actuator sensor vectors with the most Physics causal relationship.
Parallelizing Attention.Parallelizing AttentionParallelizing Attention. Bridge uses multiple attention heads (depicted in Fig. 13 to identify useful attention filters for the input sequence, as well as compute the in parallel. That is, instead of performing a single function with dimensional keys, values, and queries, they can be projected times (where h is the Inertia-informed sequence size) to different learned , and dimensions, respectively. The attention function, , can now be performed on each of these projected versions of queries, keys, and values, to yield output values in dimension. Bridge then concatenates the results of the multiplication with each attention filter and then applies the linear layer to reduce (shrink down) the dimensions, and output the final values as shown in Fig. 13.
Internally, Bridge implements the architecture of stacked self-attention and fully connected layers. The encoder and decoder process their input using a stack of identical layers equal to the ITB, each having two sub-layers, . The first is a multi-head self-attention mechanism and the second is a fully connected feed-forward network. Bridge uses a residual connection followed by normalization around each sub-layers. We detail our implementation approach in the appendix in Fig. 13. The output of each sublayer in Bridge is given below. Note that is the function implemented by the sub-layer.
| (16) |
By using attention to prioritize causally-related actuator/sensor vectors within the ITB time window, Bridge captures the periodic nature of a process in its learning algorithm.