Manuel Lardizabal Ibilbidea, 4, 20018 Donostia, Spainbbinstitutetext: Instituto de Física Teórica (IFT-CFTMAT), CSIC-UAM, Calle de Nicolás Cabrera 13–15, Campus de Cantoblanco, E-28049 Madrid, Spainccinstitutetext: 2IJCLab, Université Paris-Saclay, CNRS/IN2P3, 91405 Orsay, France
Search for Hidden Neutrinos at the European Spallation Source: the SHiNESS experiment
Abstract
The upcoming European Spallation Source (ESS) will soon provide the most intense neutrino source in the world. We propose the Search for Hidden Neutrinos at the ESS (SHiNESS) experiment, highlighting its unique opportunities to search for the existence of sterile neutrinos across a wide range of scales: anomalous oscillations at short baselines; non-unitarity mixing in the active neutrino sector; or an excess of events with multiple leptons in the final state, produced in the decay of heavy neutrinos. The baseline design of the detector comprises a tank filled with 42 ton of liquid scintillator, located 25 m far from the ESS beam target. We show that SHiNESS will be able to considerably improve current global limits for the three cases outlined above. Although in this work we focus on new physics in the neutrino sector, the proposed setup may also be used to search for signals from weakly interacting particles in a broader context.
1 Introduction
A plethora of neutrino experiments carried out in the last few decades have confirmed existence of neutrino oscillations, which implies nonzero neutrino masses Super-Kamiokande:1998kpq ; SNO:2002tuh ; KamLAND:2004mhv . Neutrino mixing can be described by a unitary matrix that parametrizes the change of basis between the flavor states and mass eigenstates. After the measurement of the last mixing angle DayaBay:2012fng , our knowledge of the parameters that govern neutrino mixing in three families is almost complete, with the notable exception of the CP-violating phase and the neutrino mass ordering, which are still unknown. In the meantime, the neutrino research program has entered a precision era Esteban:2020cvm ; T2K:2021xwb ; NOvA:2021nfi in the realm of neutrino oscillations, which will be further improved with the upcoming experiments DUNE DUNE:2015lol , JUNO JUNO:2020bcl and Hyper-Kamiokande Abe:2011ts .
However, our understanding of the neutrino sector is still limited. Although the observation of neutrino oscillations implies that at least two neutrinos are massive, the values of their masses remain unknown. Moreover, the Standard Model (SM) of particle physics does not provide a mechanism to give neutrinos a mass, which necessarily requires to enlarge the SM particle content. Even in the simplest scenario where right-handed neutrinos are added to the SM in order to generate neutrino masses, new questions arise regarding the specific mechanism at play, the Majorana/Dirac nature of neutrinos, and the scale of new physics associated to the new particles introduced. In fact, neutrinos offer a window to explore multiple effects stemming from new physics beyond the SM (BSM) across a wide range of scales.
The existence of additional neutrino mass eigenstates would have different phenomenological consequences, depending on the scale associated to the new particles. In fact, leaving theoretical arguments aside, the existence of new neutrino mass eigenstates (and the scale of new physics associated to their mass) can only be probed experimentally. While precision measurements at collider experiments have confirmed that the number of light neutrinos that participate in the weak interactions is three ALEPH:2005ab , a number of neutrino experiments have produced results not in full agreement with this landscape. These somehow controversial short-baseline anomalies include a significant excess of electron (anti)neutrinos in a mainly muon (anti)neutrino beam, as observed by the LSND LSND:2001aii and MiniBooNE MiniBooNE:2020pnu experiments (the LSND/MiniBooNE anomalies, each of them with a significance above ); and an evidence of electron neutrino disappearance observed by several experiments employing a gallium detector exposed to a radioactive source Abdurashitov:2005tb ; GALLEX:1994rym ; Barinov:2021asz (the gallium anomaly Laveder:2007zz ; Acero:2007su ; Giunti:2010zu , with a significance above Barinov:2022wfh ; Barinov:2021mjj ; Berryman:2021yan ; Elliott:2023cvh ; Brdar:2023cms ). The most naive explanation for these anomalies is the existence of a new neutrino with a mass squared splitting of around 1 eV2, called light sterile neutrinos. However, the experimental landscape is not fully consistent Boser:2019rta , given the absence of an excess in the KARMEN KARMEN:2002zcm and MicroBooNE MicroBooNE:2021tya experiments, the significant tension between appearance and disappearance measurements MiniBooNE:2012meu ; IceCube:2016rnb ; Dentler:2018sju ; Diaz:2019fwt , and that the so-called reactor antineutrino anomaly has recently vanished in light of new reactor flux reevaluations Berryman:2019hme ; Estienne:2019ujo ; Giunti:2021kab . Thus, the community still awaits new experimental data that could shed some light on the origin of the reported anomalies.
Sterile neutrinos at higher scales may not lead to a new oscillation frequency but could yield interesting phenomenological signals elsewhere. To begin with, additional neutrinos could induce an apparent violation of the unitarity of the neutrino mixing matrix in the active block (which governs oscillations among active neutrinos), potentially even involving additional sources of CP violation Langacker:1988up ; Bilenky:1992wv ; Bergmann:1998rg ; Czakon:2001em ; Bekman:2002zk ; Antusch:2006vwa ; Fernandez-Martinez:2007iaa ; Escrihuela:2016ube . While non-unitarity constraints from heavy neutrinos (above the EW scale) are severely constrained from global fits to electroweak precision data Blennow:2023mqx ; Antusch:2016brq , neutrinos at lower scales could still lead to observable effects Blennow:2016jkn . For neutrino masses below the pion mass, the effect would be that of an averaged-out oscillation, leading to an overall constant effect on the transition probabilities. On the other hand, a sterile neutrino with a mass in the MeV-GeV range, usually called heavy neutral lepton (HNL), may be produced in meson decays through its mixing with the active neutrinos (for recent reviews on HNL phenomenology, see e.g. refs. Abdullahi:2022jlv ; Antel:2023hkf ). After propagating over some distance, it could decay back into SM particles, leaving a visible signal in neutrino detectors. Typical decay signals for a HNL below the GeV scale that only interacts via mixing involve a combination of light mesons, electrons/muons and neutrinos (which lead to missing energy).
In view of the general features outlined above, an intense, pulsed, source of well-characterized neutrinos would be the ideal tool to probe for any of the new physics signals outlined above. Spallation sources are excellent in this regard: in the proton collisions in the target, an intense flux of pions is produced that in turn yields a high-intensity neutrino flux from their decay at rest (DAR). The upcoming European Spallation Source (ESS) currently under construction in Lund, Sweden, will provide the most intense neutron beam in the world Garoby:2017vew and therefore offers an exceptional opportunity to search for new physics in the neutrino sector. To this end, we propose the Search for Hidden Neutrinos at the European Spallation Source (SHiNESS) experiment, which will be able to: (1) probe the unitarity of the active neutrino mixing matrix with unprecedented sensitivity; (2) set world-leading limits on heavy neutral leptons, and (3) definitely clarify whether the origin of the short-baseline neutrino anomalies are due to an eV-scale sterile neutrino. We note that, while studies exist to use the future ESS Neutrino Super Beam Alekou:2022emd (ESSSB) for light sterile neutrino searches Blennow:2014fqa ; KumarAgarwalla:2019blx ; Ghosh:2019zvl , SHiNESS does not require any upgrade to the beamline and can start acquiring data as soon as the ESS turns on. Moreover, we highlight its complementarity to the current neutrino physics program of the ESS Baxter:2019mcx , which focuses on coherent elastic neutrino-nucleus scattering (CENS) detection to pursue new physics signals: both experiments may take place simultaneously without interfering with any of the main physics goals of the ESS (or with each other).
This document is organized as follows. Section 2 describes in detail the experimental setup at the ESS and the detector technology, while section 3 discusses the phenomenological signals expected for the three cases under consideration in this work: zero-distance effects induced by a non-unitarity leptonic mixing matrix, oscillations at short baselines induced by light sterile neutrinos, and decay signals from heavy neutral leptons. Section 4 discusses the expected number of events for each case, while section 5 describes the main backgrounds expected. Section 6 contains the calculated sensitivity of the experiment to the different scenarios considered. A summary of the proposal and a comparison with the current experimental landscape are provided in section 7.
2 The experimental setup
2.1 The beam
The European Spallation Source is an upcoming facility which will combine a 2 GeV proton linac with an advanced hydrogen moderator, generating the most intense neutron beam in the world GUTHRIE2017637 . The proton beam impinges on a rotating tungsten target, producing fast, high-energy neutrons that are slowed down by the moderator. The 5 MW design power will deliver a total of protons-on-target per calendar year, assuming 5000 hours of beam delivery. The proton beam pulse has a rate of 14 Hz with 2.8 ms long spills, giving a duty factor of . A comparison of the ESS beam pulse with other spallation sources is shown in figure 1.
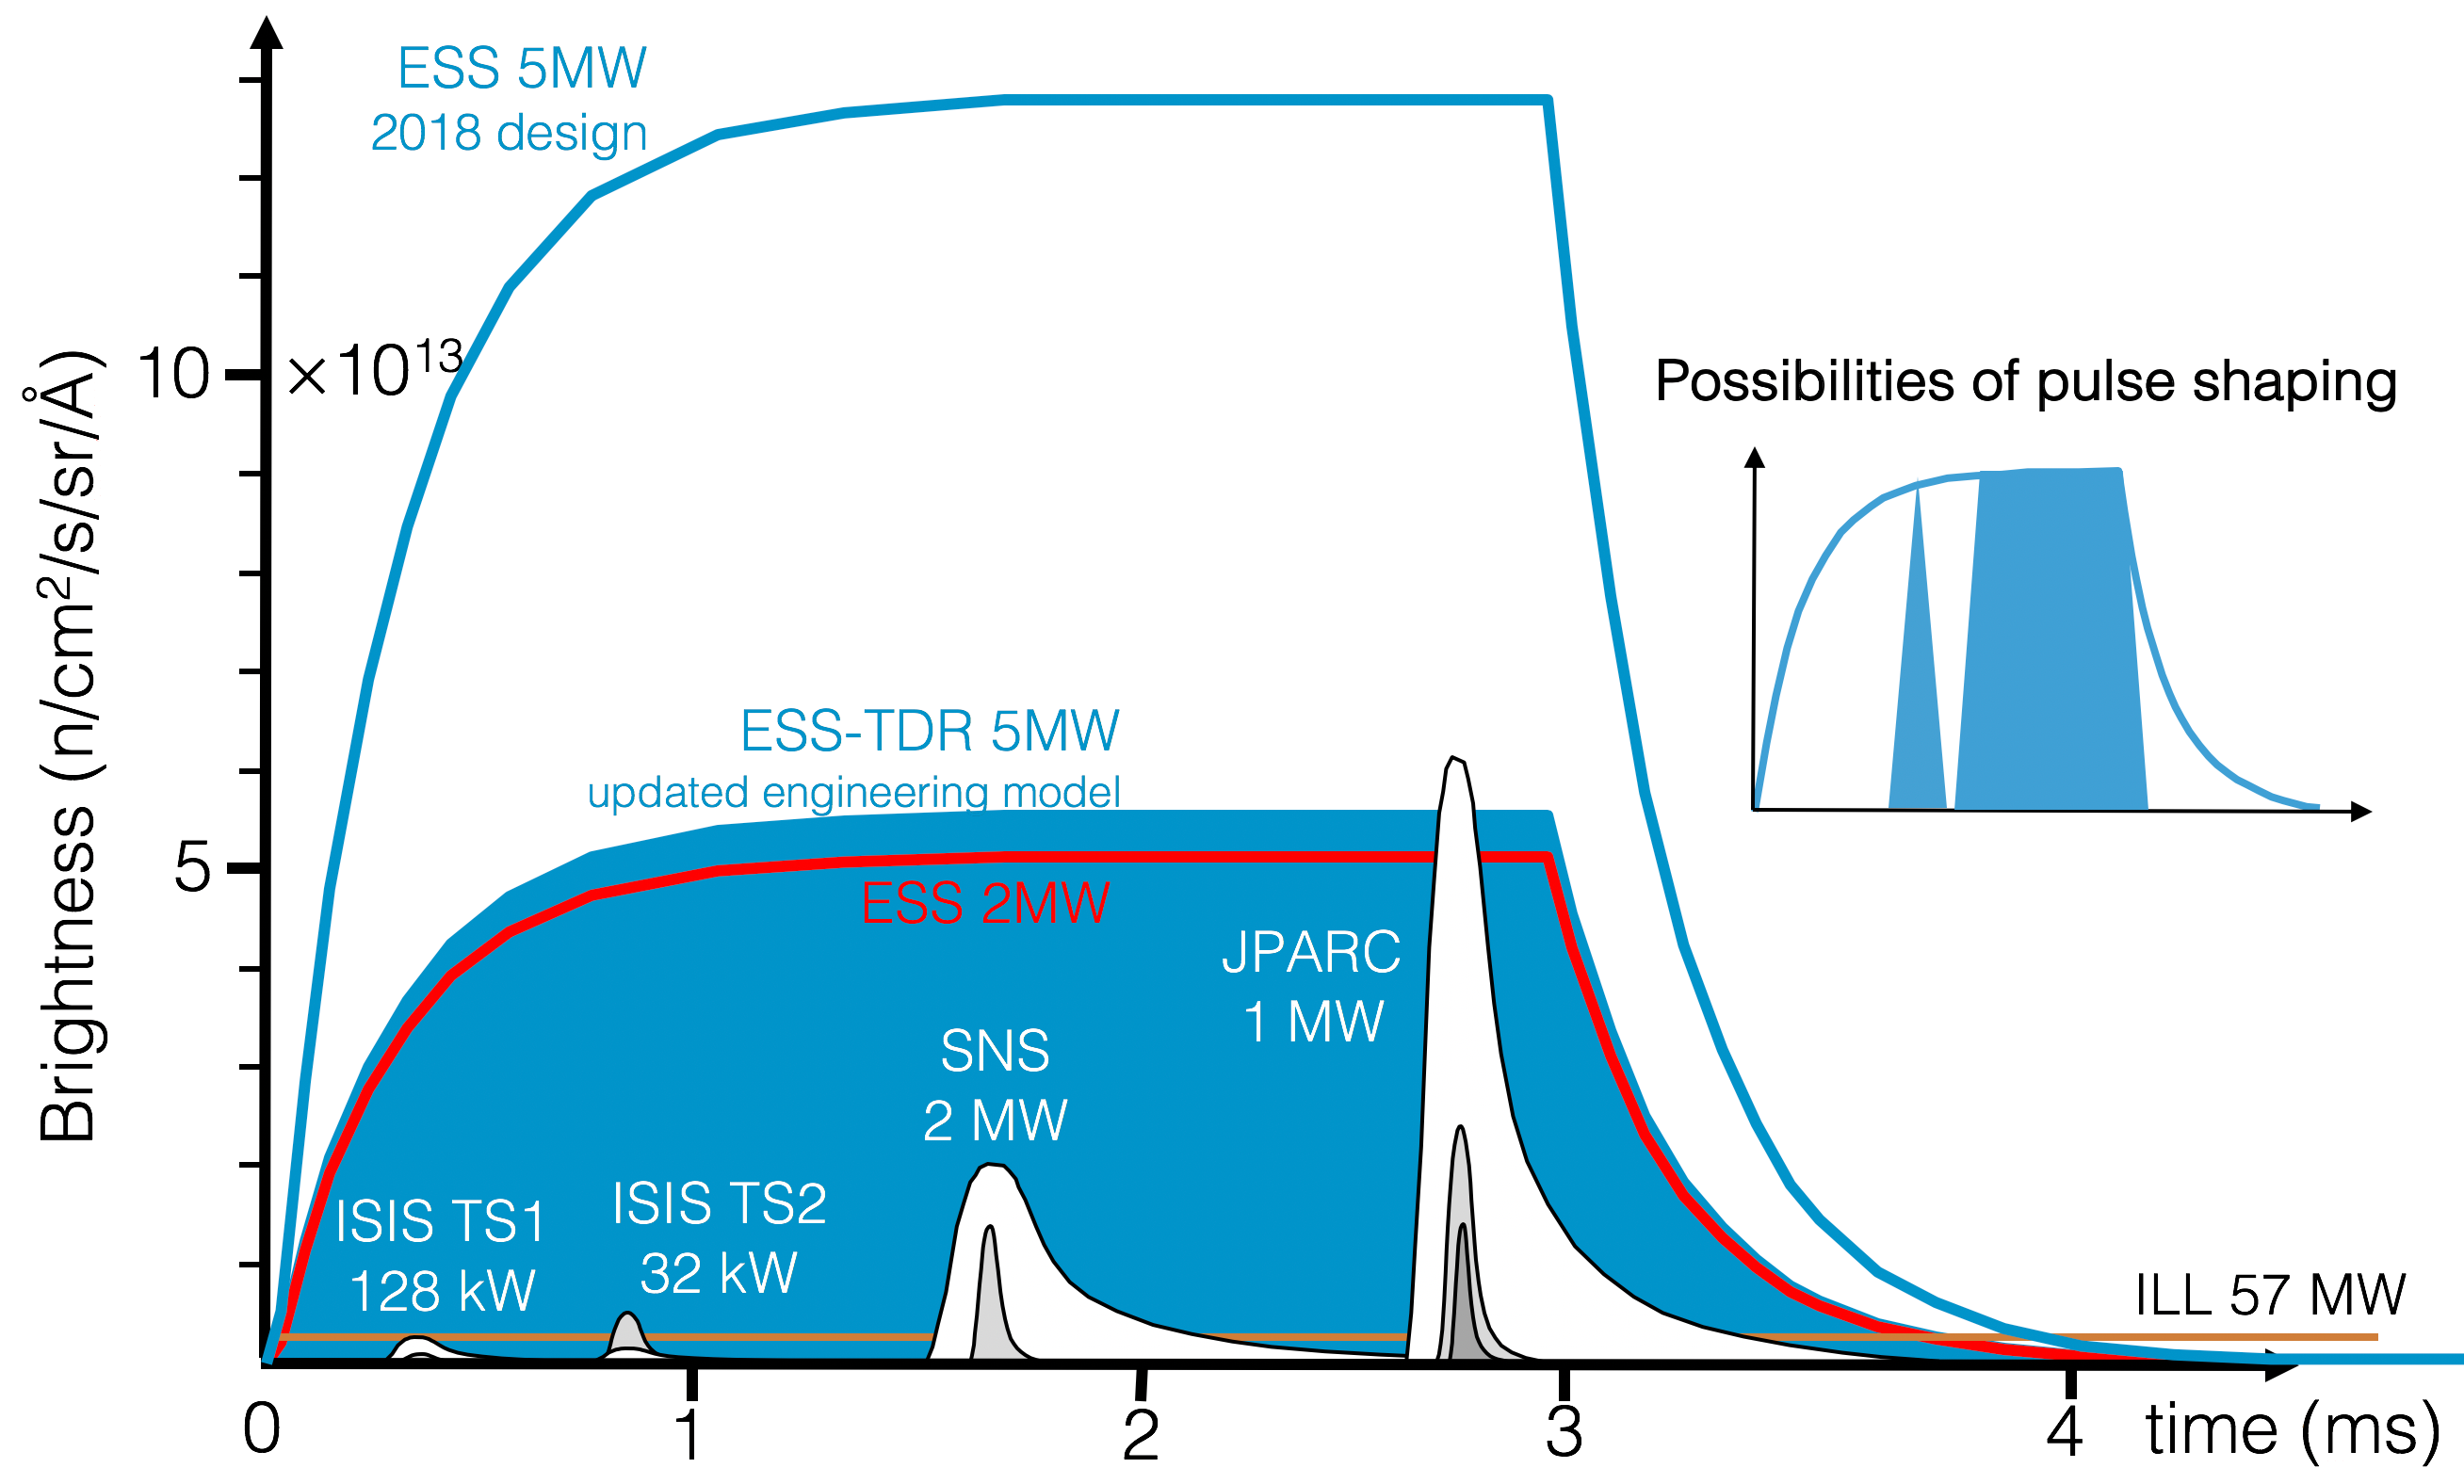
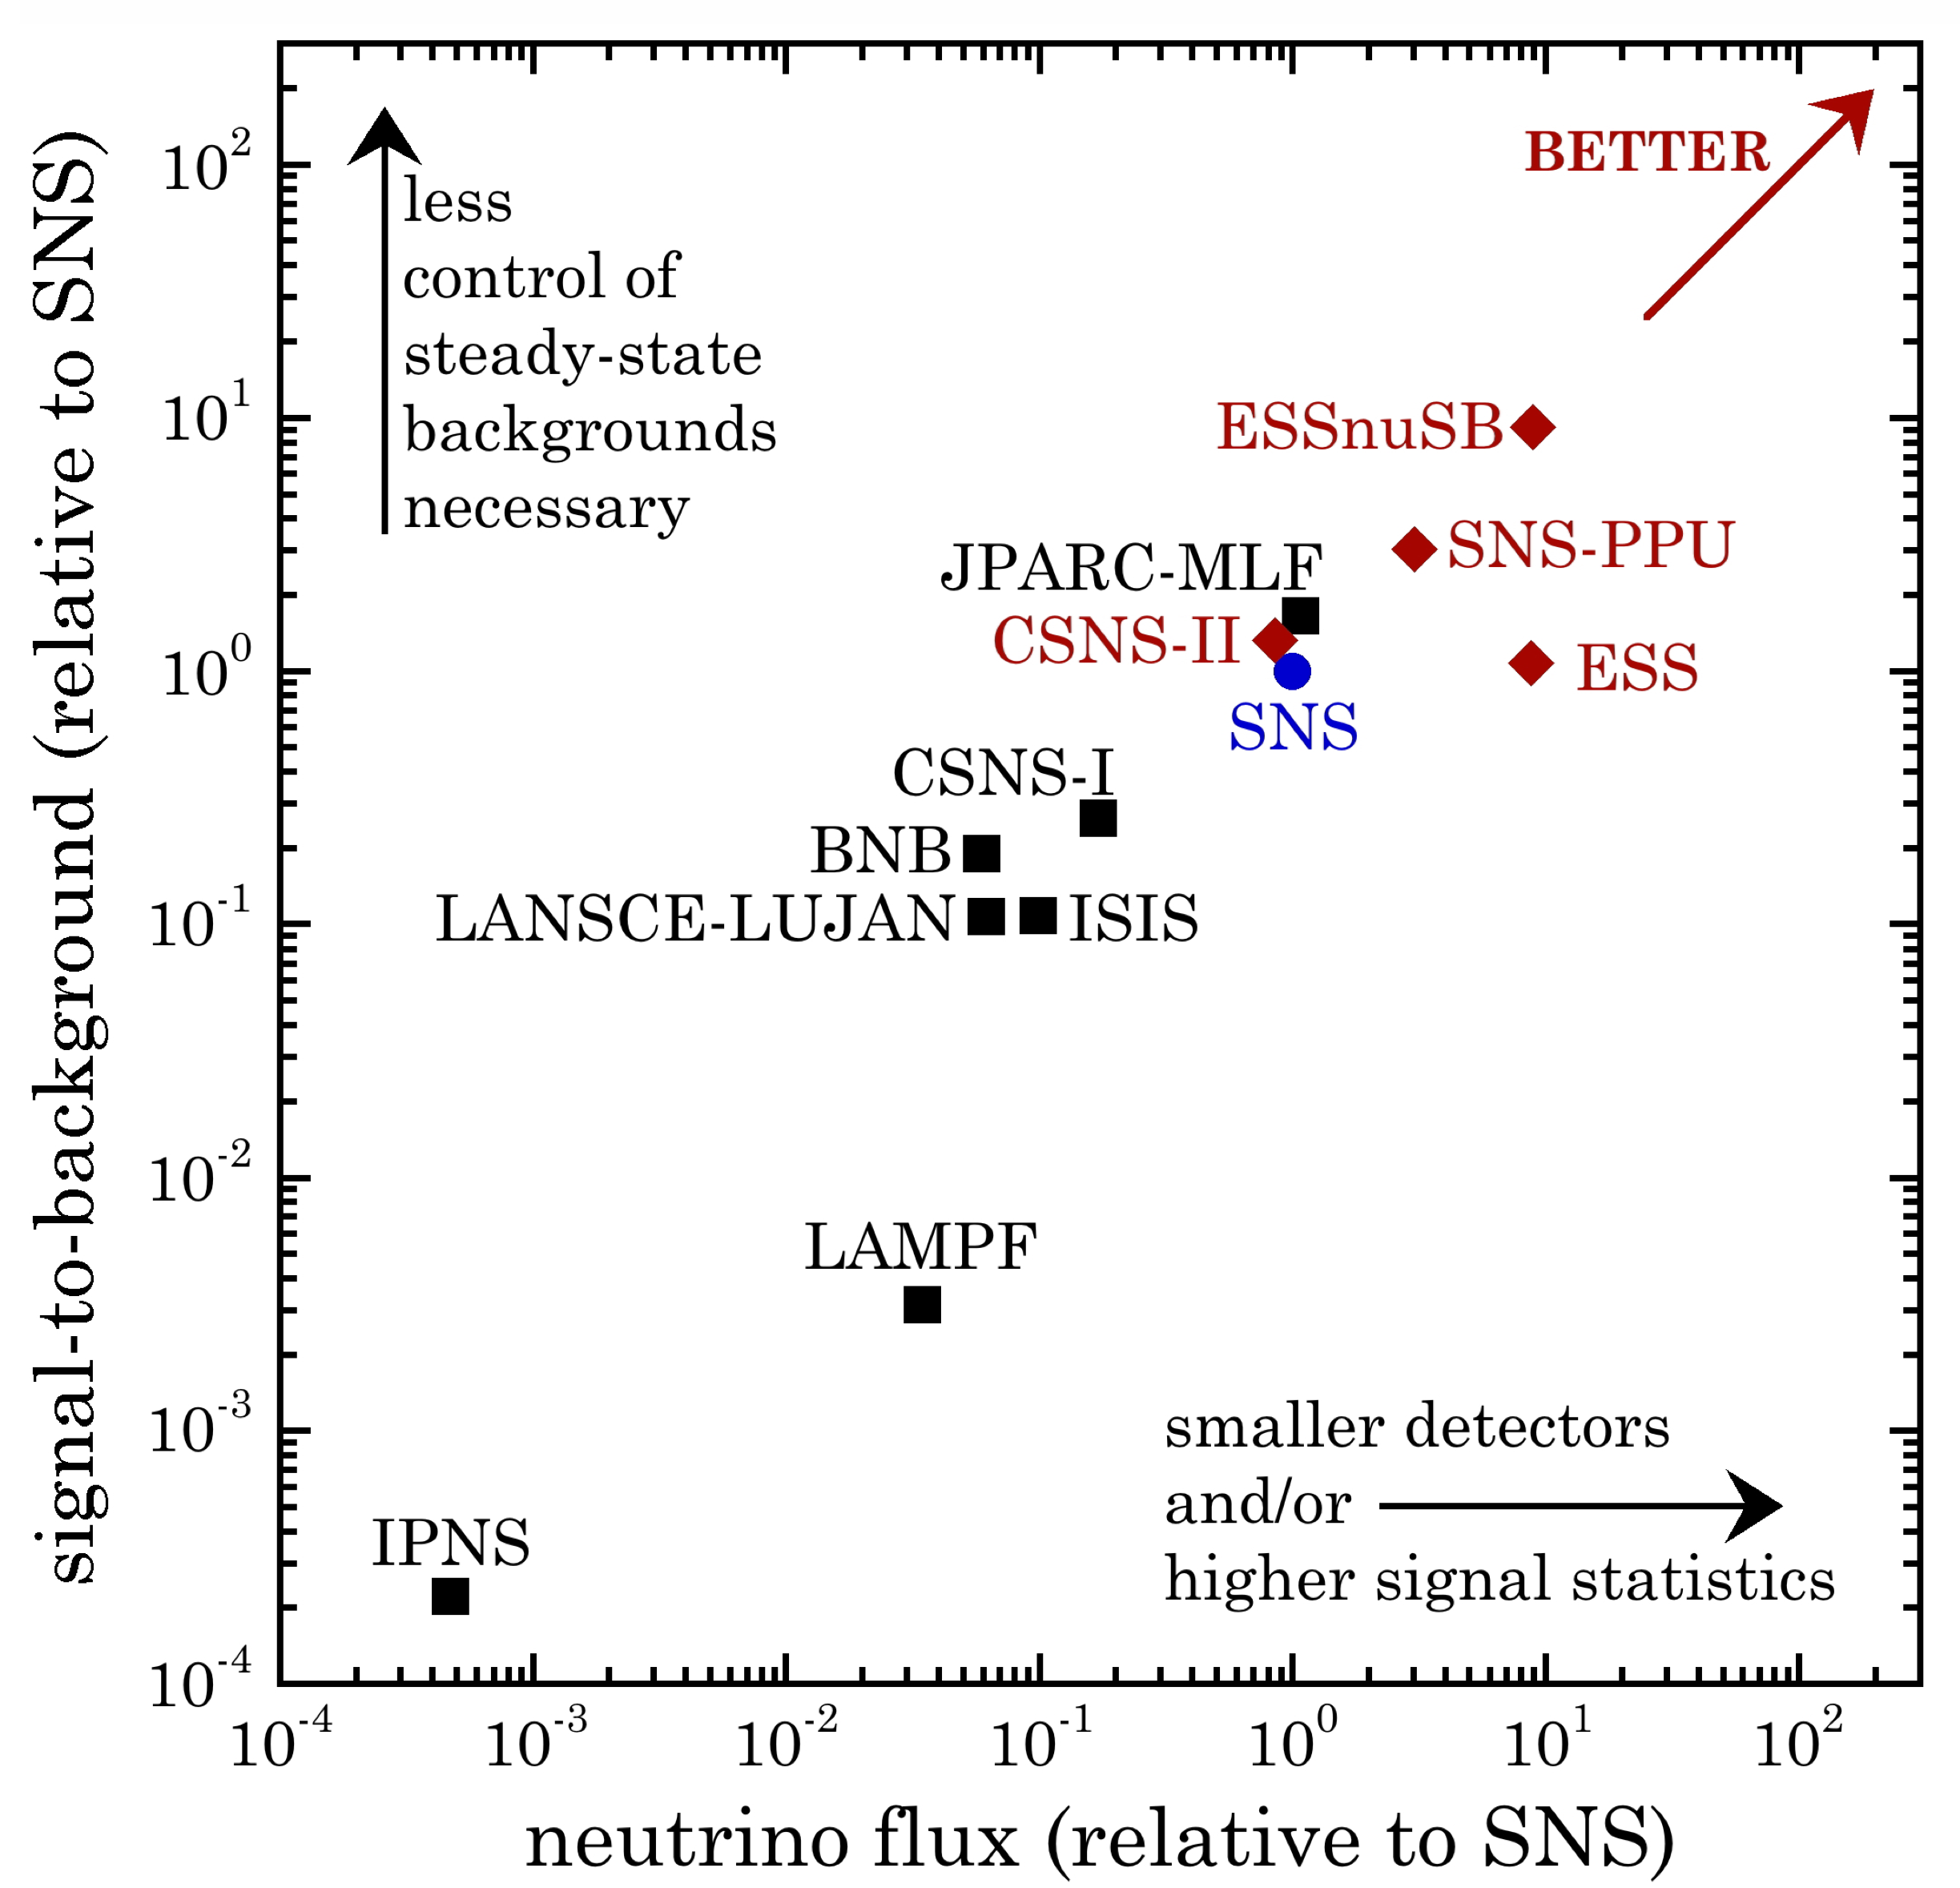
Compared to the Spallation Neutron Source (SNS) in Oak Ridge, United States and the J-PARC facility in Tokai, Japan, the ESS has a much larger duty factor. This feature, in principle, could increase the background from steady-state processes such as cosmic rays. However, steady-state backgrounds can be accurately characterized during the long anti-coincident periods between beam spills Baxter:2019mcx , and the signal-to-background figure of merit (FOM), as defined in ref. Abele:2022iml and reproduced in figure 2, is comparable for the three facilities.
Spallation sources produce both and in the proton-nucleus collisions in the target. Negative pions are efficiently absorbed by nuclei before they can decay, while positive ones lose energy as they propagate and finally decay at rest through:
| (1) | ||||
The energy spectra produced by these processes are well known Burman:2003ek ; Baxter:2019mcx . The flux is monochromatic with MeV, since the decay is a two-body process, while the and the fluxes exhibit a Michel distribution at energies MeV. The goal of SHiNESS is to compare the expected amounts of DAR neutrino interactions with the measured ones.
A simplified simulation of the beam was performed for exploratory studies regarding the detection of coherent elastic neutrino-nucleus scattering (CENS) at the ESS. The neutrino yield obtained by this simulation is 0.3 per proton Baxter:2019mcx , resulting in an expected DAR neutrinos per flavor per year. Figure 3 shows the neutrino flux as a function of the energy, obtained with a Geant4 GEANT4:2002zbu simulation using the BERT-HP physics list Heikkinen:2003sc .
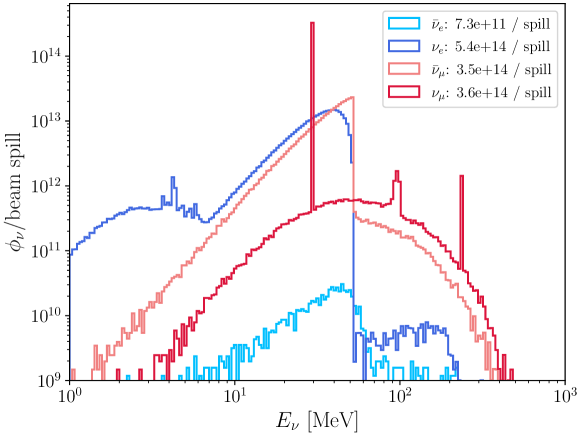
Apart from the monoenergetic peak at 29.7 MeV and the two Michel distributions for the and the components, the spectrum presents several interesting features:
-
•
muons captured by an atom can decay in orbit, producing with an endpoint energy of around 105 MeV;
-
•
kaons produced by the beam impinging on the target can also decay and produce monoenergetic 236 MeV through ;
-
•
the small amount of that decay before being absorbed can produce through . This component represents an irreducible background for the appearance search (see section 5.1).
The COHERENT collaboration has shown that the systematic uncertainty associated to the neutrino flux of the SNS can be constrained at the 10% level COHERENT:2021yvp . This is also the uncertainty assumed in the proposal for CENS detection at the ESS Baxter:2019mcx . Thus, in this document, we adopt a 10% systematic uncertainty for the , , and components. However, the component from decay has a very poor normalization constraint, since the decay and pion production points are not well known. This component can depend on the detail of the simulation and on the physics model adopted, so we assign a systematic uncertainty of 25%.
Total neutrino flux measurement could be performed through the neutral current (NC) channel of eq. (19) (see section 4.1.3). The detector could then be used also as a neutrino flux monitor for the proposed CENS experiments at the ESS Baxter:2019mcx . The CENS detection proposal also mentions the possibility to replicate at the ESS a small heavy water detector (1 m3 D2O) proposed to independently measure the neutrino yield of the SNS COHERENT:2021xhx .
2.2 The detector
2.2.1 Location
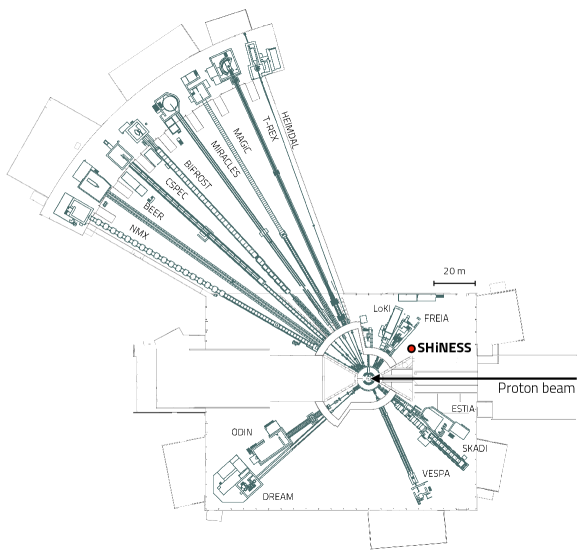
The D03 experimental hall of the ESS offers unallocated space for a medium-scale experiment. The detector can be placed around 25 m far from the proton beam target, with an angle of approximately in the backward direction of the beam, in order to suppress forward-boosted particles (see figure 4).
In the short baseline limit of and , ordinary, three-flavor neutrino oscillations have yet to develop Kopp:2013vaa . Thus, the eventual departure from unitarity will manifest itself through zero-distance effects, as detailed in section 3.1 and heavy neutral leptons, described in section 3.3, can be long-lived enough to reach the detector. In addition, at this distance from the beam target, the of the neutrino oscillation is also well matched to the LSND allowed region in the (3+1) light sterile neutrino model, as shown in section 3.2.
2.2.2 Technology
The detection of DAR neutrino interactions can be efficiently performed with a detector filled with liquid scintillator, which is the solution adopted by the KARMEN Zeitnitz:1994kz , LSND LSND:1996jxj , and JSNS2 JSNS2:2013jdh experiments. In this proposal, as a baseline approach, we consider a 4 m-high tank with a radius of 2 m, filled with liquid scintillator doped with gadolinium222Incidentally, this is a similar size of the tank used for the Water Cherenkov Test Experiment at CERN, which is currently under preparation and whose goal is to validate the technology of the proposed Intermediate Water Cherenkov Detector of the Hyper-Kamiokande experiment wcte .. We adopt 2,5-diphenyhloxazole (PPO) as the fluor and linear alkylbenzene C6H5C10-13H2(10-13)+1 (LAB) as the solvent. This cocktail is largely available, has a high light yield and a high flash point, with a successful track record in neutrino physics Beriguete:2014gua ; JUNO:2020bcl ; SNO:2020fhu ; Park:2013nsa . A possible alternative is represented by a mixture of phenyl-xylylethane (PXE) and dodecane (C12H26), which was successfully used by the Double Chooz experiment DoubleChooz:2006vya ; Aberle:2011ar . The presence of a small concentration of gadolinium (around 0.1% in mass) greatly increases the neutron absorption probability, given its very high neutron cross section (48800 barn) leinweber2006neutron . The Gd atom releases a sum of 8 MeV energy in a cascade after neutron capture Tanaka:2019hti , which has the advantage of being sensibly higher than the energy released upon capture on hydrogen (2.2 MeV).
The design of the SHiNESS detector is driven by the following considerations:
- •
-
•
the detection of HNLs producing a pair (section 3.3) requires the ability to reconstruct the direction of the two leptons.
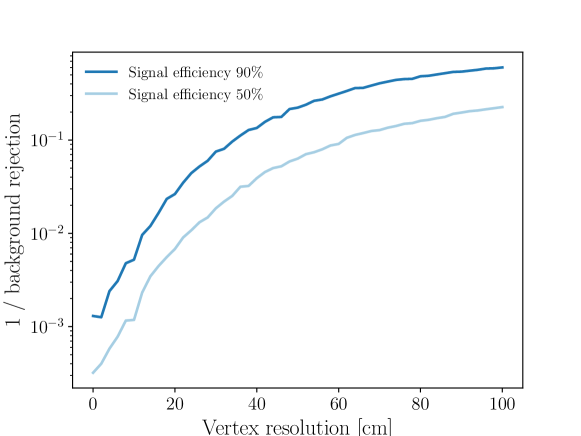
While signal events for inverse beta decay (IBD) and carbon charged-current interactions produce prompt and delayed signals in close vicinity (see section 4), interactions caused by accidental coincidences will be usually separated by tens of centimeters. Thus, a good vertex resolution is essential to reject this background. Figure 5 shows the background rejection power as a function of the position resolution. If we require a signal efficiency of 50%, a vertex resolution of 25 cm corresponds to an accidental background rejection factor of approximately .
In order to satisfy these requirements, the SHiNESS baseline design includes an array of 38 Hamamatsu photomultipliers R12860 Hamamatsu with a diameter of 20”.
The detection of Cherenkov photons, in addition to the scintillation light, can improve the vertex resolution and allow to reconstruct the directionality of the particles produced in the interaction, thus enabling HNL searches. Separation of Cherenkov and scintillation light can be achieved through timing, directionality, or chromatic separation (or a combination of the three). This is because Cherenkov light is emitted promptly and along the direction of the particle, while scintillation light has a typical emission time constant and is emitted isotropically. Also, the scintillation emission spectrum is relatively narrow, while the Cherenkov radiation follows a power-law distribution given by the Frank-Tamm formula Frank:1937fk . Separation has been demonstrated in LAB and LAB/PPO exploiting both the different time profile Li:2015phc ; Kaptanoglu:2018sus and the wavelength spectrum Kaptanoglu:2018sus of the two types of light emission.
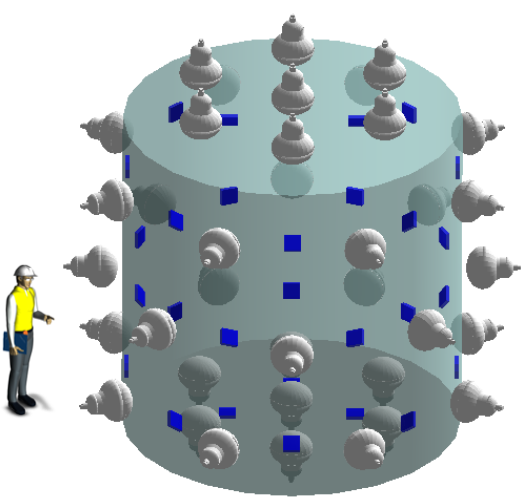
In the baseline SHiNESS design, shown in figure 6, separation between Cherenkov and scintillation time is enabled by 32 Incom Large Area Picosecond Photodetectors (LAPPDsTM) Incom of cm2. LAPPDs offer single photoelectron time resolutions below 100 ps and sub-cm spatial resolution Lyashenko:2019tdj , allowing to discriminate in time between scintillation and Cherenkov light emission. As a reference, the ANNIE experiment is deploying one LAPPD for every 25 PMTs (whose diameters vary between 8” and 11”), with an expected vertex resolution improvement of a factor of three (from 38 cm to 12 cm) and an expected angular resolution improvement of a factor of two (from 11∘ to 5∘) ANNIE:2017nng . In the case of SHiNESS, 32 LAPPDs allow to detect at least 10 Cherenkov photons in the first 5 ns for 50% of the inverse beta decay (IBD) events.
The photosensors, placed uniformly on all sides, provide a photocoverage of 10.1%. Assuming a light yield of photons/MeV GUO201933 , this photocoverage corresponds to an energy resolution of . The energy resolution is not a critical parameter for the physics searches and the main driver of the photocoverage is the ability to accurately reconstruct the interaction vertex.
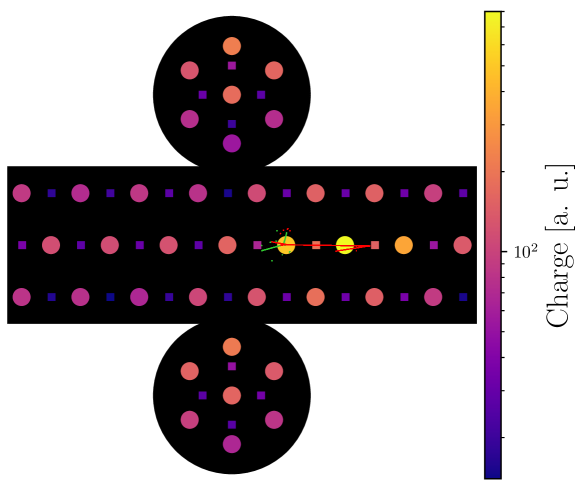
A simulated event display of an IBD event in the detector (process described in detail in section 4.1.1) is shown in figure 7. The positron emission and the neutron absorption happen in close vicinity.
Since the detector will have only a limited overburden, a cosmic-muon veto must be implemented. Two main options are being considered. The first one is represented by an outer layer of liquid scintillator surrounding the main detector and equipped with PMTs. This is the solution adopted by the LSND experiment, which achieved a cosmic-ray veto inefficiency Conrad:2013mka , and by the JSNS2 experiment, which employs also a second layer as gamma-catcher JSNS2:2021hyk . A second option is represented by panels made of plastic scintillator which surround the detector, as implemented by e.g. the KARMEN KARMEN:1994xse and MicroBooNE MicroBooNE:2019lta experiments.
2.2.3 Performances
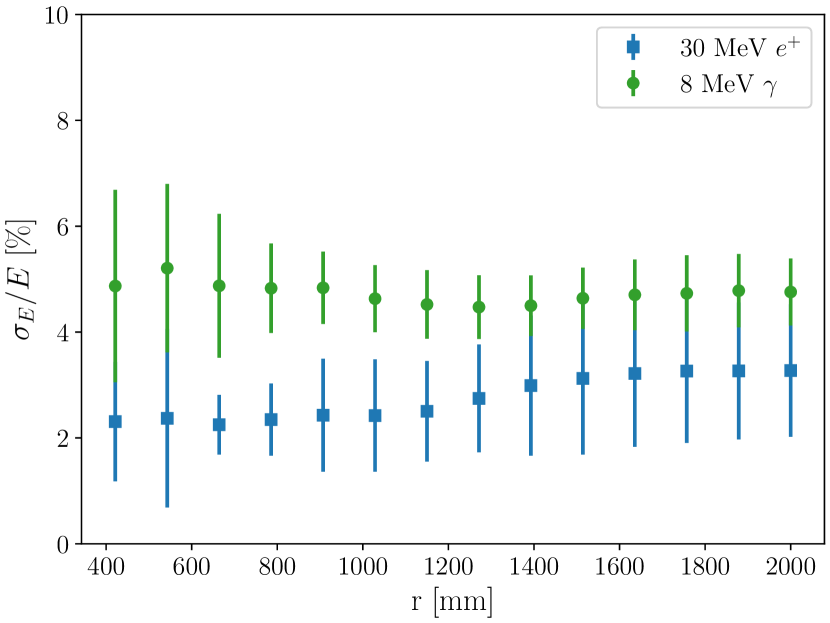
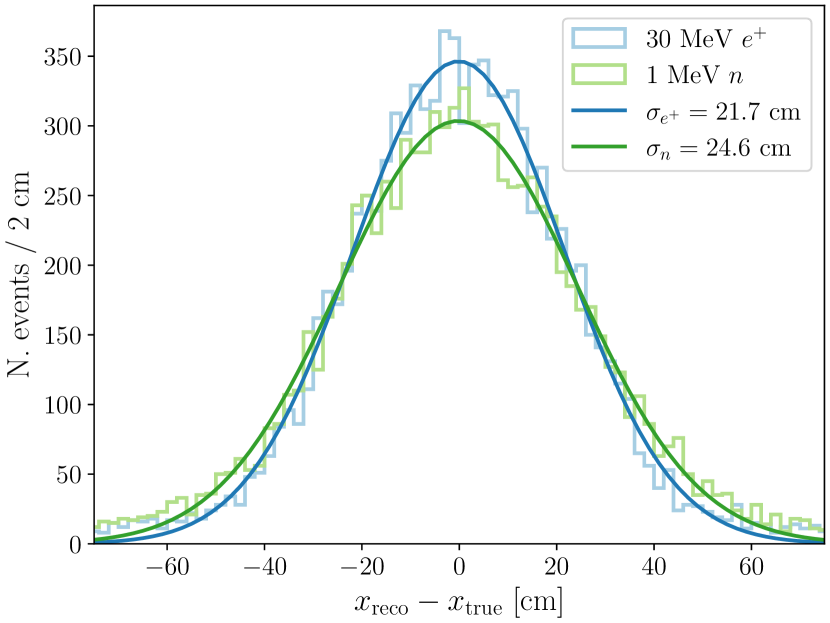
The long attenuation length of the liquid scintillator cocktail (14 m at 430 nm for LAB/PPO Beriguete:2014gua ), combined with a uniform photosensor coverage, allows achieving an almost uniform energy resolution as a function of the radius, as shown in figure 8(a) for a Geant4 simulation of 30 MeV positrons and 8 MeV Gd-capture .
A naive centroid algorithm using only the light detected by the PMTs gives a vertex resolution of approximately 20 cm (see figure 8(b)). This value can be significantly improved by reconstructing the Cherenkov cone using the first hundreds of picoseconds of the LAPPDs signals, as demonstrated by the ANNIE experiment ANNIE:2017nng .
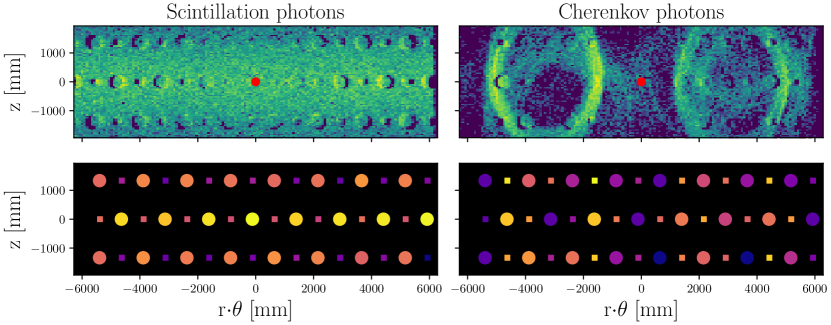
Figure 9 shows the spatial distribution for Cherenkov and scintillation photons and the relative charge collected by the photosensors in the SHiNESS detector for a pair produced by a HNL decay. Isolating the Cherenkov component allows to reconstruct the direction of the two leptons, which would not be possible using only the scintillation light.
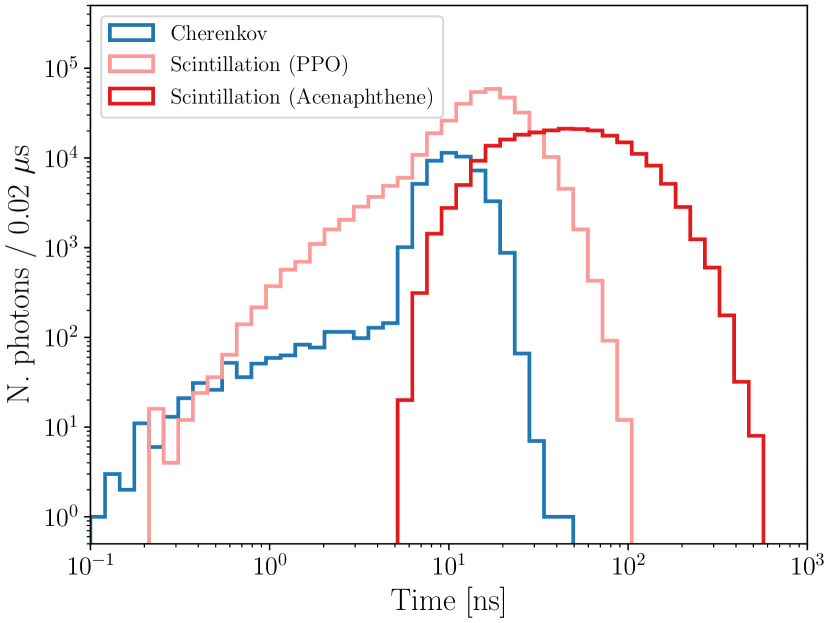
The time discrimination between Cherenkov and scintillation light could eventually be increased by loading the scintillator with slow fluors, as detailed in ref. Biller:2020uoi . Figure 10(a) shows the arrival time distributions for the photons generated by a 30 MeV electron in the SHiNESS detector, using PPO or acenaphthene, one of the slow fluor candidates. In the latter case, the separation in time between Cherenkov and scintillation photons increases up to few ns. After requiring a Cherenkov light detection efficiency of 50%, the purity of the Cherenkov selection goes from 23% in the case of PPO to 91% in the case of acenaphthene.
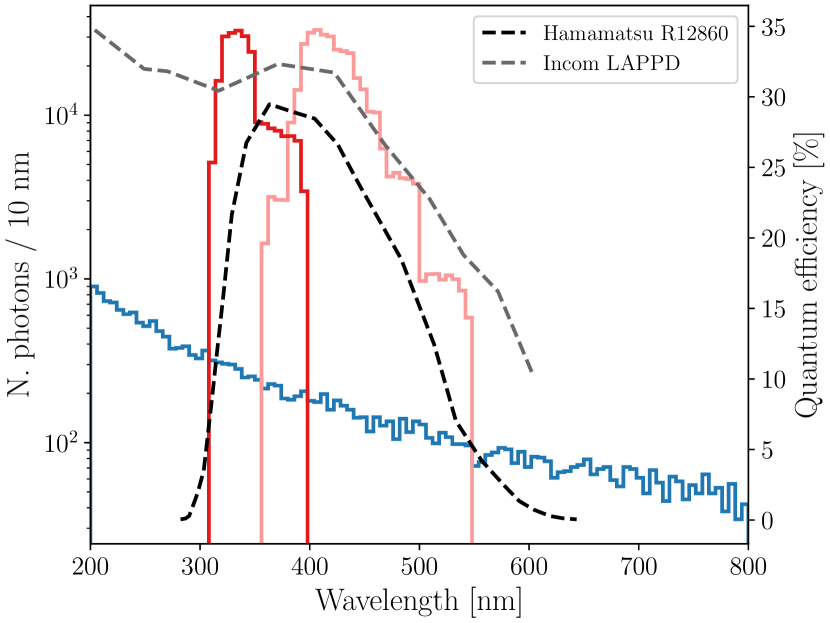
The R12860 and LAPPD quantum efficiencies are well matched to the scintillation and Cherenkov emission spectrum (see figure 10(b)). However, absorption length of LAB/PPO increases rapidly in the UV, so only a small portion of the UV Cherenkov photons will reach the photosensors. A rich R&D program is devoted at increasing the discrimination between scintillation and Cherenkov photons in liquid scintillator Wonsak:2018uby ; Aberle:2013jba . A notable example is represented by quantum dots (QDs): these are semiconducting nanocrystals that can be loaded in the liquid scintillator and can shift the UV Cherenkov photons towards the visible with a high efficiency Gruszko:2018gzr . In the SHiNESS detector, a simplified simulation of perovskite quantum dots loading plasmachem gives an improvement of approximately a factor of 1.7 in the number of detected Cherenkov photons. Table 1 shows a summary of the possible cocktails for the liquid scintillator and the relative Cherenkov detection performances.
| Cocktail |
|
|
||||
|---|---|---|---|---|---|---|
| LAB/PPO | 23% | 10.4 | ||||
| LAB/Acenaphthene | 91% | 10.4 | ||||
| LAB/PPO + QDs | 23% | 18.2 |
Alternatively, several collaborations are developing water-based liquid scintillators (WbLS) ANNIE:2017nng ; Theia:2019non ; WATCHMAN:2015lcq , which uniquely combine the high light yield and low threshold of scintillator with the directionality of a Cherenkov detector Alonso:2014fwf . As an example, the THEIA collaboration Theia:2019non is exploring the separation of Cherenkov and scintillation photons for direction reconstruction of few-MeV electrons using a WbLS cocktail.
3 Phenomenological implications of an extended neutrino sector
As outlined in the introduction, an extended neutrino sector is well-motivated as the SM particle content needs to be enlarged in order to generate neutrino masses. Depending on the nature of the new particles and the values of their masses, different phenomenological consequences arise. We start discussing the implications of a non-unitary leptonic mixing matrix in section 3.1, as it provides a model-independent way to search for indirect evidence of new states in the neutrino sector, that is valid across a wide range of masses and for a plethora of models.
However, SHiNESS will also be able to search for direct signals due to additional neutrinos, either through the observation of oscillation signals (if there are new neutrinos present at the eV scale) or from their decays (for heavy neutrinos, with masses around the MeV scale or above). These two scenarios are discussed separately, in sections 3.2 and 3.3, respectively.
3.1 Probing the unitarity of the lepton matrix
Neutrino oscillations generally assume a unitary lepton mixing matrix . In the Pontecorvo–Maki–Nakagawa–Sakata parametrization this matrix is written by means of three mixing angles and one complex (Dirac) CP phase ParticleDataGroup:2022pth , plus two additional CP phases if neutrinos are Majorana. The unitarity of the matrix, however, only holds in a limited amount of neutrino mass models. In general, in the presence of additional neutrinos, the mass Lagrangian in the extended neutrino sector is diagonalized by a mixing matrix:
| (2) |
where is a matrix and and are and rectangular matrices, respectively. Here, is the active neutrino block of the matrix, which does not have to be unitary anymore. In the simple case of a type-I Seesaw Minkowski:1977sc ; Mohapatra:1979ia ; Yanagida:1979as ; Gell-Mann:1979vob , the presence of right-handed heavy neutrinos causes unitarity deviations for which are proportional to the ratio between the masses of the light and heavy states. While a naive type-I seesaw would yield an exceedingly small effect ( for heavy states), there are several examples of neutrino mass models predicting larger deviations Mohapatra:1979ia ; Antusch:2014woa ; Nelson:2007yq ; Antusch:2006vwa . Thus, searching for unitarity violation represents a model-independent way to probe for non-standard neutrino states and interactions Blennow:2016jkn , with direct sensitivity to BSM physics. Moreover, if the mixing matrix in the active block, , is not unitary, then additional CP phases would enter its definition. In fact, deviations from unitarity in the active block are often described using a lower triangular parametrization Xing:2007zj ; Xing:2011ur ; Escrihuela:2015wra , which includes three off-diagonal complex parameters, each of them with an associated CP phase. Therefore, non-unitarity effects could a priori be relevant for the upcoming neutrino oscillation experiments DUNE and Hyper-Kamiokande, which will aim to determine whether there is CP violation in the lepton sector.
A unitary matrix should meet a total of 9 conditions, which are easily derived from the requirement that . They boil down to requiring that all its rows are normalized to one, and that the so-called unitarity triangles close:
| (3) | |||||
| (4) |
where indicate active neutrino flavor indices . If is not unitary then the conditions in eqs. (3), (4) do not have to be satisfied. Thus, a way to constrain the unitarity of the leptonic mixing matrix consists in probing the quantities and defined above. In this case it is worth noting though, that if the whole matrix is unitary, then the application of Cauchy-Schwarz inequalities imposes restrictions on the values of and . This allows to place indirect limits on unitarity deviations which can in some cases be stronger than direct bounds Antusch:2006vwa ; Parke:2015goa . However, in order to be as general as possible, here we adopt instead an agnostic assumption (as in ref. Ellis:2020hus ) and do not assume that is unitary.
Experimentally, a non-unitary matrix leads to a non-vanishing probability to have flavor transitions at negligible distances, also known as zero distance effects Antusch:2006vwa . The oscillation probabilities in this case read
| (5) | ||||
| (6) |
A short-baseline neutrino experiment such as SHiNESS may therefore be sensitive to such effects since standard, three-flavor oscillations have yet to develop. From the expressions above, however, it is evident that the sensitivity to will be directly limited by the systematic uncertainties associated to the normalization of the event sample and therefore will not be discussed here. A search for anomalous appearance is much more promising, provided that backgrounds can be sufficiently reduced. In particular, SHiNESS is expected to be sensitive to the closure of the electron-muon triangle parameter through the appearance probability , looking for an excess of IBD events in the detector.
3.2 Light sterile neutrinos
If the extra neutrinos are light enough, they could participate in oscillations, leading to a new oscillation frequency and a smoking signal at neutrino detectors. As outlined in the introduction, throughout the past two decades a plethora of experiments have reported contradicting signals in the context of sterile neutrino searches in oscillation experiments Diaz:2019fwt ; Dentler:2018sju . If the reported anomalies are caused by the existence of a fourth mass neutrino eigenstate, the best value for the mass splitting is around the scale Dentler:2018sju and much larger than the other two mass splittings , . For this reason this is usually referred to as a (3+1) scenario. For sufficiently short baselines, and , so that standard three-flavor neutrino oscillations have yet to develop. In this limit, appearance and disappearance oscillations can be approximated as:
| (7) | ||||
| (8) |
where is the neutrino energy, is the distance traveled by the neutrino Dasgupta:2021ies , and the last expression only holds for . Here we have adopted the usual definitions for the effective mixing angles that control the amplitude of the oscillation (which eventually can be mapped onto the elements of the full mixing matrix, and ).
The SHiNESS experiment has the ability of definitely clarifying the complex (and, at times, contradictory) experimental scenario revolving the existence of a sterile neutrino, thanks to its key features:
-
•
will detect DAR neutrinos, whose spectrum is well understood and shape systematic uncertainties are small;
-
•
will sit at a distance from the neutrino source similar to the one of the LSND experiment (25 m vs. 30 m). This will allow to cover the entire parameter space in the (3+1) model allowed by the LSND result, complementary to the space covered by the JSNS2 experiment JSNS2:2013jdh ;
-
•
is sensitive to both the appearance channel and the disappearance channel, thus probing the light sterile neutrino model for both the LSND/MiniBooNE and the gallium anomaly.
We finalize this discussion by stressing the similarities between the phenomenology associated to a non-unitary mixing matrix and that of an averaged-out sterile neutrino oscillation. Generally speaking, oscillations are said to be averaged-out when the corresponding oscillation frequency leads to oscillations that are too fast to be resolved by the detector, considering its energy and spatial resolution as well as the distance to the detector and the energy of the neutrinos. In the case of SHiNESS this translates into the condition . As discussed in refs. Blennow:2016jkn ; Coloma:2021uhq , at leading order the phenomenological consequences of a non-unitarity mixing matrix are mostly equivalent to those of an averaged-out sterile neutrino, up to quartic terms in the mixing between the heavy and active states (see refs. Fong:2016yyh ; Fong:2017gke for a discussion on such effects). Thus, above this value the limits on the unitarity of the lepton mixing matrix (obtained in a model-independent way) can be mapped onto the limits on the mixing angle for a sterile neutrino (and viceversa). Conversely, for sterile neutrino masses below this scale the corresponding oscillations could be resolved and measured at the detector. As the two limits yield very different phenomenological implications, we will study them separately.
3.3 Heavy Neutral Leptons
If the new neutrino states have their masses at the MeV or GeV scale, they are usually refereed to as Heavy Neutral Leptons (HNL). HNLs can couple to SM particles through their mixing with the SM neutrinos and therefore may be produced copiously in meson decays as well as muon or tau decays. Once produced, a HNL may travel for hundreds or thousands of meters before decaying back to a combination of SM leptons and mesons. This makes fixed-target experiments an ideal setup to search for their decay signals (for a recent review of the strongest constraints on HNLs see e.g. ref. Fernandez-Martinez:2023phj ). Specifically, the large number of stopped pions and muons at spallation sources makes them outstanding facilities to search for HNLs below the pion mass Ema:2023buz .
Once produced near the ESS beam target, HNLs can be long-lived enough to reach the SHiNESS detector and decay visibly inside as , where the flavor of the neutrino in the final state will depend on the mixing of the HNL with the active neutrinos. Hereafter we follow the analysis of ref. Ema:2023buz and consider two cases separately, depending on whether the HNL mixes predominantly with muon or electron neutrinos.
In the muon mixing case, the HNL is mainly produced from the decay of muons, although for sufficiently light masses () it may also be produced subdominantly from pion decays. The HNL then decays via the neutral current, with the following decay width:
| (9) |
where is the Weinberg angle.
In the electron mixing case, the HNL is abundantly produced both from the decay of muons and pions. Contrary to the muon mixing case, in this case the HNL can decay both via the neutral current and the charged current. The corresponding decay rate reads Gorbunov:2007ak ; Atre:2009rg :
| (10) |
In the limit of a very long-lived HNL, the total number of HNL decays in the detector can be obtained approximately as:
| (11) |
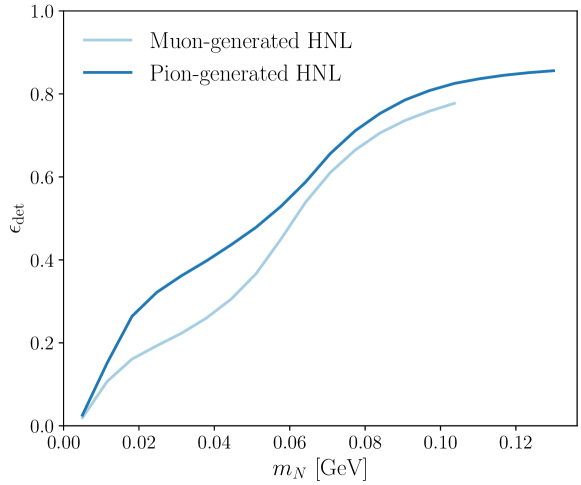
where stands for the total number of parent particles (), represents the other particles produced together with the HNL (which depend on the decay channel), is the differential production rate as a function of the HNL energy (which can be found e.g. in ref. Ema:2023buz ), and is the total decay width of particle . The selection efficiency is given by , see figure 13. The length of the detector is , and is the decay length of the HNL in the lab frame, while is the branching ratio into the decay channel . It follows from eq. (11) that, in this limit, the result only depends on , while the dependence on the total width of the HNL effectively drops out.
4 Expected number of signal events
4.1 Neutrino detection
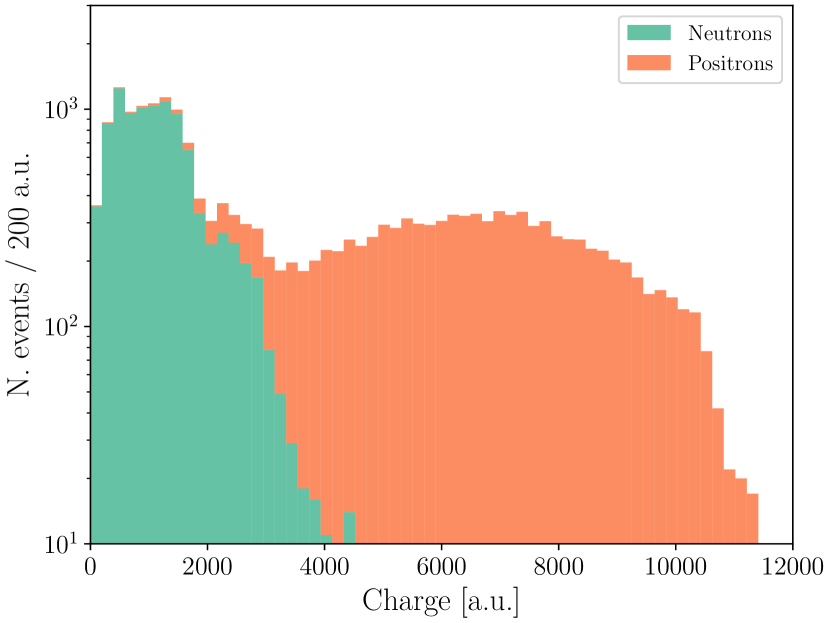
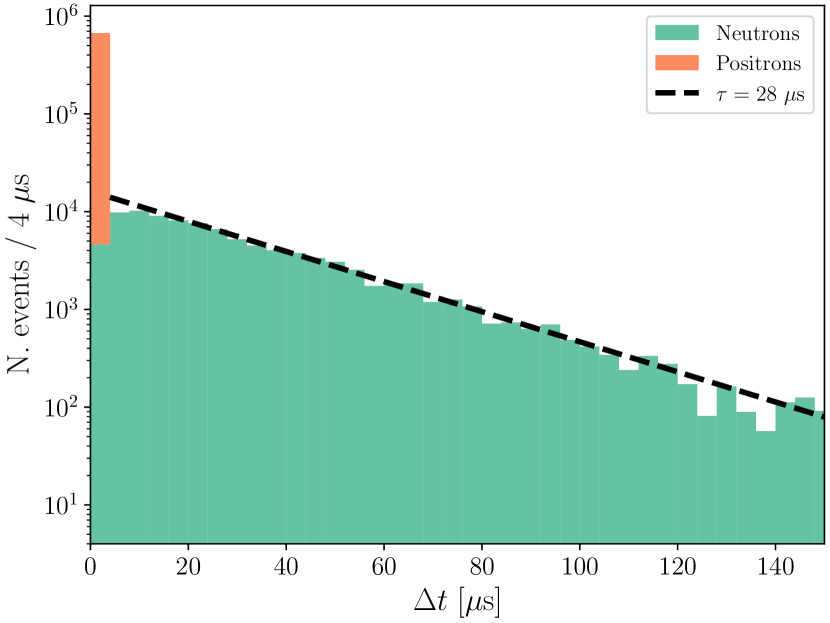
4.1.1 Inverse beta decay
The interaction of in the liquid scintillator can be detected through to observation of the IBD process both on protons:
| (12) |
and on carbon atoms:
| (13) |
The experimental signature of this process is the emission of a positron followed by the delayed neutron capture and its emission. Figure 11 shows the time and charge distribution for IBD events in the SHiNESS detector, obtained with a Geant4 simulation. The positron generates a prompt signal, while the neutron absorption generates a delayed signal with a characteristic exponential time constant of around 28 \unit\micro. Neutrons generate signal in the lower end of the charge spectrum, while the positrons follow a broad Michel distribution.
Assuming an active mass of 42 ton of liquid scintillator and knowing the flux-averaged cross sections we can calculate the number of inverse beta decay events we expect in case of appearance. The yearly flux of from DAR that can oscillate into at a distance of 25 m from the beam target is given by:
| (14) | ||||
| (15) |
The total number of oscillated events, assuming a 100% oscillation probability and a 10% systematic uncertainty, is given by the sum of the interactions on the proton and carbon targets:
| (16) | ||||
where:
-
•
is the number of hydrogen targets;
-
•
is the number of carbon targets;
-
•
cm2 is the flux-averaged cross section for the IBD process on proton KARMEN:2002zcm ; Vogel:1999zy ;
-
•
cm2 is the flux-averaged cross section for the IBD process on carbon KARMEN:2002zcm ; Kolbe:2000np ;
-
•
is the assumed SHiNESS detector efficiency.
4.1.2 Charged-current interaction
The can interact on carbon via the charged-current channel:
| (17) | ||||
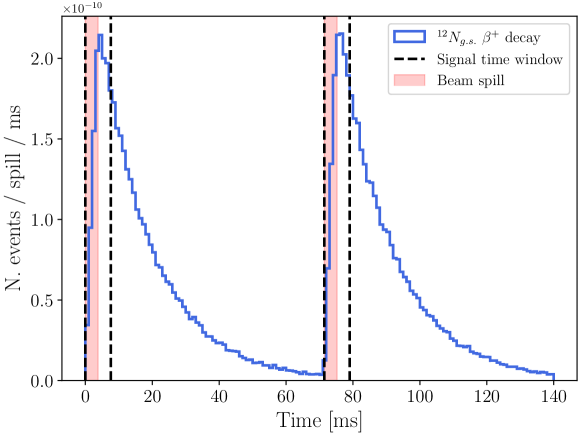
The experimental signature of this process is the emission of the electron and the subsequent beta decay in delayed coincidence Conrad:2011ce . The scattered electron has a maximum kinetic energy of 35.5 MeV due to the value of 17.3 MeV. The recoil energy of the nucleus is negligible, so MeV LSND:2001fbw . The positron has a maximum kinetic energy of 16.3 MeV and the decay has a lifetime of 15.9 ms Krakauer:1991rf , which is significantly longer than the beam spill. Thus, in order to reduce the amount of steady-state backgrounds, we apply a timing cut of 2 beam spills (7.6 ms), which has an efficiency . Figure 12 shows the time distribution of the -decay for two consecutive beam spills.
The yearly flux from DAR is the same as the one of eq. (14), given the production process of eq. (1). The number of yearly charged-current interactions in the detector, assuming a 10% systematic uncertainty, is then given by:
| (18) | ||||
where cm2 is the flux-averaged cross section as calculated in ref. Kolbe:1999au . Both the KARMEN KARMEN:1994xse and the LSND experiment LSND:2001fbw found this calculation in good agreement with the data.
4.1.3 Neutral-current interaction
All the three neutrino types , and can interact with the carbon atom through the neutral current (NC) channel and the subsequent emission of 15.11 MeV :
| (19) | ||||
The flux-averaged cross sections for and and for the monoenergetic were calculated in ref. Kolbe:1994xb as cm2 and cm2, respectively. Both cross sections were measured by the KARMEN experiment and found in good agreement with the calculation KARMEN:1995dwo ; KARMEN:1998xmo . Given the large beam spill of the ESS, it is not possible to distinguish between , produced by prompt decay ( ns), and and , produced by slower decay ( ). Thus, we consider a total cross section for the entire flux cm2.
The total number of neutral current DAR neutrino interactions on carbon, assuming a 10% systematic uncertainty, is then given by:
| (20) | ||||
where cm-2 events/year is the sum of the , , and fluxes.
4.2 Decays of Heavy Neutral Leptons
As outlined in section 3.3, the main signal expected at SHiNESS from a HNL with mass below the pion mass is an excess of events with an electron positron pair in the final state (plus a neutrino, which of course exists the detector unobserved). The expected number of signal events can be estimated inserting the values for SHiNESS into eq. (11), for sufficiently low values of the mixing (so that the approximation of a very long-lived particle holds). For the electron-mixing case we obtain:
| (21) | ||||
| (22) |
where in the last expression we have neglected the mass of the electron for simplicity. In the muon-mixing scenario, on the other hand, we get:
| (23) | ||||
| (24) |
For each case, and for a given value of the mass and the mixing, the total number of events is obtained adding both contributions from pion and muon decays.
Experimentally, the pair will be emitted in the laboratory frame with a certain angle, which is essentially controlled by . The selection efficiency in the SHiNESS detector for HNL events produced by muons and pions decay is shown in figure 13, assuming an angular resolution of . This value represents an educated guess on the capability of the detector and is comparable with the of LSND Conrad:2013mka , which only employed PMTs. A cut on the reconstructed energy of 17 MeV and a cut on the angle between the two leptons of are applied. The dependence on the parent particle comes from the different energy spectra, which leads to a slightly different boost and therefore a different opening angle for the electron pair.
5 Expected backgrounds
5.1 Backgrounds to neutrino detection
beam component
Although the vast majority of is absorbed in the target before it can decay, a small fraction can decay in flight and emit , which are indistinguishable from the ones caused by the eventual oscillation. A simulation of the ESS beam with the BERT-HP physics list gives a ratio , after requiring the interaction to happen during the beam spill time window.The number of background events due to intrinsic beam component assuming a 25% systematic uncertainty is then given by:
| (25) | ||||
where:
-
•
cm2 is the flux-averaged cross section for the IBD process on proton KARMEN:2002zcm ;
-
•
cm2 is the flux-averaged cross section for the IBD process on carbon KARMEN:2002zcm .
This is an irreducible background which needs to be precisely assessed with a detailed simulation of the ESS beam.
Cosmic-ray backgrounds
Although steady-state backgrounds can be precisely quantified during beam-off periods, it is important to suppress them as much as possible to avoid losing signal sensitivity. Cosmic rays can be efficiently vetoed by scintillator panels surrounding the detectors, as in the KARMEN experiment Eitel:2000by , or by an outer layer of liquid scintillator equipped with PMTs, which is the solution chosen by the JSNS2 experiment JSNS2:2021hyk . The main background caused by cosmic rays is represented by cosmic neutrons entering the detector, which can’t be vetoed, and by fast neutrons produced by cosmic muons impinging on the materials surrounding the detector. These neutrons can enter the detector, recoil the protons being thermalized, and finally be captured, emitting 8 MeV gammas. They can mimic both the prompt signal (with the recoil proton) and the delayed coincidence (with the neutron absorption). They represent the dominant background of the JSNS2 experiment Maruyama:2022juu .
A CORSIKA simulation Heck:1998vt of the cosmic-ray rate at the ESS site gives a cosmic neutron rate in the detector of 5.8 Hz, assuming a 30 cm concrete roof. This rate can be reduced by a factor of after applying conservative selection cuts on the energy, time, and position of the event in the detector, which translates into events/spill.
A further reduction in the number of selected events can be obtained by applying particle identification (PID) techniques. The LSND collaboration pioneered a method which combines scintillation and Cherenkov light emissions and achieves a rejection factor of around 100 LSND:2001aii .
The JSNS2 collaboration has developed a pulse-shape discrimination algorithm by dissolving 10% Di-Isopropyl-Naphthalene (DIN) by weight into the liquid scintillator, achieving a 97.4% fast neutron rejection power Hino:2021uwz .
This is also a typical task that can be performed by machine learning algorithms. As an example, a convolutional neural network has been used to discriminate between neutrinoless double-beta decay events and cosmic spallation background in a liquid scintillator detector. The algorithm achieved 61.6% background rejection at 90% signal efficiency, without using vertex or energy reconstruction Li:2018rzw .
A Geant4 simulation of the SHiNESS detector shows that a further reduction of a factor of 2 can be achieved by surrounding the steel tank with a layer of 20 cm of paraffin. Thus, assuming a paraffin shield and a conservative PID rejection factor of 20, the rate of the cosmic-induced neutron background during beam-on periods is events/year and in any case can be precisely quantified during beam-off periods. This background must be multiplied by a factor of 2 for the CC search, given the extended time window.
Accidental backgrounds
The detection of both the IBD and CC events relies on the detection of a prompt signal and a delayed coincidence. Several background processes, described below, can mimic at least one of the two. The accidental rate will be given by the sum of the prompt-like background rates multiplied by the sum of the delayed-like background rates, with the same procedure described in ref. JSNS2:2013jdh .
beam interactions
The intrinsic beam component, described in section 5.1, can contribute to the accidental background when the prompt or the delayed signal is not detected. This translates into irreducible prompt and delayed accidental rates of for the IBD channel. The IBD positron can also mimic the electron of the CC channel.
Cosmic rays
The cosmic-ray background, described in detail in section 5.1, can contribute to the accidental background when the prompt recoil proton or the captured neutron is not detected. This corresponds to a small prompt and delayed accidental rate of () events/spill for IBD (CC) events.
Charged-current interactions
The charged-current channel of eq. (17) can represent a background for the IBD channel search. The emitted promptly can mimic the IBD and the delayed beta decay can fake the neutron absorption. Given the long lifetime of (15.8 ms), the probability of detecting both the and the during the beam spill and within the IBD time window (around \unit\micro) can be considered negligible. However, they both contribute to the a prompt accidental rate of events/spill and a delayed accidental rate of events/spill. The can also interact with the carbon atom via , which does not beta decay and contributes only to a prompt accidental rate of events/spill. This background could be eventually suppressed by the topological capabilities of the detector, which permit to distinguish point-like events (such as electrons) from multi-site events (such as photons) in the material Wonsak:2019lqq ; Dunger:2019dfo .
Neutron beam component
Low-energy neutrons (tens of MeV) produced by the beam can be absorbed by the Gd atoms, emitting 8 MeV , mimicking neutron absorption from IBD events. The proposal of detecting CENS at the ESS Baxter:2019mcx requires a POT-coincident flux of less than neutrons/cm2 s. With this same requirement, and assuming 0.1% Gd mass concentration, this flux produces an accidental rate in the detector of events/spill after applying preliminary selection cuts. However, detailed simulations will be useful to confirm the feasibility of this requirement in the detector location. A dedicated measurement might also be necessary to quantify this component: the JSNS2 collaboration used a 1-ton scintillator detector to precisely assess the neutron rate at J-PARC JSNS2:2013jdh .
Gamma beam component
Neutrons produced by the beam can be captured in the materials surrounding the detector, producing gamma particles. A fraction of these gammas can eventually enter the detector and mimic a delayed signal in both the IBD and the CC channels. In order to precisely quantify this background, a detailed simulation of the ESS beam and of the experimental hall is necessary. A preliminary result gives a rate of beam-induced gamma of events/spill after event selection.
Accidental background rates for IBD and CC channels are summarized in table 2. A conservative cut on the spatial distance between the prompt and the delayed signal can achieve an accidental background rejection power of 90%, as shown in figure 5. With this assumption, the accidental background rate is events/year for the IBD channel and events/year for the CC channel, assuming a 10% systematic uncertainty.
| Channel | Background |
|
|
||||
|---|---|---|---|---|---|---|---|
| IBD | Cosmic rays | ||||||
| beam | |||||||
| - | |||||||
| Beam neutrons | - | ||||||
| Beam gammas | - | ||||||
| Total | |||||||
| CC | Cosmic rays | ||||||
| beam | - | ||||||
| - | |||||||
| Beam gammas | - | ||||||
| Total |
5.2 Backgrounds to HNL decay
HNL candidate events are selected by requiring the presence of two leptons originating from the same vertex. In order to obtain an estimate of the background for these events in the experiment, we require the detection of two separate signals in the photosensors within a time window of 100 ns, which makes the accidental background negligible. A primitive lepton-finding reconstruction algorithm has been implemented. The energy of the two signals is required to be above 17 MeV and the angle between the two reconstructed direction must be larger than 15∘. Assuming these requirements, the main backgrounds for HNL events are detailed below.
Cosmic-ray background
Cosmic muons can produce radioactive isotopes by spallation on the matter surroundings the detector. These muons do not necessarily pass through the veto, so they can’t be tagged. The 17 MeV cut removes the vast majority of these products. The remaining events, misreconstructed as two separate leptons, give a background rate of events/year for the HNL search.
Charged-current interactions
The interaction of a with the carbon atom can produce nitrogen atoms in excited states, through the interaction. Most of these states decay by prompt proton emission to 11C, which in turn emit gammas between 2 MeV and 7 MeV LSND:2001fbw . The 17 MeV cut, coupled with the good energy resolution of the detector, is able to reject essentially all these events and this component is considered negligible. However, the outgoing electron can be misreconstructed as two separate leptons, when the gammas or the delayed beta decay are not detected, giving a background contribution of events/year.
Neutral-current interactions
The neutral current interaction between all three neutrino types and carbon atoms, detailed in section 4.1.3, produce a 15.11 MeV gamma, which could be misreconstructed as two distinct leptons. The vast majority of these events is rejected by the 18 MeV cut and a preliminary simulation gives a background rate for this component of events/year.
beam component
The intrinsic beam component can represent a background also for the HNL search when the delayed neutron is not detected and the positron is misreconstructed as two distinct leptons. This component gives a background of events/year.
Given the large uncertainties regarding the reconstruction algorithm and the need for a detailed simulation of the beam gammas and cosmic-ray component, we assign a systematic uncertainty of 50% to the total HNL background. Thus, the HNL sensitivity calculation of section 6.3 assumes a background of events/year.
6 Results
This section presents our results for the expected sensitivity of SHiNESS for the three scenarios outlined in section 3.
6.1 Non-unitarity
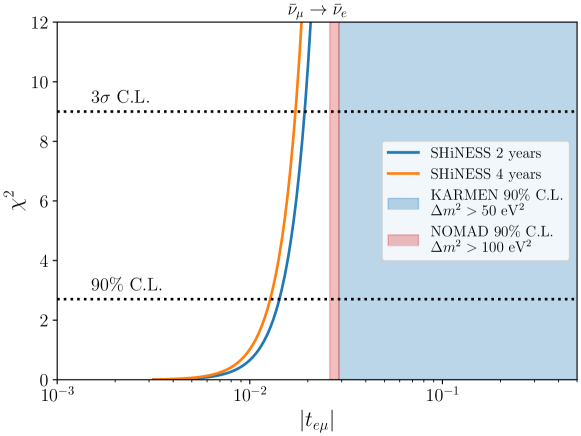
As outlined in section 3.1, SHiNESS is expected to be sensitive to the closure of the unitarity triangle in the sector, parametrized by in eq. (4). In order to determine the attainable sensitivity, we perform a binned analysis of the expected number of IBD interactions. Specifically, we define a Gaussian as:
| (26) |
where the sum extends over all energy bins. Here, we assume the experiment will observe a number of events consistent with the expected IBD interactions from the intrinsic beam component, calculated in eq. (25), plus the steady-state background contribution. In presence of non-unitarity effects, the expected number of events in each bin is obtained as
| (27) |
where are the nuisance parameters associated to the signal and the beam component-normalization, while we assume that uncertainties on the steady-state background are negligible as it can be characterized using beam-off data. This implies that the steady-state background contributions cancel in the numerator of eq. (26) and only contribute to the statistical error in the denominator: . Finally, is the systematic uncertainty on the normalization, while is the systematic uncertainty on the beam component. The minimum of the is found after minimizing eq. 26 with respect to the nuisance parameters .
Our results are shown in figure 14 for 2 and 4 years of data taking by the blue and orange lines, respectively. As can be seen from the comparison between the blue and orange lines, the improvement obtained by doubling the data taking period is limited by the systematic uncertainties. For comparison, we also show limits on this parameter obtained from the averaged-out region of light sterile neutrino searches at short-baseline neutrino experiments (see the discussion in refs. Blennow:2016jkn ; Coloma:2021uhq ), using the relation
| (28) |
Our results indicate that SHiNESS can significantly improve the limits provided by KARMEN KARMEN:2002zcm and NOMAD NOMAD:2003mqg , indicated by the shaded regions.
6.2 Light sterile neutrinos
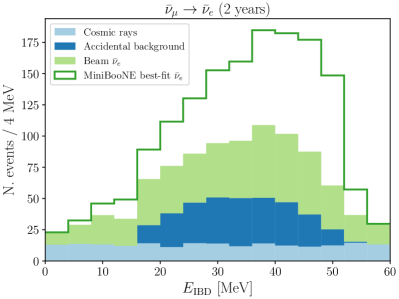
The search for appearance at spallation sources to look for light sterile neutrinos is not a novel concept: it has been already performed by the KARMEN experiment at the ISIS facility KARMEN:2002zcm , was proposed by the OscSNS collaboration at the SNS OscSNS:2013vwh , and is currently being carried out by the JSNS2 collaboration at J-PARC JSNS2:2013jdh . However, the ESS beam will provide a neutrino flux around 1 order of magnitude larger than J-PARC and SNS, allowing a competitive sensitivity in this channel with a relatively small detector (42 ton for SHiNESS, compared to the 450 ton of OscSNS). Using eq. (8) and assuming the MiniBooNE best-fit point at MiniBooNE:2020pnu gives a flux-averaged appearance probability of 0.21% at SHiNESS location. We can multiply this probability by the number of interactions expected with 100% transmutation of eq. (16), obtaining an appearance signal of events/year. Signal and background events for this channel and 2 calendar years of data taking are summarized in the first row of table 3. Figure 15 shows the reconstructed energy distribution for candidate events (left panel), assuming a energy resolution.
 |
 |
|
Signal | Background | |||
|---|---|---|---|---|---|
|
beam | ||||
| Cosmic rays | |||||
| Accidental | |||||
| Total | |||||
|
Unoscillated | ||||
| Cosmic rays | |||||
| Accidental | |||||
| Total |
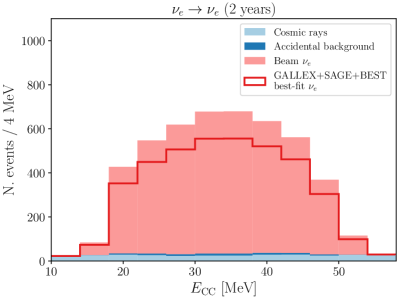
The SHiNESS experiment also has the ability to probe disappearance at a short baselines, which is the channel of both the gallium and the reactor antineutrino anomaly. The best-fit point given by a combined analysis of the BEST, SAGE, and GALLEX results occurs at Barinov:2021mjj . Inserting this value into eq. (7) gives a flux-averaged disappearance probability of 19.1% at SHiNESS baseline. We can multiply this probability by the number of interactions of eq. (17), obtaining a disappearance signal (thus a deficit of events) of events/year. Signal and background events for this channel and 2 calendar years of data taking are summarized in the second row of table 3. The right panel in figure 15 shows the reconstructed energy distribution for candidate events, assuming a energy resolution.
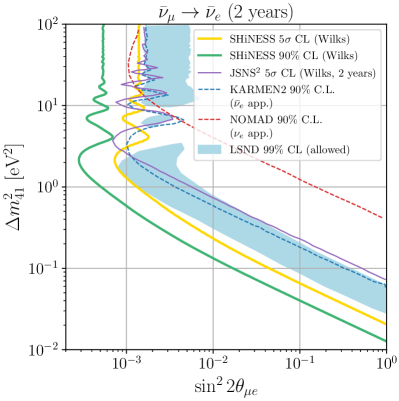
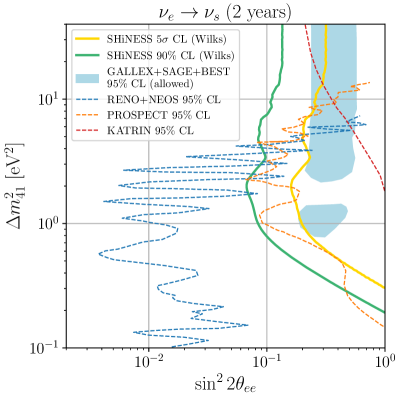
The sensitivity of SHiNESS to light neutrino oscillations is shown in figure 16, computed using a analysis analogous to the one of eq. (26). Results are shown separately for oscillation searches in the appearance (left) and disappearance (right) channels. As shown in the left panel, the SHiNESS experiment is able to fully cover the LNSD 99% C.L allowed region at a level, in a region complementary to the one covered by the JSNS2 experiment JSNS2:2013jdh . As for the search in the disappearance channel, our results indicate that SHiNESS can cover almost entirely the region allowed by a GALLEX+SAGE+BEST combined analysis with a sensitivity better than , allowing to definitely rule out the (3+1) light sterile neutrino explanation for the gallium anomaly with an independent measurement. Also, as can be seen in both panels, in the limit of large mass-squared splittings the averaged-out oscillations translate into a flat sensitivity. It is easy to check that, once the corresponding value of the mixing angle is mapped onto a unitarity constraint as outlined in refs. Blennow:2016jkn ; Coloma:2021uhq , the results in section 3.1 are correctly recovered, as expected.
We finish this section with a remark regarding the validity of the sensitivity limits shown in figure 16. In our calculations, the test statistics is assumed to be distributed according to a with 2 degrees of freedom, assuming Wilks’ theorem holds. Although this is a common approach in the literature, it has been shown Agostini:2019jup ; Giunti:2020uhv ; PROSPECT:2020raz ; Coloma:2020ajw ; Berryman:2021yan that the actual distribution typically differs from a distribution, since the conditions needed to apply Wilks’ theorem are violated for sterile neutrino oscillation searches. Therefore our results should only be regarded as indicative of an approximate value for the attainable sensitivity. An accurate result requires proper evaluation through Monte Carlo simulation: this falls beyond the scope of this article and is left for future work.
 |
 |
6.3 Heavy neutral leptons
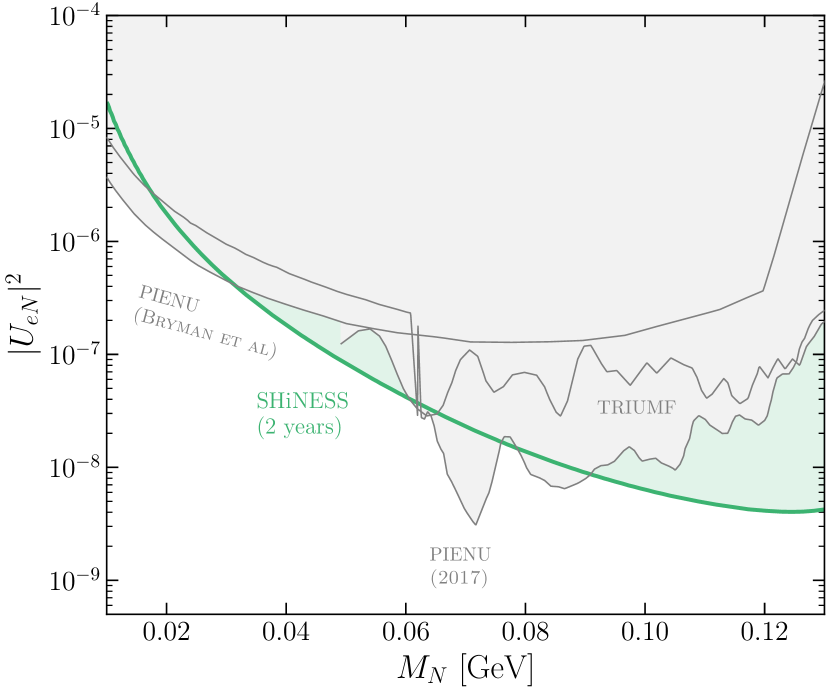
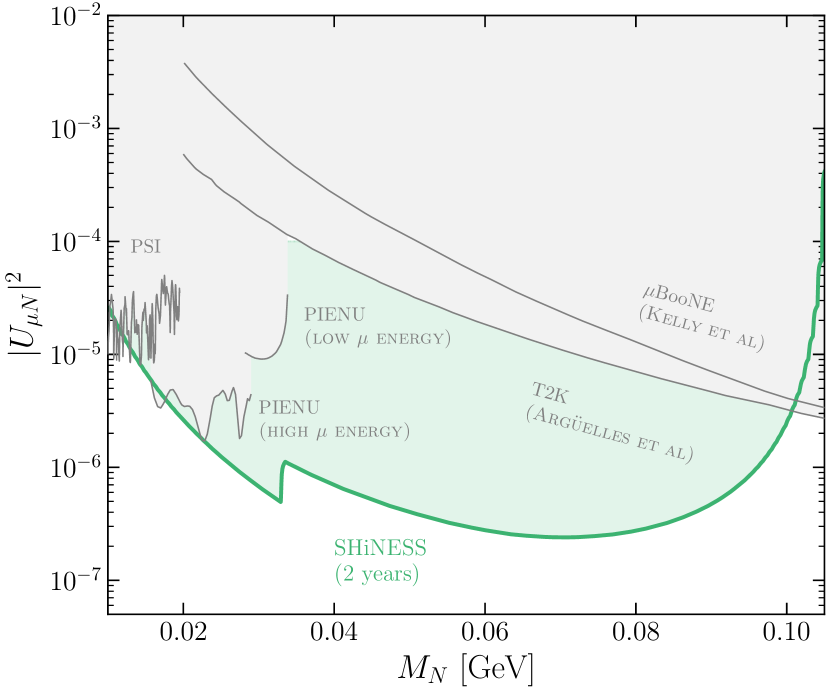
Figure 17 shows the sensitivity at 90% C.L. for electron and muon mixing in the left and right panels, respectively. In this case, the sensitivity has been computed using just the total rates (unbinned ) for the signal (see section 4.2) and backgrounds (see section 5.2), assuming a 50% systematic uncertainty on the background. Within the considered mass range, our results indicate that SHiNESS can set world-leading constraints in both cases, improving over current limits by over an order of magnitude in a sizable region of the parameter space.
7 Summary and conclusions
The existence of neutrino masses is irrefutable, and requires the extension of the particle content of the Standard Model (SM). Such extension may lead to additional consequences, including an apparent non-unitary mixing matrix in the active neutrino sector, anomalous oscillations at short-baselines, or even the decay signals of heavy neutral leptons that interact with the visible sector through their mixing with the SM neutrinos.
The ESS provides an exceptional opportunity to carry out neutrino experiments at the edge of the intensity frontier, and to pursue new physics signals. The facility will provide the most intense source of DAR neutrinos in the world, with one order of magnitude improvement with respect to current facilities. Here we propose to carry out a new experiment, SHiNESS, and highlight the novel opportunities it offers to explore the existence of new physics in the neutrino sector.
The experiment will be able to collect a high-statistics sample of neutrino interactions with only two calendar years of full-power beam. The baseline detector design includes a tank filled with 42 ton of liquid scintillator whose light is detected by large-area PMTs and LAPPDs. Liquid scintillators are a low-risk, proven technology with a solid track record in particle physics. The introduction of LAPPDs allows to separate the Cherenkov light from the scintillation light and enables the reconstruction of topological features. A possible alternative is represented by water-based liquid scintillators, which have the potential to improve the background-rejection capabilities of the experiment. The proposed detector could also operate as a neutrino flux monitor for the proposed CENS detection experiments Baxter:2019mcx and represents a perfect fit for the rich ESS particle physics program Abele:2022iml .
We have identified a potential location for the detector at about 25 m from the beam target (see figure 4). The detector could eventually be replicated at a different baseline in order to further reduce flux systematic uncertainties, as done by the JSNS2 collaboration with the JSNS2-II detector Maruyama:2022juu .
To illustrate its physics potential, we have computed the expected sensitivities for three well-motivated examples of new physics in the neutrino sector, as outlined above: searches for a non-unitary leptonic mixing matrix (summarized in figure 14), for anomalous oscillations induced by a sterile neutrino at the eV scale (see figure 16), and decay signals of heavy neutral leptons with masses above the MeV scale (shown in figure 17). In all three cases considered, we find that the SHiNESS experiment would be able to improve significantly over current constraints, targeting unexplored regions of the parameter space. A notebook has also been made available online, which allows to reproduce the sensitivities and energy spectra of the channels used for our oscillation analysis binder .
The timing of this proposal is timely and appropriate, as the ESS user program is expected to start in 2025. The search for light sterile neutrinos has spurred a very active physics program in several laboratories worldwide. At the same time, the renewed interest in heavy neutral leptons at the MeV-GeV scale has triggered an intense activity in the field. In this sense we underscore the short timescale of the proposed experiment, which could deliver results in a very short period of time. To begin with, the SHiNESS detector could start acquiring data as soon as the beam turns on, and does not require any beamline upgrade or modification. Moreover, thanks to the intensity of the ESS beam, SHiNESS has the capability to reach competitive sensitivities for several new physics scenarios in a couple of years of data taking.
Acknowledgements.
The authors are thankful to R. Castillo Fernandez, P. Ferrario, P. Huber, J. Martín-Albo, F. Monrabal, P. Novella, M. Sorel, and D. Zerzion for the precious suggestions. SRS acknowledges the support of a fellowship from “la Caixa Foundation” (ID 100010434) with code LCF/BQ/PI22/11910019 and of the Severo Ochoa Program grant CEX2018-000867-S. This work has received partial support from the European Union’s Horizon 2020 Research and Innovation Programme under the Marie Sklodowska-Curie grant agreement no. 860881-HIDDeN and the Marie Sklodowska-Curie Staff Exchange grant agreement no. 101086085–ASYMMETRY. PC acknowledges financial support by grant RYC2018-024240-I, funded by MCIN/AEI/10.13039/501100011033 and by “ESF Investing in your future”. She is also supported by the Spanish Research Agency (Agencia Estatal de Investigación) through the grant IFT Centro de Excelencia Severo Ochoa no. CEX2020-001007-S funded by MCIN/AEI/10.13039/501100011033/, and by Grant PID2022-142545NB-C21, funded by MCIN/AEI/10.13039/501100011033/ FEDER, UE.References
- (1) Super-Kamiokande collaboration, Evidence for oscillation of atmospheric neutrinos, Phys. Rev. Lett. 81 (1998) 1562 [hep-ex/9807003].
- (2) SNO collaboration, Direct evidence for neutrino flavor transformation from neutral current interactions in the Sudbury Neutrino Observatory, Phys. Rev. Lett. 89 (2002) 011301 [nucl-ex/0204008].
- (3) KamLAND collaboration, Measurement of neutrino oscillation with KamLAND: Evidence of spectral distortion, Phys. Rev. Lett. 94 (2005) 081801 [hep-ex/0406035].
- (4) Daya Bay collaboration, Observation of electron-antineutrino disappearance at Daya Bay, Phys. Rev. Lett. 108 (2012) 171803 [1203.1669].
- (5) I. Esteban, M.C. Gonzalez-Garcia, M. Maltoni, T. Schwetz and A. Zhou, The fate of hints: updated global analysis of three-flavor neutrino oscillations, JHEP 09 (2020) 178 [2007.14792].
- (6) T2K collaboration, Improved constraints on neutrino mixing from the T2K experiment with protons on target, Phys. Rev. D 103 (2021) 112008 [2101.03779].
- (7) NOvA collaboration, Improved measurement of neutrino oscillation parameters by the NOvA experiment, Phys. Rev. D 106 (2022) 032004 [2108.08219].
- (8) DUNE collaboration, Long-Baseline Neutrino Facility (LBNF) and Deep Underground Neutrino Experiment (DUNE): Conceptual Design Report, Volume 2: The Physics Program for DUNE at LBNF, 1512.06148.
- (9) JUNO, Daya Bay collaboration, Optimization of the JUNO liquid scintillator composition using a Daya Bay antineutrino detector, Nucl. Instrum. Meth. A 988 (2021) 164823 [2007.00314].
- (10) K. Abe et al., Letter of Intent: The Hyper-Kamiokande Experiment — Detector Design and Physics Potential —, 1109.3262.
- (11) ALEPH, DELPHI, L3, OPAL, SLD, LEP Electroweak Working Group, SLD Electroweak Group, SLD Heavy Flavour Group collaboration, Precision electroweak measurements on the resonance, Phys. Rept. 427 (2006) 257 [hep-ex/0509008].
- (12) LSND collaboration, Evidence for neutrino oscillations from the observation of appearance in a beam, Phys. Rev. D 64 (2001) 112007 [hep-ex/0104049].
- (13) MiniBooNE collaboration, Updated MiniBooNE neutrino oscillation results with increased data and new background studies, Phys. Rev. D 103 (2021) 052002 [2006.16883].
- (14) J.N. Abdurashitov et al., Measurement of the response of a Ga solar neutrino experiment to neutrinos from an Ar-37 source, Phys. Rev. C 73 (2006) 045805 [nucl-ex/0512041].
- (15) GALLEX collaboration, First results from the Cr-51 neutrino source experiment with the GALLEX detector, Phys. Lett. B 342 (1995) 440.
- (16) V.V. Barinov et al., Results from the Baksan Experiment on Sterile Transitions (BEST), Phys. Rev. Lett. 128 (2022) 232501 [2109.11482].
- (17) M. Laveder, Unbound neutrino roadmaps, Nucl. Phys. B Proc. Suppl. 168 (2007) 344.
- (18) M.A. Acero, C. Giunti and M. Laveder, Limits on nu(e) and anti-nu(e) disappearance from Gallium and reactor experiments, Phys. Rev. D 78 (2008) 073009 [0711.4222].
- (19) C. Giunti and M. Laveder, Statistical Significance of the Gallium Anomaly, Phys. Rev. C 83 (2011) 065504 [1006.3244].
- (20) V.V. Barinov et al., Search for electron-neutrino transitions to sterile states in the BEST experiment, Phys. Rev. C 105 (2022) 065502 [2201.07364].
- (21) V. Barinov and D. Gorbunov, BEST impact on sterile neutrino hypothesis, Phys. Rev. D 105 (2022) L051703 [2109.14654].
- (22) J.M. Berryman, P. Coloma, P. Huber, T. Schwetz and A. Zhou, Statistical significance of the sterile-neutrino hypothesis in the context of reactor and gallium data, JHEP 02 (2022) 055 [2111.12530].
- (23) S.R. Elliott, V. Gavrin and W. Haxton, The Gallium Anomaly, 2306.03299.
- (24) V. Brdar, J. Gehrlein and J. Kopp, Towards resolving the gallium anomaly, JHEP 05 (2023) 143 [2303.05528].
- (25) S. Böser, C. Buck, C. Giunti, J. Lesgourgues, L. Ludhova, S. Mertens et al., Status of Light Sterile Neutrino Searches, Prog. Part. Nucl. Phys. 111 (2020) 103736 [1906.01739].
- (26) KARMEN collaboration, Upper limits for neutrino oscillations muon-anti-neutrino — electron-anti-neutrino from muon decay at rest, Phys. Rev. D 65 (2002) 112001 [hep-ex/0203021].
- (27) MicroBooNE collaboration, Search for an Excess of Electron Neutrino Interactions in MicroBooNE Using Multiple Final-State Topologies, Phys. Rev. Lett. 128 (2022) 241801 [2110.14054].
- (28) MiniBooNE, SciBooNE collaboration, Dual baseline search for muon antineutrino disappearance at , Phys. Rev. D 86 (2012) 052009 [1208.0322].
- (29) IceCube collaboration, Searches for Sterile Neutrinos with the IceCube Detector, Phys. Rev. Lett. 117 (2016) 071801 [1605.01990].
- (30) M. Dentler, A. Hernández-Cabezudo, J. Kopp, P.A.N. Machado, M. Maltoni, I. Martinez-Soler et al., Updated Global Analysis of Neutrino Oscillations in the Presence of eV-Scale Sterile Neutrinos, JHEP 08 (2018) 010 [1803.10661].
- (31) A. Diaz, C.A. Argüelles, G.H. Collin, J.M. Conrad and M.H. Shaevitz, Where Are We With Light Sterile Neutrinos?, Phys. Rept. 884 (2020) 1 [1906.00045].
- (32) J.M. Berryman and P. Huber, Reevaluating Reactor Antineutrino Anomalies with Updated Flux Predictions, Phys. Rev. D 101 (2020) 015008 [1909.09267].
- (33) M. Estienne et al., Updated Summation Model: An Improved Agreement with the Daya Bay Antineutrino Fluxes, Phys. Rev. Lett. 123 (2019) 022502 [1904.09358].
- (34) C. Giunti, Y.F. Li, C.A. Ternes and Z. Xin, Reactor antineutrino anomaly in light of recent flux model refinements, Phys. Lett. B 829 (2022) 137054 [2110.06820].
- (35) P. Langacker and D. London, Lepton Number Violation and Massless Nonorthogonal Neutrinos, Phys. Rev. D 38 (1988) 907.
- (36) S.M. Bilenky and C. Giunti, Seesaw type mixing and muon-neutrino — tau-neutrino oscillations, Phys. Lett. B 300 (1993) 137 [hep-ph/9211269].
- (37) S. Bergmann and A. Kagan, Z - induced FCNCs and their effects on neutrino oscillations, Nucl. Phys. B 538 (1999) 368 [hep-ph/9803305].
- (38) M. Czakon, J. Gluza and M. Zralek, Nonunitary neutrino mixing matrix and CP violating neutrino oscillations, Acta Phys. Polon. B 32 (2001) 3735 [hep-ph/0109245].
- (39) B. Bekman, J. Gluza, J. Holeczek, J. Syska and M. Zralek, Matter effects and CP violating neutrino oscillations with nondecoupling heavy neutrinos, Phys. Rev. D 66 (2002) 093004 [hep-ph/0207015].
- (40) S. Antusch, C. Biggio, E. Fernandez-Martinez, M.B. Gavela and J. Lopez-Pavon, Unitarity of the Leptonic Mixing Matrix, JHEP 10 (2006) 084 [hep-ph/0607020].
- (41) E. Fernandez-Martinez, M.B. Gavela, J. Lopez-Pavon and O. Yasuda, CP-violation from non-unitary leptonic mixing, Phys. Lett. B 649 (2007) 427 [hep-ph/0703098].
- (42) F.J. Escrihuela, D.V. Forero, O.G. Miranda, M. Tórtola and J.W.F. Valle, Probing CP violation with non-unitary mixing in long-baseline neutrino oscillation experiments: DUNE as a case study, New J. Phys. 19 (2017) 093005 [1612.07377].
- (43) M. Blennow, E. Fernández-Martínez, J. Hernández-García, J. López-Pavón, X. Marcano and D. Naredo-Tuero, Bounds on lepton non-unitarity and heavy neutrino mixing, JHEP 08 (2023) 030 [2306.01040].
- (44) S. Antusch and O. Fischer, Probing the nonunitarity of the leptonic mixing matrix at the CEPC, Int. J. Mod. Phys. A 31 (2016) 1644006 [1604.00208].
- (45) M. Blennow, P. Coloma, E. Fernandez-Martinez, J. Hernandez-Garcia and J. Lopez-Pavon, Non-Unitarity, sterile neutrinos, and Non-Standard neutrino Interactions, JHEP 04 (2017) 153 [1609.08637].
- (46) A.M. Abdullahi et al., The present and future status of heavy neutral leptons, J. Phys. G 50 (2023) 020501 [2203.08039].
- (47) C. Antel et al., Feebly Interacting Particles: FIPs 2022 workshop report, in Workshop on Feebly-Interacting Particles, 5, 2023 [2305.01715].
- (48) R. Garoby et al., The European Spallation Source Design, Phys. Scripta 93 (2018) 014001.
- (49) A. Alekou et al., The European Spallation Source neutrino super-beam conceptual design report, Eur. Phys. J. ST 231 (2022) 3779 [2206.01208].
- (50) M. Blennow, P. Coloma and E. Fernandez-Martinez, Searching for sterile neutrinos at the ESSSB, JHEP 12 (2014) 120 [1407.1317].
- (51) S. Kumar Agarwalla, S.S. Chatterjee and A. Palazzo, Physics potential of ESSSB in the presence of a light sterile neutrino, JHEP 12 (2019) 174 [1909.13746].
- (52) M. Ghosh, T. Ohlsson and S. Rosauro-Alcaraz, Sensitivity to light sterile neutrinos at ESSnuSB, JHEP 03 (2020) 026 [1912.10010].
- (53) D. Baxter et al., Coherent Elastic Neutrino-Nucleus Scattering at the European Spallation Source, JHEP 02 (2020) 123 [1911.00762].
- (54) M. Guthrie, Chapter 11 - high-pressure neutron science, in Neutron Scattering - Applications in Biology, Chemistry, and Materials Science, F. Fernandez-Alonso and D.L. Price, eds., vol. 49 of Experimental Methods in the Physical Sciences, pp. 637–681, Academic Press (2017), DOI.
- (55) H. Abele et al., Particle Physics at the European Spallation Source, Phys. Rept. 1023 (2023) 1 [2211.10396].
- (56) R.L. Burman and W.C. Louis, Neutrino physics at meson factories and spallation neutron sources, J. Phys. G 29 (2003) 2499.
- (57) GEANT4 collaboration, GEANT4–a simulation toolkit, Nucl. Instrum. Meth. A 506 (2003) 250.
- (58) A. Heikkinen, N. Stepanov and J.P. Wellisch, Bertini intranuclear cascade implementation in GEANT4, eConf C0303241 (2003) MOMT008 [nucl-th/0306008].
- (59) COHERENT collaboration, Simulating the neutrino flux from the Spallation Neutron Source for the COHERENT experiment, Phys. Rev. D 106 (2022) 032003 [2109.11049].
- (60) COHERENT collaboration, A D2O detector for flux normalization of a pion decay-at-rest neutrino source, JINST 16 (2021) P08048 [2104.09605].
- (61) J. Kopp, P.A.N. Machado, M. Maltoni and T. Schwetz, Sterile Neutrino Oscillations: The Global Picture, JHEP 05 (2013) 050 [1303.3011].
- (62) KARMEN collaboration, KARMEN: Neutrino physics at ISIS, Prog. Part. Nucl. Phys. 32 (1994) 351.
- (63) LSND collaboration, The Liquid scintillator neutrino detector and LAMPF neutrino source, Nucl. Instrum. Meth. A 388 (1997) 149 [nucl-ex/9605002].
- (64) JSNS2 collaboration, Proposal: A Search for Sterile Neutrino at J-PARC Materials and Life Science Experimental Facility, 1310.1437.
- (65) M. Barbi et al., Proposal for A Water Cherenkov Test Beam Experiment for Hyper-Kamiokande and Future Large-scale Water-based Detectors, CERN CERN-SPSC-2020-005; SPSC-P-365 (2020) .
- (66) W. Beriguete et al., Production of a gadolinium-loaded liquid scintillator for the Daya Bay reactor neutrino experiment, Nucl. Instrum. Meth. A 763 (2014) 82 [1402.6694].
- (67) SNO+ collaboration, Development, characterisation, and deployment of the SNO+ liquid scintillator, JINST 16 (2021) P05009 [2011.12924].
- (68) J.S. Park et al., Production and optical properties of Gd-loaded liquid scintillator for the RENO neutrino detector, Nucl. Instrum. Meth. A 707 (2013) 45.
- (69) Double Chooz collaboration, Double Chooz: A Search for the neutrino mixing angle theta(13), hep-ex/0606025.
- (70) C. Aberle, C. Buck, B. Gramlich, F.X. Hartmann, M. Lindner, S. Schonert et al., Large scale Gd-beta-diketonate based organic liquid scintillator production for antineutrino detection, JINST 7 (2012) P06008 [1112.5941].
- (71) G. Leinweber, D.P. Barry, M. Trbovich, J. Burke, N. Drindak, H. Knox et al., Neutron capture and total cross-section measurements and resonance parameters of gadolinium, Nuclear Science and Engineering 154 (2006) 261.
- (72) T. Tanaka et al., Gamma-ray spectra from thermal neutroncapture on gadolinium-155 and naturalgadolinium, PTEP 2020 (2020) 043D02 [1907.00788].
- (73) Hamamatsu, “PMT R12860.” https://www.hamamatsu.com/eu/en/product/optical-sensors/pmt/pmt_tube-alone/head-on-type/R12860.html, 2023.
- (74) I.M. Frank and I.E. Tamm, Coherent visible radiation of fast electrons passing through matter, Compt. Rend. Acad. Sci. URSS 14 (1937) 109.
- (75) M. Li, Z. Guo, M. Yeh, Z. Wang and S. Chen, Separation of Scintillation and Cherenkov Lights in Linear Alkyl Benzene, Nucl. Instrum. Meth. A 830 (2016) 303 [1511.09339].
- (76) T. Kaptanoglu, M. Luo and J. Klein, Cherenkov and Scintillation Light Separation Using Wavelength in LAB Based Liquid Scintillator, JINST 14 (2019) T05001 [1811.11587].
- (77) Incom, “LAPPD.” https://incomusa.com/lappd/, 2023.
- (78) A.V. Lyashenko et al., Performance of Large Area Picosecond Photo-Detectors (LAPPDTM), Nucl. Instrum. Meth. A 958 (2020) 162834 [1909.10399].
- (79) ANNIE collaboration, Accelerator Neutrino Neutron Interaction Experiment (ANNIE): Preliminary Results and Physics Phase Proposal, 1707.08222.
- (80) Z. Guo, M. Yeh, R. Zhang, D.-W. Cao, M. Qi, Z. Wang et al., Slow liquid scintillator candidates for mev-scale neutrino experiments, Astroparticle Physics 109 (2019) 33.
- (81) J.M. Conrad, W.C. Louis and M.H. Shaevitz, The LSND and MiniBooNE Oscillation Searches at High , Ann. Rev. Nucl. Part. Sci. 63 (2013) 45 [1306.6494].
- (82) JSNS2 collaboration, The JSNS2 detector, Nucl. Instrum. Meth. A 1014 (2021) 165742 [2104.13169].
- (83) KARMEN collaboration, Neutrino interactions with carbon: Recent measurements and a new test of electron-neutrino, anti-muon-neutrino universality, Phys. Lett. B 332 (1994) 251.
- (84) MicroBooNE collaboration, Design and construction of the MicroBooNE Cosmic Ray Tagger system, JINST 14 (2019) P04004 [1901.02862].
- (85) S.D. Biller, E.J. Leming and J.L. Paton, Slow fluors for effective separation of Cherenkov light in liquid scintillators, Nucl. Instrum. Meth. A 972 (2020) 164106 [2001.10825].
- (86) B.S. Wonsak, C.I. Hagner, D.A. Hellgartner, K. Loo, S. Lorenz, D.J. Meyhöfer et al., Topological track reconstruction in unsegmented, large-volume liquid scintillator detectors, JINST 13 (2018) P07005 [1803.08802].
- (87) C. Aberle, A. Elagin, H.J. Frisch, M. Wetstein and L. Winslow, Measuring Directionality in Double-Beta Decay and Neutrino Interactions with Kiloton-Scale Scintillation Detectors, JINST 9 (2014) P06012 [1307.5813].
- (88) J. Gruszko, B. Naranjo, B. Daniel, A. Elagin, D. Gooding, C. Grant et al., Detecting Cherenkov light from 1–2 MeV electrons in linear alkylbenzene, JINST 14 (2019) P02005 [1811.11144].
- (89) PlasmaChem, “Perovskite Pb-based quantum dots.” https://shop.plasmachem.com/perovskite-pbmex3-qds/195-327-perovskite-pb-based-quantum-dots-45015-nm.html, 2023.
- (90) Theia collaboration, THEIA: an advanced optical neutrino detector, Eur. Phys. J. C 80 (2020) 416 [1911.03501].
- (91) WATCHMAN collaboration, The Physics and Nuclear Nonproliferation Goals of WATCHMAN: A WAter CHerenkov Monitor for ANtineutrinos, 1502.01132.
- (92) J.R. Alonso et al., Advanced Scintillator Detector Concept (ASDC): A Concept Paper on the Physics Potential of Water-Based Liquid Scintillator, 1409.5864.
- (93) Particle Data Group collaboration, Review of Particle Physics, PTEP 2022 (2022) 083C01.
- (94) P. Minkowski, at a Rate of One Out of Muon Decays?, Phys. Lett. B 67 (1977) 421.
- (95) R.N. Mohapatra and G. Senjanovic, Neutrino Mass and Spontaneous Parity Nonconservation, Phys. Rev. Lett. 44 (1980) 912.
- (96) T. Yanagida, Horizontal gauge symmetry and masses of neutrinos, Conf. Proc. C 7902131 (1979) 95.
- (97) M. Gell-Mann, P. Ramond and R. Slansky, Complex Spinors and Unified Theories, Conf. Proc. C 790927 (1979) 315 [1306.4669].
- (98) S. Antusch and O. Fischer, Non-unitarity of the leptonic mixing matrix: Present bounds and future sensitivities, JHEP 10 (2014) 094 [1407.6607].
- (99) A.E. Nelson and J. Walsh, Short Baseline Neutrino Oscillations and a New Light Gauge Boson, Phys. Rev. D 77 (2008) 033001 [0711.1363].
- (100) Z.-z. Xing, Correlation between the Charged Current Interactions of Light and Heavy Majorana Neutrinos, Phys. Lett. B 660 (2008) 515 [0709.2220].
- (101) Z.-z. Xing, A full parametrization of the 6 X 6 flavor mixing matrix in the presence of three light or heavy sterile neutrinos, Phys. Rev. D 85 (2012) 013008 [1110.0083].
- (102) F.J. Escrihuela, D.V. Forero, O.G. Miranda, M. Tortola and J.W.F. Valle, On the description of nonunitary neutrino mixing, Phys. Rev. D 92 (2015) 053009 [1503.08879].
- (103) S. Parke and M. Ross-Lonergan, Unitarity and the three flavor neutrino mixing matrix, Phys. Rev. D 93 (2016) 113009 [1508.05095].
- (104) S.A.R. Ellis, K.J. Kelly and S.W. Li, Current and Future Neutrino Oscillation Constraints on Leptonic Unitarity, JHEP 12 (2020) 068 [2008.01088].
- (105) B. Dasgupta and J. Kopp, Sterile Neutrinos, Phys. Rept. 928 (2021) 1 [2106.05913].
- (106) P. Coloma, J. López-Pavón, S. Rosauro-Alcaraz and S. Urrea, New physics from oscillations at the DUNE near detector, and the role of systematic uncertainties, JHEP 08 (2021) 065 [2105.11466].
- (107) C.S. Fong, H. Minakata and H. Nunokawa, A framework for testing leptonic unitarity by neutrino oscillation experiments, JHEP 02 (2017) 114 [1609.08623].
- (108) C.S. Fong, H. Minakata and H. Nunokawa, Non-unitary evolution of neutrinos in matter and the leptonic unitarity test, JHEP 02 (2019) 015 [1712.02798].
- (109) E. Fernández-Martínez, M. González-López, J. Hernández-García, M. Hostert and J. López-Pavón, Effective portals to heavy neutral leptons, 2304.06772.
- (110) Y. Ema, Z. Liu, K.-F. Lyu and M. Pospelov, Heavy Neutral Leptons from Stopped Muons and Pions, JHEP 08 (2023) 169 [2306.07315].
- (111) D. Gorbunov and M. Shaposhnikov, How to find neutral leptons of the MSM?, JHEP 10 (2007) 015 [0705.1729].
- (112) A. Atre, T. Han, S. Pascoli and B. Zhang, The Search for Heavy Majorana Neutrinos, JHEP 05 (2009) 030 [0901.3589].
- (113) P. Vogel and J.F. Beacom, Angular distribution of neutron inverse beta decay, anti-neutrino(e) + p — e+ + n, Phys. Rev. D 60 (1999) 053003 [hep-ph/9903554].
- (114) E. Kolbe and K. Langanke, The Role of neutrino induced reactions on lead and iron in neutrino detectors, Phys. Rev. C 63 (2001) 025802 [nucl-th/0003060].
- (115) J.M. Conrad and M.H. Shaevitz, Limits on Electron Neutrino Disappearance from the KARMEN and LSND - Carbon Cross Section Data, Phys. Rev. D 85 (2012) 013017 [1106.5552].
- (116) LSND collaboration, Measurements of charged current reactions of nu(e) on 12-C, Phys. Rev. C 64 (2001) 065501 [hep-ex/0105068].
- (117) D.A. Krakauer et al., Experimental study of neutrino absorption on carbon, Phys. Rev. C 45 (1992) 2450.
- (118) E. Kolbe, K. Langanke and P. Vogel, Weak reactions on C-12 within the continuum random phase approximation with partial occupancies, Nucl. Phys. A 652 (1999) 91 [nucl-th/9903022].
- (119) E. Kolbe, K. Langanke and S. Krewald, Neutrino induced reactions on C-12 within the continuum random phase approximation, Phys. Rev. C 49 (1994) 1122.
- (120) KARMEN collaboration, Neutrino interactions with carbon, Nucl. Phys. B Proc. Suppl. 38 (1995) 198.
- (121) KARMEN collaboration, Measurement of the weak neutral current excitation C-12(nu(mu) nu’(mu))C*-12(1+,1,15.1-MeV) at E(nu(mu)) = 29.8-MeV, Phys. Lett. B 423 (1998) 15.
- (122) KARMEN collaboration, Latest results of the KARMEN2 experiment, Nucl. Phys. B Proc. Suppl. 91 (2001) 191 [hep-ex/0008002].
- (123) JSNS2, JSNS2 -II, collaboration, The status of JSNS2 and JSNS2-II, PoS NuFact2021 (2022) 159.
- (124) D. Heck, J. Knapp, J.N. Capdevielle, G. Schatz and T. Thouw, CORSIKA: A Monte Carlo code to simulate extensive air showers, .
- (125) Y. Hino et al., Characterization of the correlated background for a sterile neutrino search using the first dataset of the JSNS2 experiment, Eur. Phys. J. C 82 (2022) 331 [2111.07482].
- (126) A. Li, A. Elagin, S. Fraker, C. Grant and L. Winslow, Suppression of Cosmic Muon Spallation Backgrounds in Liquid Scintillator Detectors Using Convolutional Neural Networks, Nucl. Instrum. Meth. A 947 (2019) 162604 [1812.02906].
- (127) B.S. Wonsak, C. Hagner, D. Meyhöfer, H. Rebber and S. Lorenz, 3D topological reconstruction in liquid scintillator detectors, in Proceedings, 5th International Solar Neutrino Conference: Dresden, Germany, June 11-14, 2018, M. Meyer and K. Zuber, eds., pp. 445–463 (2019), DOI.
- (128) J. Dunger and S.D. Biller, Multi-site Event Discrimination in Large Liquid Scintillation Detectors, Nucl. Instrum. Meth. A 943 (2019) 162420 [1904.00440].
- (129) NOMAD collaboration, Search for nu(mu) — nu(e) oscillations in the NOMAD experiment, Phys. Lett. B 570 (2003) 19 [hep-ex/0306037].
- (130) OscSNS collaboration, The OscSNS White Paper, in Community Summer Study 2013: Snowmass on the Mississippi, 7, 2013 [1307.7097].
- (131) M. Agostini and B. Neumair, Statistical Methods Applied to the Search of Sterile Neutrinos, Eur. Phys. J. C 80 (2020) 750 [1906.11854].
- (132) C. Giunti, Statistical Significance of Reactor Antineutrino Active-Sterile Oscillations, Phys. Rev. D 101 (2020) 095025 [2004.07577].
- (133) PROSPECT, STEREO collaboration, Note on arXiv:2005.05301, ’Preparation of the Neutrino-4 experiment on search for sterile neutrino and the obtained results of measurements’, 2006.13147.
- (134) P. Coloma, P. Huber and T. Schwetz, Statistical interpretation of sterile neutrino oscillation searches at reactors, Eur. Phys. J. C 81 (2021) 2 [2008.06083].
- (135) RENO, NEOS collaboration, Search for sterile neutrino oscillations using RENO and NEOS data, Phys. Rev. D 105 (2022) L111101 [2011.00896].
- (136) PROSPECT collaboration, Improved short-baseline neutrino oscillation search and energy spectrum measurement with the PROSPECT experiment at HFIR, Phys. Rev. D 103 (2021) 032001 [2006.11210].
- (137) KATRIN collaboration, Improved eV-scale sterile-neutrino constraints from the second KATRIN measurement campaign, Phys. Rev. D 105 (2022) 072004 [2201.11593].
- (138) M. Daum, B. Jost, R.M. Marshall, R.C. Minehart, W.A. Stephens and K.O.H. Ziock, Search for Admixtures of Massive Neutrinos in the Decay Neutrino, Phys. Rev. D 36 (1987) 2624.
- (139) PIENU collaboration, Improved search for heavy neutrinos in the decay , Phys. Rev. D 97 (2018) 072012 [1712.03275].
- (140) PIENU collaboration, Search for heavy neutrinos in decay, Phys. Lett. B 798 (2019) 134980 [1904.03269].
- (141) D.A. Bryman and R. Shrock, Constraints on Sterile Neutrinos in the MeV to GeV Mass Range, Phys. Rev. D 100 (2019) 073011 [1909.11198].
- (142) D.I. Britton et al., Improved search for massive neutrinos in pi+ — e+ neutrino decay, Phys. Rev. D 46 (1992) R885.
- (143) C.A. Argüelles, N. Foppiani and M. Hostert, Heavy neutral leptons below the kaon mass at hodoscopic neutrino detectors, Phys. Rev. D 105 (2022) 095006 [2109.03831].
- (144) MicroBooNE collaboration, Search for a Higgs Portal Scalar Decaying to Electron-Positron Pairs in the MicroBooNE Detector, Phys. Rev. Lett. 127 (2021) 151803 [2106.00568].
- (145) S.R. Soleti, “SHiNESS sensitivity notebook.” https://mybinder.org/v2/gh/soleti/shoess.git/HEAD?labpath=sensitivity_widget.ipynb, 2023.