AI-predicted protein deformation encodes energy landscape perturbation
Abstract
AI algorithms proved excellent predictors of protein structure, but whether their exceptional accuracy is merely due to megascale regression or these algorithms learn the underlying physics remains an open question. Here, we perform a stringent test for the existence of such learning in the Alphafold2 (AF) algorithm: We use AF to predict the subtle structural deformation induced by single mutations, quantified by strain, and compare with experimental datasets of corresponding perturbations in folding free energy . Unexpectedly, we find that physical strain alone – without any additional data or computation – correlates almost as well with as state-of-the-art energy-based and machine-learning predictors. This indicates that the AF-predicted structures alone encode fine details about the energy landscape. In particular, the structures encode significant information on stability, enough to estimate (de-)stabilizing effects of mutations, thus paving the way for the development of novel, structure-based stability predictors for protein design and evolution.
AI has ushered in a revolution in structural biology, yet we are still in uncharted waters [1, 2]. In particular, it is not clear whether AI algorithms that predict protein structure from sequence, such as Alphafold (AF) [3] or RoseTTaFold [4], owe their unprecedented accuracy to highly sophisticated pattern recognition or these algorithms can capture some of the many-body physics underlying protein folding. Recent studies provide extensive evidence suggesting that AF has learned an effective energy functional that is searched in order to accurately predict the native structure [5], even if it includes uncommon structural motifs [6].
An ultimate test for whether an AI algorithm has learned the actual physical energy landscape would be the capacity to probe, from the predicted structure alone, changes in the thermodynamic free energy () due to single mutations. This would strongly indicate that the predicted structure encodes fine details about the physical energy landscape. Besides this fundamental interest, such capacity may be impactful in applications: Of particular importance for protein design and evolution is the ability to predict whether a given protein sequence will lead to a stably-folded structure [3, 4]. AF has been reported to predict folded structures for proteins that are not stable [7, 8, 9]. Despite this, some analyses suggest that AF and RoseTTTaFold can be used for predicting stability changes upon mutation [7, 10, 11, 12, 13]. All this motivates us to systematically investigate here the question of whether AI-predicted structures can be used to infer changes to free energy landscapes.
To this end, we study a curated subset of measurements of stability change () due to single mutations, taken from ThermoMutDB (TMDB) [14]. We find that a simple general measure of deformation upon mutation – effective strain – correlates well with . We show it is essential to average over an ensemble of multiple AF-predicted structures to get precise estimates of strain due to mutation, and that most of the relevant information is gleaned from the residues within of the mutated residue. Our initial motivation was to examine whether the AF structures encode any information about stability. Surprisingly, we found that correlations between strain and compare well against those obtained using state-of-the-art predictors, suggesting that AF predictions are highly informative of stability changes. We propose that new energy-based force fields can be developed that may provide a mechanistic understanding of the effects of mutations on stability. Such a development would settle the question of whether AI algorithms have truly learned the physics of protein folding [5, 6].
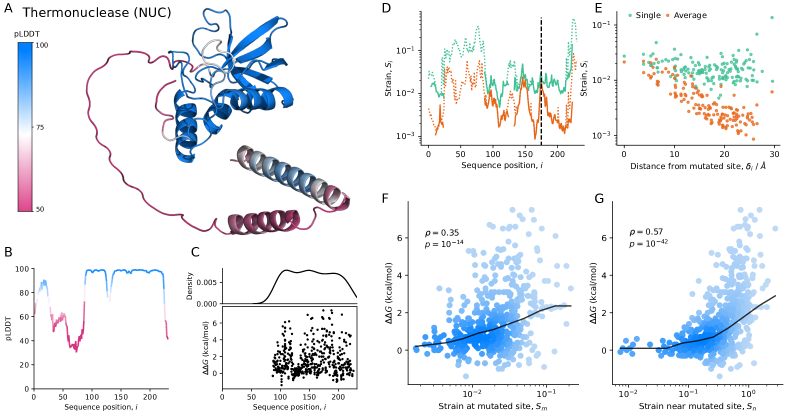
Strain correlates with in Thermonuclease.— We first examine thermonuclease (NUC, Uniprot ID, P00644; staphylococbus aureus) – the protein that has the highest number of mutants in TMDB ( after applying controls, Appendix A). NUC consists of a folded region (starting around K88) and an extended disordered region near the N-terminus (Fig. 1A), indicated by the low pLDDT (AF-predicted confidence score) values (Fig. 1A-B). The NUC mutants are all sampled from the folded domain (Fig. 1C). Note that we define such that an increase in upon mutation is destabilizing.
To measure deformation, we calculate effective strain (ES; Appendix B) per residue, , between wild-type (WT) and mutant structures predicted by AF (Fig. 1D). Disordered residues always show high ES (Fig. 1D, dotted lines) due to prediction noise, regardless of mutations [7]. We therefore exclude residues whose pLDDT from the ES calculations (Fig. 1D, solid lines). Even without disordered residues, if we only compare two static structures (Fig. 1D-E, orange), we still see residual ES in regions far from the mutated site. This occurs since regions in proteins with high flexibility tend to have high variability across repeat AF predictions (Supplementary Material (SM) Fig. 1). To achieve a more accurate estimate of deformation due to mutation, we calculate deformation using ‘averaged’ AF structures (Appendix B) [7]. This drastically reduces ES in most regions (which originates chiefly from noise and fluctuations), except for regions near the mutated site (Fig. 1D-E, blue).
Using this more precise measure of deformation due to mutation, we find a significant correlation (Spearman’s ) between strain at the mutated site and change in stability (Fig. 1F).
This correlation is even higher (Spearman’s ) when calculating the sum of strain over all residues within a spherical neighborhood of radius around the mutated site, (Fig. 1G).
See SM Fig. 2 for similar analyses without excluding low pLDDT residues and without using average structures. Our rationale for choosing will become clear in the following section. For now, we highlight that, in this particular example (NUC) it appears that AF-predicted deformation correlates quite well with empirical measurements of changes in stability.
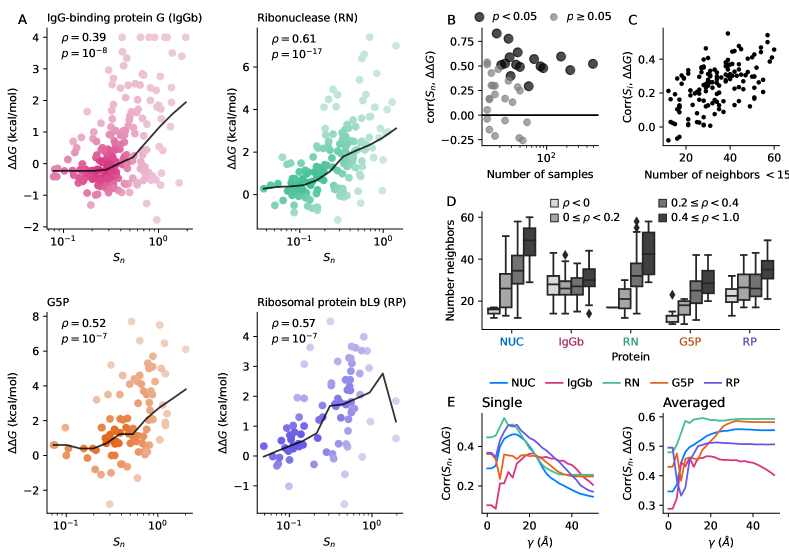
Strain correlates with within protein families.—
We expand our analysis of NUC to more protein families, again focusing on the families that have the highest coverage in TMDB.
For the second-to-fifth most common proteins, we find correlations between stability change and local deformation ranging from (Fig. 2A).
Extending this analysis to the 40 most common proteins reveals that there are insufficient samples to show significant strain-stability correlations in most cases.
Nevertheless, in the 16 correlations that are statistically significant, the average Spearman’s is (Fig. 2B) with an overall range .
We see that for all cases with sufficient data, there appears to be a consistent correlation between strain and changes in stability.
Determinants of strain-stability correlation.— To better understand why strain is correlated with changes in stability, we examine the correlations between strain at individual residues (not necessarily the mutated ones) and , and compare this with the number of neighbors within of each residue . For NUC, we find that mutations in buried regions tend to have an outsize impact on stability (Fig. 2C), as expected, given the standard paradigm of buried residues having low mutation rates [15]. In general one expects mutations of buried residues to affect more bonds and therefore inflict larger stability changes. Indeed, across the five most common proteins in the TMDB, we see a clear trend whereby the residues with the highest strain-stability correlations are amongst the most buried within that protein (Fig. 2D). This suggests that correlates with because summing in a neighborhood of most probably includes the contributions of one or a few of these buried residues.
Evidently, when only a few points are sampled, the resulting correlation is not particularly informative. Also, in a large protein, more points are needed to achieve sufficient sampling.
This is demonstrated most clearly in IgG-binding protein G (IgGb, P06654): this protein has a length , so even though we have samples, many buried residues do not correlate with stability changes;
many regions have no mutations sampled from them, so deformation remains low no matter how buried the residues are.
Further complication arises from the abundance of disordered regions (SM Fig. 3) in which AF appears to have little
capacity to predict mutation effects, while well-folded regions are small. As a result, for IgGB the link between number of neighbors and effect on stability is weak.
This case highlights the need for a nuanced approach to understanding the relationship between strain and changes in stability.
How many residues are affected by mutations in a way that impacts stability?—
When we compare pairs of single AF-predicted structures, which exhibit significant noise unrelated to mutations (SM Fig. 1), we find maximal strain-stability correlations when counting neighbors within (Fig. 2E).
For residues further than , we can consider strain to have little information pertaining , and their inclusion decreases the correlation due to noise.
Likewise, when we compare pairs of averaged structures, we find that correlations increase up to about and then plateau (Fig. 2E). The correlations of the averaged pairs do not decrease significantly with increasing since averaging filters out much of the noise.
This demonstrates that even after increasing the precision of the prediction of mutation effects, there tends to be little additional information beyond ;
although this does not preclude the possibility of long-ranged
mutation effects, as in allosteric communication.
The reason why correlations continue to increase with up to is perhaps due to the typical size of folded domains; we find that across all proteins studied here, the most buried (and hence key to stability) residue is on average from any residue (SM Fig. 4). Thus, we need to consider up to to find the most informative residues on average, and beyond this distance, the mutation effects are too weak to add extra information; on the contrary, they mainly add noise.
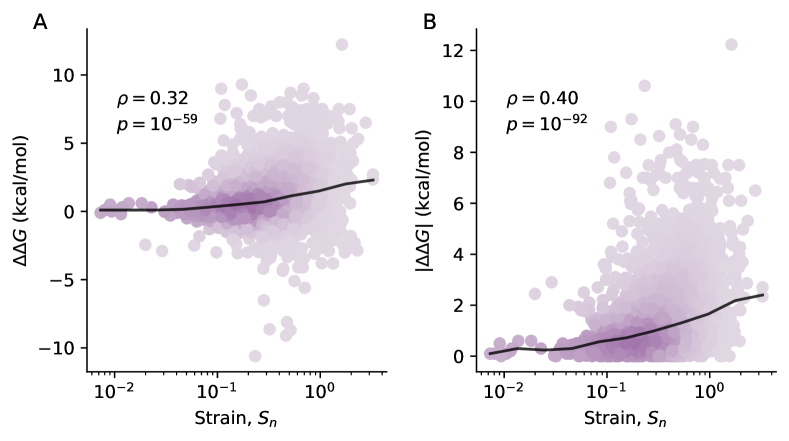
Strain correlates with across protein families.— We find a moderate correlation () between and when comparing all the measurements together. This correlation is expected to be limited due to the inability of strain to differentiate between stabilizing and destabilizing mutations. Since Eq.(1) measures the absolute relative change in distances, by definition, and thus strain is invariant to reversing the reference and target structures. Indeed, we find a somewhat higher correlation () between and the magnitude of stability changes, . This indicates that more generally, large structural changes lead to large stability changes, independent of the sign of the change.
We do not expect a simple mapping between and , given the complexity of protein structures and intramolecular interactions. We obviate protein size effects to an extent by only looking at mutation effects within , but there are other protein-specific factors – such as the degree of disorder, protein shape, flexibility, and amino acid packing – that may alter the relationship between strain and for different proteins.
Nonetheless, the strain-stability correlations shown here indicate that strain due to mutation contains considerable information about stability changes that may be leveraged in subsequent development of predictors of .
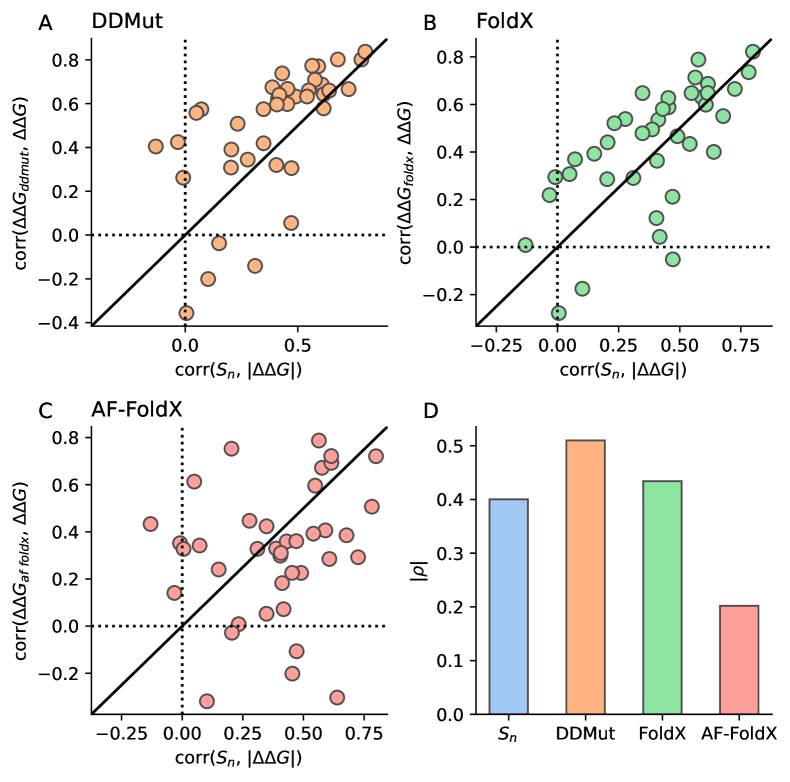
Strain correlates with almost as well as tailored predictors.— To put the strain-stability correlations in context, we compare them with two state-of-the-art predictors, DDMut and FoldX (Appendix C) [16, 17]. FoldX predicts from structure using empirical energy-based potentials; it is used to calculate by first a generating structure for the mutant based on a reference WT structure, which enables calculation of for both WT and mutant structures. DDMut uses a neural network to predict , using a reference structure and a mutation as input.
We find that – correlations are almost as high as correlations obtained using FoldX on average, and not far behind DDMut (Fig. 4). We were genuinely surprised by this performance since strain is a simple general measure of deformation and not designed specifically for stability, in contrast to FoldX and DDMut. Our aim here is not to use strain to predict , but rather to see whether the strain predicted by AF is informative about stability changes. But given the surprisingly high correlation, we speculate that AF-predicted structures can be leveraged to produce even better predictors.
We expected that since FoldX calculates for a structure, it would give us a more accurate estimate of than strain if we use it on AF-predicted structures. Surprisingly, we find that this method (AF-FoldX) performs worse than strain in this case (). Likewise, we find that calculating strain using the structures generated by FoldX results in a lower correlation with (, SM Fig. 5). We considered also the possibility that AF-predicted structures are not as accurate as FoldX-generated structures. However, we find that strain calculated using FoldX structures is not correlated with distance from the mutated site (SM Fig. 6), indicating that FoldX is less accurate than AF in predicting the effect of mutations on structure. These results suggest that there is a promising path for generation of new energy-based methods for prediction using AF-predicted structures.
Can AF be used to predict stability changes?— We emphasize that our aim here is not to outright develop a predictor but rather to investigate whether AF predictions are informative of stability changes. We have found that a general measure of deformation, strain, correlates quite well with . Although it was not designed to be a -predictor, appears to be almost as good at predicting the magnitude of stability changes as state-of-the-art predictors. Of course, this needs to be tested on a larger set of measurements, and more structures are needed for experimental validation of the relationship between strain and stability (SM Sec. 1C). We also note that higher correlations have been observed for these predictors on different datasets, so this analysis should be repeated on larger sets of measurements [18, 16]. Yet, within these limitations, it seems clear that there is sufficient information in AF-predicted structures to make predictions. It stands to reason that new physics-based models can be developed to achieve even better predictions, off the back of AF-predicted structures. Alternatively, these structures could be used to reparameterize existing force fields such as FoldX. The recent explosion of high-throughput measurements [19, 20] will certainly lead to more machine-learning and sequence-based approaches. Nevertheless, we feel that physics-based methods are essential to offer a detailed view into the mechanistic effects of mutations on stability. The breakthrough by AF in structure prediction might offer the key to this future.
Advice for using AF to predict mutation effects— A previous study examined the same ThermoMutDB dataset, yet they concluded that AF cannot be used to predict stability. This is due to using changes in pLDDT to measure mutation effects, which does not appear to be reliable for this purpose (SM Fig. 7) [7]. We recommend using strain as a more robust measure of the effect of mutations on structure, particularly when using averaged structures. We recommend using about 10 to 20 (i.e., 5 models, 2-4 repeats) structures to get averages, as there are diminishing returns on performance gains (SM Fig. 8).
We have studied the correspondence between AlphaFold (AF) predictions of mutation effects on structure (measured using strain) and changes in stability.
We find that strain correlates well with , almost as well as state-of-the-art predictors. Altogether, our findings suggest that new algorithms can be developed to extract more information from AF structures to produce accurate physics-based models of stability change upon mutation.
This work was supported by the Institute for Basic Science, Project Code IBS-R020-D1.
Appendix A: Stability Data—
We select all proteins from ThermoMutDB (TMDB) [14] with sequence length, , and measurements for single mutants made within
and pH ; this amounts to out of measurements.
One problem we found with TMDB is that the indices in mutation codes can be associated with either Protein Data Bank (PDB) [21], Uniprot [22], or “unsigned”, yet we wanted to match mutations to Uniprot sequences. Hence, if indices were matched to PDB indices that differed from Uniprot indices, we used a custom script to convert the mutation codes to the correct Uniprot indices. This script only works when the mutation code index refers to the “_atom_site.label_seq_id” entry of the mmCIF file; we excluded many cases where the TMDB mutation indices refer to idiosyncratic indexing (i.e., not starting from one) in the “_atom_site.auth_seq_id” entries in the mmCIF files.
Out of caution, if no correct matches were found for a protein we excluded all TMDB entries that were related to this protein (i.e., if they have the same value in the ‘PDB_wild” column). We excluded “unsigned”, since these were ambiguous, and we discovered that some of these were labelled with incorrect Uniprot accession ids.
After this procedure we are left with measurements.
We average when multiple measurements are available to get a representative value for each mutation. We leave out a mutant if the standard deviation of the measurements is higher than ; this occurred in only about of cases.
We examined why some of these cases had such high variance, and found occasional errors where the sign differed from the reference it was taken from.
A full list of errors and corrections can be found in SM Section 1D. The final set of measurements includes unique mutants. We study correlations within individual wild-type (WT) proteins (and their single mutants), and across the full set of measurements.
Appendix B: Structure Analysis— We use the ColabFold implementation of AF to predict protein structures [23]. We run all 5 models, without using templates, and using 6 recycles, and minimization using the Amber forcefield. We run 10 repeat predictions for each sequence, for each model, and create averaged structures following [7]. We calculate effective strain, ES, which measures the deformation between mutants and WT proteins, for both averaged and non-averaged structures. ES can be described simply as the average relative change of distances between neighboring residues; we define neighbors as residues whose positions are within . We calculate ES as [7],
| (1) |
where is the distance vector between positions in residue and neighbor in a reference structure, is the corresponding distance vector in a target structure which has been aligned to , is the set of neighbors, and is the number of neighbors. We refer to ES measured at the mutated site as . We also calculate the neighborhood sum of strain over residues whose distance to the mutation site , is shorter than some threshold ,
| (2) |
We mainly use . We typically only include AF-predicted residues in strain calculations if pLDDT , and treat the rest as disordered, except where otherwise noted.
Appendix C: predictors— We use two state-of-the-art methods to predict : FoldX 5 [24], and DDMut[16]. We use the API for the DDMut web server to predict . For FoldX, we use the BuildModel command to generate structures of the WT and mutant sequences and predictions. We use five runs as recommended, and report average values of . For each algorithm, we provide the top-ranked (by pLDDT) AF-predicted WT structure as an input, along with a list of all mutants for that protein.
References
- Thornton et al. [2021] J. M. Thornton, R. A. Laskowski, and N. Borkakoti, Alphafold heralds a data-driven revolution in biology and medicine, Nature Medicine 27, 1666 (2021).
- Subramaniam and Kleywegt [2022] S. Subramaniam and G. J. Kleywegt, A paradigm shift in structural biology, Nature Methods 19, 20 (2022).
- Jumper et al. [2021] J. Jumper, R. Evans, A. Pritzel, T. Green, M. Figurnov, O. Ronneberger, K. Tunyasuvunakool, R. Bates, A. Žídek, A. Potapenko, A. Bridgland, C. Meyer, S. A. A. Kohl, A. J. Ballard, A. Cowie, B. Romera-Paredes, S. Nikolov, R. Jain, J. Adler, T. Back, S. Petersen, D. Reiman, E. Clancy, M. Zielinski, M. Steinegger, M. Pacholska, T. Berghammer, S. Bodenstein, D. Silver, O. Vinyals, A. W. Senior, K. Kavukcuoglu, P. Kohli, and D. Hassabis, Highly accurate protein structure prediction with alphafold, Nature 596, 583 (2021).
- Baek et al. [2021] M. Baek, F. DiMaio, I. Anishchenko, J. Dauparas, S. Ovchinnikov, G. R. Lee, J. Wang, Q. Cong, L. N. Kinch, R. D. Schaeffer, C. Millán, H. Park, C. Adams, C. R. Glassman, A. DeGiovanni, J. H. Pereira, A. V. Rodrigues, A. A. van Dijk, A. C. Ebrecht, D. J. Opperman, T. Sagmeister, C. Buhlheller, T. Pavkov-Keller, M. K. Rathinaswamy, U. Dalwadi, C. K. Yip, J. E. Burke, K. C. Garcia, N. V. Grishin, P. D. Adams, R. J. Read, and D. Baker, Accurate prediction of protein structures and interactions using a three-track neural network, Science 373, 871 (2021).
- Roney and Ovchinnikov [2022] J. P. Roney and S. Ovchinnikov, State-of-the-art estimation of protein model accuracy using alphafold, Phys. Rev. Lett. 129, 238101 (2022).
- Herzberg and Moult [2023] O. Herzberg and J. Moult, More than just pattern recognition: Prediction of uncommon protein structure features by ai methods, Proceedings of the National Academy of Sciences 120, e2221745120 (2023).
- McBride et al. [2023] J. M. McBride, K. Polev, A. Abdirasulov, V. Reinharz, B. A. Grzybowski, and T. Tlusty, Alphafold2 can predict single-mutation effects, Phys. Rev. Lett. 131, 218401 (2023).
- Buel and Walters [2022] G. R. Buel and K. J. Walters, Can alphafold2 predict the impact of missense mutations on structure?, Nature Structural & Molecular Biology 29, 1 (2022).
- Pak et al. [2023] M. A. Pak, K. A. Markhieva, M. S. Novikova, D. S. Petrov, I. S. Vorobyev, E. S. Maksimova, F. A. Kondrashov, and D. N. Ivankov, Using alphafold to predict the impact of single mutations on protein stability and function, PLOS ONE 18, 1 (2023).
- Akdel et al. [2022] M. Akdel, D. E. V. Pires, E. P. Pardo, J. Jänes, A. O. Zalevsky, B. Mészáros, P. Bryant, L. L. Good, R. A. Laskowski, G. Pozzati, A. Shenoy, W. Zhu, P. Kundrotas, V. R. Serra, C. H. M. Rodrigues, A. S. Dunham, D. Burke, N. Borkakoti, S. Velankar, A. Frost, J. Basquin, K. Lindorff-Larsen, A. Bateman, A. V. Kajava, A. Valencia, S. Ovchinnikov, J. Durairaj, D. B. Ascher, J. M. Thornton, N. E. Davey, A. Stein, A. Elofsson, T. I. Croll, and P. Beltrao, A structural biology community assessment of alphafold2 applications, Nature Structural & Molecular Biology 29, 1056 (2022).
- Mansoor et al. [2022] S. Mansoor, M. Baek, D. Juergens, J. L. Watson, and D. Baker, Accurate mutation effect prediction using rosettafold, bioRxiv 10.1101/2022.11.04.515218 (2022).
- Iqbal et al. [2022] S. Iqbal, F. Ge, F. Li, T. Akutsu, Y. Zheng, R. B. Gasser, D.-J. Yu, G. I. Webb, and J. Song, Prost: Alphafold2-aware sequence-based predictor to estimate protein stability changes upon missense mutations, Journal of Chemical Information and Modeling 62, 4270 (2022), pMID: 35973091.
- Peccati et al. [2023] F. Peccati, S. Alunno-Rufini, and G. Jiménez-Osés, Accurate prediction of enzyme thermostabilization with rosetta using alphafold ensembles, Journal of Chemical Information and Modeling 63, 898 (2023), pMID: 36647575.
- Xavier et al. [2020] J. S. Xavier, T.-B. Nguyen, M. Karmarkar, S. Portelli, P. M. Rezende, J. P. L. Velloso, D. B. Ascher, and D. E. V. Pires, ThermoMutDB: a thermodynamic database for missense mutations, Nucleic Acids Research 49, D475 (2020).
- Echave et al. [2016] J. Echave, S. J. Spielman, and C. O. Wilke, Causes of evolutionary rate variation among protein sites, Nature Reviews Genetics 17, 109 (2016).
- Zhou et al. [2023] Y. Zhou, Q. Pan, D. E. V. Pires, C. M. Rodrigues, and D. Ascher, DDMut: predicting effects of mutations on protein stability using deep learning, Nucleic Acids Research 51, W122 (2023).
- Schymkowitz et al. [2005] J. Schymkowitz, J. Borg, F. Stricher, R. Nys, F. Rousseau, and L. Serrano, The FoldX web server: an online force field, Nucleic Acids Research 33, W382 (2005).
- Broom et al. [2020] A. Broom, K. Trainor, Z. Jacobi, and E. M. Meiering, Computational modeling of protein stability: Quantitative analysis reveals solutions to pervasive problems, Structure 28, 717 (2020).
- Dunham and Beltrao [2021] A. S. Dunham and P. Beltrao, Exploring amino acid functions in a deep mutational landscape, Molecular Systems Biology 17, e10305 (2021).
- Tsuboyama et al. [2023] K. Tsuboyama, J. Dauparas, J. Chen, E. Laine, Y. Mohseni Behbahani, J. J. Weinstein, N. M. Mangan, S. Ovchinnikov, and G. J. Rocklin, Mega-scale experimental analysis of protein folding stability in biology and design, Nature 620, 434 (2023).
- Berman et al. [2000] H. M. Berman, J. Westbrook, Z. Feng, G. Gilliland, T. N. Bhat, H. Weissig, I. N. Shindyalov, and P. E. Bourne, The Protein Data Bank, Nucleic Acids Res. 28, 235 (2000).
- Consortium [2018] T. U. Consortium, Uniprot: A worldwide hub of protein knowledge, Nucleic Acids Res. 47, D506 (2018).
- Mirdita et al. [2022] M. Mirdita, K. Schütze, Y. Moriwaki, L. Heo, S. Ovchinnikov, and M. Steinegger, Colabfold: making protein folding accessible to all, Nature Methods 19, 679 (2022).
- Delgado et al. [2019] J. Delgado, L. G. Radusky, D. Cianferoni, and L. Serrano, FoldX 5.0: working with RNA, small molecules and a new graphical interface, Bioinformatics 35, 4168 (2019).