Non-Visible Light Data Synthesis and Application: A Case Study
for Synthetic Aperture Radar Imagery
Abstract
We explore the “hidden” ability of large-scale pre-trained image generation models, such as Stable Diffusion and Imagen, in non-visible light domains, taking Synthetic Aperture Radar (SAR) data for a case study. Due to the inherent challenges in capturing satellite data, acquiring ample SAR training samples is infeasible. For instance, for a particular category of ship in the open sea, we can collect only few-shot SAR images which are too limited to derive effective ship recognition models. If large-scale models pre-trained with regular images can be adapted to generating novel SAR images, the problem is solved. In preliminary study, we found that fine-tuning these models with few-shot SAR images is not working, as the models can not capture the two primary differences between SAR and regular images: structure and modality. To address this, we propose a 2-stage low-rank adaptation method, and we call it 2LoRA. In the first stage, the model is adapted using aerial-view regular image data (whose structure matches SAR), followed by the second stage where the base model from the first stage is further adapted using SAR modality data. Particularly in the second stage, we introduce a novel prototype LoRA (pLoRA), as an improved version of 2LoRA, to resolve the class imbalance problem in SAR datasets. For evaluation, we employ the resulting generation model to synthesize additional SAR data. This augmentation, when integrated into the training process of SAR classification as well as segmentation models, yields notably improved performance for minor classes111Code: https://github.com/doem97/gen_sar_plora.
1 Introduction
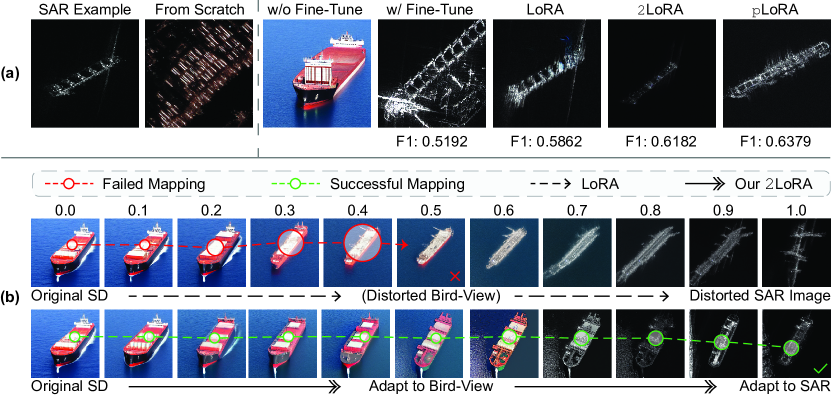
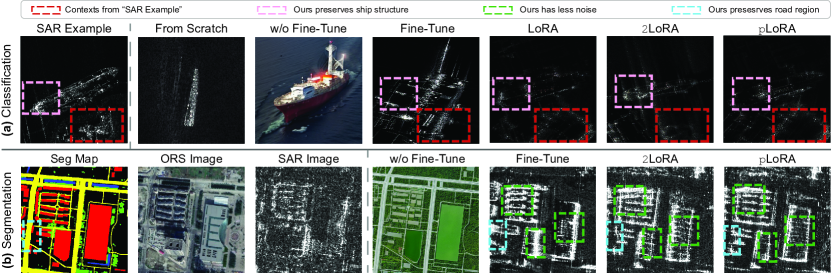
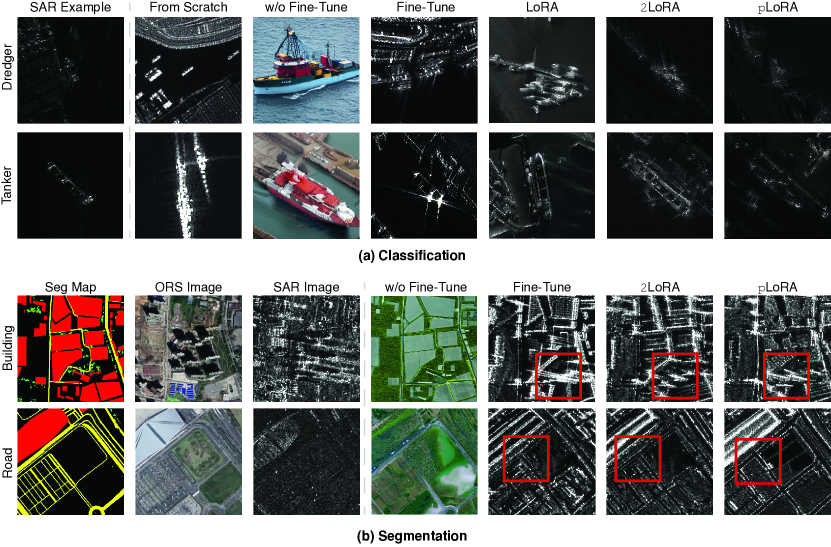
Large-scale pre-trained generative models, such as Stable Diffusion (SD) [39], Imagen [43], GLIDE [32], and ControlNet [56] (based on SD) can generate realistic and diverse regular images given textual or structural prompts. Their success comes from the capacity of learning a robust and generalizable representation space from billions of web images [44, 24]. In this paper, we focus on synthesizing data for an uncommon data modality Synthetic Aperture Radar (SAR) whose spectrum is outside human’s visible light range (- nm), and has wide applications in marine safety, environmental protection, and climate studies. In our preliminary study with the open-sourced SD model, we found that fine-tuning it on SAR (whose data is often insufficient) tends to overfit that modality and “forget” the general features learned from its original pre-training. Another observation is that straightforwardly employing the popular “anti-forgetting” domain adaptation method LoRA (low-rank decomposition) [19] does not solve the problem. The main challenge is the difficulty in capturing the two primary differences: structure and modality, between regular images and SAR images. Fine-tuning or low-rank decomposition on SD fails to capture the necessary feature transformations arising from these two differences. For example, in Figure 1 (a), the 4th and 5th images display the synthesis results from the fine-tuned SD and LoRA-based SD, respectively, both of which are suboptimal. The SAR image classification results (F1 scores), using corresponding synthesized images for data augmentation, are given below the images for reference, and the higher the better.
So, the question arises: why, given such a large domain gap, do we still consider using the pre-trained knowledge from regular images? Our motivation comes from an initial empirical observation below. When we don’t perform any fine-tuning or LoRA on SD and directly use the SD features (extracted from SAR data) to train a SAR recognition model, we found that this model can easily outperform existing SAR models which are usually small-scale, trained from scratch, or initialized from a model pre-trained on ImageNet [38]. The possible reasons are three-fold. 1) SAR data contains noise (due to atmospheric conditions, sensor noise, etc.), and the SD model inherently has denoising properties. 2) SAR data often exhibit high variability (due to factors such as different sensors, acquisition times, and weather conditions), and the SD model based on large-scale pre-training is robust to such variations. 3) SAR data have spatially coherent structures (e.g., urban areas, water bodies, and forests), and the diffusion process in SD respects spatial coherence, making SD adept at preserving these structures while extracting meaningful features. Therefore, we believe if the SD model with its general vision knowledge can be properly adapted to the SAR domain, e.g., to synthesize diverse and high-quality SAR images, it will address the data scarcity issue of SAR.
As aforementioned, directly adapting SD with SAR images is not working due to the large domain gap. We dive into the detailed visualization of failure cases of LoRA in the 1st row of Figure 1 (b), taking images generated with prompt “tanker ship” as examples. A LoRA scale of 0 implies the absence of LoRA (mean, original SD), producing a regular RGB image of a “tanker ship”. As the scale adjusts to 0.5, noticeable distortions emerge, rendering a blurry deck. With a further increase to a scale of 1.0, the distortion becomes egregious, resulting in the very wrong structure of “tanker ship”. So, the finding is that the transition from a regular view (scale = 0) to an aerial view (approximately at scale = 0.5) fails in SD, and this failure propagates to result in a flawed SAR image (when the scale reaches 1.0). An intuitive solution is that enhancing the SD’s synthesis ability on aerial-view images may prevent the distortion at the first stage (i.e., from a regular view to an aerial view). It is also a soundable solution since one of the key differences between regular images and SAR images is the structure which is fortunately not significantly different between aerial-view images and SAR images. More fortunately, we can leverage optical remote-sensing (ORS) images whose large-scale datasets [60, 11, 45] are available, to achieve it.
We thus propose a 2-stage LoRA222We don’t consider fine-tuning SD’s own parameters to avoid catastrophic forgetting of SD’s pre-trained knowledge. approach to adapt SD from regular imagery to SAR imagery indirectly, and we call it 2LoRA. In the first stage, the model is learned to adapt from its regular view to the aerial view without changing its data modality, by training an ORS LoRA module on ORS data. In the second stage, the model is further adapted from RGB modality to SAR modality, by training a SAR LoRA module on SAR data. Particularly, in the second stage, we introduce a novel prototype LoRA, dubbed pLoRA, as an improved version of 2LoRA, to resolve the class imbalance problem in SAR datasets (e.g., “tanker ship” in SAR ship classification dataset, and “road” in SAR semantic segmentation dataset are all minor classes with very limited samples). For pLoRA, we first cluster all training samples on the feature space regardless of their classes, assuming each cluster captures the primary attributes of a specific SAR imagery prototype, e.g., “long and slender hull”, “wide deck” or “angular bow”. Then, we use the samples in each cluster to train an individual pLoRA, and weighted sum all pLoRAs to substitute the vanilla SAR LoRA, where the weights are designed to solve the imbalance problem of prototypes.
Our technical contributions in this paper are two-fold: 1) a pioneer work of leveraging large-scale pre-trained generative models for synthesizing non-visible light images, i.e., transferring the semantic knowledge pre-learned in regular images to diversify the training data in the SAR domain; and 2) a novel 2LoRA approach that addresses the domain adaptation challenges from regular images to SAR images, and its improved version pLoRA to solve the class imbalance problem in SAR datasets. In experiments, we employ the resulting models to synthesize samples for minor classes. This data augmentation, when integrated into the training process of SAR models in image classification as well as segmentation tasks, yields notable improvement.
2 Related Works
Data Augmentation with Synthetic Images. Regular images synthesized by pre-trained diffusion models have been validated to be effective in augmenting regular image datasets [59, 16, 2]. One work by He et al. [16] combines large models like GLIDE [32], T5 [37] and CLIP [36] to generate high-quality regular images. Their methods effectively tackled few-shot, zero-shot, and data imbalance problems in original datasets. Another work by Rombach et al. [39] shows that images generated by Denoising Diffusion Probabilistic Models (DDPMs) can enhance ImageNet pre-trained networks. To increase semantic variance in generated images, the GIF [59] is designed by adding a marginal perturbation in the latent space of Latent Diffusion Models (LDMs). However, all of the existing works generate regular images that share similar visual representations with the pre-training datasets of the large models. The domain gap between the application and pre-training is small. Besides, most of the target datasets (to be augmented) don’t really have long-lasting data shortage problems as their images are mainly from daily life or can be collected from ordinary cameras, compared to the non-visible light data on specific objects (e.g., “ships” in maritime monitoring) which are hard to collect. Our focus in this work is a non-visible light data synthesis, taking SAR imagery as a study case. SAR imagery has an inherent large domain gap with regular images regarding both structure and modality. The SAR recognition tasks face long-lasting data scarcity issues due to the military implications.
Conventional Data Augmentation. Data augmentation methods are widely used to improve the diversity of visual datasets, thereby boosting the generalization ability of trained models [47]. Popular strategies include erasing [62], image manipulation [50], cutmix [55], and search-based methods [8, 10]. As validated by Zhang et al. [59], typically operating on existing images with manually specified rules, these strategies are limited to local pixel-wise modifications without introducing novel content or unseen visual concepts. In comparison, we perform data augmentation from a data synthesis perspective. We introduce a method of leveraging the pre-trained knowledge (e.g., that in SD) to generate various training samples in the SAR domain.
Generative Model Adaptation. Adapting pre-trained generative models, such as GAN [20, 3] and Stable Diffusion [39], aims to transfer the knowledge of these models to synthesize new concepts or out-of-distribution data. Existing methods can be roughly classified into two categories: concept-level and domain-level. Concept-level adaptation modifies the model knowledge to moderate new visual concepts (unseen during pre-training), such as for generating new objects, styles, or certain spatial structures. Within the GAN paradigm, some works [33, 14] fine-tune the entire generator using regularization techniques. In contrast, some other works try to optimize the crucial part of generator [22, 1], or introduce a lightweight attribute adaptor before the frozen generator and a classifier after the frozen discriminator [54]. On top of the SD model, DreamBooth [40] and Textual Inversion [15] try to generate new objects in existing scenes. ControlNet [56] and DragDiffusion [46] enable conditional generation from a spatial structure. HyperDreamBooth [41] customizes the generated image to show a certain human face. All these adaptation methods are based on the assumption that the “SD backbone” could readily generate any unseen concept, i.e., the concept has been seen by SD during its pre-training with regular images. Domain-level adaptation aims to adapt a pre-trained generative model to a new image domain absent (or very rare) from its pre-training data, such as medical images. [5] validate that fine-tuning SD with carefully selected hyperparameters could lead to realistic lung X-ray images. [21] find that, compared to GAN, the diffusion model is more capable of encompassing the diversity of medical images. Unlike these works, we focus on the special light domain (SAR) and find that fine-tuning SD fails to capture the needed feature transformation, due to the significant domain gap between regular and SAR data as well as the data insufficiency of SAR.
3 Preliminaries
Pre-trained Latent Diffusion Model. We implement our method based on pre-trained latent diffusion model [39]. Specifically, we use SD [42]. We chose it because of three aspects: 1) SAR images usually suffer from high noise levels, and the SD inherently has a denoising property. 2) SAR images often exhibit high variability, and the SD based on large-scale pre-training is robust to such variations. 3) SAR images have spatial coherent structures, and the diffusion process in SD respects spatial coherence. Specifically, SD is a text-to-image model incorporating a diffusion process in the latent space of a pre-trained VQGAN autoencoder [13]. In SD, a denoising U-Net is trained to fit the distribution of latent codes, and it is conditioned on the textual embeddings extracted through a text encoder CLIP [36] via cross-attention. During inference, SD performs iterative reverse diffusion on a randomly sampled noise to generate an image that faithfully adheres to the input text. Given a data pair 333To avoid confusion with notations in the downstream classification task, we denote text prompts as , classification labels as ., where is an image and is text prompt, the learning objective for SD is to minimize a denoising objective:
| (1) |
where is the latent feature at timestep , is pre-trained CLIP text encoder, is pre-trained VQGAN encoder, and is the denoising U-Net with learnable parameter .
Low-Rank Adaptation. Our implementation of domain adaptation from regular images to SAR is based on LoRA [19]. LoRA was initially proposed to adapt large language models to downstream tasks. It operates under the assumption that during model updating, parameter updating is sparse. It thus introduces a low-rank factorization of the parameter changes, i.e., . Here, represents the parameters of pre-trained model (e.g., SD in our case), and and denote low-rank factors, with . The updated parameters are thus given by . Injecting multiple concepts can be realized by training multiple LoRA modules (each for a single concept) and combining them through weighted sum, , and denotes combination weights.
4 Our Approach
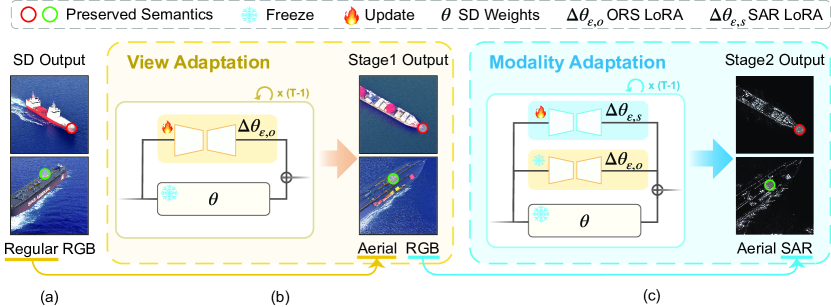
Our approach synthesizes high-utility SAR data to augment the minor classes in SAR datasets. We achieve this by adapting SD with the proposed 2LoRA and pLoRA. The 2LoRA adaptation has two stages: the view adaptation and the modality adaptation (respectively in Sections 4.1 and 4.2). The pLoRA is an improved modality adaptation in the 2nd stage, tackling the class imbalance problem of original SAR datasets. For data augmentation (Section 4.3), we introduce a method to integrate structural conditioning network (i.e., ControlNet [61]) with pLoRA. This allows us to incorporate a wide range of structural conditions from ORS data which further diversifies the synthesized SAR data.
4.1 View Adaptation
Figure 2 (a) shows that SD without adaptation generates only regular-view RGB images. To make it adapt from a regular view to an aerial view, in the first stage, we learn an ORS LoRA on top of a frozen SD, as shown in Figure 2 (b).
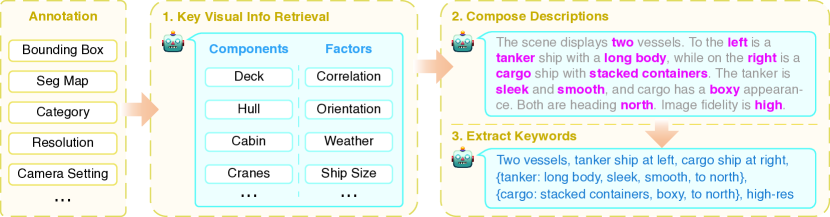
Prompt Construction for ORS. During training, SD associates the visual knowledge in images with the semantics in text prompts, through a cross-attention mechanism. Low-quality text prompts introduce ambiguity to this association. Given the fact that the large-scale ORS datasets [60, 11, 45] provide only task-specific annotations (i.e., coordinates of bounding boxes or segmentation maps), the question is how to use such annotations to generate high-quality prompts. Previously, this engineering process was manually done by human prompt engineers. In this work, we automate it by leveraging open-sourced Multimodal Large Language Models (MLLMs) such as MiniGPT-4 [63].
Concretely, given a task-specific ORS dataset , we first employ MLLM to identify key visual components (e.g., deck/hull/cabin of ships, or roof/yard of buildings) and contextual factors (e.g., spatial correlations between objects, weather conditions, object orientations) that exhibit distinct visual representations in aerial views. Then, we prompt MLLM to generate detailed text descriptions, which encompass four aspects: spatial correlation between objects; image visibility (e.g., foggy/clear, or dark/bright); orientation of moving objects; visual attributes of key components (e.g., texture, shape, size, and positions). Finally, we request MLLM to filter out noisy words from these descriptions (i.e., redundant words and personal feelings, such as “is/and” and “like/favor”) and form a complete prompt for each image. We denote the obtained data triples {(ORS image, prompt, label)} as , where the subscript “o” stands for ORS. We provide chat history with MLLMs and examples of generated prompts in the Appendix.
ORS LoRA. We learn an ORS LoRA on the training data , to let the SD model “understand” the aerial view. A direct fine-tuning of SD (which is not used in this work) can be formulated with loss (in Eq. 1) as , where denotes parameters of attention layers of denoising U-Net, denotes updated parameters, “” means directly modifying with gradient descent, and indicates the difference. We assume this is low-rank decomposable [19], meaning that it can be parameterized by a smaller set of parameters , i.e., . Therefore, we can search for an optimal low-rank with a parameter-efficient learning objective as: , where means skip-connecting a layer parameterized by to .
Denoising U-Net of SD contains a sequence of attention layers. Hence, to apply the above ORS LoRA to U-Net, we implement by a sequence of lightweight networks, each of them applied to one attention layer of the U-Net, as depicted in Figure 2 (b). Each lightweight network is composed of two linear layers with a hidden dimension , i.e., the rank of LoRA. We apply ORS LoRA networks to only the cross-attention layers (i.e., the Q, K, V linear projection layers), because the research in Hu et al. [19] has demonstrated that adapting these layers is sufficient and efficient.
We call the learned LoRA networks an “ORS LoRA” module, and represent it by where “o” is for ORS. During the inference phase, this module outputs parameter updates for each cross-attention layer. The updated network is thus , where is the strength of the module and “” means skip-connection.
4.2 Modality Adaptation
Prompt Construction for SAR. Due to the inaccurate description of MLLM on SAR modality data, for the SAR prompt, we modify the final step of our prompt construction process in Section 4.1. We filter out negative prompts that wrongly describe SAR’s unique visual features, such as color/texture/shadow/brightness/weather. Please refer to the Appendix for the full list of negative prompts. We denote the resulting data triples {(SAR image, prompt, label)} as , where the subscript “s” denotes SAR.
2LoRA. In the second stage, we adapt SD w/ ORS LoRA from RGB to SAR. We achieve this by learning a SAR LoRA on top of SD w/ ORS LoRA (see Figure 2 (c)). We freeze all modules in SD w/ ORS LoRA and train only the SAR LoRA with the training data . We call the resulting model 2LoRA. During the inference, two LoRAs are weighted combined as:
| (2) |
where and are hyperparameters denoting the strengths of adaptation. Note that the sum of and is not necessarily to be . As pointed by Hu et al. [19], a higher LoRA strength approximates a higher learning rate. In our experiments, we empirically allow , as we observed clear image distortion beyond this range.
pLoRA. As shown in Figure 1 (b), 2LoRA can successfully adapt SD from the regular image domain to the SAR domain. However, we observe bias problems from the overall results of 2LoRA due to the data imbalance in original SAR datasets (even after resampling). Classes with more samples get higher generation quality. We tackle this by clustering the SAR dataset into several groups each representing a visual prototype/attribute of SAR images. Each prototype contains samples from both major and minor classes, thus reducing the bias.
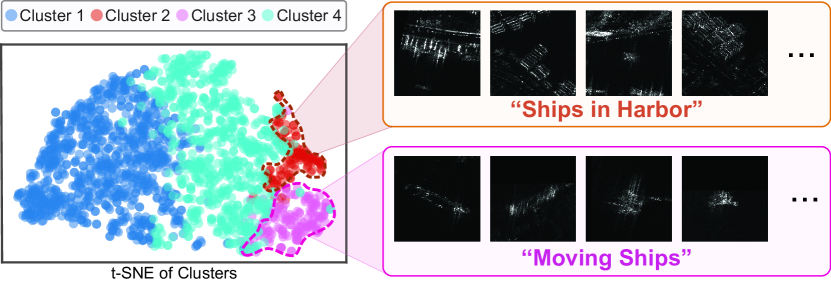
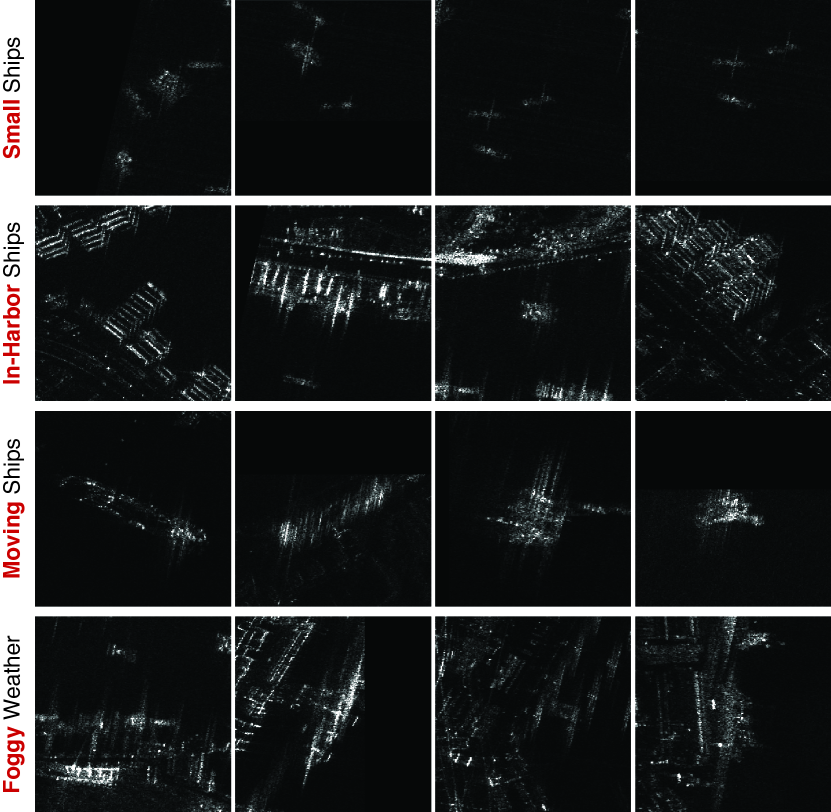
We first extract the features from SAR images with a pre-trained SAR classifier : , where denote the features. Then, we apply -Means clustering on to get clusters. As shown in Figure 3(a), each cluster captures an identical visual attribute such as “in the harbor” or “moving”. We split the training data into groups based on the clusters. Each group is then used to train a prototype LoRA. We thus get prototype LoRAs (dubbed pLoRA), and denote their parameters as , .
In the inference phase, we combine ORS LoRA and pLoRA vis weighted sum:
| (3) |
where are the weights of prototype LoRAs. Intuitively, this weight should be calculated to avoid bias (within a cluster) towards the major classes. To this end, we calculate the data distribution in each cluster. If a target class (i.e., minor class to be generated) is well-represented in a cluster, we give more weight to that cluster.
Given the cluster distribution where stand for classes, and for clusters, when generating image for minor class , the proportion of in each cluster is calculated as . We compute a bias vector for minor class as . We take these bias vectors as the weights of pLoRA. To ensure the weights sum to , we apply the L1-normalization over to get our final pLoRA weights, i.e., =. Please kindly refer to the Appendix for more details of computing pLoRA weights and the detailed justification of the advantage of pLoRA over 2LoRA.
4.3 Dataset Augmentation
Our SAR image synthesis method can generate novel data to augment various SAR datasets. We formulate this dataset augmentation process below. Given an imbalanced SAR dataset of , where the minor classes have only few training samples, we synthesize new training samples, i.e., , such that models trained with has improved performance, especially for minor classes.
Our principles for data augmentation include 1) consistency: the data distribution in synthetic dataset should align with the original dataset in the semantic feature space, e.g., the identical object in real and synthesized images have consistent features such as the structures in SAR domains, and 2) diversity: should offer additional semantic diversity over the existing , e.g., generating new contexts or novel variants that can enrich existing data.
Consistency. To keep consistency, we ensure the structure coherence between real and synthetic images by using structural conditioning networks (e.g., ControlNet [56] or T2I Adaptor [31]). These networks constrain the generated images to faithfully follow a fixed spatial structure. Take ControlNet as an example. It learns contour-to-image mapping through a shadow copy of the denoising U-Net, and adds this mapping as a plug-in to SD. During inference, given a reference triple (SAR image, prompt, label) denoted as (constructed in Section 4.2), we extract structure from (where could be a canny edge, estimated depth, segmentation map, or a stretch , and feed into ControlNet . The generated image is:
| (4) |
where is decoder of autoencoder, is the denoising U-Net parameterized by , is timestep, and is embedding of condition output by ControlNet . The resulting new training data is .
Diversity. To achieve a high diversity of generated data, we borrow the rich structure information from large-scale ORS datasets as a condition of the generation. This is reasonable as there is a structure coherence between ORS and SAR images (i.e., same objects/regions share the same outlines in these two types of data). To this end, given a reference triple (ORS image, prompt, label) denoted as (constructed in Section 4.1), we extract ORS structure (e.g., a canny edge) from and feed it into the ControlNet. Similar to Eq. 4, the generated image can be formulated as , and the resulting new training data is denoted as . Finally, we use all newly generated data to augment corresponding categories in the SAR dataset, i.e., the dataset after augmentation is .
5 Experiments
We evaluated our SAR synthesis method by augmenting datasets for two typical SAR tasks: fine-grained ship classification and geographic semantic segmentation.
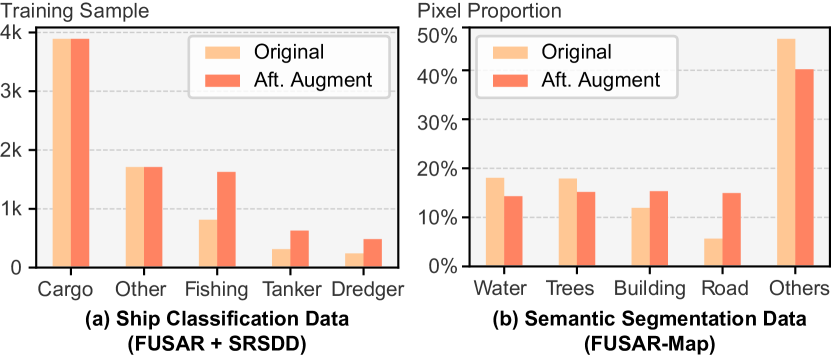
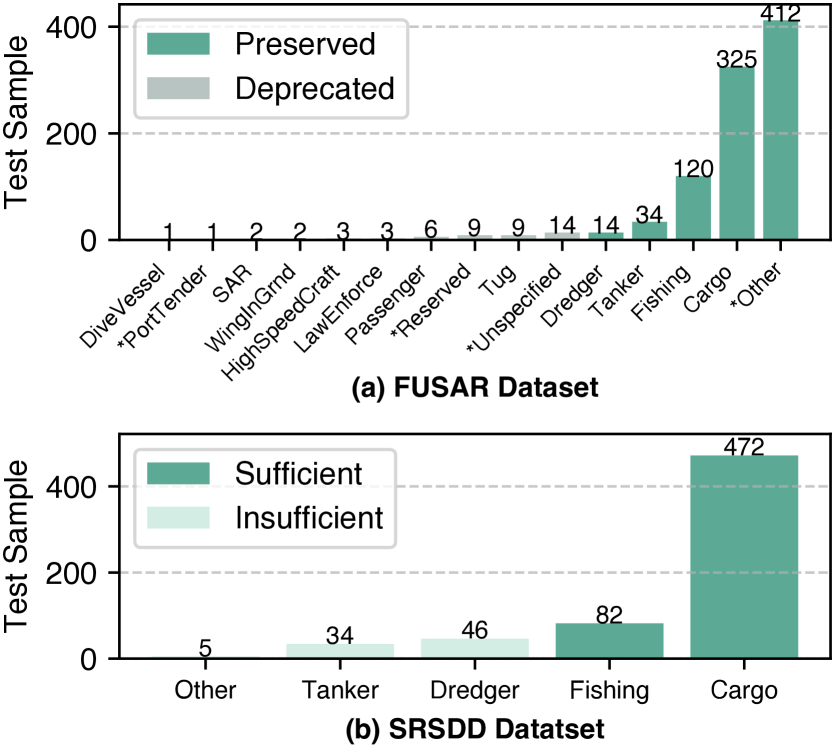
Fine-grained ship classification task. We construct prompts for ORS ship data and SAR ship data, and train the generation model on them in two stages (as in 2LoRA or pLoRA), respectively. Then, we conduct dataset augmentation on the SAR ship dataset for minor classes. Details are as below. 1) ORS ship data. We combined two ORS ship datasets, DOTAv2 [11] and ShipRS [60], to get enough training data. We use GPT-4 [34] to construct prompts based on their annotations (i.e., the xml annotation from ShipRS, and the B-Box coordinates from DOTAv2) 2) SAR ship data. Again to get enough training data, we combined two high-resolution (less then m/pixel) public datasets FUSAR-Ship [18] and SRSDD [25]. Besides, we merged hard-to-evaluate classes (i.e., classes with fewer than 10 test samples) into the “others” class, to ensure each preserved class has enough testing samples for stable evaluation of the methods. The customized dataset is attached in the Appendix. On this dataset, we use GPT-4 to construct text prompts based on their category annotations, following the method in Section 4.2. 3) Dataset augmentation. As shown by the “Original” columns in Figure 4(a), the SAR ship data faces the class imbalance issue. To tackle this problem, we generate new training samples for the minor classes444Based on the Pareto distribution [28, 12] (also known as 20–80 principle), we define categories fewer than 20% of the total training samples as ”minor” classes”. (i.e., the “fishing”, “tanker”, and “dredger”), following the method described in Section 4.3. Specifically, we double the training samples of minor classes, e.g., for “tanker” ship with real samples, we synthesize additional samples. This dataset distribution change is shown in Figure 4(a). For generating new data, we use the ship outline (i.e., canny edges [4] extracted from ORS and SAR ship datasets) as the reference structure and for ControlNet.
Geographic semantic segmentation task. We use a public dataset FUSAR-Map [45] to train generation models, and then use these models to perform dataset augmentation on the FUSAR-Map dataset for minor classes. 1) FUSAR-Map dataset. FUSAR-Map [45] dataset contains 6,974 training tuples of {(SAR image, ORS image, segmentation map)}. The ORS images are sourced from Google Earth and are aligned (via coregistration) with SAR images. We use a MiniGPT-v2 (LLaMA-2 Chat 7B) [6] to construct prompts for ORS and SAR data, as elaborated in Section 4.1 and Section 4.2. Especially, with MiniGPT-v2’s good understanding of ORS data, the ORS prompts are derived directly from ORS images themselves. 2) Dataset augmentation. We oversampling the minor classes (i.e., the “building” and “road”) to increase their pixel representation to around 15%, as shown in Figure 4(b). During new data generation, we use the segmentation map (from the FUSAR-Map dataset itself) as the reference structure for ControlNet. Especially, to enrich the diversity of segmentation maps, we preserve the target class in them and apply basic transformations (i.e., cut-mix, rotate, random crop) to other classes.
| Method | cargo | fishing | tanker | dredger | Average | |||||
|---|---|---|---|---|---|---|---|---|---|---|
| FIDS | F1 | FIDS | F1 | FIDS | F1 | FIDS | F1 | FIDS | F1 | |
| 2LoRA | 0.848 | 93.4 | 0.930 | 70.6 | 1.102 | 61.8 | 0.967 | 82.1 | 0.962 | 77.0 |
| cLoRA | 0.840 | 91.6 | 0.927 | 72.0 | 1.097 | 60.2 | 0.962 | 81.8 | 0.957 | 76.4 |
| pLoRA† | 0.859 | 91.8 | 0.911 | 71.5 | 0.935 | 62.0 | 0.912 | 82.5 | 0.904 | 77.0 |
| pLoRA | 0.847 | 91.8 | 0.934 | 71.5 | 0.926 | 63.8 | 0.939 | 84.5 | 0.912 | 77.9 |
| Method | cargo | other | fishing | tanker | dredger | AvgF1 | F1m | ||||||||||
|---|---|---|---|---|---|---|---|---|---|---|---|---|---|---|---|---|---|
| Prec.(%) | Rec.(%) | F1(%) | Prec. | Rec. | F1 | Prec. | Rec. | F1 | Prec. | Rec. | F1 | Prec. | Rec. | F1 | |||
| AutoAug | 88.71 | 94.69 | 91.60 | 80.28 | 81.02 | 80.65 | 74.60 | 58.39 | 65.51 | 68.00 | 57.63 | 62.39 | 88.10 | 71.15 | 78.72 | 75.77 | 68.87 |
| RandAug | 91.74 | 96.37 | 94.00 | 81.45 | 83.33 | 82.38 | 75.97 | 60.87 | 67.59 | 68.00 | 57.63 | 62.39 | 79.59 | 75.00 | 77.23 | 76.72 | 69.07 |
| Oversampling | 89.96 | 96.37 | 93.06 | 81.99 | 80.09 | 81.03 | 72.73 | 59.63 | 65.53 | 69.57 | 54.24 | 60.95 | 88.64 | 75.00 | 81.25 | 76.36 | 69.24 |
| Fine-Tune | 86.96 | 95.85 | 91.19 | 80.21 | 71.30 | 75.49 | 72.66 | 57.76 | 64.36 | 60.00 | 45.76 | 51.92 | 88.64 | 75.00 | 81.25 | 72.84 | 65.84 |
| LoRA | 87.96 | 95.60 | 91.62 | 80.22 | 67.59 | 73.37 | 72.66 | 57.76 | 64.36 | 59.65 | 57.63 | 58.62 | 77.78 | 80.77 | 79.25 | 73.44 | 67.41 |
| 2LoRA | 91.85 | 94.95 | 93.38 | 77.88 | 81.48 | 79.64 | 80.80 | 62.73 | 70.63 | 66.67 | 57.63 | 61.82 | 76.67 | 88.46 | 82.14 | 77.52 | 71.52 |
| pLoRA | 91.72 | 91.84 | 91.78 | 71.13 | 78.70 | 74.73 | 81.10 | 63.98 | 71.53 | 64.91 | 62.71 | 63.79 | 76.56 | 94.23 | 84.48 | 77.26 | 73.27 |
| Method | Per-class Accuracy (%) | AvgAcc | |||
|---|---|---|---|---|---|
| water | tree | building | road | (%) | |
| AutoAug | 86.42 | 89.91 | 34.07 | 18.92 | 57.33 |
| RandAug | 87.01 | 90.07 | 32.19 | 14.92 | 56.05 |
| Oversampling | 89.41 | 84.31 | 36.58 | 20.19 | 57.62 |
| Fine-Tune | 87.06 | 88.25 | 33.49 | 19.42 | 57.06 |
| LoRA | 88.01 | 88.14 | 33.06 | 17.94 | 56.79 |
| 2LoRA | 87.94 | 88.95 | 34.01 | 19.46 | 57.59 |
| pLoRA | 86.85 | 88.52 | 37.95 | 23.49 | 59.20 |
Evaluation. We use a FIDS score (Frechlet Inception Distance for SAR) to evaluate image synthesis quality. Unlike conventional FID [17] which uses an ImageNet pre-trained feature extractor, the FIDS use a FUSAR [18] pre-trained ResNet50 as the feature extractor. The FIDS is thus customized to SAR data evaluation. It is computed between real and synthetic SAR images. All numbers are averaged from the results of five runs of models. Please see more implementation and setting details in the Appendix.
An ablation study on SAR LoRA. When training SAR LoRA on the entire dataset, we see a knowledge bias towards major classes, as in the first row of Table 1. The FIDS of minor classes are clearly higher than those of major. To alleviate this issue, we explored two strategies: cLoRA and pLoRA, as described in the caption of Table 1. We have three observations from their results in Table 1. 1) cLoRA has lower (better) FIDS than 2LoRA but lower (worse) F1-Score. This means cLoRA produces similar images to real ones but is not helpful for data augmentation. This is because each of its LoRA components is focused on a specific class without incorporating any new information from other classes, e.g., contexts. Such focus limits the diversity and utility of the generated images. 2) Compared to 2LoRA and cLoRA, pLoRA exhibits higher F1-Scores in most cases, especially when compared to 2LoRA, suggesting its strong capability of alleviating the class imbalance issue and generating high-utility data for augmentation. 3) pLoRA consistently outperforms pLoRA†, especially for minor classes (+ for “tanker” and + for “dredger”). This is because pLoRA is using a more balanced weighting mechanism (in the last paragraph of Section 4.2) that mitigates the knowledge bias (toward major classes) within every single cluster.
Comparing with data augmentation methods. We compare both conventional and generative data augmentation methods. For conventional methods, we compared with the state-of-the-art AutoAug [9], RandAug [10], and Oversampling [23]. For generative methods, we show the results of 1) fine-tuning SD using SAR data (denoted as “Fine-Tune”), 2) adapting SD to SAR data using a single LoRA (denoted as “LoRA”), 3) adapting SD using our proposed 2LoRA and 4) pLoRA. These methods are further explained in the caption of Table 2.
From Table 2, we have the following observations. 1) 2LoRA consistently outperforms the methods learned solely on SAR data (i.e., “Fine-Tuning” and “LoRA”), suggesting our view adaptation approach is effective. 2) Compared with 2LoRA, pLoRA improves the classification accuracy of minor classes significantly (+ in F1m) at an expense of slightly decreased overall performance (- in AvgF1). In this long-tailed recognition setting, it is a commonly observed problem called “trade-off between head and tail performances” [27, 49]. Our future work will explore more to mitigate this trade-off (e.g., by augmenting all classes). However, in this work, we aim to improve minor classes (by generating data only for minor classes). 3) The generative methods are more effective than conventional methods. A simple oversampling readily outperforms RandAug by points in F1m, and our pLoRA further outperforms oversampling (+ in F1m). This is because conventional methods focus on batch augmentation (which is dominated by major classes), while ours is specifically designed for minor classes. We provide the results on geographic semantic segmentation task in Table 3. We show that pLoRA achieves the best accuracy for “building” and “road”, and outperforms conventional augmentation methods significantly (+ AvgAcc). It is worth mentioning that the 2LoRA here is less pronounced due to SD’s inherent knowledge about urban-scale remote sensing images (as shown in the “w/o FineTune” column in Figure 5(b)). We also find that our method is complementary to conventional augmentation methods, and show evidence in the Appendix.
Qualitative results. Similar to Figure 1 (a), we show synthetic examples of minor classes in Figure 5. Some key observations include 1) our 2LoRA and pLoRA preserves image structures. For example, our method generates the correct SAR representation for ship components (pink boxes); our method preserves “road” regions correctly (blue boxes); 2) our method presents less noise and clearer details (green boxes). More visual examples are given in the Appendix.
6 Conclusions
We explored the hidden potentials of large-scale pre-trained image generation models in non-visible light domains. We revealed some intriguing findings that led us to the 2-stage low-rank adaptation method 2LoRA and its improved version pLoAR. Future research could include the applications of our method in more non-visible light domains such as MRI and infrared imaging.
Acknowledgements
The author gratefully acknowledges the support of the DSO research grant awarded by DSO National Laboratories (Singapore), and the Lee Kong Chian Fellow grant awarded to Dr Qianru Sun by Singapore Management University.
References
- Alanov et al. [2022] Aibek Alanov, Vadim Titov, and Dmitry P Vetrov. Hyperdomainnet: Universal domain adaptation for generative adversarial networks. Advances in Neural Information Processing Systems, 35:29414–29426, 2022.
- Azizi et al. [2023] Shekoofeh Azizi, Simon Kornblith, Chitwan Saharia, Mohammad Norouzi, and David J. Fleet. Synthetic data from diffusion models improves imagenet classification. ArXiv, abs/2304.08466, 2023.
- Brock et al. [2019] Andrew Brock, Jeff Donahue, and Karen Simonyan. Large scale gan training for high fidelity natural image synthesis. International Conference on Learning Representations, 2019.
- Canny [1986] John F. Canny. A computational approach to edge detection. IEEE Transactions on Pattern Analysis and Machine Intelligence, PAMI-8:679–698, 1986.
- Chambon et al. [2022] Pierre Chambon, Christian Blüthgen, Curt P. Langlotz, and Akshay Chaudhari. Adapting pretrained vision-language foundational models to medical imaging domains. NeurIPS 2022 Foundation Models for Decision Making Workshop, abs/2210.04133, 2022.
- Chen et al. [2023] Jun Chen, Deyao Zhu, Xiaoqian Shen, Xiang Li, Zechun Liu, Pengchuan Zhang, Raghuraman Krishnamoorthi, Vikas Chandra, Yunyang Xiong, and Mohamed Elhoseiny. Minigpt-v2: large language model as a unified interface for vision-language multi-task learning. arXiv preprint arXiv:2310.09478, 2023.
- Congan et al. [2022] XU Congan, SU Hang, LI Jianwei, LIU Yu, YAO Libo, GAO Long, YAN Wenjun, and WANG Taoyang. Rsdd-sar: Rotated ship detection dataset in sar images. Journal of Radars, 11(4):581–599, 2022.
- Cubuk et al. [2019a] Ekin Dogus Cubuk, Barret Zoph, Dandelion Mané, Vijay Vasudevan, and Quoc V. Le. Autoaugment: Learning augmentation strategies from data. Proceedings of the IEEE/CVF Conference on Computer Vision and Pattern Recognition, pages 113–123, 2019a.
- Cubuk et al. [2019b] Ekin D Cubuk, Barret Zoph, Dandelion Mane, Vijay Vasudevan, and Quoc V Le. Autoaugment: Learning augmentation strategies from data. In Proceedings of the IEEE/CVF conference on computer vision and pattern recognition, pages 113–123, 2019b.
- Cubuk et al. [2020] Ekin D Cubuk, Barret Zoph, Jonathon Shlens, and Quoc V Le. Randaugment: Practical automated data augmentation with a reduced search space. In Proceedings of the IEEE/CVF conference on computer vision and pattern recognition workshops, pages 702–703, 2020.
- Ding et al. [2021] Jian Ding, Nan Xue, Gui-Song Xia, Xiang Bai, Wen Yang, Michael Ying Yang, Serge Belongie, Jiebo Luo, Mihai Datcu, Marcello Pelillo, et al. Object detection in aerial images: A large-scale benchmark and challenges. IEEE Transactions on Pattern Analysis and Machine Intelligence, 44(11):7778–7796, 2021.
- Dunford et al. [2014] Rosie Dunford, Quanrong Su, and Ekraj Tamang. The pareto principle. The Race, 2014.
- Esser et al. [2020] Patrick Esser, Robin Rombach, and Björn Ommer. Taming transformers for high-resolution image synthesis. Proceedings of the IEEE/CVF Conference on Computer Vision and Pattern Recognition, pages 12868–12878, 2020.
- Gal et al. [2022] Rinon Gal, Or Patashnik, Haggai Maron, Amit H Bermano, Gal Chechik, and Daniel Cohen-Or. Stylegan-nada: Clip-guided domain adaptation of image generators. ACM Transactions on Graphics, 41(4):1–13, 2022.
- Gal et al. [2023] Rinon Gal, Yuval Alaluf, Yuval Atzmon, Or Patashnik, Amit H. Bermano, Gal Chechik, and Daniel Cohen-Or. An image is worth one word: Personalizing text-to-image generation using textual inversion. The Eleventh International Conference on Learning Representations, abs/2208.01618, 2023.
- He et al. [2023] Ruifei He, Shuyang Sun, Xin Yu, Chuhui Xue, Wenqing Zhang, Philip H. S. Torr, Song Bai, and Xiaojuan Qi. Is synthetic data from generative models ready for image recognition? The Eleventh International Conference on Learning Representations, abs/2210.07574, 2023.
- Heusel et al. [2017] Martin Heusel, Hubert Ramsauer, Thomas Unterthiner, Bernhard Nessler, and Sepp Hochreiter. Gans trained by a two time-scale update rule converge to a local nash equilibrium. Advances in Neural Information Processing Systems, 30, 2017.
- Hou et al. [2020] Xiyue Hou, Wei Ao, Qian Song, Jian Lai, Haipeng Wang, and Feng Xu. Fusar-ship: Building a high-resolution sar-ais matchup dataset of gaofen-3 for ship detection and recognition. Science China Information Sciences, 63:1–19, 2020.
- Hu et al. [2022] J. Edward Hu, Yelong Shen, Phillip Wallis, Zeyuan Allen-Zhu, Yuanzhi Li, Shean Wang, and Weizhu Chen. Lora: Low-rank adaptation of large language models. The Tenth International Conference on Learning Representations, abs/2106.09685, 2022.
- Karras et al. [2020] Tero Karras, Samuli Laine, Miika Aittala, Janne Hellsten, Jaakko Lehtinen, and Timo Aila. Analyzing and improving the image quality of stylegan. In Proceedings of IEEE/CVF conference on computer vision and pattern recognition, pages 8110–8119, 2020.
- Khader et al. [2022] Firas Khader, Gustav Mueller-Franzes, Soroosh Tayebi Arasteh, Tianyu Han, Christoph Haarburger, Maximilian Schulze-Hagen, Philipp Schad, Sandy Engelhardt, Bettina Baessler, Sebastian Foersch, et al. Medical diffusion–denoising diffusion probabilistic models for 3d medical image generation. arXiv preprint arXiv:2211.03364, 2022.
- Kim et al. [2022] Seongtae Kim, Kyoungkook Kang, Geonung Kim, Seung-Hwan Baek, and Sunghyun Cho. Dynagan: Dynamic few-shot adaptation of gans to multiple domains. In SIGGRAPH Asia, pages 1–8, 2022.
- Kotsiantis et al. [2006] Sotiris Kotsiantis, Dimitris Kanellopoulos, Panayiotis Pintelas, et al. Handling imbalanced datasets: A review. GESTS International Transactions on Computer Science and Engineering, 30(1):25–36, 2006.
- Kwon et al. [2023] Mingi Kwon, Jaeseok Jeong, and Youngjung Uh. Diffusion models already have a semantic latent space. The Eleventh International Conference on Learning Representations, abs/2210.10960, 2023.
- Lei et al. [2021] Songlin Lei, Dongdong Lu, Xiaolan Qiu, and Chibiao Ding. Srsdd-v1. 0: A high-resolution sar rotation ship detection dataset. Remote Sensing, 13(24):5104, 2021.
- Li et al. [2017] Boying Li, Bin Liu, Lanqing Huang, Weiwei Guo, Zenghui Zhang, and Wenxian Yu. Opensarship 2.0: A large-volume dataset for deeper interpretation of ship targets in sentinel-1 imagery. In 2017 SAR in Big Data Era: Models, Methods and Applications (BIGSARDATA), pages 1–5. IEEE, 2017.
- Li et al. [2020] Yu Li, Tao Wang, Bingyi Kang, Sheng Tang, Chunfeng Wang, Jintao Li, and Jiashi Feng. Overcoming classifier imbalance for long-tail object detection with balanced group softmax. In Proceedings of the IEEE/CVF conference on computer vision and pattern recognition, pages 10991–11000, 2020.
- Liu et al. [2019] Ziwei Liu, Zhongqi Miao, Xiaohang Zhan, Jiayun Wang, Boqing Gong, and Stella X Yu. Large-scale long-tailed recognition in an open world. In Proceedings of the IEEE/CVF conference on computer vision and pattern recognition, pages 2537–2546, 2019.
- Mikubill [2023] Mikubill. Webui extension for controlnet. https://github.com/Mikubill/sd-webui-controlnet, 2023.
- MMClassification [2021] MMClassification. Autoaug and randaug policies in mmclassification. https://github.com/open-mmlab/mmpretrain/tree/master/configs/_base_/datasets/pipelines, 2021.
- Mou et al. [2023] Chong Mou, Xintao Wang, Liangbin Xie, Jian Zhang, Zhongang Qi, Ying Shan, and Xiaohu Qie. T2i-adapter: Learning adapters to dig out more controllable ability for text-to-image diffusion models. arXiv preprint arXiv:2302.08453, 2023.
- Nichol et al. [2021] Alex Nichol, Prafulla Dhariwal, Aditya Ramesh, Pranav Shyam, Pamela Mishkin, Bob McGrew, Ilya Sutskever, and Mark Chen. Glide: Towards photorealistic image generation and editing with text-guided diffusion models. In International Conference on Machine Learning, 2021.
- Ojha et al. [2021] Utkarsh Ojha, Yijun Li, Cynthia Lu, Alexei A. Efros, Yong Jae Lee, Eli Shechtman, and Richard Zhang. Few-shot image generation via cross-domain correspondence. Proceedings of the IEEE/CVF Conference on Computer Vision and Pattern Recognition, 2021.
- OpenAI [2023] OpenAI. Gpt-4 technical report, 2023.
- Paolo et al. [2022] Fernando Paolo, Tsu-ting Tim Lin, Ritwik Gupta, Bryce Goodman, Nirav Patel, Daniel Kuster, David Kroodsma, and Jared Dunnmon. xview3-sar: Detecting dark fishing activity using synthetic aperture radar imagery. Advances in Neural Information Processing Systems, 35:37604–37616, 2022.
- Radford et al. [2021] Alec Radford, Jong Wook Kim, Chris Hallacy, Aditya Ramesh, Gabriel Goh, Sandhini Agarwal, Girish Sastry, Amanda Askell, Pamela Mishkin, Jack Clark, Gretchen Krueger, and Ilya Sutskever. Learning transferable visual models from natural language supervision. In International Conference on Machine Learning, 2021.
- Raffel et al. [2019] Colin Raffel, Noam M. Shazeer, Adam Roberts, Katherine Lee, Sharan Narang, Michael Matena, Yanqi Zhou, Wei Li, and Peter J. Liu. Exploring the limits of transfer learning with a unified text-to-text transformer. Transactions on Machine Learning Research, 21:140:1–140:67, 2019.
- Ridnik et al. [2021] Tal Ridnik, Emanuel Ben-Baruch, Asaf Noy, and Lihi Zelnik-Manor. Imagenet-21k pretraining for the masses. Thirty-fifth Conference on Neural Information Processing Systems Datasets and Benchmarks Track, 2021.
- Rombach et al. [2021] Robin Rombach, A. Blattmann, Dominik Lorenz, Patrick Esser, and Björn Ommer. High-resolution image synthesis with latent diffusion models. Proceedings of the IEEE/CVF Conference on Computer Vision and Pattern Recognition, pages 10674–10685, 2021.
- Ruiz et al. [2023a] Nataniel Ruiz, Yuanzhen Li, Varun Jampani, Yael Pritch, Michael Rubinstein, and Kfir Aberman. Dreambooth: Fine tuning text-to-image diffusion models for subject-driven generation. Proceedings of the IEEE/CVF Conference on Computer Vision and Pattern Recognition, pages 22500–22510, 2023a.
- Ruiz et al. [2023b] Nataniel Ruiz, Yuanzhen Li, Varun Jampani, Wei Wei, Tingbo Hou, Yael Pritch, Neal Wadhwa, Michael Rubinstein, and Kfir Aberman. Hyperdreambooth: Hypernetworks for fast personalization of text-to-image models. ArXiv, abs/2307.06949, 2023b.
- RunwayML [2023] RunwayML. Stable diffusion v1.5. https://huggingface.co/runwayml/stable-diffusion-v1-5, 2023.
- Saharia et al. [2022] Chitwan Saharia, William Chan, Saurabh Saxena, Lala Li, Jay Whang, Emily L. Denton, Seyed Kamyar Seyed Ghasemipour, Burcu Karagol Ayan, Seyedeh Sara Mahdavi, Raphael Gontijo Lopes, Tim Salimans, Jonathan Ho, David J. Fleet, and Mohammad Norouzi. Photorealistic text-to-image diffusion models with deep language understanding. Advances in Neural Information Processing Systems, abs/2205.11487, 2022.
- Schuhmann et al. [2022] Christoph Schuhmann, Romain Beaumont, Richard Vencu, Cade Gordon, Ross Wightman, Mehdi Cherti, Theo Coombes, Aarush Katta, Clayton Mullis, Mitchell Wortsman, Patrick Schramowski, Srivatsa Kundurthy, Katherine Crowson, Ludwig Schmidt, Robert Kaczmarczyk, and Jenia Jitsev. Laion-5b: An open large-scale dataset for training next generation image-text models. Advances in Neural Information Processing Systems, abs/2210.08402, 2022.
- Shi et al. [2021] Xianzheng Shi, Shilei Fu, Jin Chen, Feng Wang, and Feng Xu. Object-level semantic segmentation on the high-resolution gaofen-3 fusar-map dataset. IEEE Journal of Selected Topics in Applied Earth Observations and Remote Sensing, 14:3107–3119, 2021.
- Shi et al. [2023] Yujun Shi, Chuhui Xue, Jiachun Pan, Wenqing Zhang, Vincent Y. F. Tan, and Song Bai. Dragdiffusion: Harnessing diffusion models for interactive point-based image editing. ArXiv, abs/2306.14435, 2023.
- Shorten and Khoshgoftaar [2019a] Connor Shorten and Taghi M. Khoshgoftaar. A survey on image data augmentation for deep learning. Journal of Big Data, 6:1–48, 2019a.
- Shorten and Khoshgoftaar [2019b] Connor Shorten and Taghi M Khoshgoftaar. A survey on image data augmentation for deep learning. Journal of big data, 6(1):1–48, 2019b.
- Wang et al. [2021] Tong Wang, Yousong Zhu, Chaoyang Zhao, Wei Zeng, Jinqiao Wang, and Ming Tang. Adaptive class suppression loss for long-tail object detection. In Proceedings of the IEEE/CVF conference on computer vision and pattern recognition, pages 3103–3112, 2021.
- Wang et al. [2017] Ting-Chun Wang, Ming-Yu Liu, Jun-Yan Zhu, Andrew Tao, Jan Kautz, and Bryan Catanzaro. High-resolution image synthesis and semantic manipulation with conditional gans. Proceedings of the IEEE/CVF Conference on Computer Vision and Pattern Recognition, pages 8798–8807, 2017.
- Wang et al. [2019] Yuanyuan Wang, Chao Wang, Hong Zhang, Yingbo Dong, and Sisi Wei. A sar dataset of ship detection for deep learning under complex backgrounds. Remote Sensing, 11(7):765, 2019.
- Wang et al. [2023] Zhirui Wang, Yuzhuo Kang, Xuan Zeng, et al. Sar-aircraft-1.0: High-resolution sar aircraft detection and recognition dataset. Journal of Radars, 12(4):906–922, 2023.
- Wei et al. [2020] Shunjun Wei, Xiangfeng Zeng, Qizhe Qu, Mou Wang, Hao Su, and Jun Shi. Hrsid: A high-resolution sar images dataset for ship detection and instance segmentation. IEEE Access, 8:120234–120254, 2020.
- Yang et al. [2023] Ceyuan Yang, Yujun Shen, Zhiyi Zhang, Yinghao Xu, Jiapeng Zhu, Zhirong Wu, and Bolei Zhou. One-shot generative domain adaptation. Proceedings of the IEEE/CVF International Conference on Computer Vision, 2023.
- Yun et al. [2019] Sangdoo Yun, Dongyoon Han, Seong Joon Oh, Sanghyuk Chun, Junsuk Choe, and Young Joon Yoo. Cutmix: Regularization strategy to train strong classifiers with localizable features. Proceedings of the IEEE/CVF International Conference on Computer Vision, pages 6022–6031, 2019.
- Zhang and Agrawala [2023] Lvmin Zhang and Maneesh Agrawala. Adding conditional control to text-to-image diffusion models. Proceedings of the IEEE/CVF International Conference on Computer Vision, abs/2302.05543, 2023.
- Zhang et al. [2020] Tianwen Zhang, Xiaoling Zhang, Xiao Ke, Xu Zhan, Jun Shi, Shunjun Wei, Dece Pan, Jianwei Li, Hao Su, Yue Zhou, et al. Ls-ssdd-v1. 0: A deep learning dataset dedicated to small ship detection from large-scale sentinel-1 sar images. Remote Sensing, 12(18):2997, 2020.
- Zhang et al. [2021a] Tianwen Zhang, Xiaoling Zhang, Jianwei Li, Xiaowo Xu, Baoyou Wang, Xu Zhan, Yanqin Xu, Xiao Ke, Tianjiao Zeng, Hao Su, et al. Sar ship detection dataset (ssdd): Official release and comprehensive data analysis. Remote Sensing, 13(18):3690, 2021a.
- Zhang et al. [2022] Yifan Zhang, Daquan Zhou, Bryan Hooi, Kaixin Wang, and Jiashi Feng. Expanding small-scale datasets with guided imagination. ArXiv, abs/2211.13976, 2022.
- Zhang et al. [2021b] Zhengning Zhang, Lin Zhang, Yue Wang, Pengming Feng, and Ran He. Shiprsimagenet: A large-scale fine-grained dataset for ship detection in high-resolution optical remote sensing images. IEEE Journal of Selected Topics in Applied Earth Observations and Remote Sensing, 14:8458–8472, 2021b.
- Zhao et al. [2023] Shihao Zhao, Dongdong Chen, Yen-Chun Chen, Jianmin Bao, Shaozhe Hao, Lu Yuan, and Kwan-Yee K. Wong. Uni-controlnet: All-in-one control to text-to-image diffusion models. ArXiv, abs/2305.16322, 2023.
- Zhong et al. [2017] Zhun Zhong, Liang Zheng, Guoliang Kang, Shaozi Li, and Yi Yang. Random erasing data augmentation. Proceedings of the AAAI Conference on Artificial Intelligence, 2017.
- Zhu et al. [2023] Deyao Zhu, Jun Chen, Xiaoqian Shen, Xiang Li, and Mohamed Elhoseiny. Minigpt-4: Enhancing vision-language understanding with advanced large language models. arXiv preprint arXiv:2304.10592, 2023.
Supplementary materials
This appendix is organized as follows:
-
•
Section A justifies the weight used in pLoRA (Eq. (3)).
-
•
Section B provides implementation details of comparison experiments. We also elaborate on the data pre-processing details.
-
•
Section C shows additional experimental results and findings, including:
-
◦
Combination of our method with conventional data augmentation methods (line 574 in Section 5).
-
◦
Visualization of cluster samples (Figure 3).
-
◦
Visualization of our synthetic images (line 584 in Section 5).
-
◦
Impact of different LoRA ranks.
-
◦
Using a smaller training dataset.
-
◦
A Justification
Justification of weight in Eq. (3). We justify that the combination weight makes pLoRA less prone to data bias problems then 2LoRA or LoRA. Take the “fishing” ship generation as an example:
1) In 2LoRA or LoRA, we use the entire training dataset (see Table S1 last row), where “fishing” ships represent only . Here, dominant classes like “cargo” () overshadow the “fishing” class.
2) In pLoRA, alternatively, we use four feature clusters (rows 1-4 in Table S1) to train four prototype LoRAs. For the ”fishing” ship class, take clusters and as examples: cluster contains a higher proportion ( in row 3), while has less ( in row 4). Thus, “fishing” receives a higher weight in (i.e., ), and a lower weight in (i.e., ). Compared with 2LoRA, by using this weight , our pLoRA avoids over-reliance on biased knowledge.
| Clusters | Categories | ||||
|---|---|---|---|---|---|
| cargo | other | fishing | tanker | dredger | |
| All | 49.4% | 28.1% | 13.4% | 5.2% | 4.0% |
| 48.0% | 27.8% | 11.2% | 7.6% | 5.4% | |
| 48.3% | 31.3% | 13.7% | 3.3% | 3.4% | |
| 73.3% | 13.4% | 7.9% | 4.0% | 1.4% | |
| 35.1% | 29.4% | 34.2% | 0.9% | 0.5% | |
B Implementation Details
B.1 Implementation Details of Table 2
In Table 2, we evaluated our SAR synthesis method by augmenting datasets for fine-grained ship classification tasks. We provide implementation details as follows.
Details of compared methods. For AutoAug [9] and RandAug [10], we adhere to their original image transformation protocols (including contrast/brightness/sharpness enhancement, rotation, flipping, colour jitting, and shearing, as specified in [30]). For Oversampling [23], we double the training samples of minor classes, e.g., for the “tanker” ship with real images, we re-sample an additional images from its training data.
Details of pLoRA and 2LoRA . We train ORS LoRA for 200 epochs, and train SAR LoRAs (including prototype LoRAs) for 100 epochs. We use the cosine annealing scheduler starting with the learning rate of (with batch size ). We fine-tune the ControlNet for epochs using a learning rate of (with batch size ). During inference (image generation), we use the original inference configs of CannyEdge ControlNet [56, 29], except that we set sampling steps at , and a combination weight (with SD) at . When training the ship classifier, we use an ImageNet-21K pre-trained ResNet50 as the backbone and fine-tune it on SAR data for 100 epochs. The scheduler here also follows cosine annealing but includes a warm-up phase lasting for about 500 iterations (with batch size ). We use the SGD optimizer with a learning rate of , momentum of , and a weight decay of .
Evaluation. To ensure a fair and robust evaluation, we conduct our evaluation as follows. 1) For FIDS score evaluation, we use only the SAR ship contours to ensure a consistent real-to-synthetic image pairing. 2) In generating new training samples, all generative methods (i.e., LoRA, 2LoRA and pLoRA) are conditioned using the same set of contours. 3) For F1-Score evaluation, we average the results over five runs to enhance evaluation reliability.
B.2 Implementation Details of Table 3
In Table 3, we evaluated our SAR synthesis method by augmenting datasets for geographic semantic segmentation tasks. We provide implementation details as follows.
Details of pLoRA and 2LoRA . For LoRA training, we use the same setup as in Section B.1. For ControlNet, we use semantic segmentation maps (from the FUSAR-Map dataset itself) as conditions and train from scratch for steps with a batch size of (i.e., approximate epochs), with a combination weight (with SD) of . During inference, unlike the classification task that uses per-class sample number proportion to calculate weight , we here use per-class pixel proportion to calculate weight .
 ) indicates the MLLMs.
Details of compared methods. The implementation of AutoAug and RandAug remains the same as in Section B.1. For Oversampling, we only increase the pixel representation for minor classes (i.e., the “road” and “building”). Concretely, we selected the top of images with the highest pixel proportions for each category (for instance, from images containing the “road” class, the top were chosen). These images are then resampled until their corresponding classes’ pixel proportions reach approximately , as illustrated in Figure 4(b). Please note that our generative methods also use this selected set of images to create new samples, as introduced next.
B.3 Details of Data Processing
Details of SAR ship dataset. We choose FUSAR-Ship [18] and SRSDD [25] datasets as our source datasets because they are high-resolution (m) and have fine-grained subcategories of ships, as shown in Table S2. However, both datasets have limitations. As shown in Figure S2(a), the FUSAR-Ship dataset has insufficient test samples (i.e., certain categories have only test samples), unclear category definition (e.g., “Reserved” or “Unspecified” categories). As shown in Figure S2(b), the SRSDD dataset has insufficient test samples. To address these issues and establish a robust benchmark, we combined the ship categories from both datasets, omitting those with fewer than 10 test samples into an “others” category. We show the data distribution of the resulting dataset in Table S3. This dataset is available at this GitHub link.
| Dataset | Year | Category | Instances | Width (px) | Resolution (/px) |
|---|---|---|---|---|---|
| OpenSARShip2 [26]† | 2017 | 16 | 19,360 | 30–120 | 22m |
| SAR-Ship-Dataset [51]∗ | 2019 | 1 | 59,535 | 256 | 3m–25m |
| AIR-SARShip-2.0 [52]∗ | 2020 | 1 | 461 | 1000 | 1m, 3m |
| FUSAR-Ship [18] | 2020 | 15 | 6,358 | 512 | 0.5m |
| HRSID [53]∗ | 2020 | 1 | 16,951 | 800 | 0.5m, 1m, 3m |
| LS-SSDD-v1.0 [57]∗ | 2020 | 1 | 6,015 | 16,000 | 20m |
| Official SSDD [58]∗ | 2021 | 1 | 2,456 | 190–160 | 1m–15m |
| SRSDD-v1.0 [25] | 2021 | 6 | 2,884 | 512 | 1m |
| RSDD-SAR [7]∗ | 2022 | 1 | 10,263 | 512 | 2m–20m |
| xView3-SAR [35]† | 2023 | 2 | 243,018 | 512 | 10m |
| Split | Category | Total | ||||
|---|---|---|---|---|---|---|
| cargo | other | fishing | tanker | dredger | ||
| Train | 3,890 | 1,710 | 814 | 315 | 242 | 6,971 |
| Deci | 389 | 171 | 81 | 32 | 24 | 696 |
| Val | 484 | 213 | 102 | 40 | 30 | 869 |
| Test | 772 | 216 | 161 | 59 | 52 | 1,260 |
| Total | 5,146 | 2,139 | 1,077 | 414 | 324 | 9,100 |
Details of ORS ship dataset. We combined the DOTAv2 [11] and the ShipRSImageNet [60] datasets to build our ORS dataset. Especially, because the DOTAv2 dataset is originally a detection dataset, we crop out the ship/harbour instances (total instances) as image patches. This dataset is available at the GitHub link.
| Method | cargo | other | fishing | tanker | dredger | AvgF1 | F1m | ||||||||||
|---|---|---|---|---|---|---|---|---|---|---|---|---|---|---|---|---|---|
| Prec.(%) | Rec.(%) | F1(%) | Prec. | Rec. | F1 | Prec. | Rec. | F1 | Prec. | Rec. | F1 | Prec. | Rec. | F1 | |||
| Oversampling | 89.36 | 92.49 | 90.90 | 70.56 | 75.46 | 72.93 | 65.47 | 56.52 | 60.67 | 40.82 | 33.90 | 37.04 | 64.29 | 51.92 | 57.45 | 63.80 | 51.72 |
| Fine-Tune | 89.38 | 92.62 | 90.97 | 71.56 | 74.54 | 73.02 | 64.54 | 56.52 | 60.26 | 36.00 | 30.51 | 33.03 | 59.09 | 50.00 | 54.17 | 62.29 | 49.15 |
| 2LoRA | 90.58 | 93.39 | 91.96 | 72.53 | 78.24 | 75.28 | 68.12 | 58.39 | 62.88 | 44.00 | 37.29 | 40.37 | 67.44 | 55.77 | 61.05 | 66.31 | 54.77 |
| pLoRA | 91.11 | 90.28 | 90.70 | 67.21 | 76.85 | 71.71 | 63.57 | 50.93 | 56.55 | 42.37 | 42.37 | 42.37 | 60.00 | 69.23 | 64.29 | 65.12 | 54.40 |
Prompt construction. To facilitate understanding of Section 4.1 in the main paper, we illustrate the prompt construction workflow in Figure S1. The detailed prompt construction process (i.e., chat history with GPT-4 or MiniGPTv2) is available in the GitHub link.
| Rank | Params (M) | cargo | fishing | tanker | dredger | ||||
|---|---|---|---|---|---|---|---|---|---|
| FIDS | F1 | FIDS | F1 | FIDS | F1 | FIDS | F1 | ||
| 4 | 0.0797 | 0.9042 | 0.9351 | 0.9290 | 0.7088 | 1.0714 | 0.6296 | 1.1296 | 0.8214 |
| 8 | 0.1594 | 0.8504 | 0.9338 | 0.8970 | 0.7092 | 1.1492 | 0.5981 | 1.0079 | 0.8142 |
| 16 | 0.3188 | 0.8479 | 0.9338 | 0.9301 | 0.7063 | 1.0227 | 0.6182 | 0.9670 | 0.8214 |
| 32 | 0.6377 | 0.8519 | 0.9344 | 0.9094 | 0.7138 | 1.0907 | 0.6038 | 1.0714 | 0.8000 |
| Method | cargo | fishing | tanker | dredger | AvgF1 |
|---|---|---|---|---|---|
| Augmented dataset | 91.78 | 71.53 | 63.79 | 84.48 | 77.90 |
| + Oversampling | 91.60 | 72.29 | 64.95 | 82.96 | 77.95 |
| + RandAug | 92.46 | 72.10 | 64.82 | 85.26 | 78.66 |
C Additional Results
Combined with conventional augmentation. Our method is compatible with conventional data augmentation techniques, as our synthetic images are adaptable to go through a second step of data augmentation using traditional augmentation methods. We show the results of using Oversampling [23] and RandAug [10] (as a second step of data augmentation after our method) in Table S6.
Visualization of more cluster samples (Fig. 3). After feature clustering, the resulting clusters capture distinct visual representations, such as ship characteristics (e.g., “fast-moving”, “in the harbor”, or “small-sized”) and weather conditions (e.g., “foggy”). See Figure S3 for examples. This supplements the Figure 3 in the main paper.
Decimal training set. To define an even more severe data-shortage problem, we split a “Deci” set, where “Deci” means Decimal (one-tenth) of the training set, by randomly sampling samples from the whole training data (as shown by “Deci” row in Table S3). We show experimental results by using the models trained on this “Deci” set in Table S4: pLoRA and 2LoRA consistently surpass the other methods. Notably, pLoRA appears predominantly focused on enhancing the performance of minor classes, whereas 2LoRA brings improvements for both minor and major classes.
LoRA ranks. The rank of the LoRA component controls the number of learnable parameters (i.e., the rank is a hyperparameter). As shown in Table S5, we compare the FIDS and F1-Score of 2LoRA generated images with different LoRA ranks. Please note this is an exploratory study, not for hyperparameter optimization. Hence, we report test set results rather than validation results.
Visualization of more synthetic images (Fig.5). Supplementing the Figure 5, we show more qualitative comparison results in Figure S4.