Comparison of interband related optical transitions and excitons in ZnGeN2 and GaN
Abstract
The optical dielectric function of ZnGeN2 is calculated from the interband transitions using the energy bands calculated in the quasiparticle self-consistent (QS) method using two different levels of approximation: the independent particle approximation (IPA) and the Bethe-Salpeter Equation (BSE) approach. The first allows us to relate peaks in to specific bands and k-points but does not include electron-hole interaction effects. The second includes electron-hole interaction or excitonic effects. The corresponding changes in the shape of are found to be similar to those in GaN. The screened Coulomb interaction is here calculated including electron-hole interactions in the polarization function and gives a band structure already going beyond the random phase approximation. The static dielectric constants including only electronic screening, commonly referred to as , were calculated separately by extrapolating the wave vector dependent macroscopic for . Below the quasiparticle gap, we find three bound excitons optically active for different polarization. The convergence of these bound excitons with respect to the density of the k-mesh used in the BSE is studied and found to require a fine mesh. It is also found that these bound excitons originate from only the lowest conduction band and the top three valence bands. To incorporate the lattice screening, we include a scaling factor , which allows us to obtain exciton binding energies of the correct order of magnitude similar to those in GaN. The excitons are related to each of the three fold split valence bands and the splittings of the latter are also studied as function of strain. Finally, a relation between the anisotropic effective masses and the valence band splitting is pointed out and explained.
I Introduction
ZnGeN2 is a heterovalent ternary semiconductor closely related to wurtzite GaN. The structure, which is the ground state structure, corresponds to a specific ordering of the divalent Zn and tetravalent Ge ions on the cation sublattice of wurtzite, in which each N is surrounded by two Zn and two Ge, thus locally obeying the octet rule. The resulting orthorhombic symmetry lowering leads to some distortion of the parent hexagonal lattice vectors away from the perfect , and , with and are the corresponding wurtzite lattice constants. (Unlike in some of our previous papers on these materials, we here use the standard setting of the space group of the International Tables of X-ray Crystallography.) ZnGeN2 and other heterovalent II-IV-N2 ternaries have recently received increasing attention as being complementary to the well-studied III-N semiconductors, providing several opportunities for increased flexibility in tuning their properties. Several recent reviews are available on the current state of knowledge on crystal growth, electronic band structure, phonon, elastic, piezoelectric and defect properties of these materials [1, 2, 3].
Specifically for the Zn based Zn-IV-N2, the electronic band structure was previously calculated [4] using the quasiparticle self-consistent method, which is one of the most accurate and predictive methods available. It uses many-body-perturbation theory in the approximation due to Hedin [5, 6] where is the one-electron Green’s function and is the screened Coulomb interaction. The quasiparticle self-consistent version [7, 8] of this method, named QS, optimizes the non-interacting , from which the dynamic self-energy effects are calculated as , by extracting a static (i.e. energy independent) and Hermitian () but non-local exchange-correlation potential . This self-energy is obtained in the basis of eigenstates of , and by iterating , with the exchange-correlation potential in the initial , to convergence. It thereby becomes independent of the starting which is usually taken as the density functional theory (DFT) Kohn-Sham Hamiltonian in either the local density approximation (LDA) or the generalized gradient approximation (GGA). The quasiparticle energies then become identical to the Kohn-Sham eigenvalues at convergence, hence the name “quasiparticle” self-consistent. However, the Hamiltonian is then no longer a Kohn-Sham Hamiltonian in the DFT sense, since it is not the functional derivative of a corresponding DFT total energy anymore.
Here we revisit the QS calculations of ZnGeN2 for various reasons. First, there have been recent improvements in the QS method including electron-hole effects in the screening of . Second, the Questaal codes [9, 10] used for these calculations have been made more efficient, which allows us to check the convergence with stricter criteria. Third, the structural parameters used in previous calculations [4] were, in retrospect, not fully optimized. The main difference is that the larger ratio leads to a different ordering of the top two valence bands as will be discussed in Section III.5. The structural parameters were already corrected in [11]. To extract the best possible band structure and optical properties, we here use the experimental crystal structure parameters ( Å, Å, and Å). The first focus of the paper is on calculating the optical dielectric function and analyzing it in terms of band-to-band transitions. To do this we calculate the optical dielectric function in the continuum region above the quasiparticle gap in the independent particle approximation (IPA) and including electron-hole interaction effects using the Bethe-Salpeter Equation (BSE) approach. We also perform similar calculations for the parent compound GaN to highlight the similarities in optical properties and to facilitate the comparison by considering the band structure folding effects from the GaN wurtzite Brillouin zone to the Brillouin zone.
Our second aim is to understand the valence band maximum splitting and the resulting exciton fine-structure below the band-to-band continuum. We study the convergence of the exciton gaps with increasingly finer k-mesh near and show how their polarization is related to the symmetry of the valence bands involved and study their dependence on strain. Finally, we point out a relation of the symmetry of the top three valence bands to the anisotropy of the effective mass tensor of each of these bands.
II Computational Method
As already mentioned, the calculations in this study are carried out using the Questaal code suite [10], which implements the density functional theory (DFT) using a full-potential linearized muffin-tin-orbital (FP-LMTO) basis set and extends beyond DFT to many-body-perturbation theory by incorporating the and BSE methods. For details about the QS method, see Ref. 8 and for a full description of the FP-LMTO method, see Ref. 10. While the QS method is a great advance compared to DFT calculations in terms of the accuracy of band gaps and other band structure features, it tends to somewhat overestimate the band gaps because it underestimates the screening by not incorporating the electron-hole interactions in the screening of the screened Coulomb interaction , where is the bare Coulomb interaction and is the two-point polarization propagator. This is commonly known as the random phase approximation (RPA). Calculations using an exchange-correlation kernel , extracted from BSE calculations or using a bootstrap kernel approximation [12, 13] within time-dependent DFT (TDDFT), i.e. , have shown that this tends to reduce the self-energy by a factor of 0.8 and this has lead to the commonly used approach, namely the approximation [14, 15, 16]. That approach was also used in the previous calculations on ZnGeN2 [4, 11].
Recently, a new approach, calculating directly the four-point polarization function via a BSE at all -points and then recontracting it to two-point function was introduced by Cunningham et al. [17, 18, 19]. This approach is equivalent to adding a vertex correction to the polarization function in the Hedin set of equations with the vertex based on the . However, it was argued that within the spirit of the QS approach, no corresponding vertex corrections are needed in the self-energy because of the cancellation of the -factor between the coherent part of the Green’s function and the vertex. The -factor measures the reduction of the coherent quasiparticle part of the dynamic Green’s function compared to the independent particle Green’s function . Since only is made self-consistent in the QS method, not itself, the -factor is omitted. In any case, this new approach, named QS, removes the arbitrariness of an ad-hoc correction factor.
While in the previous calculations of ZnGeN2, the 0.8 approach was used, we here use the QS approach. Secondly, other factors still limit the accuracy of our previous calculations of ZnGeN2. The calculations of [4] used, in retrospect, a somewhat imperfectly relaxed crystal structure. This was later corrected in [11] where we used a GGA relaxed structure within the Perdew-Burke-Ernzerhof parametrization. Here, we prefer to use the actual experimental structure because the typical overestimate of the lattice constants, in particular the volume per unit cell, leads to an underestimation of the gap.
The present calculations also use a larger basis set than in the previous work [4, 11]. LMTO envelope functions are included with two smoothed Hankel function basis sets including up to and respectively and standard choices of the smoothing radii and Hankel function kinetic energy suitable for calculations. In addition, the Zn orbitals are treated as augmented orbitals while the are included as local orbital to better represent the high-lying conduction band states. For Ge, the semi-core orbitals are included as local orbital while the are augmented orbitals. Augmentation inside the spheres is done up to . By augmentation we mean that the expansion in spherical harmonics of a basis envelope function centered on one site about another site is replaced by a combination of the solutions of the radial Schrödinger equation at a linearization energy and its energy derivative that matches the envelope in value and slope. This expansion is carried out by means of structure constants. All calculations are including scalar relativistic effects in the potential. In the self-energy calculations, we include all the bands generated by this basis set. This includes bands up to about 10 Ry. Two point quantities are expanded in an auxiliary basis set of products of partial waves inside the spheres and products of interstitial plane waves. This basis set describes screening as embodied in the dielectric response function more efficiently than a plane wave expansion and thereby bypasses the need for higher conduction bands in the generation of the dielectric function. Here the subscripts label the auxiliary basis set. The short-wavelength screening is taken care of by the products of partial waves inside the spheres. Other convergence parameters include the k-mesh on which the self-energy is calculated for which we went up to and found negligible difference from the mesh. Using the atom-centered LMTO basis set the self-energy can then be expanded in real space and transformed back by Fourier transformation to a finer k-mesh used for the self-consistent charge density or spectral functions, and for the k-points along symmetry lines. In other words, the LMTO atom centered basis set serves as a Wannier-type expansion for interpolations with the difference that it is not an orthogonal basis set and thereby more localized. The self-energy matrix in the basis set of the Kohn-Sham eigenstates is fully included instead of only carrying out a perturbative calculation of the Kohn-Sham to eigenvalue shifts. To facilitate the above mentioned interpolation of the self-energy, which requires sufficiently well localized basis functions, it approximates the full self-energy matrix by a diagonal average value above a certain energy cut-off chosen to be 2.71 Ry here. This average value of the self-energy is evaluated over a range of 0.5 Ry above this cut-off. The rationale behind these approximations and other details about the method are explained in Ref. [8]
The main focus of the present paper is the optical interband transition properties. We calculate the imaginary part of the dielectric function at various levels of approximation. First, in the IPA one uses
| (1) | |||||
Here, the dielectric function is calculated as a sum over band-to-band transitions weighted by the matrix elements of the velocity operator. In this calculation we used a fine and well-converged k-mesh. In case of the bands being calculated at the QS or QS level, the non-local exchange correlation potential leads to additional terms beyond the momentum matrix elements, which involve . The advantage of this approach is that, in principle, it takes the limit exactly. However, technical difficulties in evaluating lead to some overestimate of the optical matrix elements. Alternatively, one can evaluate directly , which would involve matrix elements of rather than the commutator, at small but finite and take the limit numerically by extrapolation.
The main advantage of the sum over transitions expression of Eq. 1 is that we can take the optical function apart into its separate band-to-band contributions. Comparing these with the interband differences plotted as functions of k along symmetry lines, we can identify how peaks in the contributions are related to singularities (corresponding to critical points) or flat regions of the interband differences (corresponding to parallel bands) and therefore high joint-density of states (JDOS) contributions.
On the other hand, this approach does not include electron-hole interaction or local field effects which modify the shape of the optical dielectric function. These can be obtained within the BSE approach to many-body-perturbation theory. Here, the key step is to calculate the four-point polarization
| (2) |
with the kernel,
| (3) |
where if , and zero otherwise, is the microscopic part of the bare Coulomb interaction and we have expressed it here in terms of a plane wave basis set. The macroscopic dielectric function is then given by
| (4) |
The contribution from adds local-field effects while the contribution from , or in our case leads to the explicit excitonic effects on the dielectric function. Here, the four-point polarization depends on the coordinates, spin and time of four particles. The numbers are a short hand for position, spin and time of each particle, in other words . In practice, this integral equation is solved by introducing a resonant transition state basis set , which are products of one-particle eigenstates. Specifically,
| (5) | |||||
The polarization is then given by
| (6) |
with the two-particle Hamiltonian
| (7) |
where uses a similar expansion of in the basis functions of the one-particle Hamiltonian. In the present work a static approximation for the , hence for the kernel , and the Tamm-Dancoff approximation of only keeping resonant and not anti-resonant transitions are used. In the above, the basis state indices , can then be identified with valence bands , respectively and with conduction band states , . In the first term only direct vertical transition occur, while the kernel term mixes states at different and , as well as between different valence and conduction band pairs. In other words, the two-particle Hamiltonian of the BSE equation has dimensions with the number of valence bands, the number of conduction bands and the number of points included. The -points are taken on a regular mesh in the Brillouin zone. The equations used here and approximations follow the review paper of Onida et al. [20]. Diagonalizing this two-particle Hamiltonian yields the eigenvalues and eigenvectors of the excitons in terms of the one-particle eigenstates, from which the dielectric function can be obtained. The same cautions apply about the accuracy of the optical dipole matrix elements as mentioned above. The eigenstates of the two-particle Hamiltonian, however, are mixtures of different vertical transitions and hence the decomposition in individual band-to-band transitions, strictly speaking, no longer makes sense. We should also mention that we here only calculate the spin singlet excitons. As explained in [21], the spin structure, if no spin-polarization is present and we ignore spin-orbit coupling, can readily be taken into account. The singlet excitons then involve in the kernel in Eq. 3. For the calculations of the full energy range of we choose , which encompasses all N- derived valence bands and conduction bands up to a similar energy above the conduction band minimum. To examine the excitons in more detail we use a smaller set of and which were found to be the main contributing bands to these excitons but with a larger k-mesh which is required to converge the exciton binding energies.
III Results
III.1 Band structure
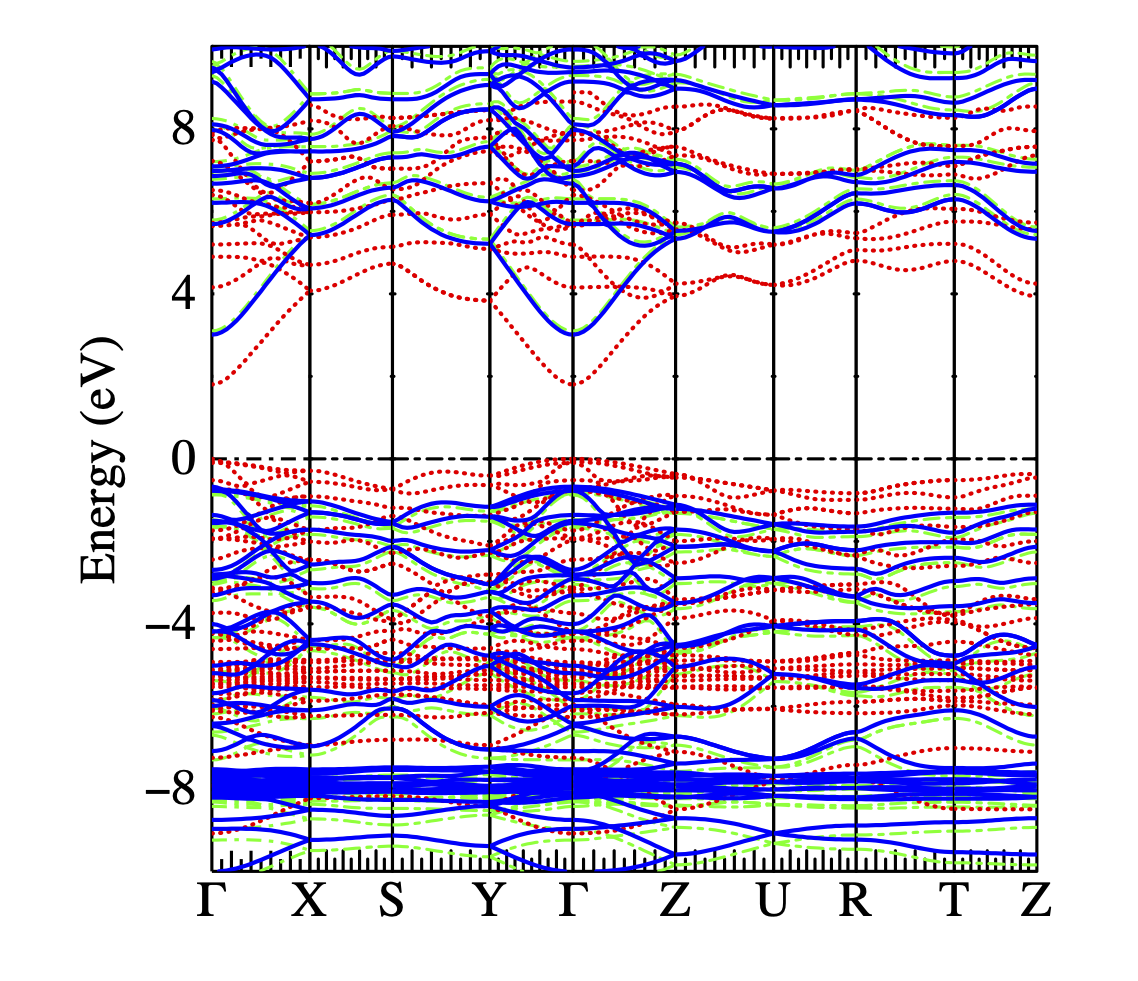
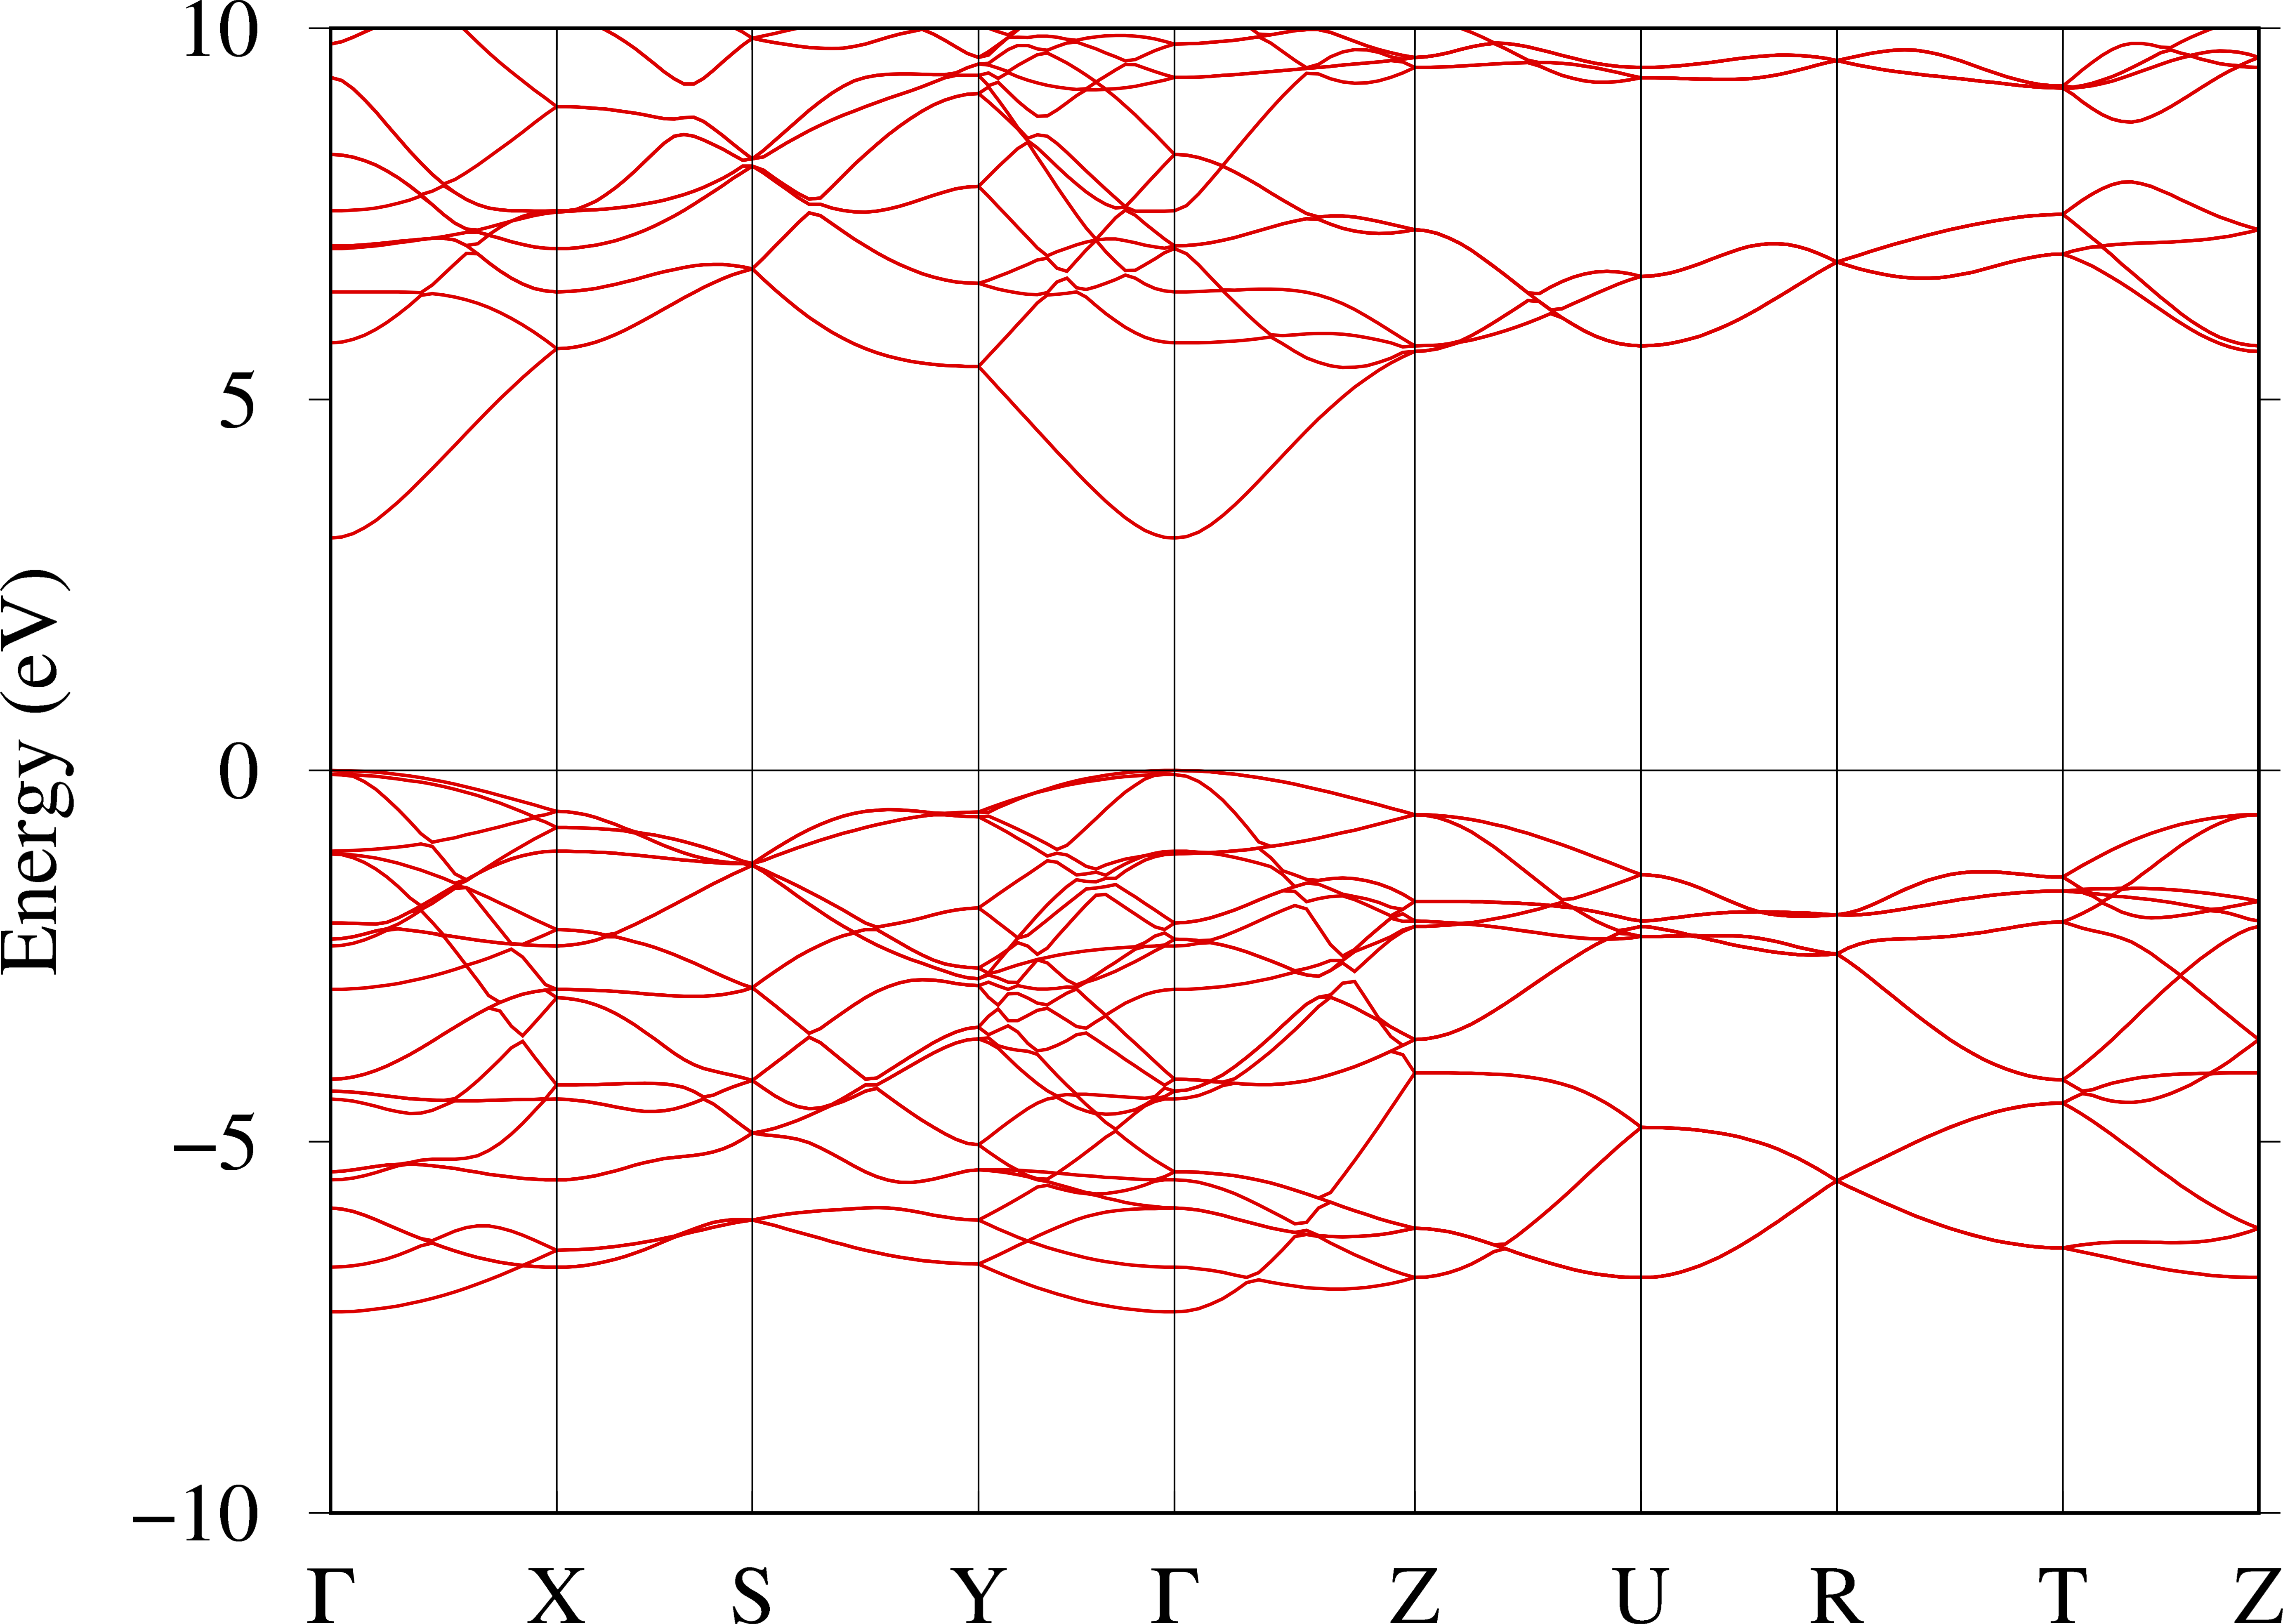
The band structure of ZnGeN2 is shown in Fig. 1 in three different approaches: GGA, QS and QS. The zero of energy is placed at the valence band maximum (VBM) of the GGA. One can thus see that in QS, the VBM shifts down by 0.77 eV while the conduction band minimum (CBM) shifts up by 1.30 eV. Adding the ladder diagrams reduces the self-energy shifts of both band edges by a small amount. The band gaps are summarized in Table 1 and for comparison, we include the corresponding results for GaN. For both QS and QS calculations we used k-mesh for ZnGe. To be consistent, an k-mesh was used for GaN. One can see that the self-energy correction to the gap and have a ratio of in ZnGeN2, and the same ratio is 0.88 for GaN. Thus, the inclusion of ladder diagrams reduces the self-energy gap correction by slightly larger than 10 %, which is somewhat smaller than the often used 20 % reduction in the 0.8 approach. We caution that this ratio is sensitive to the number of bands and in the QS calculations. We here used valence and conduction bands for ZnGeN2. To obtain the same accuracy, we use and for GaN. As seen in Table 1, using a higher reduces the gap slightly more, so that the QS to QS gap reduction factor becomes 0.81 instead of 0.88. However, this would then also lead to a smaller in the BSE calculations, which would correspondingly reduce the exciton binding energies and shifts the peaks between IPA and BSE, but the actual exciton gaps would stay similar. Furthermore, the gaps depend strongly on the lattice constants. For ZnGeN2, we had used experimental lattice constants but for GaN, the value of Å corresponds to the calculated PBE-GGA value and is slightly overestimated. Using the room temperature experimental lattice constant of 3.189 Å [22, 23], we obtain a higher gap by 0.23 eV. We should note that these gaps do not include zero-point-motion (ZPM) corrections or finite temperature corrections. The ZPM band gap renormalization is expected to be of order 0.15 eV in ZnGeN2 by comparison with GaN [24].
| GGA | QS | QS | ||
|---|---|---|---|---|
| ZnGeN2 | 1.801 | 3.874 | 3.641 | |
| GaN | Å | 1.884 | 3.868 | 3.624∗ |
| 3.487† | ||||
| Å | 1.697 | 3.638 | 3.392∗ | |
| 3.261† |
-
•
∗ was calculated using .
-
•
† was calculated using .
It is instructive to compare the band structure of ZnGeN2 with that of its parent compound GaN. The band structure of GaN in the wurtzite structure is well known and is shown in Supplementary Material [25] in the usual hexagonal Brillouin zone as obtained with the present computational method. Here we discuss how it relates to the ZnGeN2 band structure by band folding.
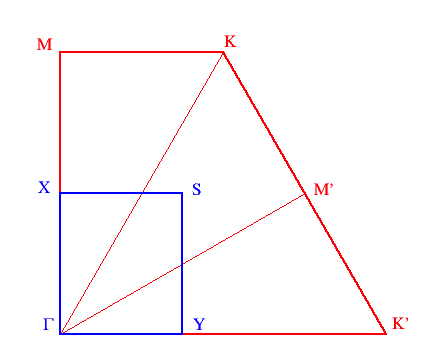
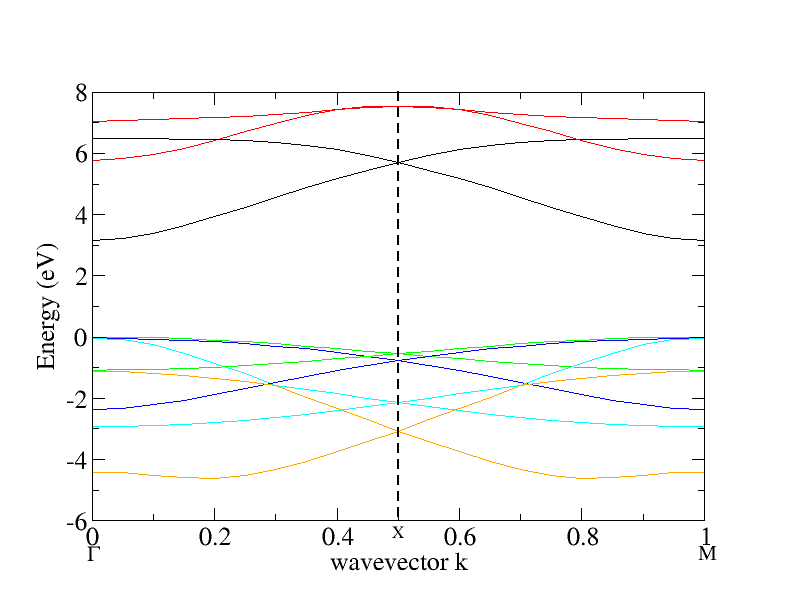
The structure can be viewed as supercell of the wurtzite, with , and . The relation of the Brillouin zone to that of wurtzite is illustrated in Fig. 2. One can see that the line will be folded about the line onto the bottom line and subsequently a second folding takes place about the line. Thus the eigenvalues of the point will now occur at but also the point is folded onto , so the same -eigenvalues will also occur at . In Fig. 3 we show how the bands along of wurtzite are found back in folded fashion along by a single folding about the point . Additional details of the band folding of are discussed in Supplementary Material [25].
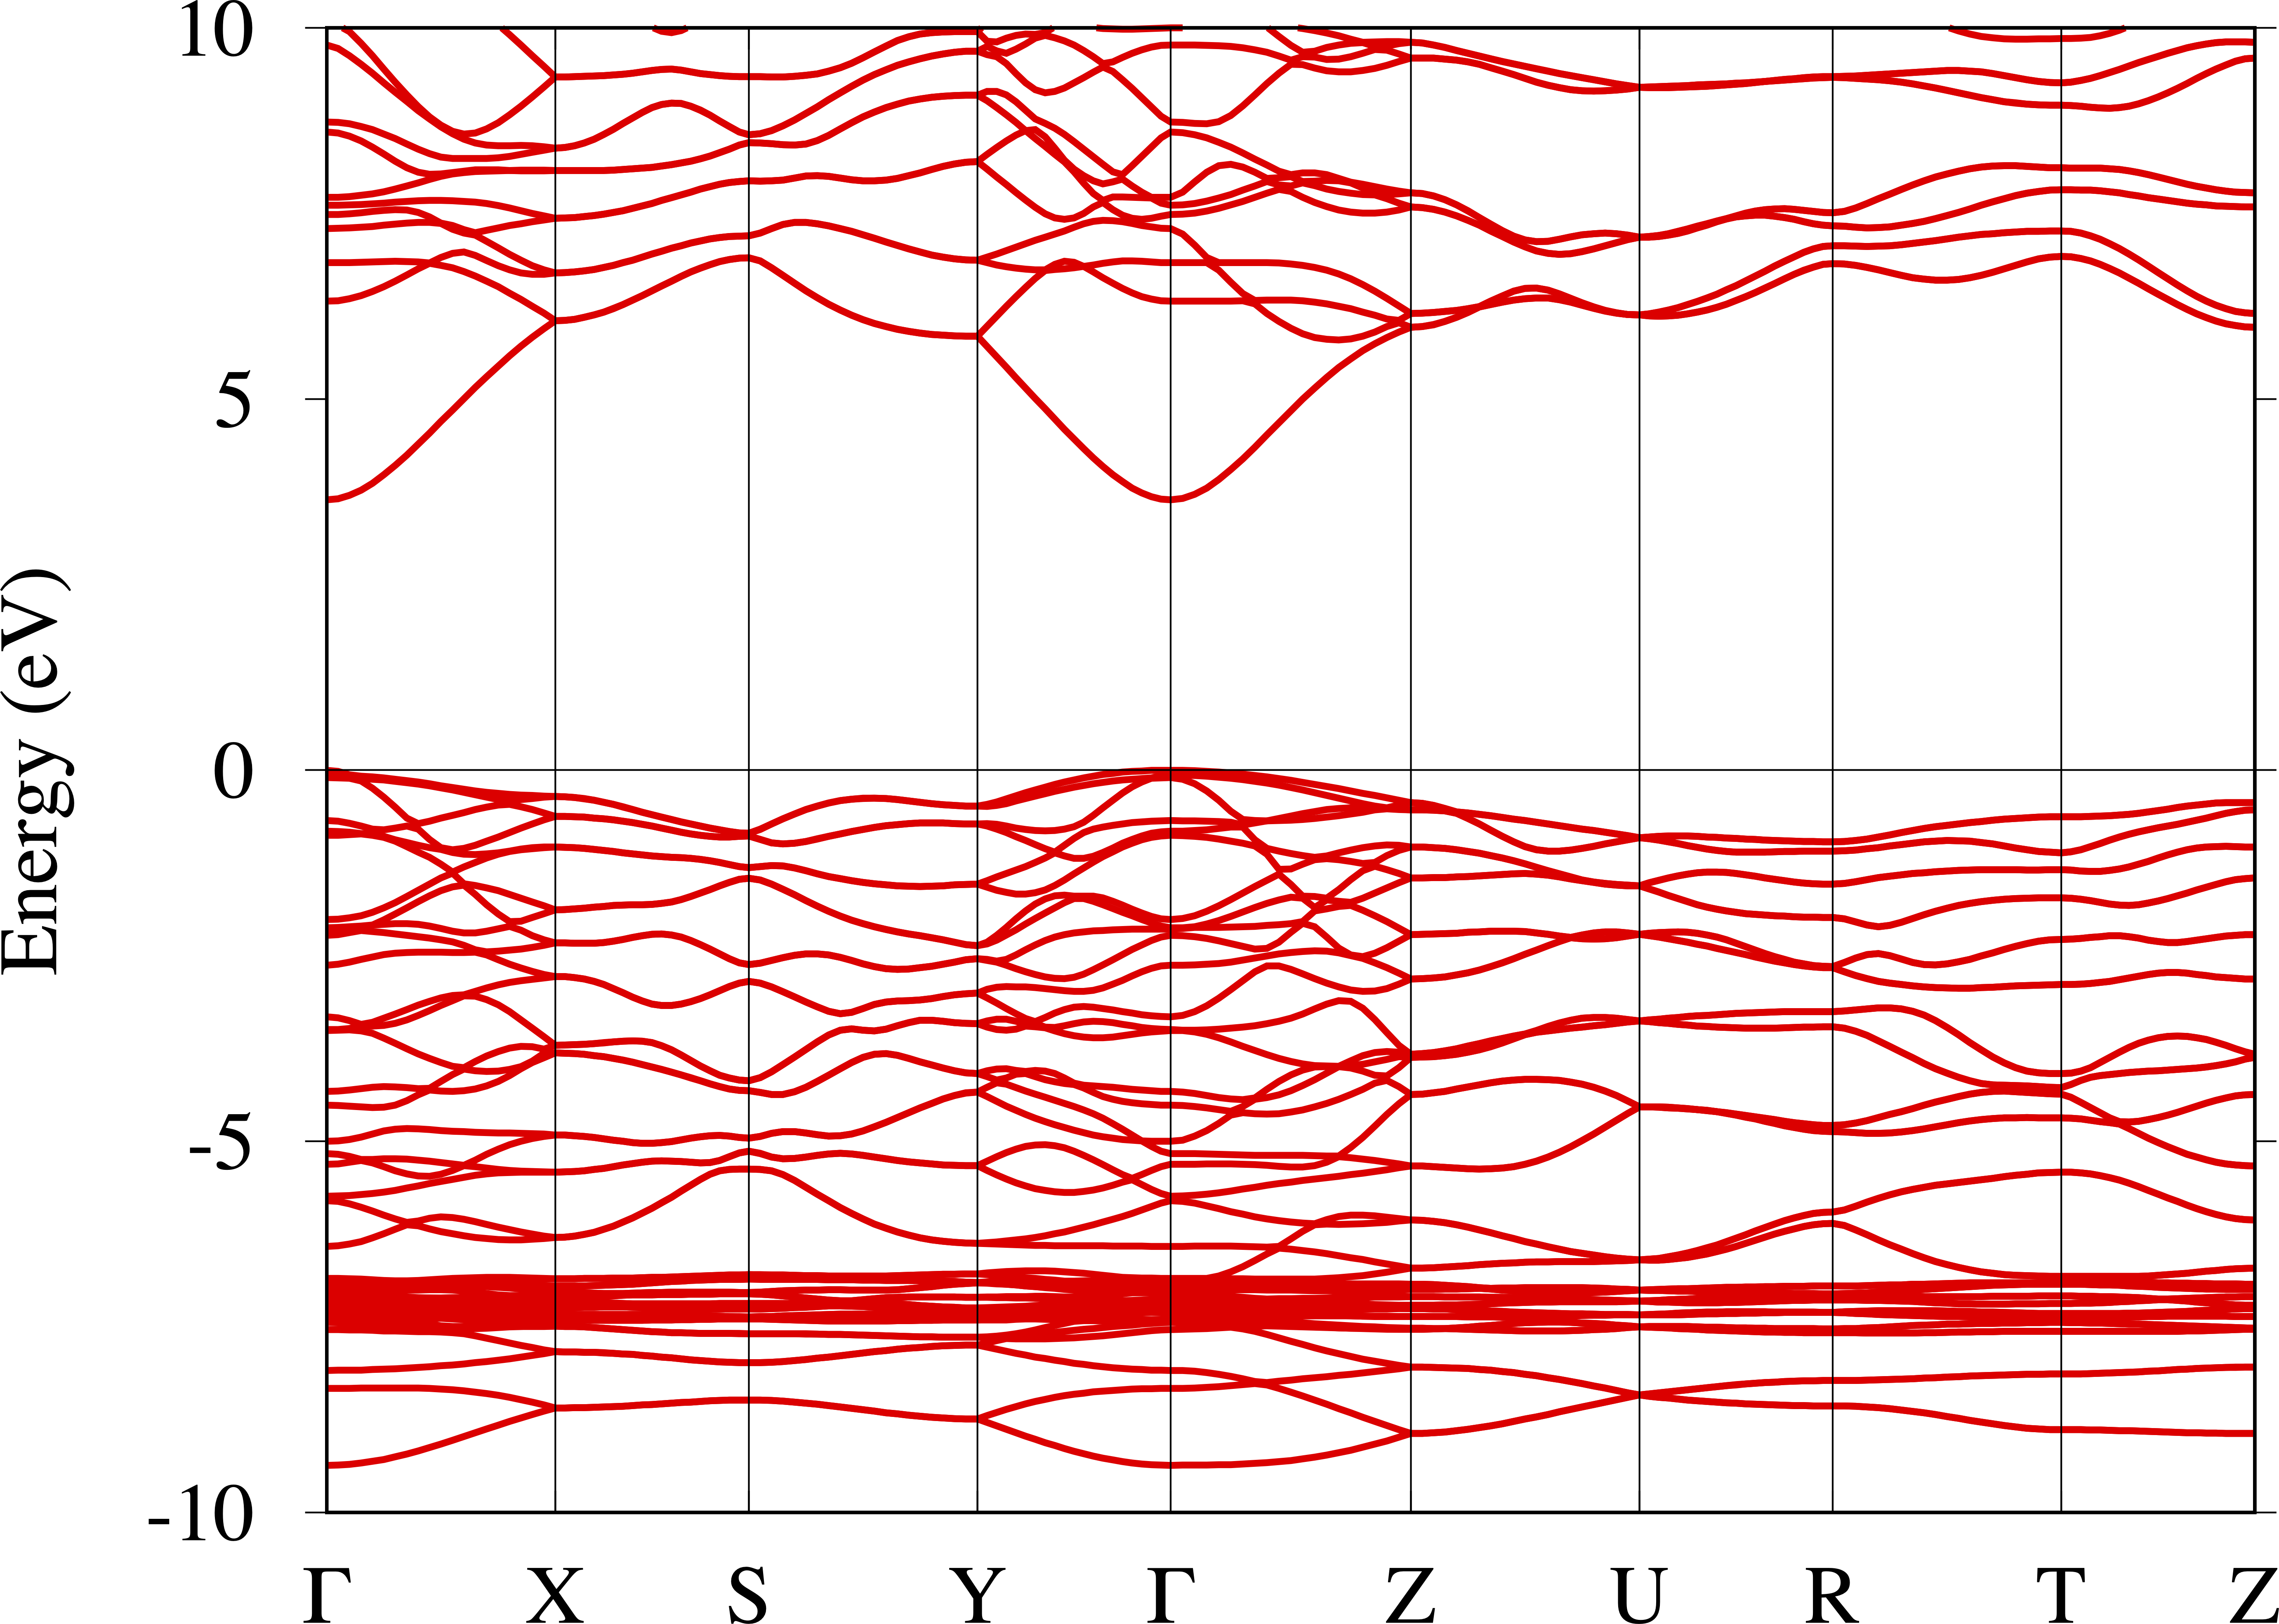
These help to understand the band structure of the GaN 16 atom supercell directly plotted in the Brillouin zone, which can then in turn be compared with that of ZnGeN2 as shown in Fig. 4. The correspondence is seen to be quite close, especially in the conduction band region. The perturbation due to the Zn-Ge difference in potential is thus rather small. Of course, in the deeper valence band region near eV we recognize the close set of bands from the Zn bands which in Ga lie much deeper and are not included in the presently shown energy range. The results for GaN in the supercell were obtained from those in the primitive wurtzite cell by converting the self-energy matrix to real space using the procedure of [26] followed by a simple band structure step without having to reconstruct the self-consistent potential. Just as is folded onto the points above it along the direction will fold onto of . The whole line is thus folded onto . This will be seen to be relevant in the next section.
III.2 Dielectric function in BSE
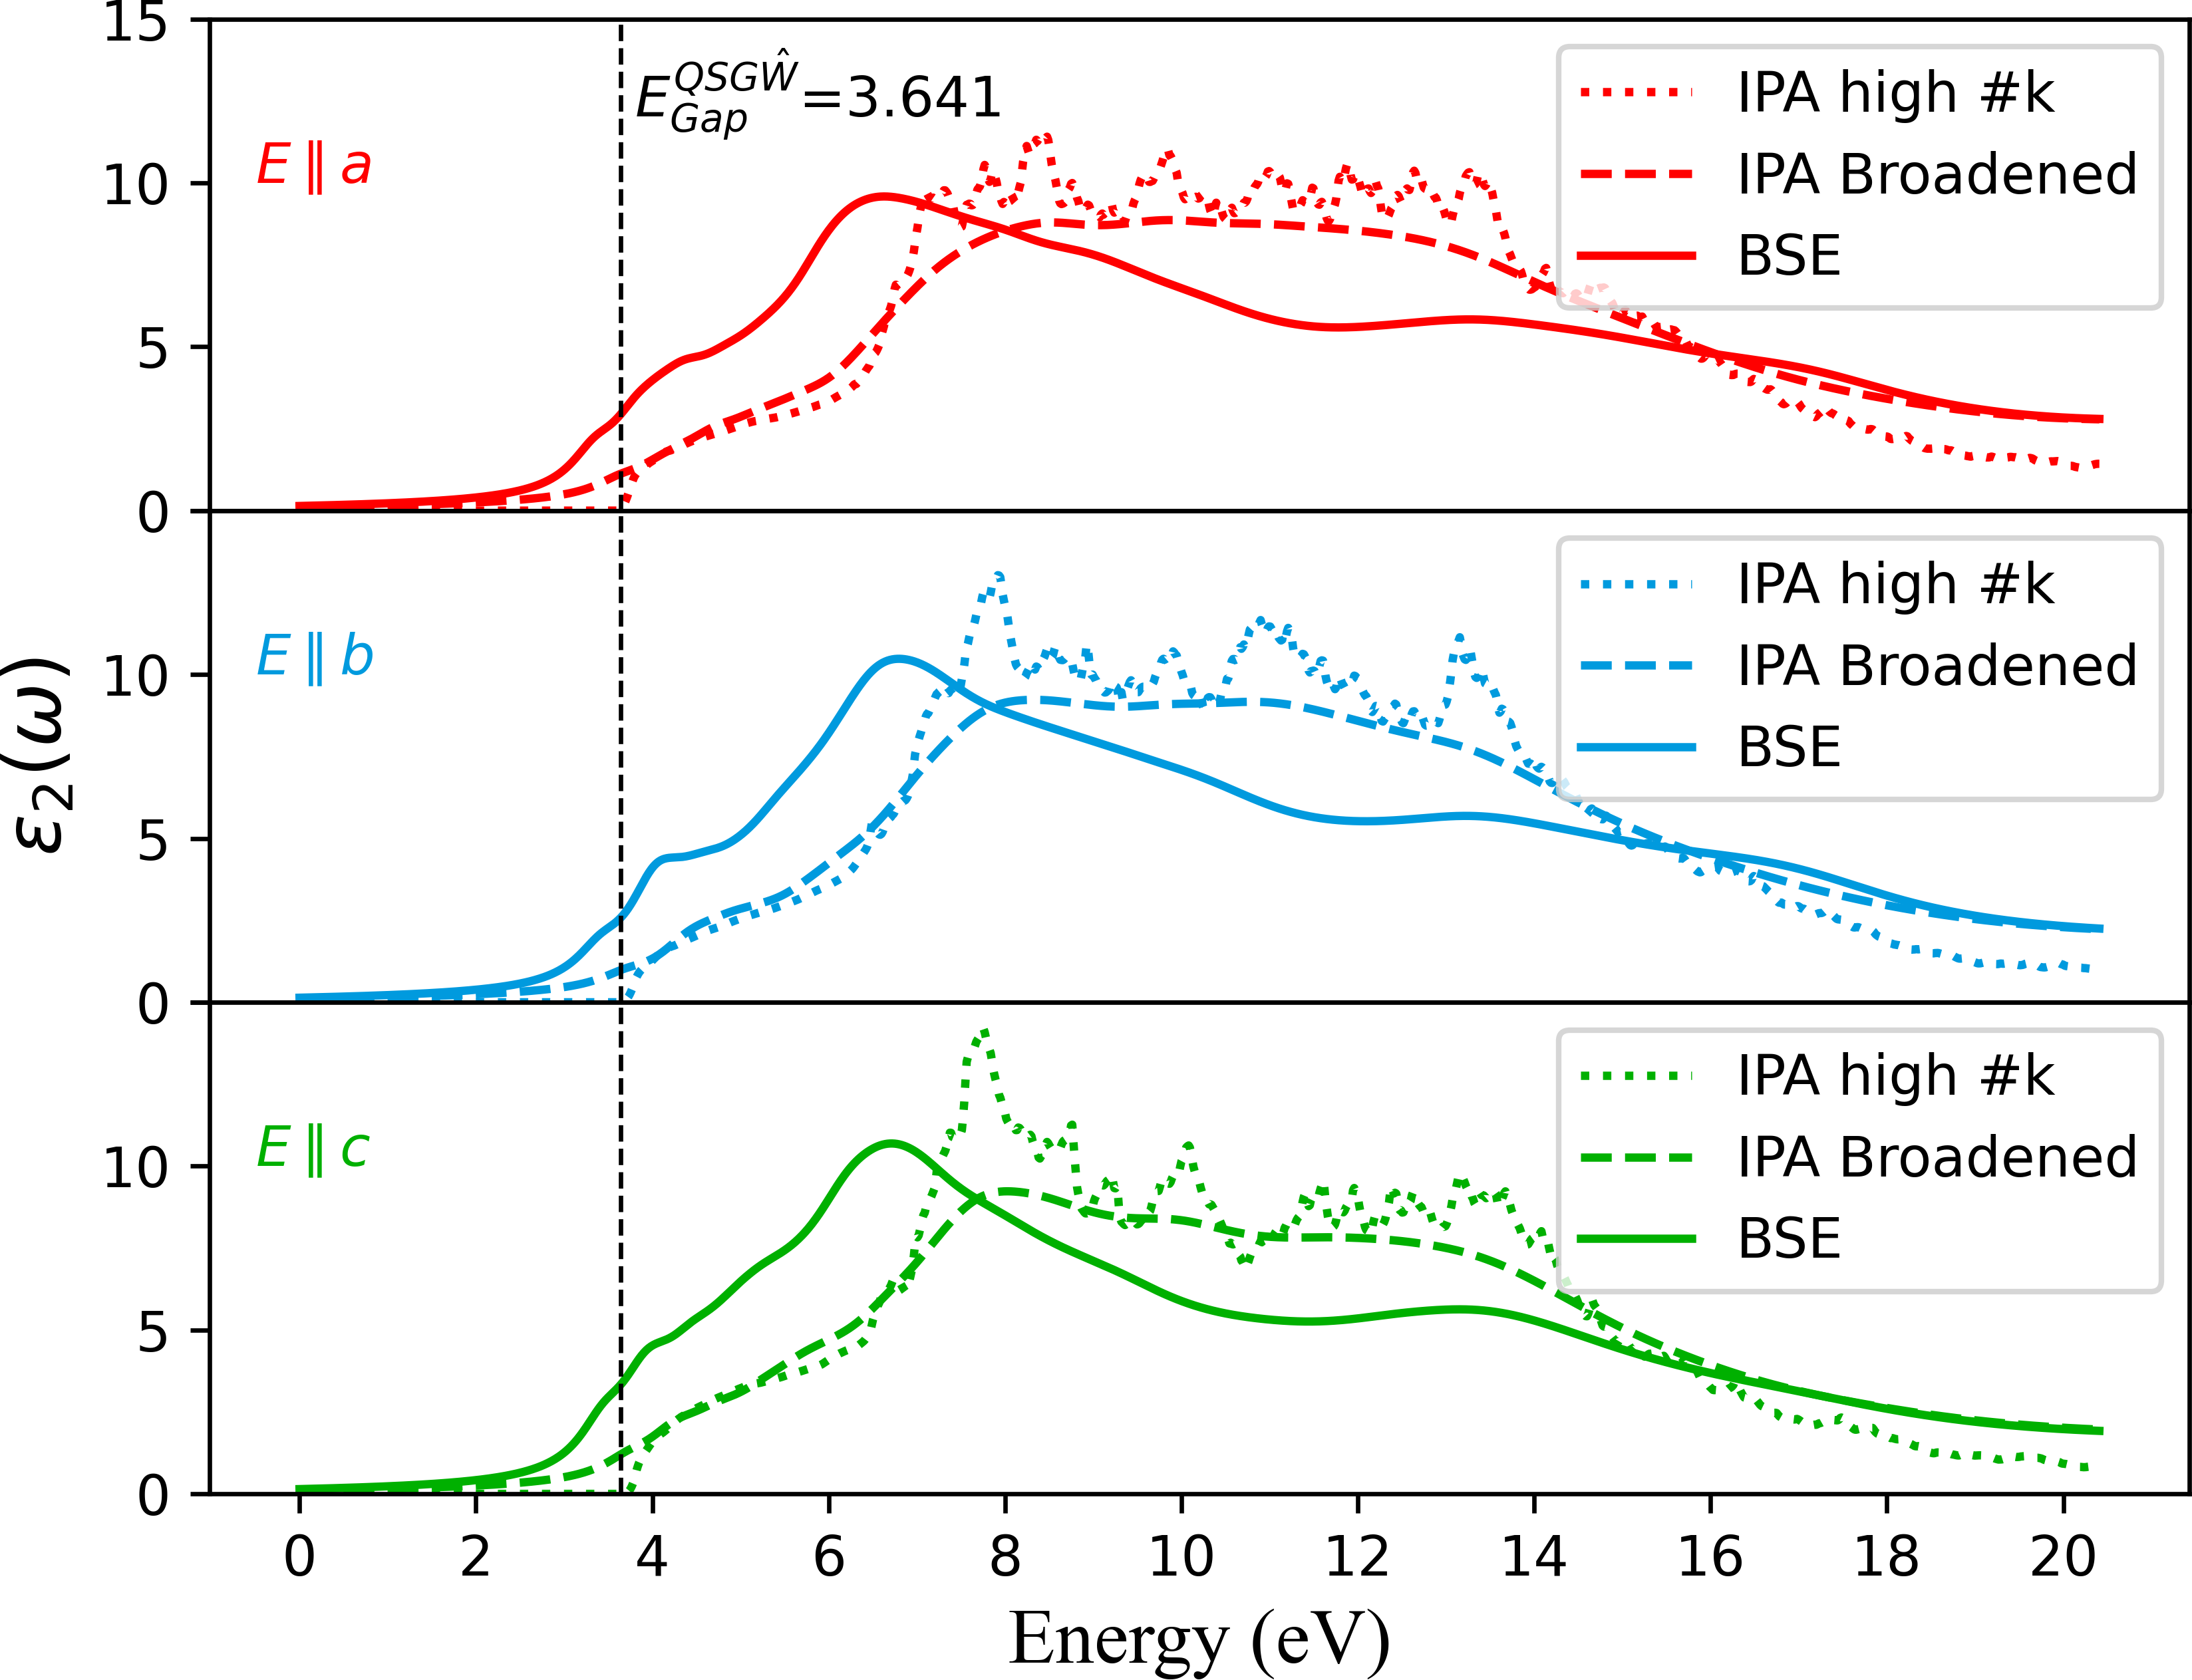
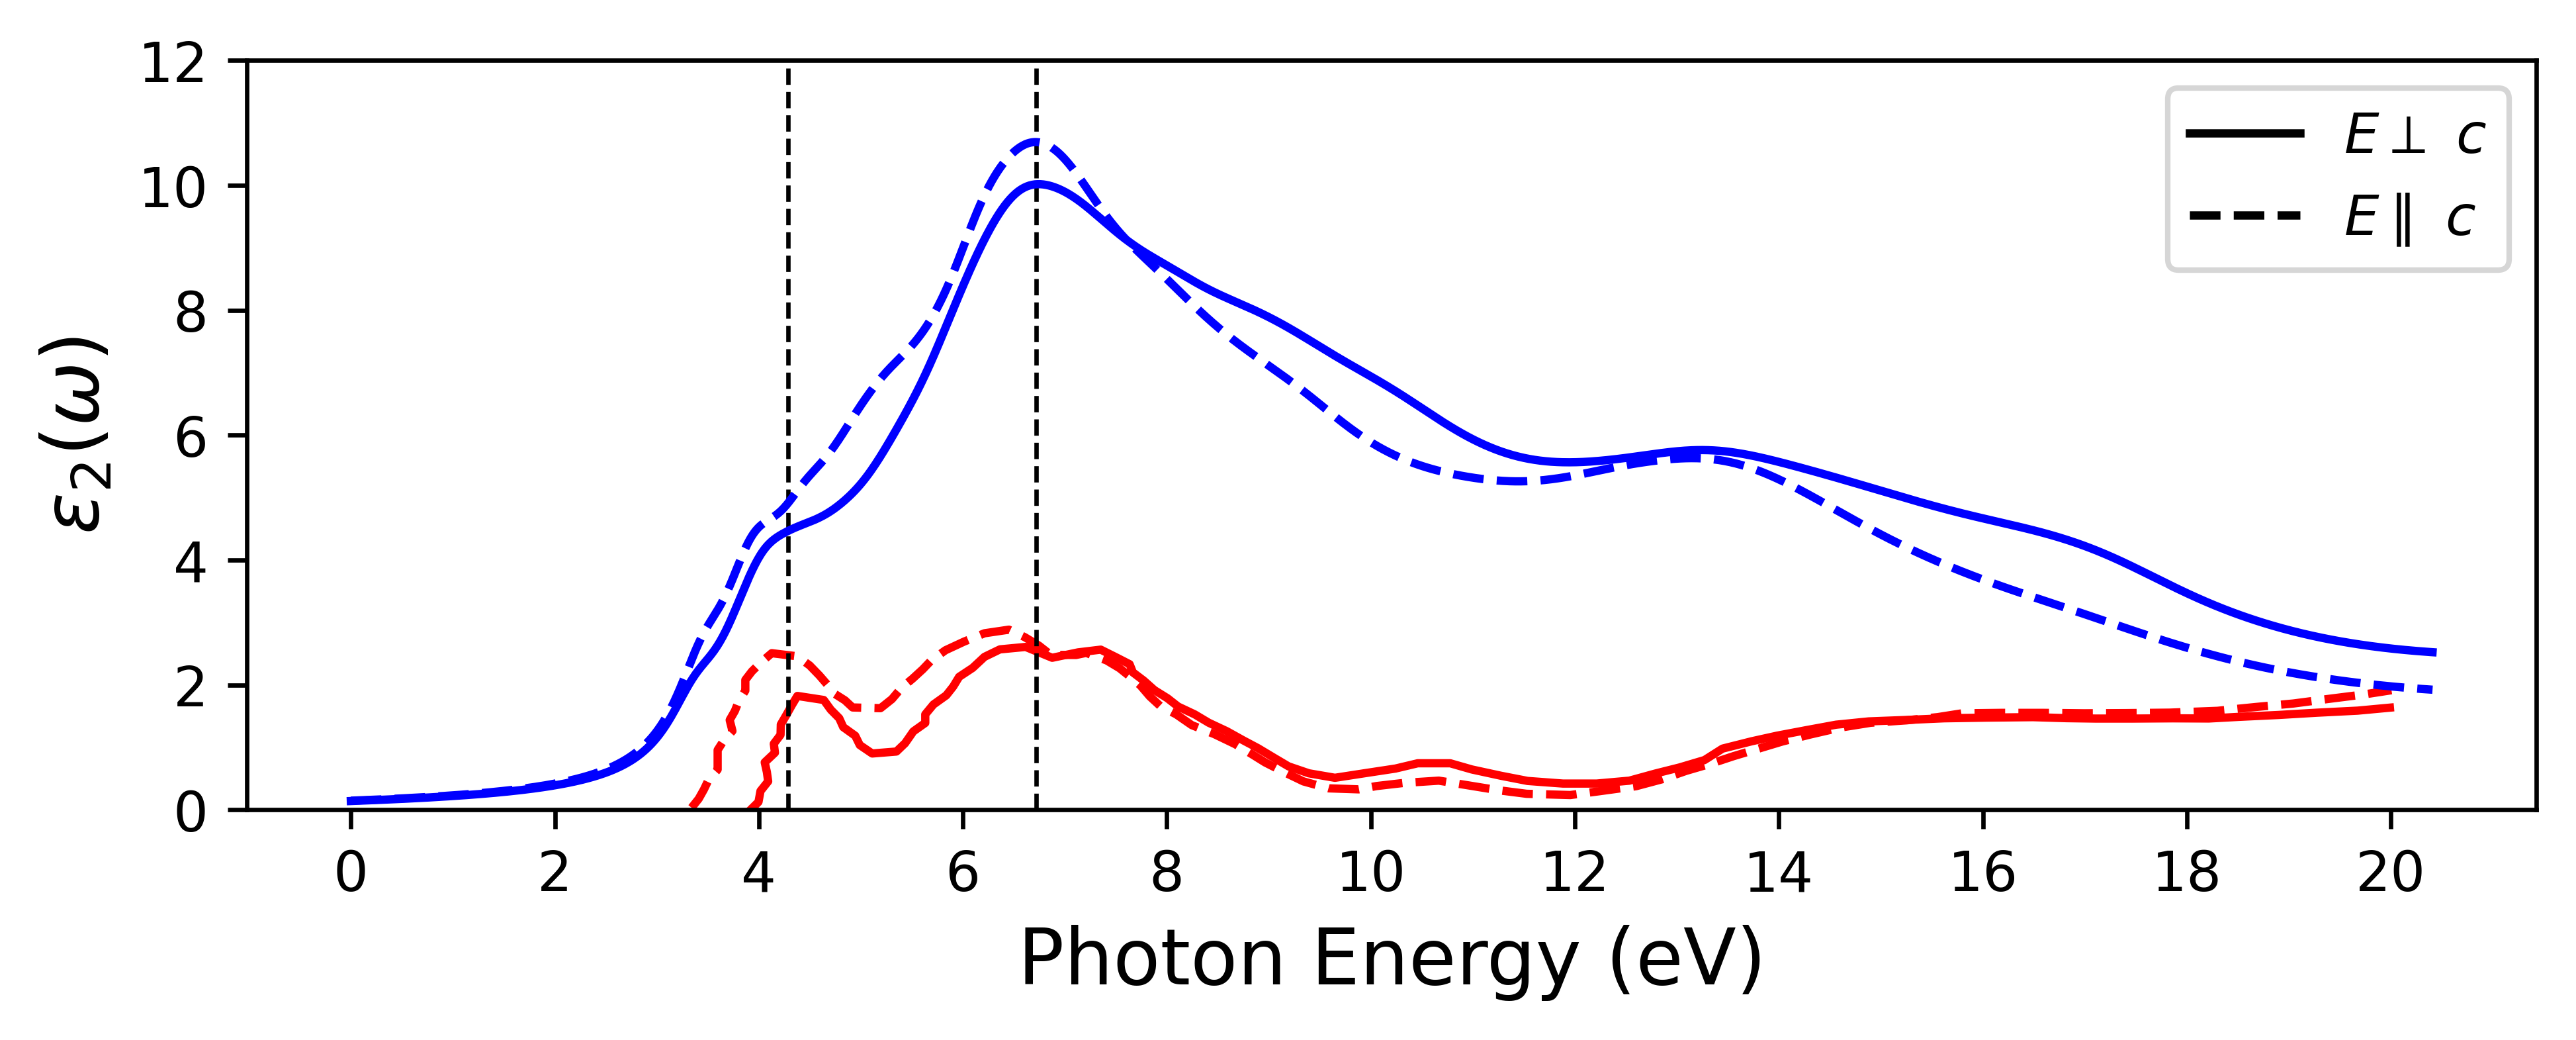
In Fig. 5 we compare the dielectric function in the IPA with the BSE calculation for ZnGeN2. We show the IPA result once with a converged number of k-points as obtained from Eq. 1 and once with the same broadening and k-point mesh as used in the BSE, where we can only afford a less dense k-mesh. The broadening is chosen to match the results of the IPA as closely as possible between the two approaches and amounts to an imaginary part of the energies of 0.3 eV. For a smaller broadening, unphysical oscillations appear in the spectrum. These oscillations result from the coarse sampling which misses the eigenvalues at points in between the sampled k-points and make it difficult to discern actual peak structure from artifacts of the k-point sampling.
The overall spectrum of in Fig. 5 can be described as follows. First, there is a region of slowly increasing () between 3.6 eV and about 6 eV in both BSE and IPA. In the BSE at 6 eV a new feature sets in, peaking at about 6.5 eV, and decreasing to about 10 eV followed by another broad peak between about 12 and 14 eV after which the intensity decreases. In the IPA, the first peak reaches its maximum at a somewhat higher energy, around 7.5 eV but the spectrum does not show a minimum near 10 eV and instead shows a broad series of peaks of about the same value till 14 eV. One can see that the BSE overall shifts oscillator strength to lower energies and results in a clearer two broad peaks structure: one between 6 and 10 eV and one between 10 and 16 eV. The first peak in BSE appears to occur at the onset of the steep rise in of the IPA spectrum. The quasiparticle gap is indicated by the vertical dashed line. With a smaller imaginary part, the BSE also shows peaks below the quasiparticle gap, which correspond to bound excitons but with the broadening in Fig. 5 these features are smeared out and appear only as a shoulder below the quasiparticle gap. We will discuss the excitons separately in a later section.
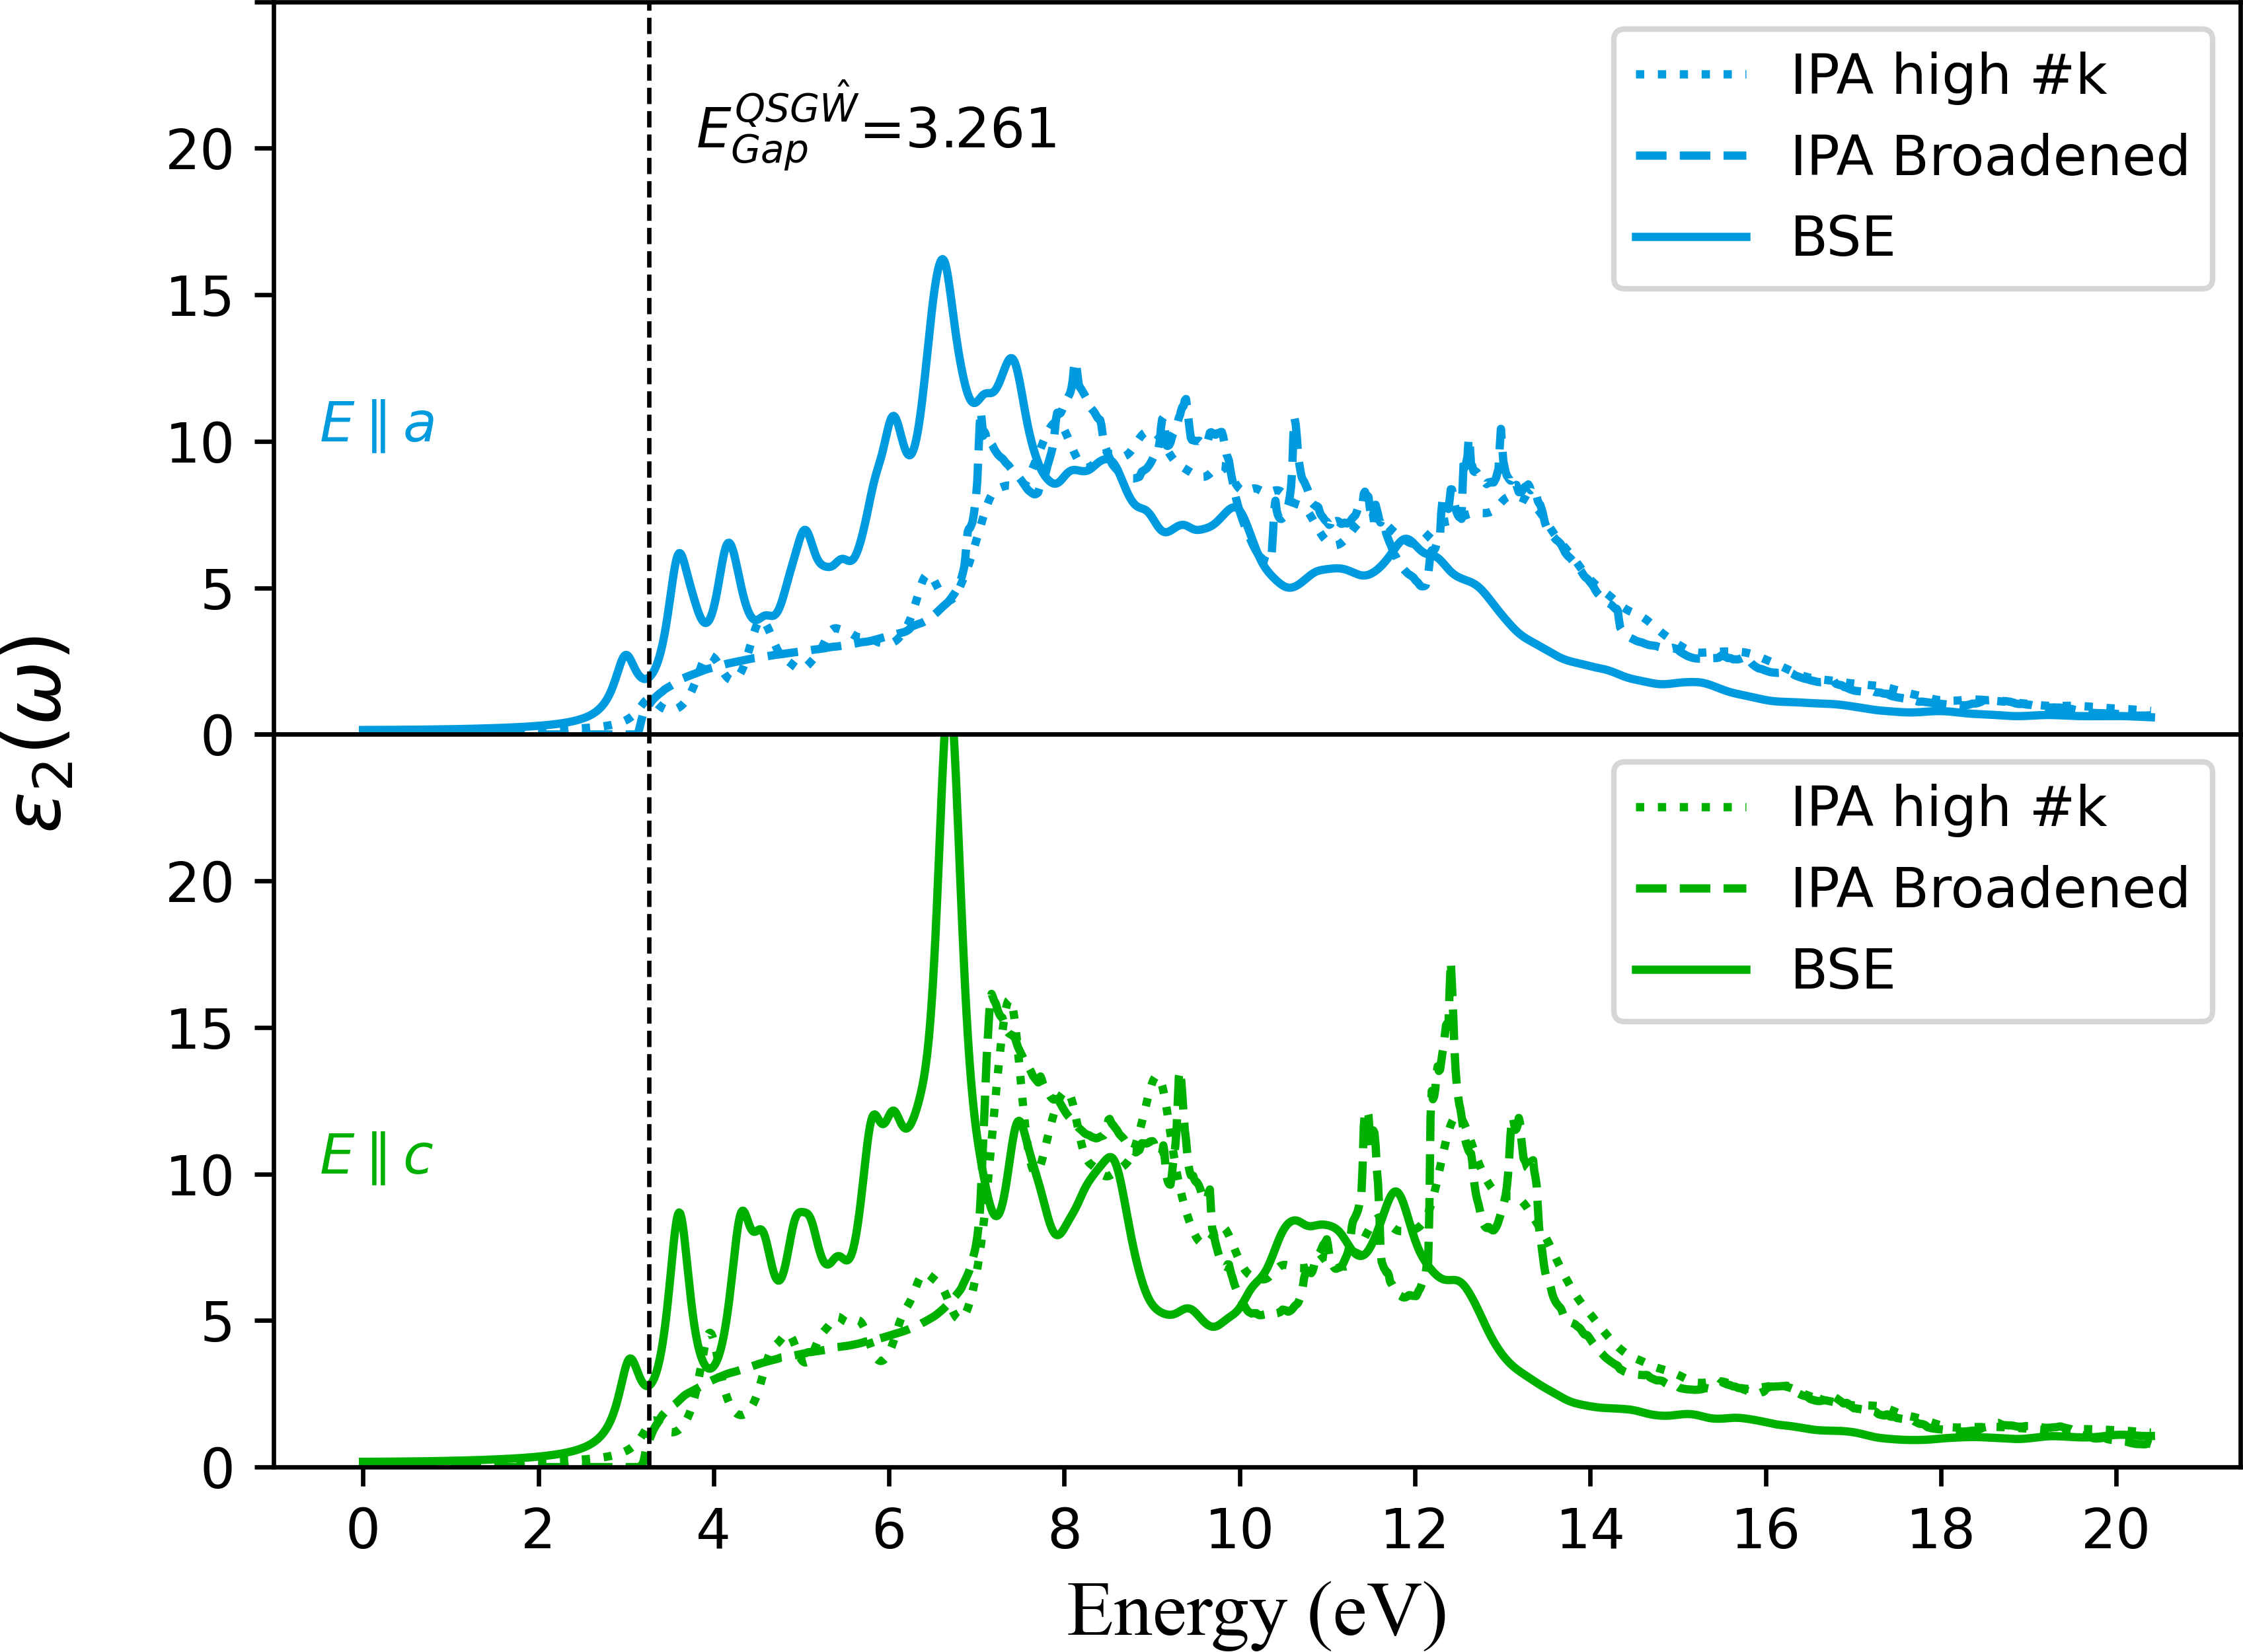
A similar overall behavior of the dielectric function occurs in GaN, as seen in Fig. 6. We thus expect that there is a similar underlying physics going on in the band-to-band contributions and the BSE effects. We now discuss the origin of these observations. Because of the smaller number of bands, the analysis in terms of separate band-to-band transitions and where they mostly occur from in k-space is somewhat easier to analyze in GaN. We will then use the band folding of the wurtzite to Brillouin zone to translate these findings to ZnGeN2.
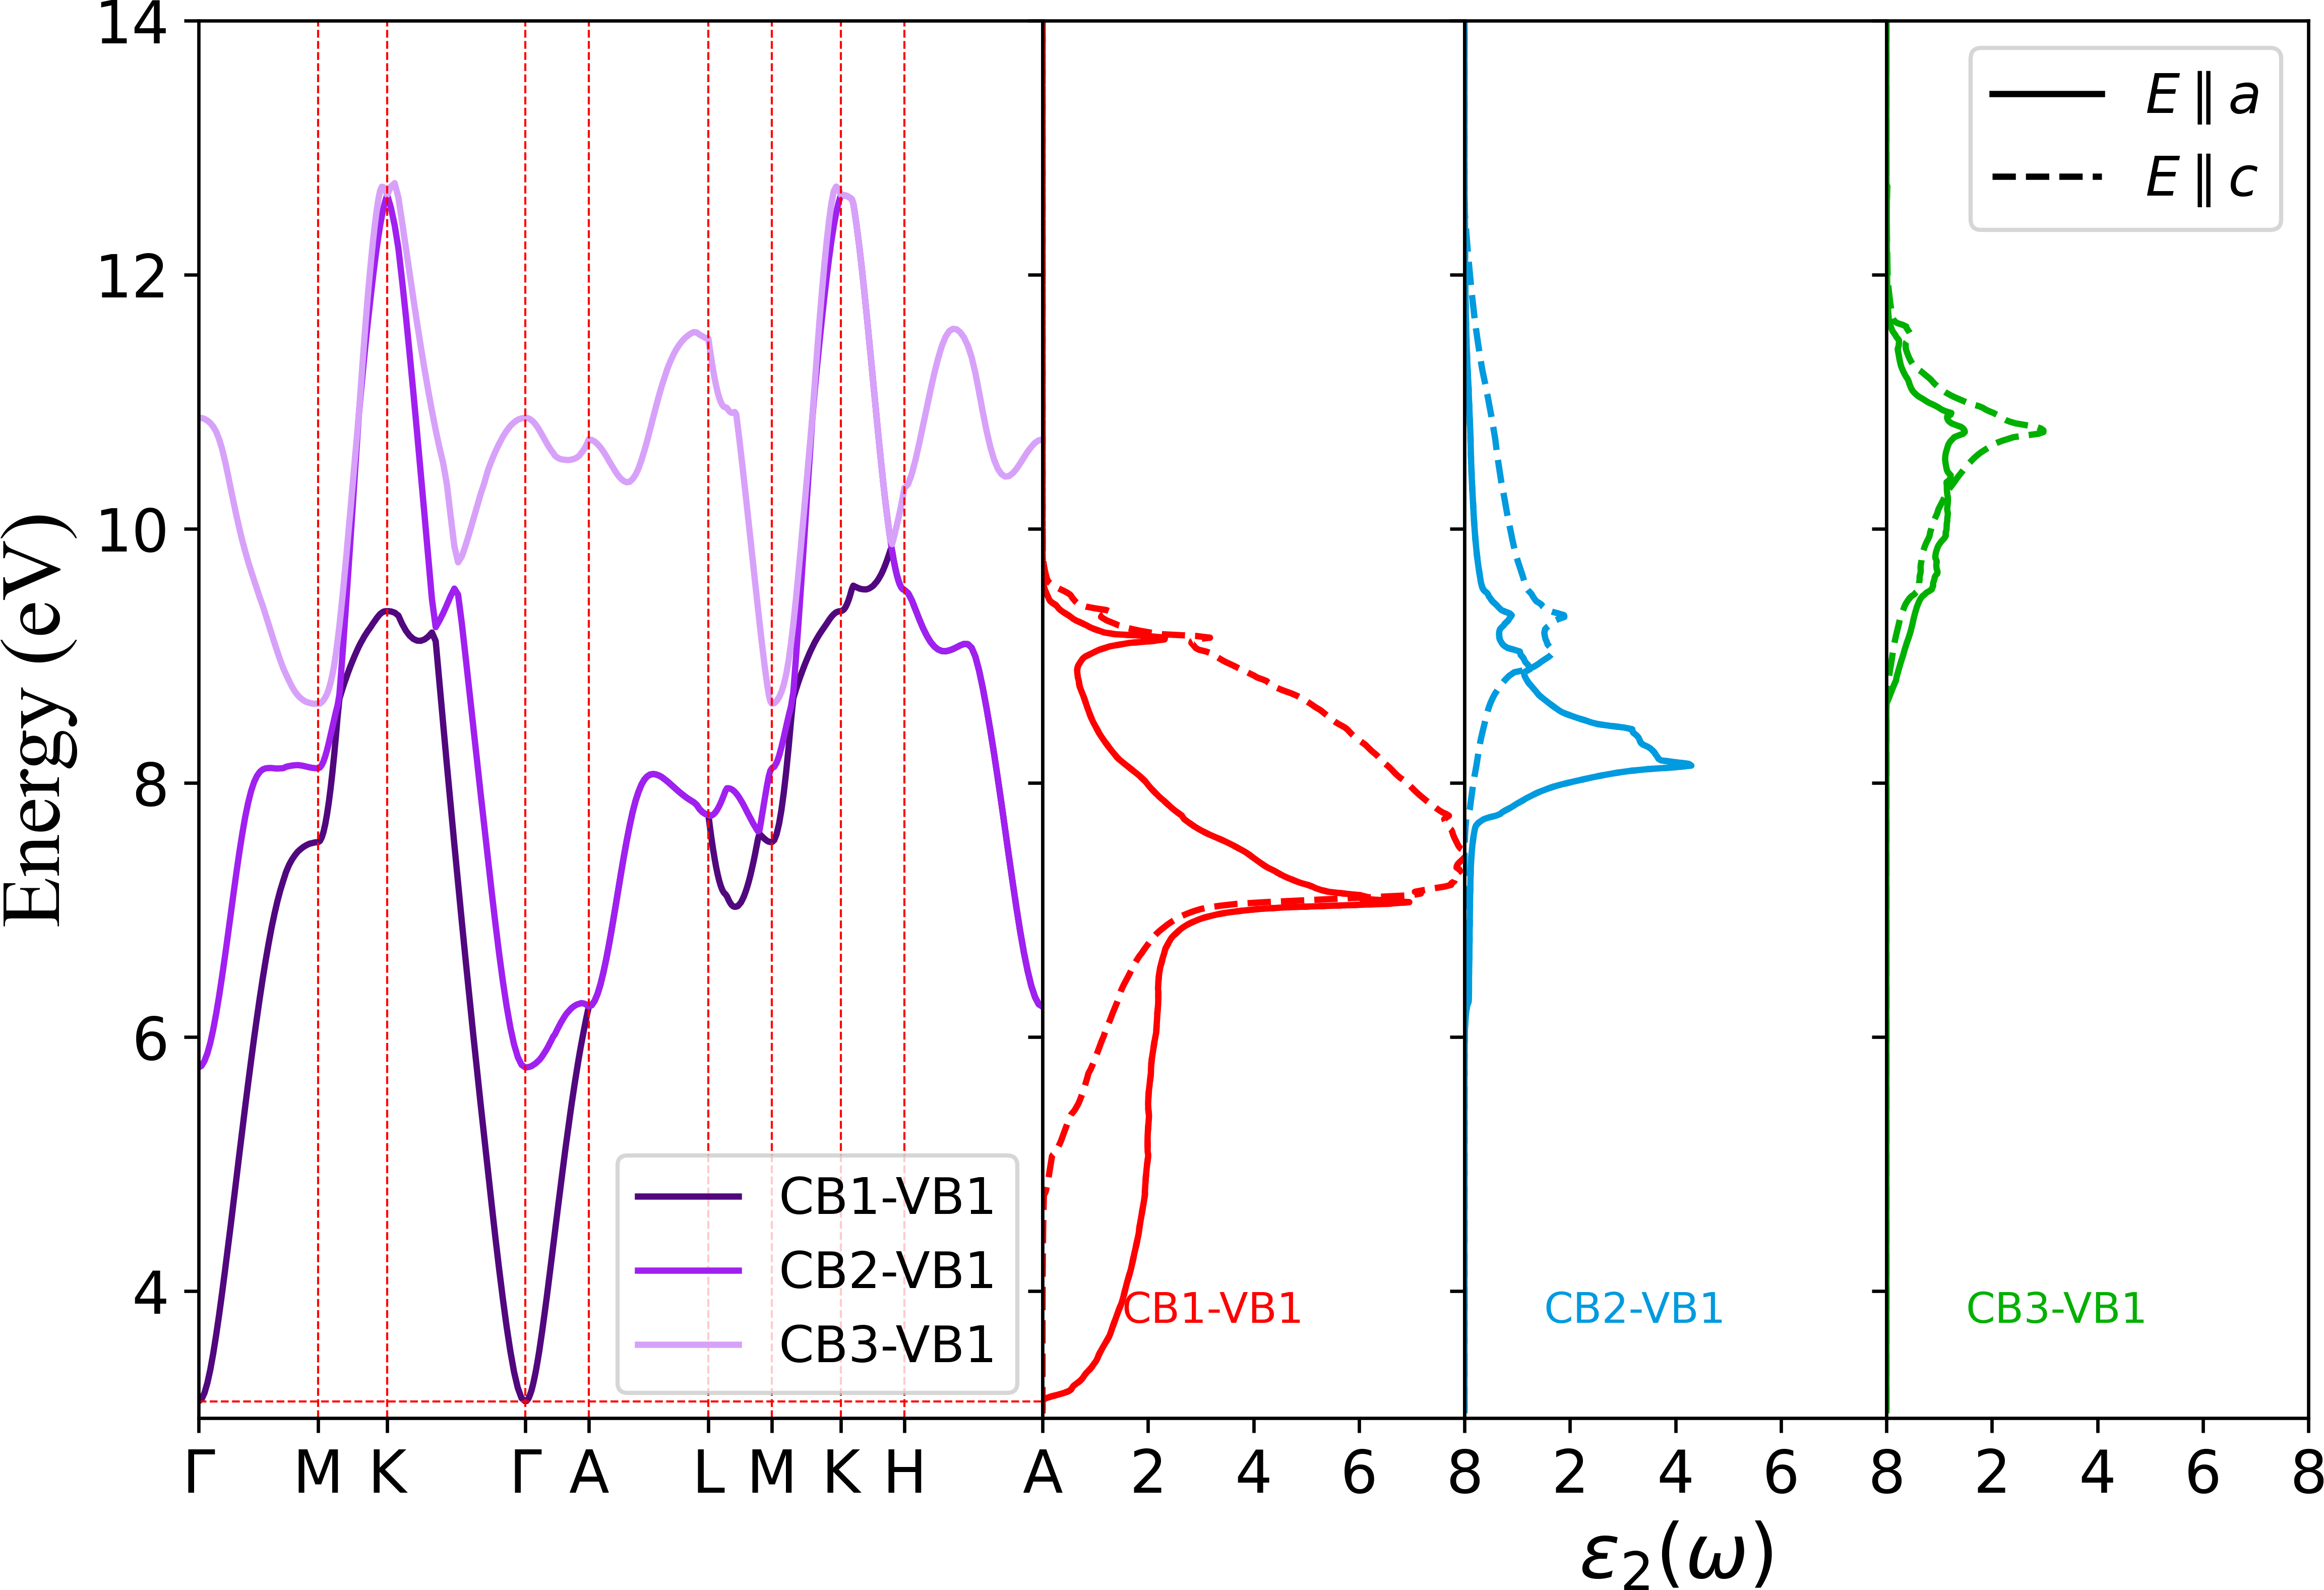
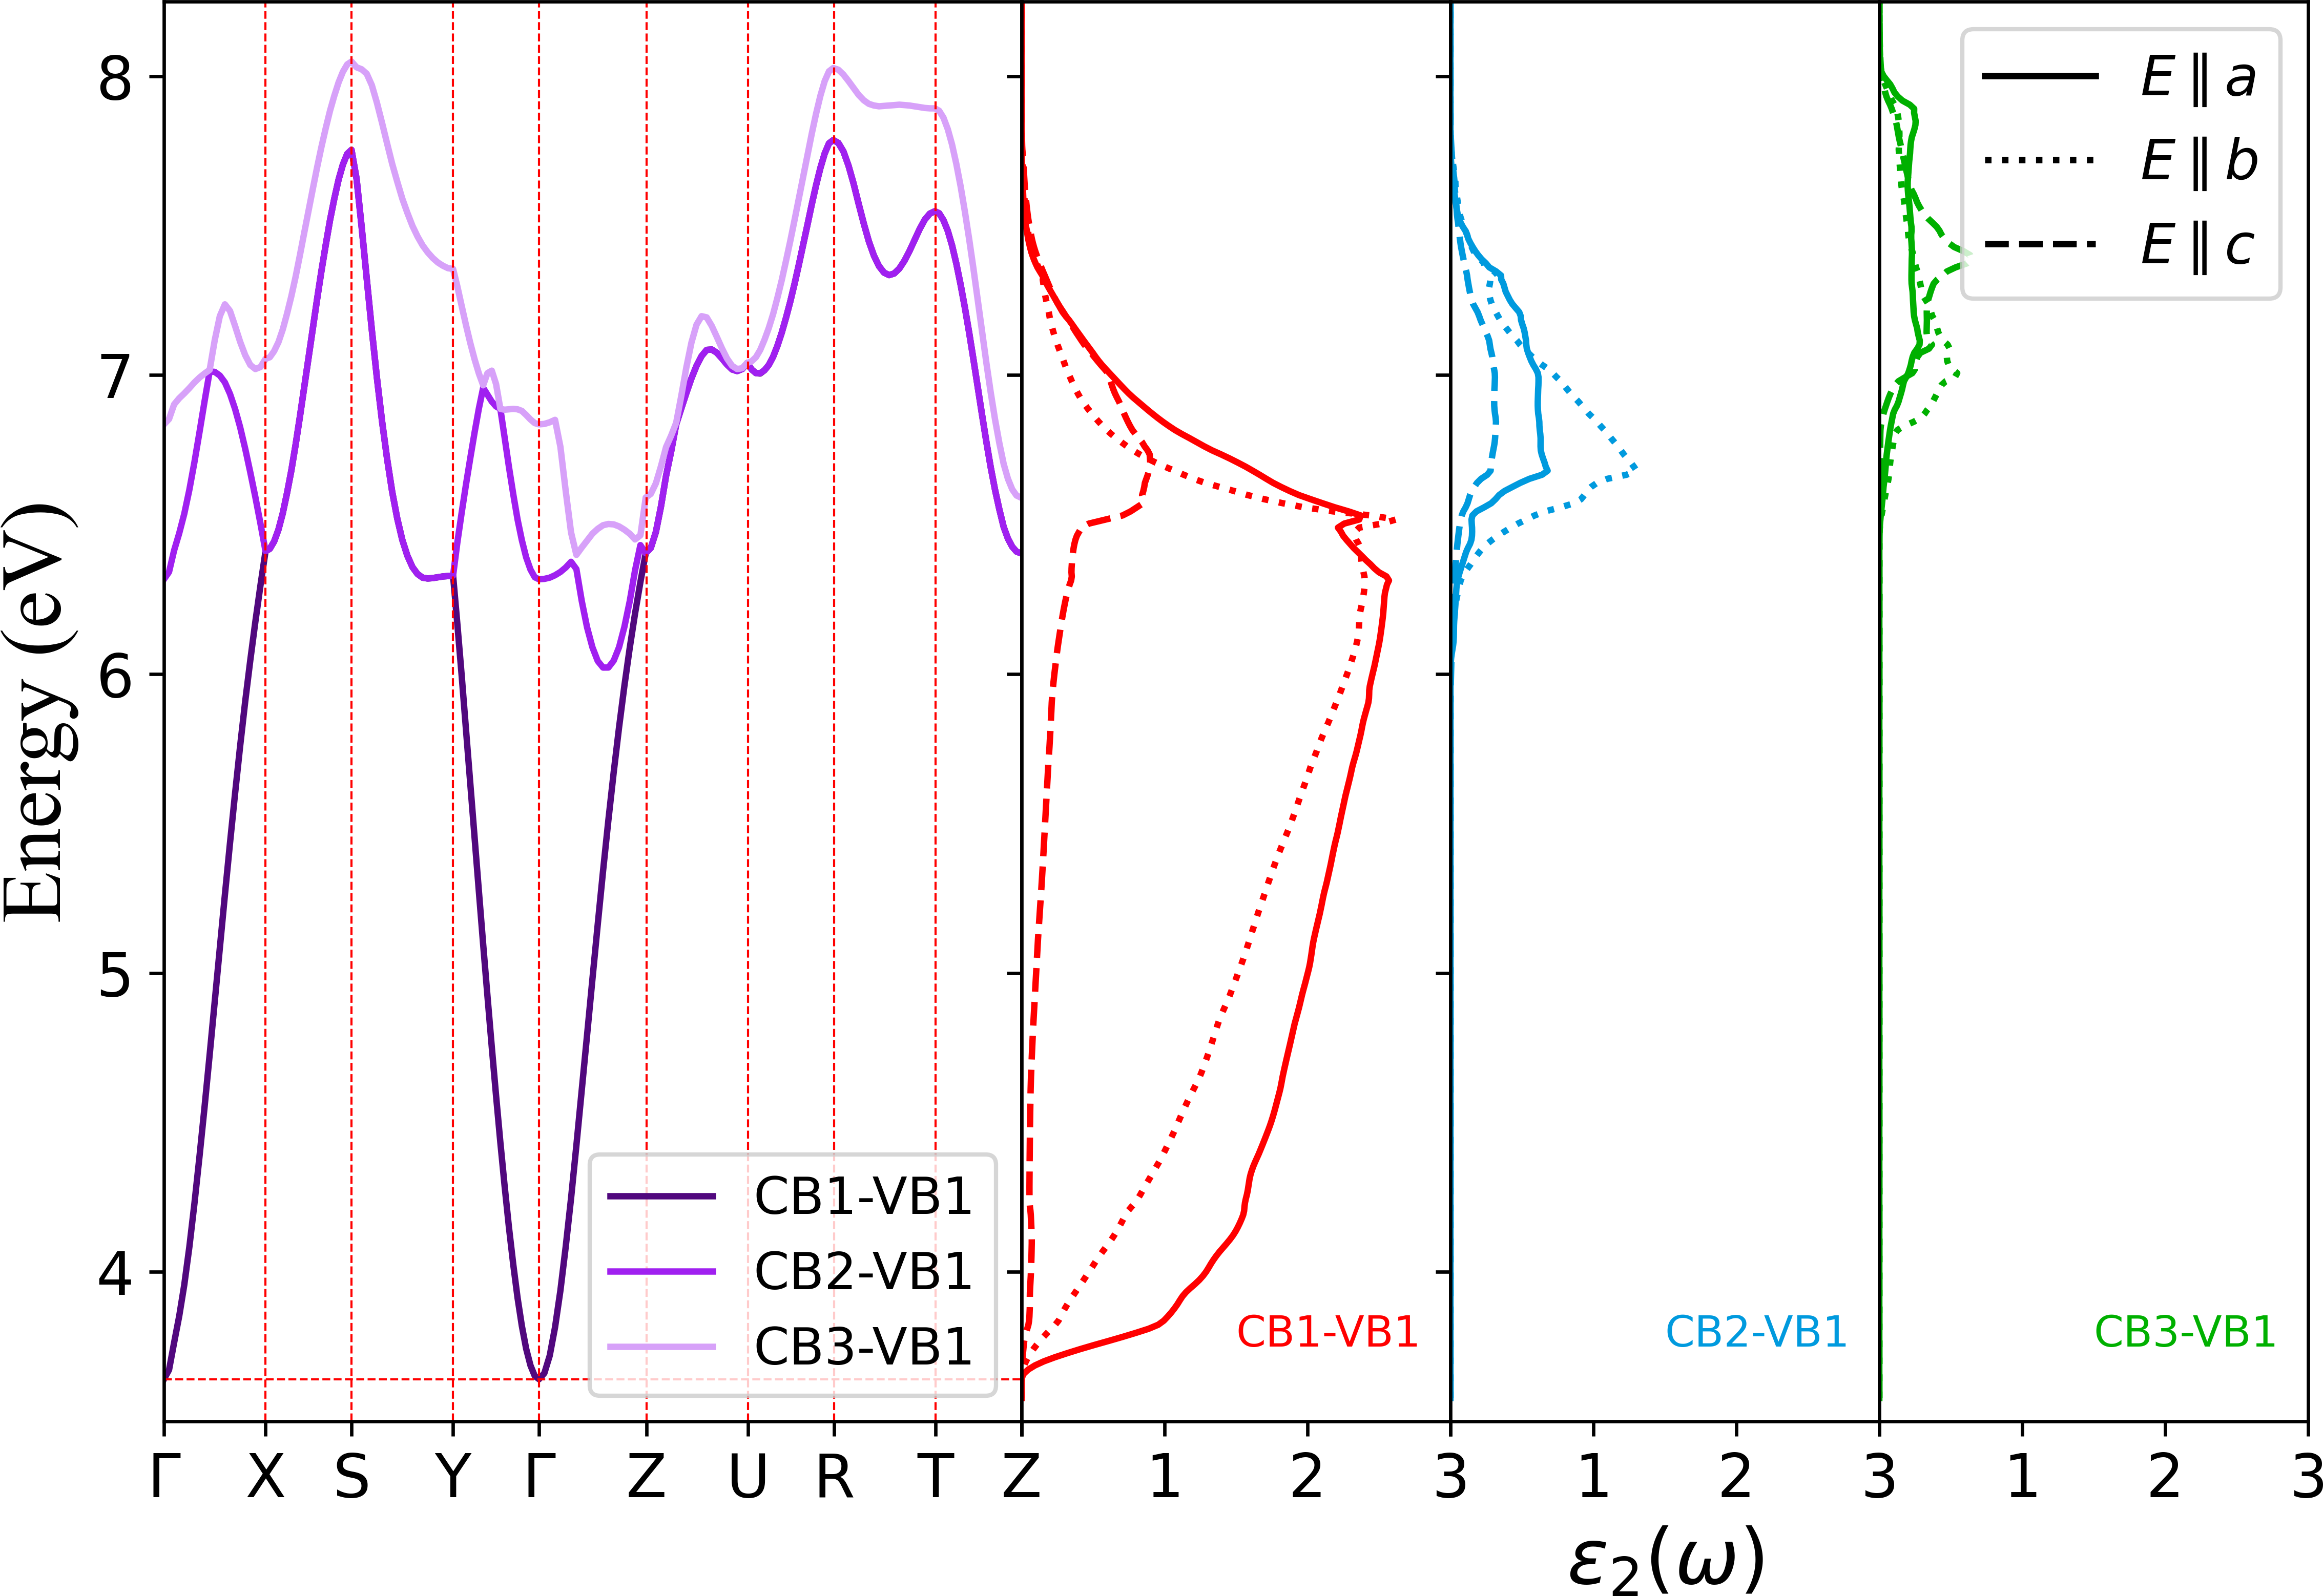
In Fig. 7 we show the contribution to the dielectric function in the IPA from the top valence band (VB1) to conduction bands 1-3 (CB1-3) along with the vertical difference in the bands at each k-point along the symmetry lines. We can see that the onset comes only from VBCB1 transitions and is mainly polarized . This is consistent with a strongly dispersing lowest conduction band near and a gradual increase of in the IPA. The IPA is essentially a matrix element modulated JDOS which is proportional to . One expects the JDOS contributions from different band pairs to show peaks when this energy band difference is nearly parallel over some region of k-space. However, the matrix elements play a significant role in decreasing the intensity as energy increases and the shows a clearer peak structure than the JDOS. We thus focus directly on the IPA rather than the JDOS. The JDOS is shown and further discussed in Supplemental Material [25].
Returning to Fig. 7, the peak starting at 7.0 eV is seen to be related to a relatively flat energy band difference along the line and the onset of that peak coincides with the minimum of the CBVB1 energy difference along , which is a saddle point in the interband energy difference surface. We can thus conclude that the electron-hole interaction effects in BSE shift the oscillator strength toward the van Hove singularity saddle point. This provides an a-posteriori justification for the common practice of analyzing the optical dielectric function in terms of a critical point analysis, emphasizing the behavior near high symmetry points where Hove-type singularities occur [27, 28, 29]. This was previously discussed in Ref. 30 and is here confirmed. It was noted in [30] that the electron and hole have exactly the same velocity at these points, which could heuristically explain why they might plausibly interact stronger and make a large contribution when electron-hole pair interactions are included. A full analytical explanation of this observation would require an analysis of the matrix elements of as function of k near these singularities, which is a challenging task and has not yet been done. However, one does expect that shifts the transitions down to lower energy, which explains why the peak in IPA is red-shifted in the BSE. Various interband transitions close in energy to each other in this region of high IPA contribute to a “continuum” exciton like peak in the BSE just below or at the saddle point. In other words, the two particle Hamiltonian or “exciton” Hamiltonian has eigenvalues more concentrated in energy and right at the singularity that derive from a wider region of k-space individual band to-band transitions.
The CB2 is close to CB1 along and also contributes to the peak within the range 7-9 eV. There is also a rather flat interband difference of CB2-VB1 along near . This appears at about 8 eV and contributes to the second peak in the IPA dielectric function. Its relation to the BSE peaks is not entirely clear because in the BSE formalism one can no longer associate peaks to particular band-to-band transitions. On the other hand, CB3 is related to flat band regions along and contributes to the peaks near 11 eV.
A similar behavior is seen in ZnGeN2. Fig. 8 shows various contributions VB1-CBn to for three polarizations. Additional figures are shown for the next top valence bands in Supplemental Material [25]. We can again first see a relatively slow onset from the strongly dispersing conduction band near . It is primarily polarized along near its onset consistent with the symmetry of VB1 (which is or -like) and the -like ( symmetry of CB1 at ). A peak starts emerging at about 6.5 eV and has contributions from CB2 and CB3. The onset of the peak near 6 eV is similar to what we just discussed for GaN but now is related to van Hove singularities and nearly parallel bands along which is the folded version of in the wurtzite. One may also note at rather flat energy band difference of CB1-VB1 along near . This could be related to the discontinuity in slope for the corresponding contribution to the IPA for (red solid line). However, it has only minor effects on the BSE dielectric function.
In summary of this section, the major peak structure of the in ZnGeN2 has similar origins to that in GaN and can be explained in terms of the band-folding effects. The peaks in the IPA correspond to regions of high JDOS (modified by matrix elements which decrease with increasing energy) where various bands are close to being parallel and allowed dipole matrix elements. The electron-hole effects further shift the oscillator strength towards the van Hove singularities, where the bands become exactly parallel, which facilitates the stronger electron-hole coupling.
III.3 Static dielectric constant
We also calculate the real part of the dielectric function . In principle, we can obtain it directly from a Kramers-Kronig transformation of the results of Fig. 5. However, this quantity is quite sensitive to the accuracy of the matrix elements of the velocity operator because through the Kramers-Kronig relation,
| (8) |
it depends on an integral over for all and is thus sensitive to the values of not just where its peaks occur. Because of the difficulties in incorporating the self-energy contribution to the velocity matrix elements, it is more accurate to directly examine for finite values and then extrapolate numerically to zero. Furthermore, we obtain additional information on the dependence by looking at throughout the Brillouin zone.
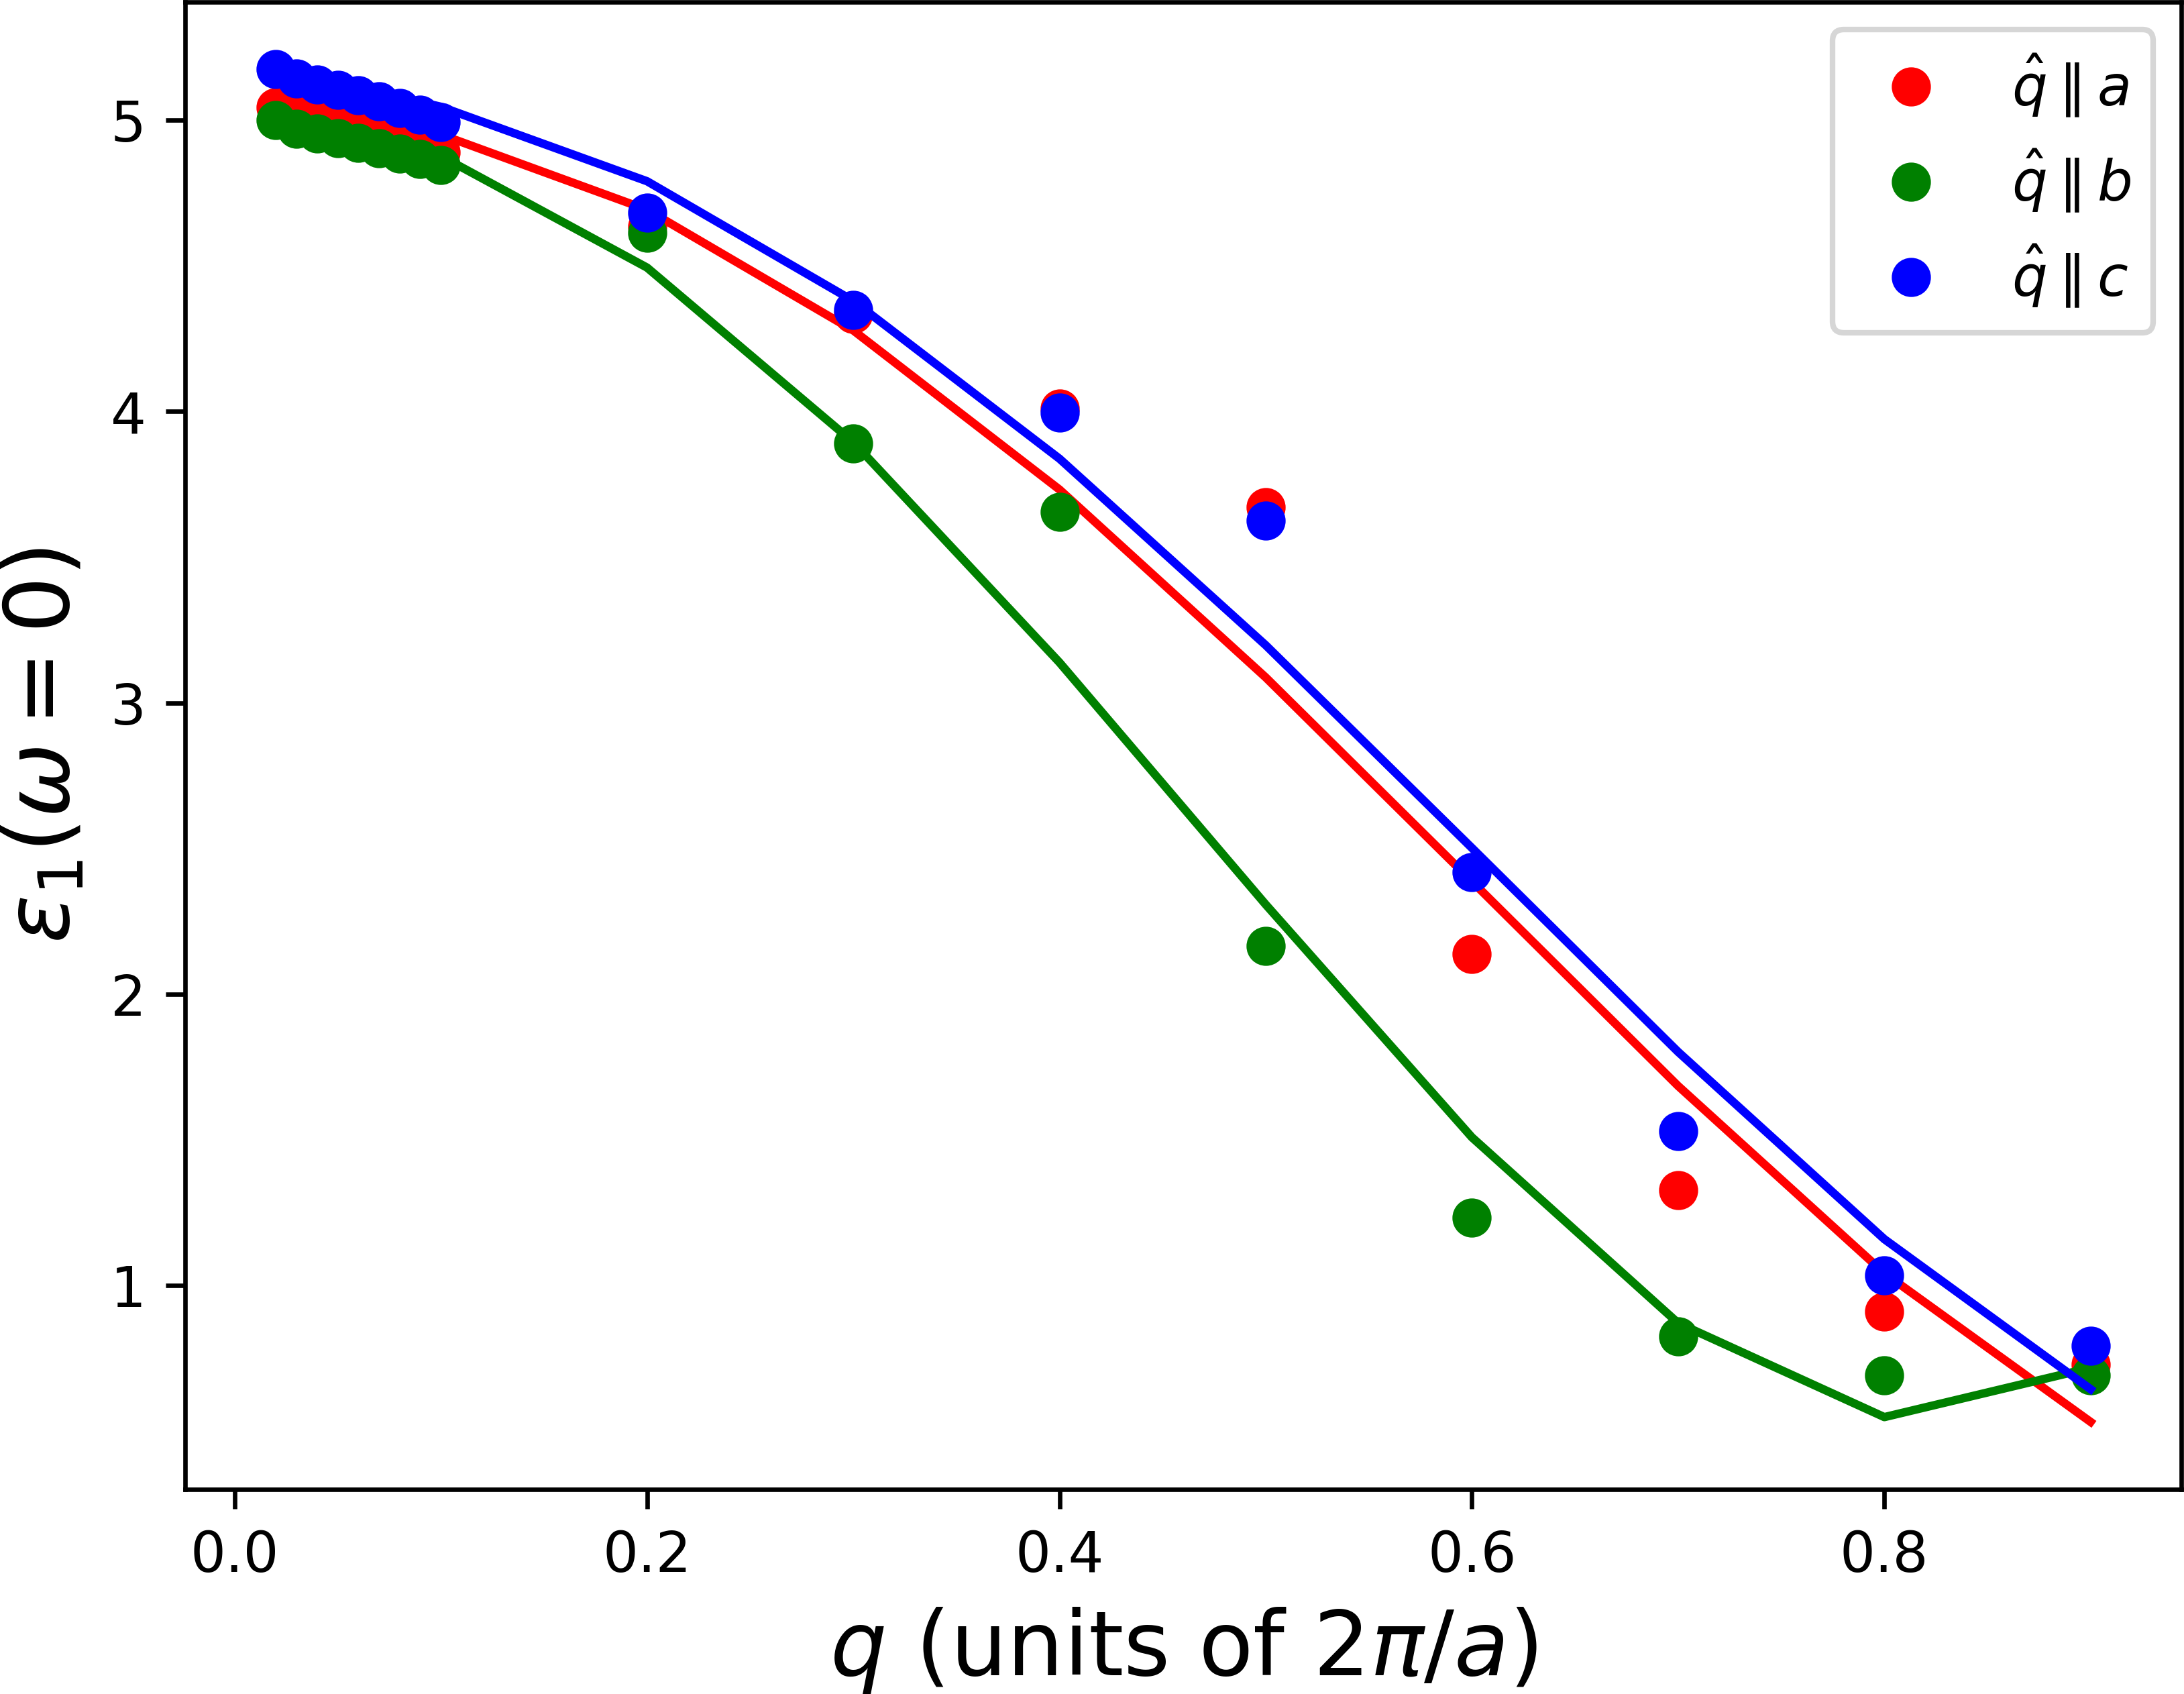
We use a model dielectric function which was introduced by Cappellini et al. in [31], to fit to the directly calculated results from the BSE at finite q shown as filled circles as shown in Fig. 9. Extrapolation of this fit to limit gives the values of 5.04 along , 5.01 along , and 5.13 along directions. These values of course correspond to electronic screening only, and therefore, to what is commonly referred to as , rather than the true static value which would include the phonon contributions. In other words, it applies to the frequency range well below the band gap but high above the phonon frequencies and is related to the index of refraction measured in this region by . The indices of refraction are thus 2.24, 2.24, 2.26 for directions. Our values of obtained here are close to those obtained from a Berry phase calculation of the polarization in the LDA [32] which are 5.232, 5.166, 5.725 for directions respectively, or corresponding to indices of refraction of 2.29, 2.26 and 2.39. On the other hand, if we had used the obtained directly from the Kramers-Kronig transformation of the BSE results in Fig. 5, we would find values of 9.79, 9.02 and 9.30 for the , , directions. These are significantly overestimated by almost a factor 2 and this results from the incorrect velocity matrix elements when taking the limit analytically. Furthermore, the values obtained by the numerical extrapolation are close to those for GaN which is about 5.35 and with only small anisotropy for the high frequency dielectric constant. They are slightly smaller than the values obtained by calculating the adiabatic response to a static electric field using Berry phase calculations of the polarization as reported in [32], which used the local density approximation.
III.4 Valence band splittings and excitons
In this section, we turn our attention to the energy region below the band-to-band continuum. Using a smaller broadening or examining the exciton eigenvalues below the quasiparticle gap directly, we find that there are three bright excitons, each polarized along a different direction, from lower to higher energy , and . The excitons for each polarization clearly correspond to transitions from each of the top three valence bands to the CBM and are consistent with the symmetry analysis of these bands given below. The exciton energies, however, are found to be sensitive to the k-mesh used in the BSE equation. For the BSE dielectric function calculation over the full -range as shown in Fig. 5 we used a mesh with and with and . Subsequently, we used different meshes with varying from 3 to 6 to study the exciton convergence while maintaining the same . Separately, because we found (see Fig. 10) that these excitons arise primarily from the top three valence bands and the lowest conduction band, we solved the BSE equation for only and , but now going up to a mesh. The extrapolation to can be done in various ways, either fitting to an exponential saturation curve or by plotting versus and extrapolating the points with smallest to zero with a polynomial. The details of our extrapolation are described in Supplemental Material [25].
We obtain a lowest exciton gap of 3.51 eV. Comparing with the quasiparticle gap of 3.64 eV, this gives an exciton binding energy of 0.13 eV. To the precision of the calculations, the same exciton binding energy is obtained for the excitons polarized in the other directions. These exciton binding energies are overestimated because they only include electronic screening. Within a hydrogenic model of the Wannier-Mott exciton, the binding energy would be given by an effective Rydberg divided by the dielectric constant squared and multiplied by a reduced effective mass. We can thus correct for our use of only electronic screening by multiplying by a scaling factor /. Table 2 shows the and values from the literature and our scaled binding energies. The high frequency dielectric tensor of GaN was calculated by various authors using density functional perturbation theory [33, 34]. The phonon calculations in these papers provide for from the modes and for from the modes and through the Lyddane-Sachs-Teller relation, provide us the scaling factor needed. In Table 2 we used the values from Karch et al. [33] but to the precision we here require, there is good agreement also with the results extracted from Bungaro et al. [34] and also with the experimental results for both parallel and perpendicular to directions, and , given by Barker and Ilegems [35]. We can see from Table 2 that the is about 0.55 and and hence we obtain a binding energy of about 0.04 eV. Similar results are obtained for GaN and the details of these calculations are given in the Supplementary Material [25]. The resulting estimates for the exciton binding energy are of the right order of magnitude and consistent with the known values for GaN of 22-26 meV [36]. However, the accuracy with which we can obtain these exciton binding energies is still limited by the number of k-points we can afford, the number of bands we can include concurrently, and by the limitations of the present BSE implementation which does not include lattice dynamical effects.
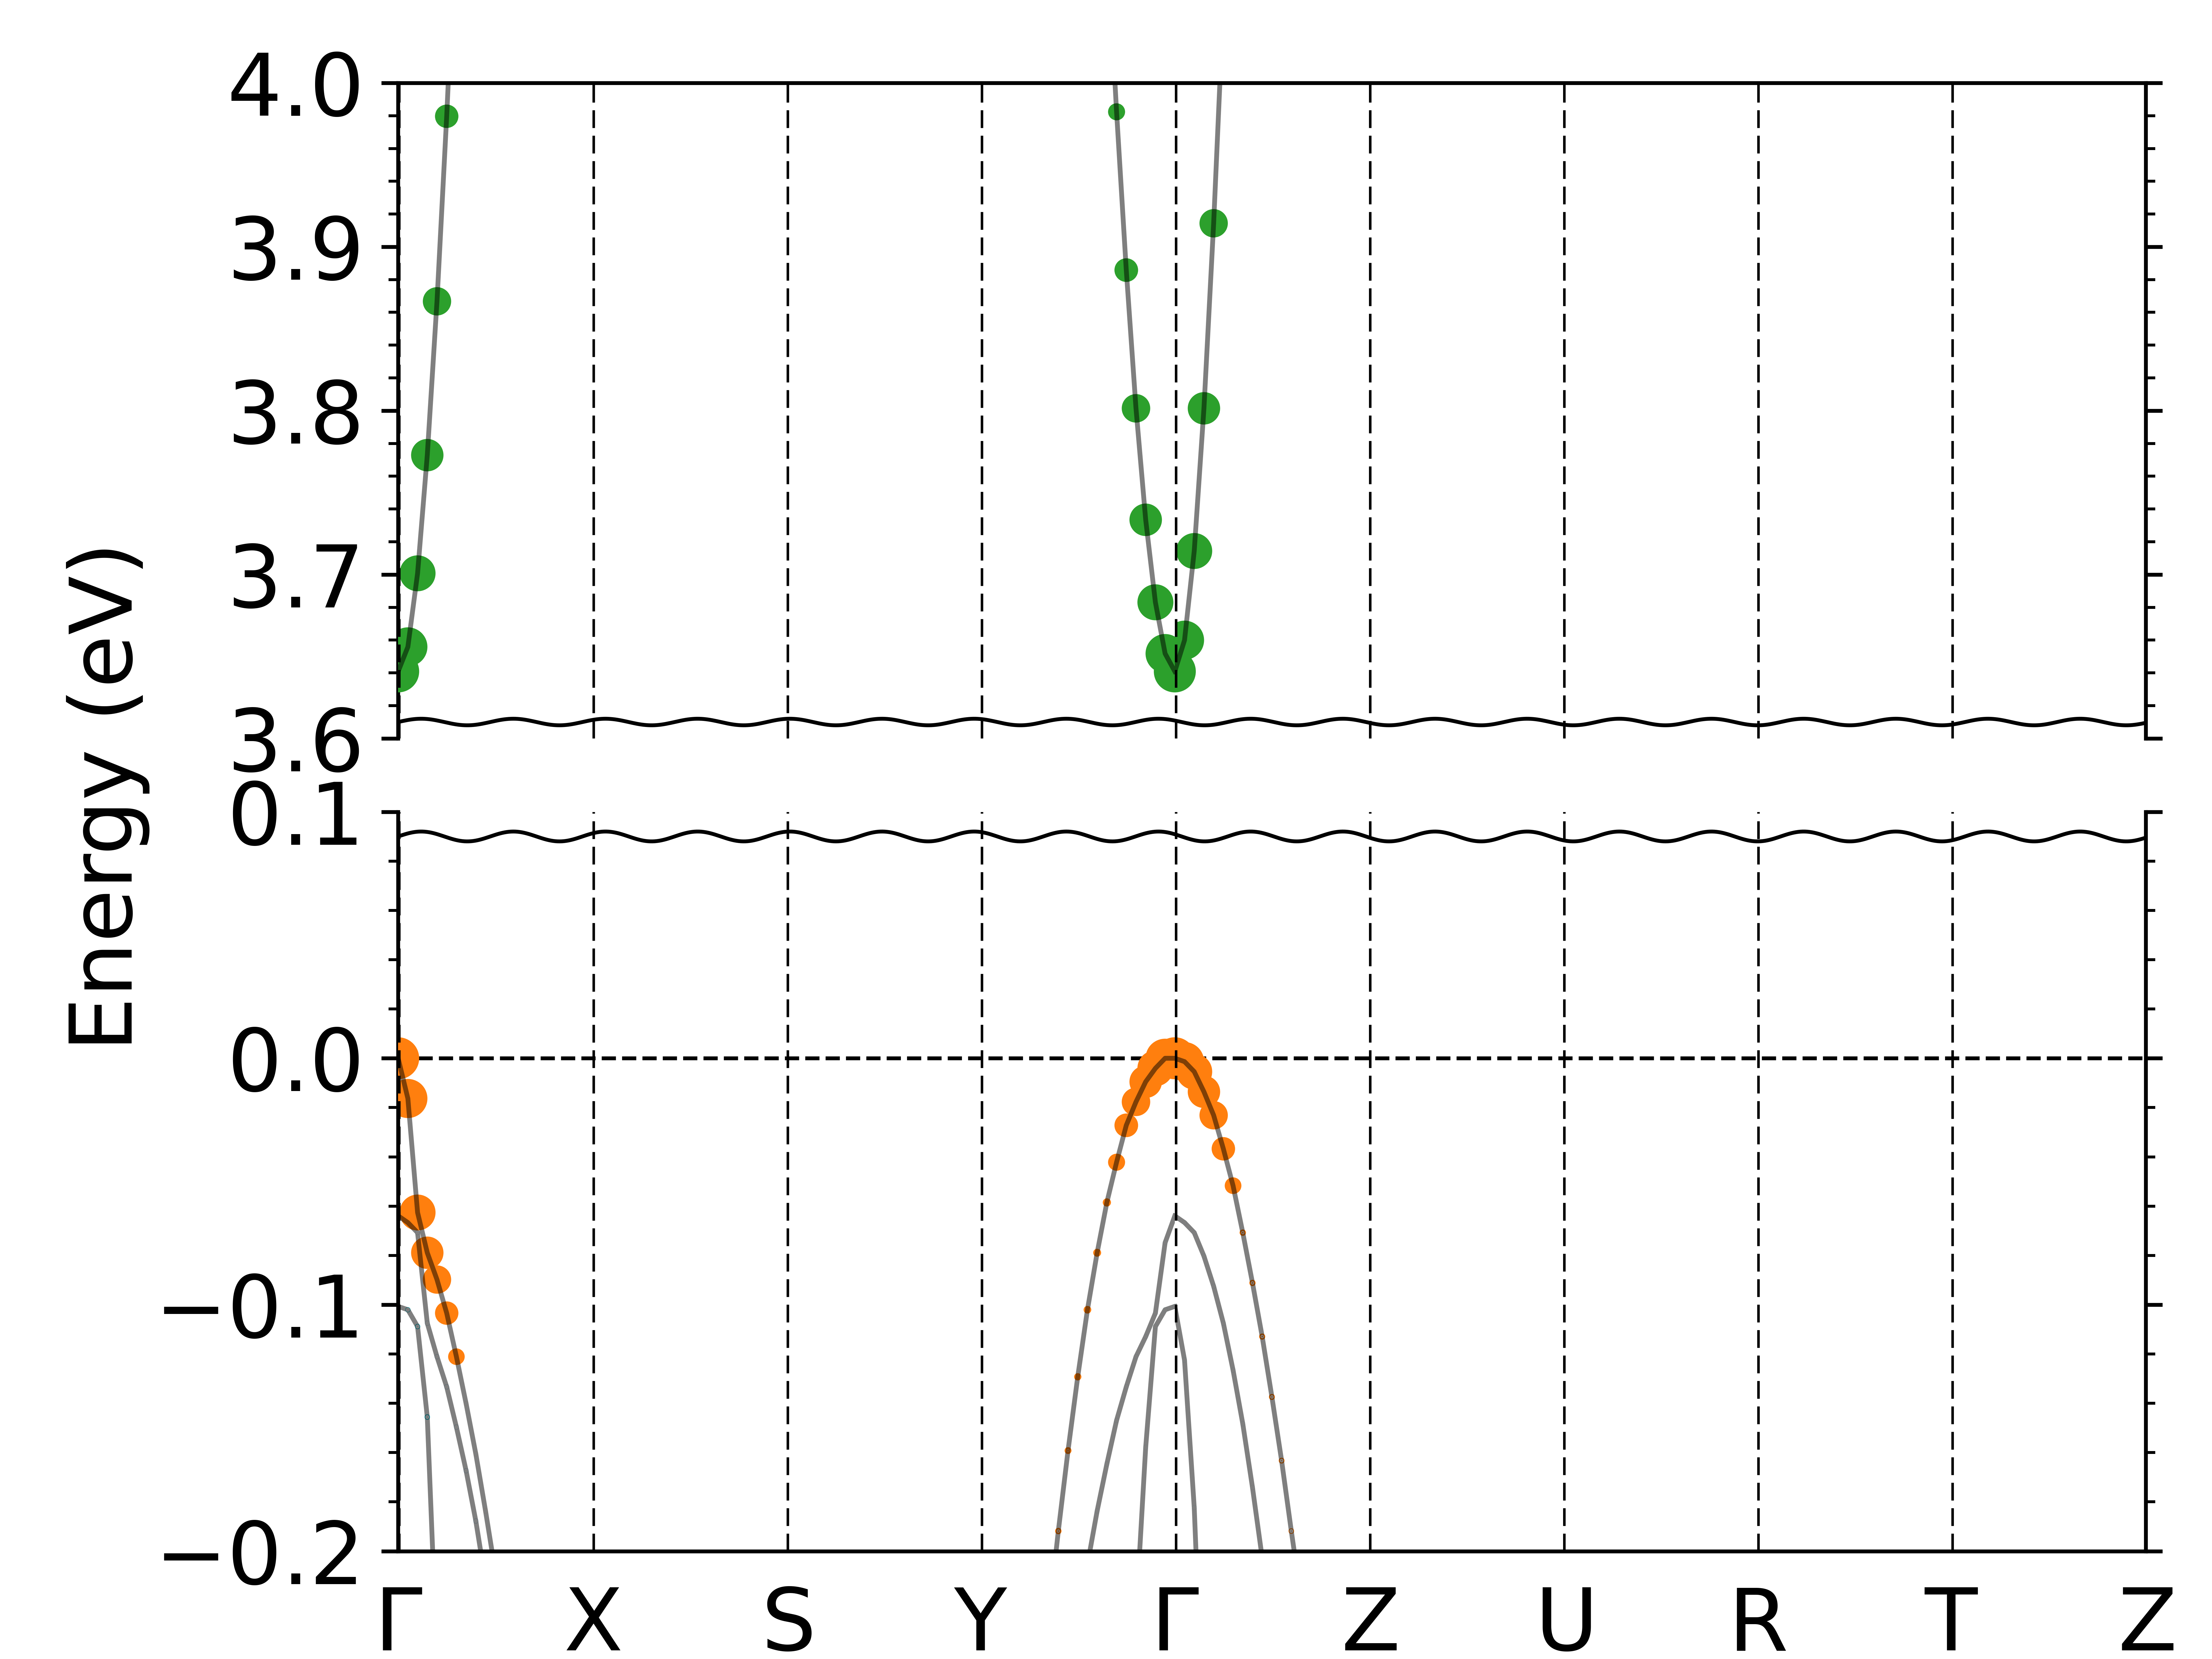
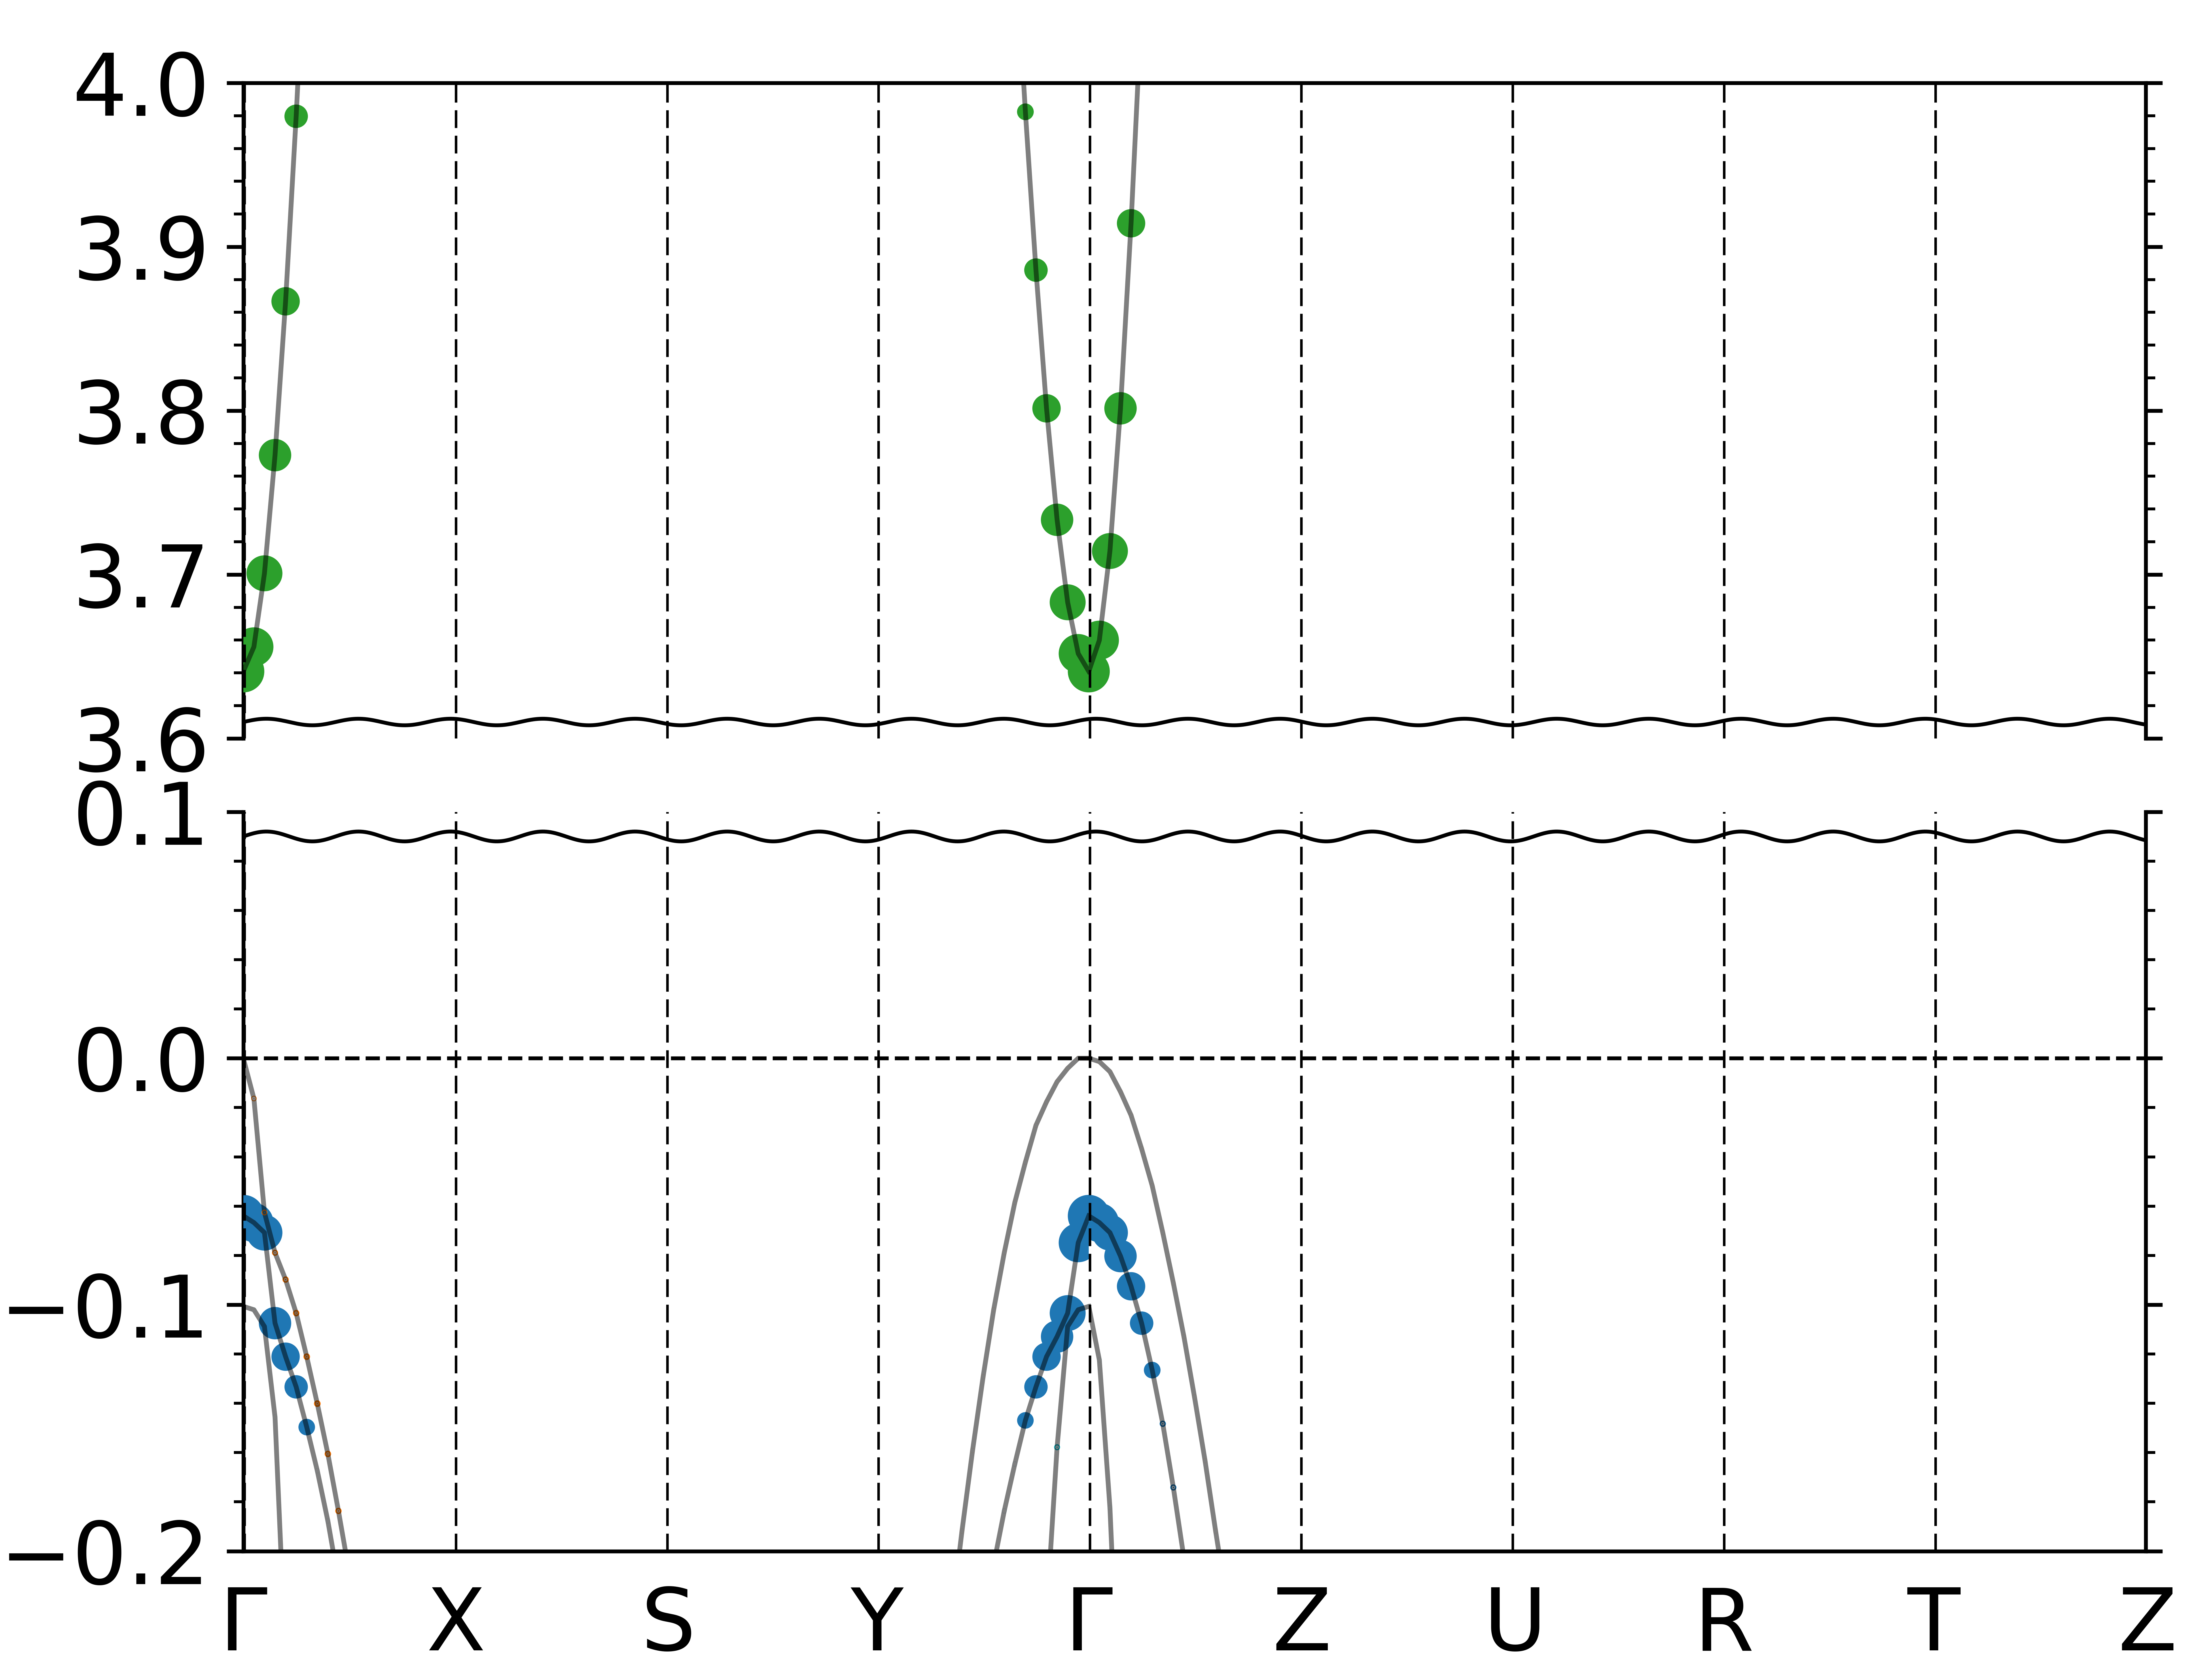
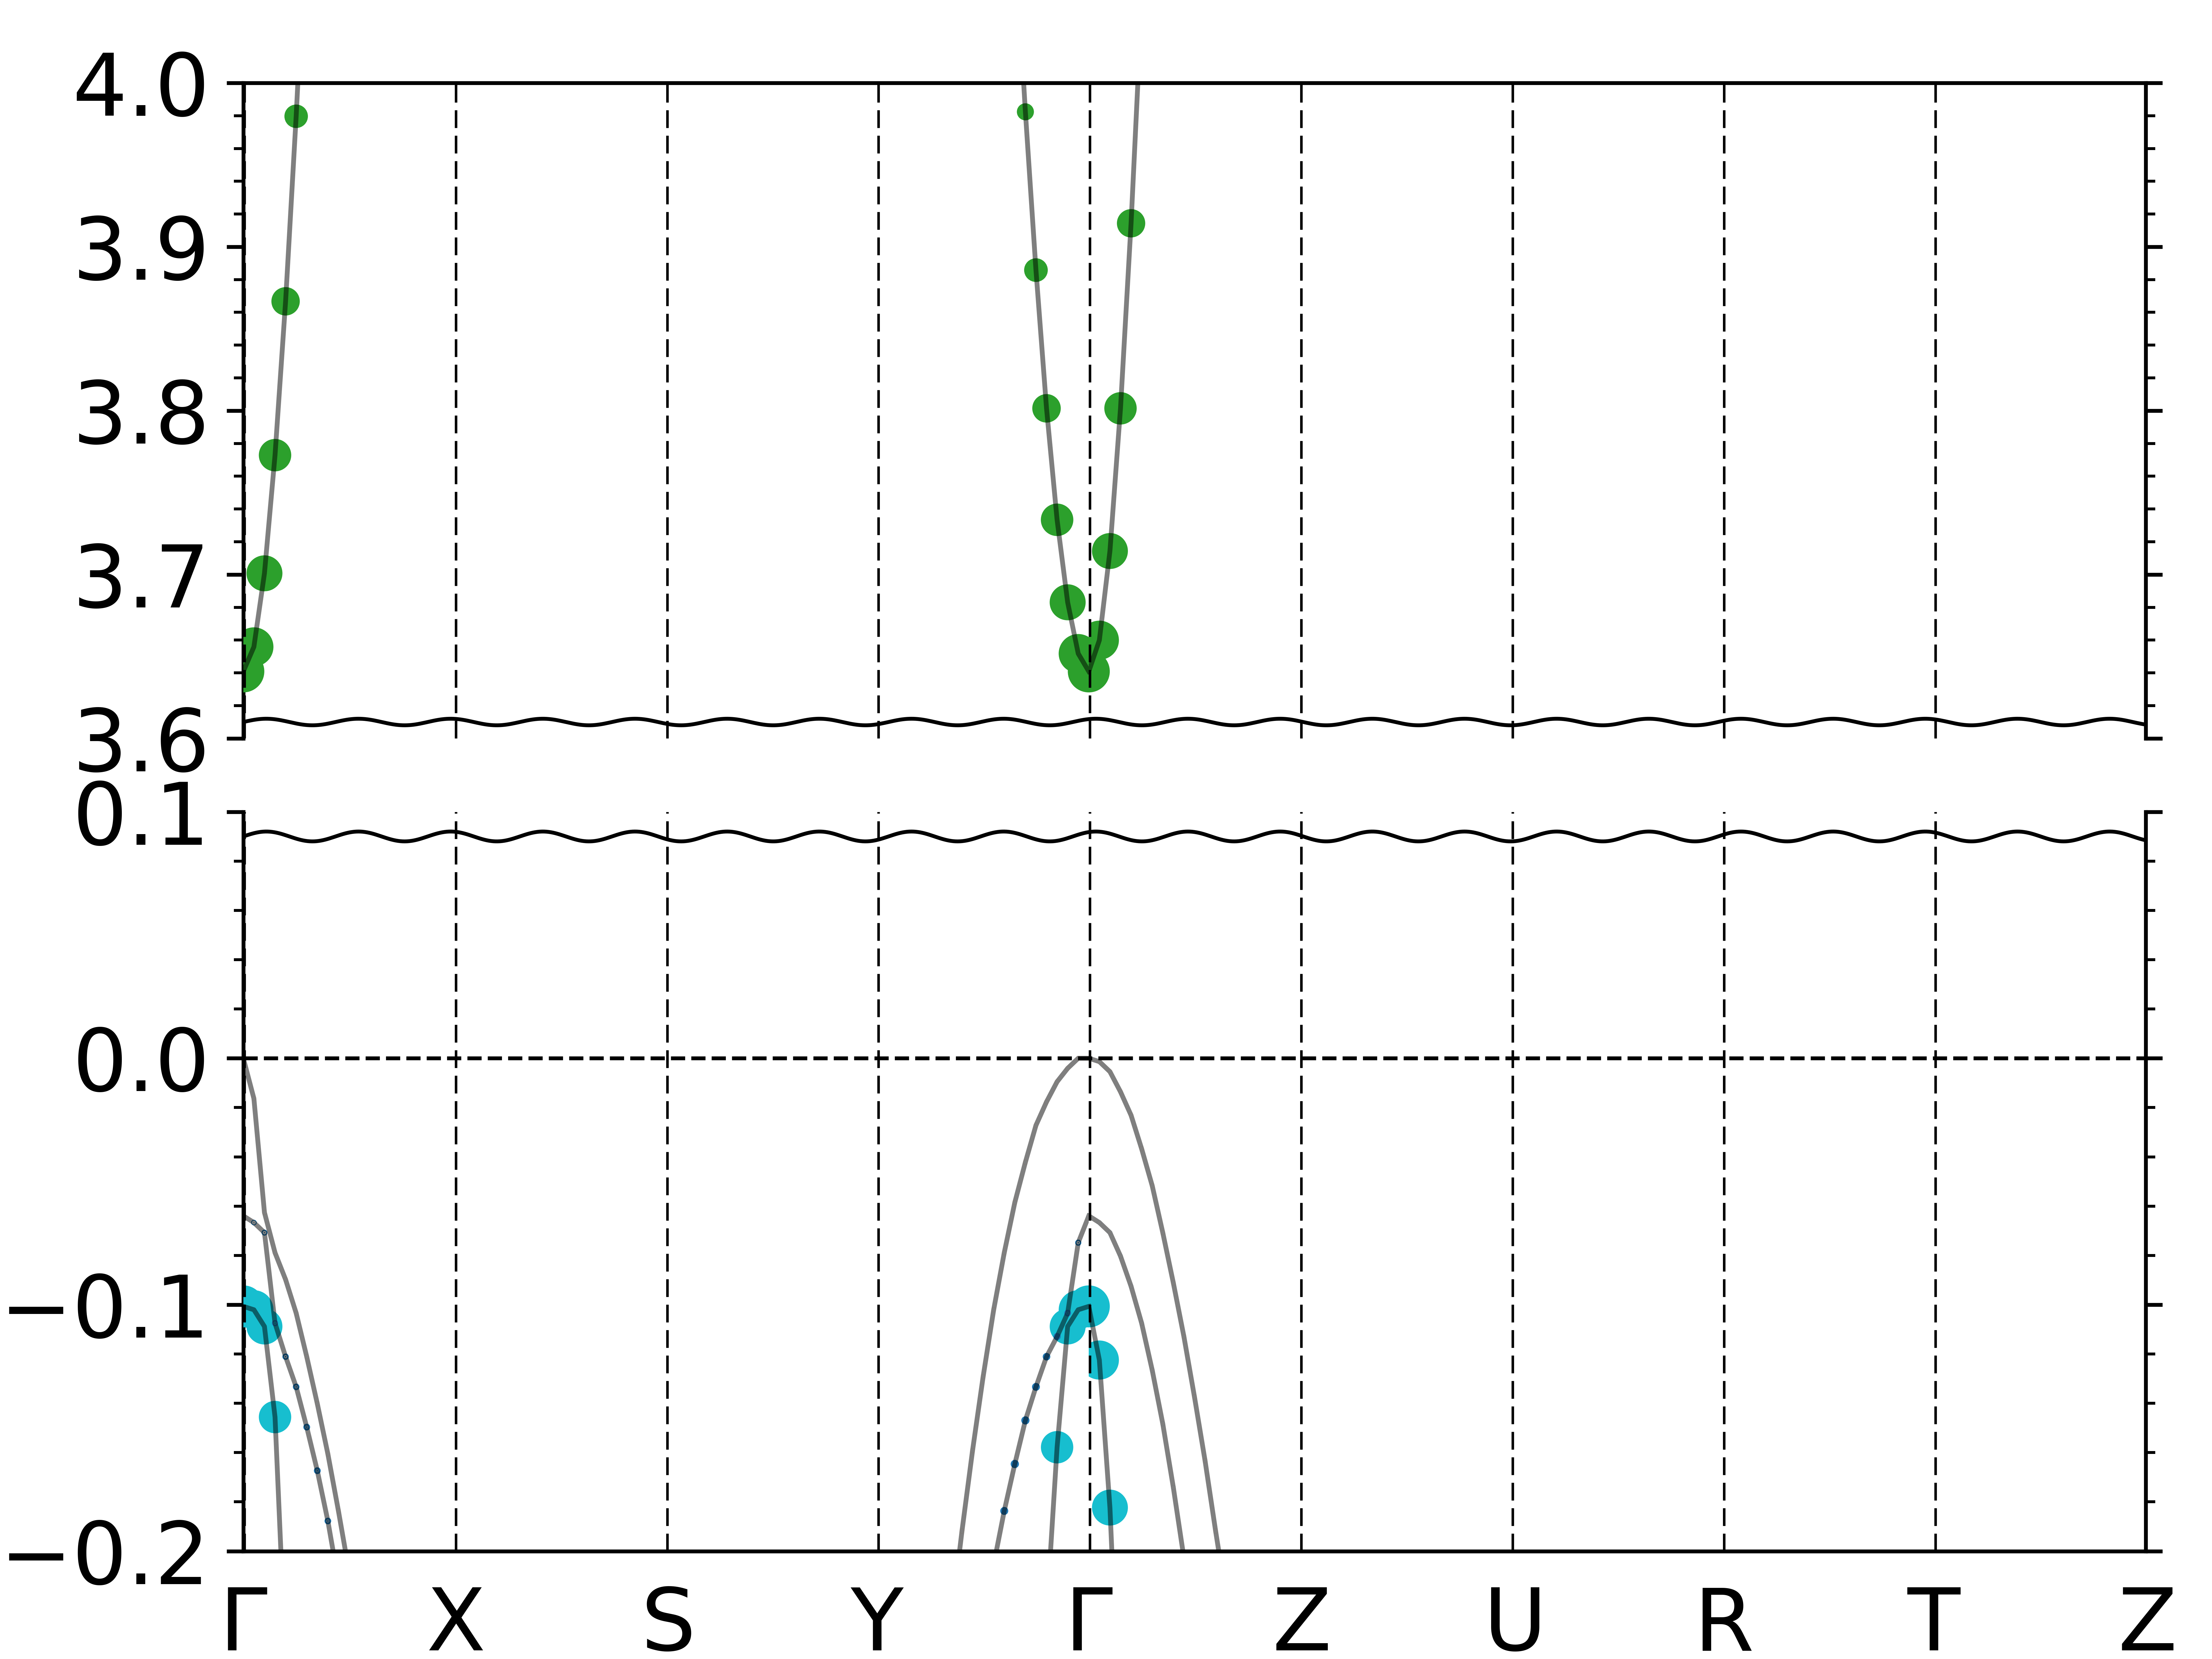
To further prove that these excitons are associated with each of the valence bands, the contribution of the valence and conduction bands in a band plot to each exciton are shown in Fig. 10. Again, this is obviously consistent with their polarization and the symmetry of the valence bands at .
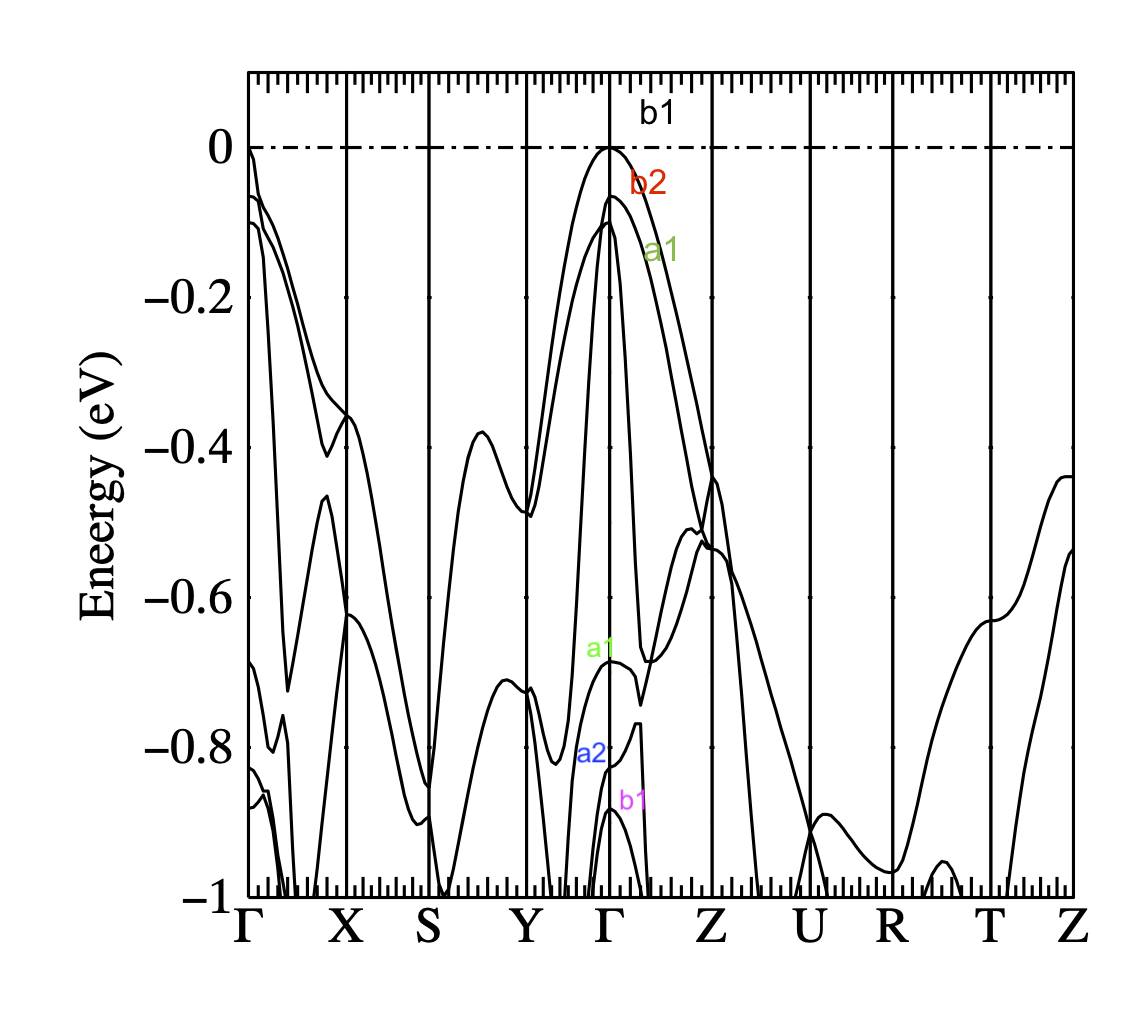
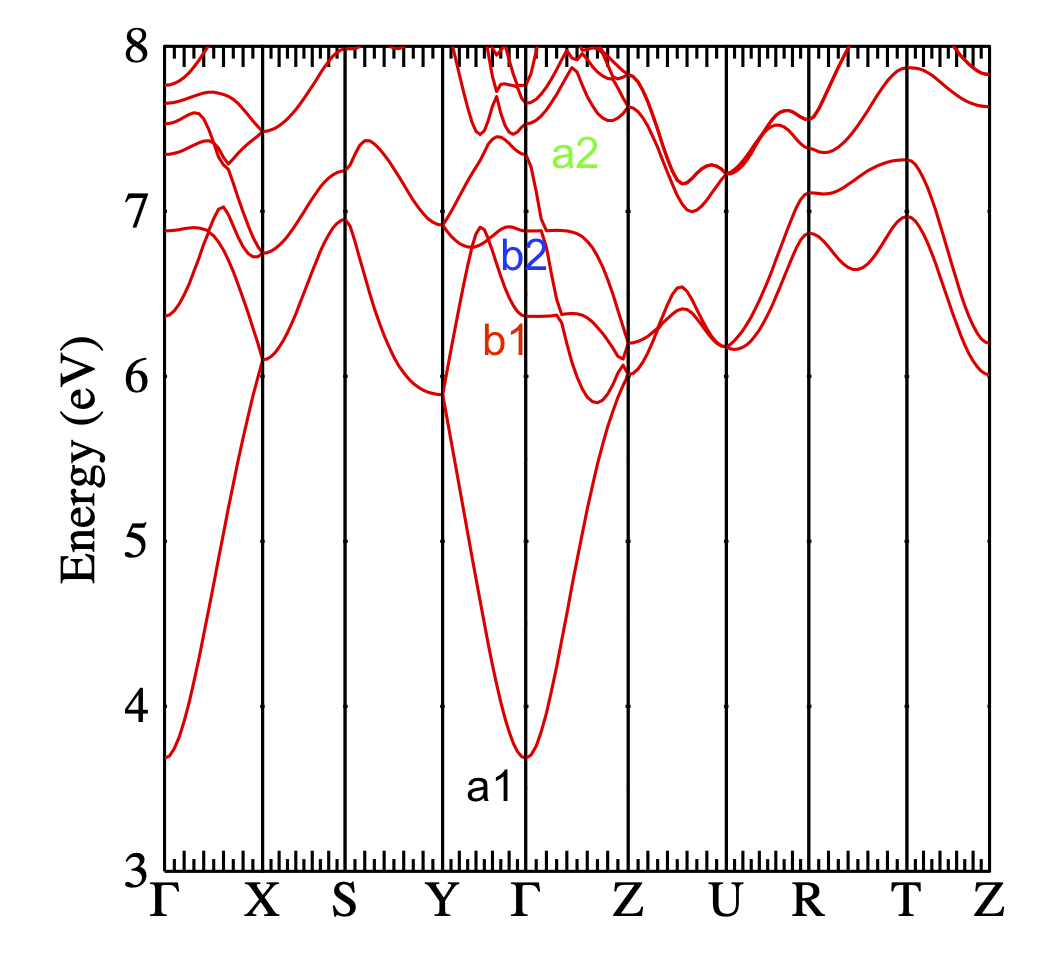
We now return to the valence band splitting itself. In Fig. 11 we show a zoom in on the valence band maximum energy range as well as the conduction band region. The bands are labeled at by their irreducible representations in the point group . The VBM has symmetry, which corresponds to , and transitions from this band to the CBM, which has -like ( in Kosteret al. notation [37]) symmetry, are thus allowed for . The next band has symmetry () corresponding to or and the third band has () symmetry corresponding to or . Note that although this ordering appears to be the same as in Ref.4, it is in fact different because a different setting of the space group, namely was used in that paper, which means that the and directions are reversed from the present paper and hence also and or and . This difference is due to a difference in the lattice constant ratio and already indicates that this splitting is sensitive to strain. We will discuss this strain dependence in the following section. The next few valence bands are also labeled in Fig. 11. The splittings between the top VBM and the next two bands are given in Table 3. The next higher conduction bands have , and symmetry and are situated at 2.68, 3.20 and 3.66 eV higher in energy, respectively.
| GGA | QS | QS | |
|---|---|---|---|
| 72 | 64 | 65 | |
| 94 | 102 | 101 |
In terms of the valence bands, one may notice that the top valence band with or -like symmetry has the smallest hole mass in the -direction, while the next one with or -like symmetry has the lowest mass in the -direction and the third valence band (counted from the top down) has the lowest mass in the direction. Thus, the symmetry of the band corresponds to the direction in which the hole mass is the smallest. This was also noted in a recent paper on MgSiN2-GaN alloys [26], although the explanation there is not quite correct. It can be explained in terms of the well-known expression for the effective mass
| (9) |
and the matrix elements between states that are non-zero can be found by symmetry. For example, for the VBM of symmetry and focusing first on the interaction between VBM and CBM, momentum matrix elements are only allowed in the direction, so these bands are pushed away from each other along , which reduces the hole mass in this direction. In the direction, only interactions with the higher conduction band; or in the direction, only interactions with the higher conduction band would come in. These will be smaller because of the larger energy denominator, hence the hole mass is expected to be smallest in the direction due to the strongest interaction with the conduction band. On the other hand, the interactions between nearby valence bands below the state would have the opposite effect of increasing the VBM hole mass. While the VBM splittings are much smaller, the momentum matrix elements must be smaller so these have less of an effect. This is because both valence bands are N2p like and intra-atomic matrix elements of the momentum operator are forbidden for the same angular momentum .
Likewise, for the second valence band the interaction with the lowest conduction band is only allowed for the direction, and for the third valence band of symmetry this interaction is only allowed for the -direction. On the other hand, from the CBM point of view, there are matrix elements with either the valence bands of symmetries in -direction, with along the direction and with along the -direction. Hence, the CBM has a nearly isotropic effective mass tensor. These considerations apply quite generally to the II-IV-N2 semiconductors.
III.5 Strain effects on valence band splittings.
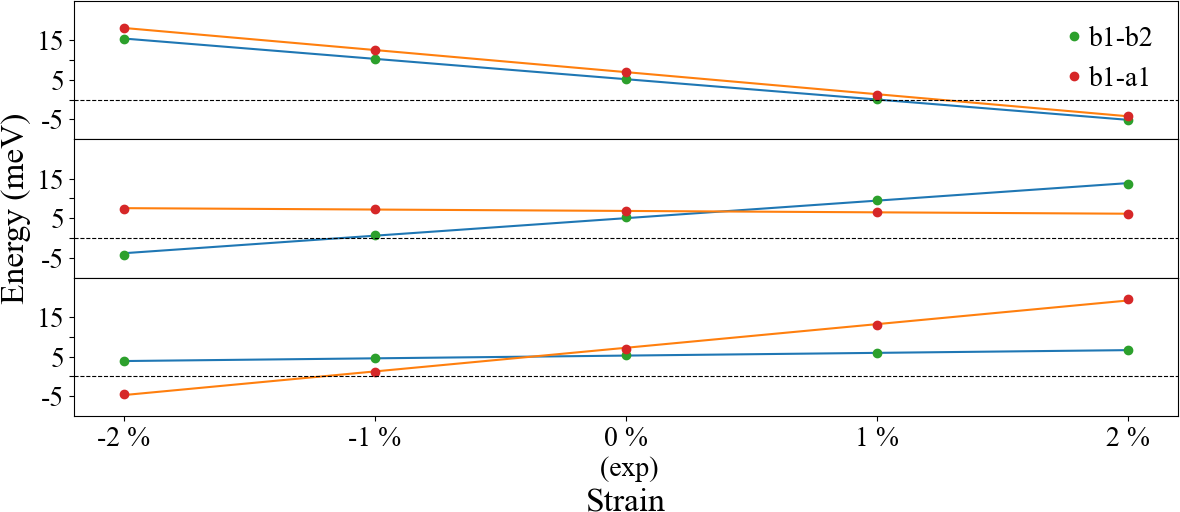
In Fig. 12, we show the strain affect on the band splittings for the top three valence bands. We analyze the changes in the splitting due to a uniaxial strain within 2 , applied on one major axis at a time, where negative strain means that the experimental lattice constants are compressed, and positive strain means they are stretched. The unit cell volume is kept constant at the experimental value. In other words, we consider pure shear strains. As shown in Fig. 11, the top three valence bands have the symmetry of , and . Fig. 12 shows the splittings and , following the same symmetry labeling. Based on symmetry grounds, we expect that with a strain along , which has symmetry, only the eigenvalue will shift. Hence, both band splittings will shift parallel to each other. We can see that compressive strain along leads to a larger and splitting. For strain along or , only eigenvalues should be affected, so the splitting stays constant but the splitting behaves linear with strain. Again, compression raises the level and hence reduces the splitting. At some point it crosses through zero at which point the VBM becomes the band. Likewise, for strain along , the level shifts and the splitting stays constant but the splitting shifts linear and crosses through zero for a critical strain.
III.6 Comparison to experimental results
We are aware of only one experimental report of the optical dielectric function in the visible to UV region. Misaki et al. [38] reported reflectivity spectra of ZnGeN2 parallel and perpendicular to the c axis, then subsequently extracted and by using the Kramers-Kronig analysis. Unfortunately, the data do not distinguish the and directions in the -plane. It is also possible that cation disorder led to effectively a wurtzite type structure. We therefore compare an average of and polarization with their results in Fig. 13. The location of the main peaks is in reasonable agreement but the magnitude of differs markedly between theory and experiment. They show a first peak near 4 eV, a main peak near 7 eV, a dip and small peak near 10 eV and then a plateau between 15 and 20 eV. These results are roughly consistent with our calculated optical properties. The experimental data show only a small anisotropy. The cut-off at lower energies is likely affected by the presence of finite film-thickness related interference effects. Our calculated values of are notably higher than the experimental values. On the theory side, this could be, in part, due to an overestimate of the velocity matrix elements. This is known to lead to an overestimate of as well as we discussed earlier. It can be remedied by performing calculations at finite close to and extrapolating instead of relying on an analytical derivation of the limit for . On the other hand, the experimental values, extracted from reflectivity may also be underestimated because of surface roughness, which can reduce the fraction of the signal that is specularly reflected [39].
IV Conclusion
In this paper we revisited the QS band structure calculations of ZnGeN2 using the experimental lattice constants and an improved calculation of the screened Coulomb interaction which includes ladder diagrams or electron-hole effects in the polarization. We also calculated the optical dielectric function corresponding to interband transitions at both the IPA and BSE levels. The differences between the two were compared with those in GaN and indicate a shift of oscillator strength of the first peak toward the critical points near its onset. These were analyzed in terms of individual band-to-band transitions, taking band folding effects into account between GaN and ZnGeN2 Brillouin zones and analysis of the IPA in terms of band-to-band differences in k-space. Well defined excitons below the gap are found but require very fine kk-meshes to determine with sufficient accuracy. Strain effects on the band splittings and hence exciton splittings resulting from the orthorhombic crystal field splitting were presented.
Acknowledgements.
This work was supported by the U.S. Department of Energy Basic Energy Sciences (DOE-BES) under grant No. DE-SC0008933. Calculations made use of the High Performance Computing Resource in the Core Facility for Advanced Research Computing at Case Western Reserve University and the Ohio Supercomputer Center.References
- Lambrecht and Punya [2013] W. R. L. Lambrecht and A. Punya, Heterovalent ternary II-IV-N2 compounds: perspectives for a new class of wide-band-gap nitrides, in III-Nitride Semiconductors and their Modern Devices, edited by B. Gill (Oxford University Press, 2013) Chap. 15, pp. 519–585.
- Lyu et al. [2019] S. Lyu, D. Skachkov, K. Kash, E. W. Blanton, and W. R. L. Lambrecht, Band gaps, band-offsets, disorder, stability region, and point defects in II-IV-n2 semiconductors, Physica Status Solidi (a) 216, 1800875 (2019).
- Martinez et al. [2017] A. D. Martinez, A. N. Fioretti, E. S. Toberer, and A. C. Tamboli, Synthesis, structure, and optoelectronic properties of II–IV–V2 materials, J. Mater. Chem. A 5, 11418 (2017).
- Punya et al. [2011] A. Punya, W. R. L. Lambrecht, and M. van Schilfgaarde, Quasiparticle band structure of zn-iv-n2 compounds, Phys. Rev. B 84, 165204 (2011).
- Hedin [1965] L. Hedin, New method for calculating the one-particle green’s function with application to the electron-gas problem, Phys. Rev. 139, A796 (1965).
- Hedin and Lundqvist [1969] L. Hedin and S. Lundqvist, Effects of electron-electron and electron-phonon interactions on the one-electron states of solids, in Solid State Physics, Advanced in Research and Applications, Vol. 23, edited by F. Seitz, D. Turnbull, and H. Ehrenreich (Academic Press, New York, 1969) pp. 1–181.
- van Schilfgaarde et al. [2006] M. van Schilfgaarde, T. Kotani, and S. Faleev, Quasiparticle Self-Consistent Theory, Phys. Rev. Lett. 96, 226402 (2006).
- Kotani et al. [2007] T. Kotani, M. van Schilfgaarde, and S. V. Faleev, Quasiparticle self-consistent GW method: A basis for the independent-particle approximation, Phys.Rev. B 76, 165106 (2007).
- [9] http://www.questaal.org/.
- Pashov et al. [2019] D. Pashov, S. Acharya, W. R. Lambrecht, J. Jackson, K. D. Belashchenko, A. Chantis, F. Jamet, and M. van Schilfgaarde, Questaal: A package of electronic structure methods based on the linear muffin-tin orbital technique, Computer Physics Communications , 107065 (2019).
- Quayle et al. [2015] P. C. Quayle, E. W. Blanton, A. Punya, G. T. Junno, K. He, L. Han, H. Zhao, J. Shan, W. R. L. Lambrecht, and K. Kash, Charge-neutral disorder and polytypes in heterovalent wurtzite-based ternary semiconductors: The importance of the octet rule, Phys. Rev. B 91, 205207 (2015).
- Shishkin et al. [2007] M. Shishkin, M. Marsman, and G. Kresse, Accurate Quasiparticle Spectra from Self-Consistent GW Calculations with Vertex Corrections, Phys. Rev. Lett. 99, 246403 (2007).
- Chen and Pasquarello [2015] W. Chen and A. Pasquarello, Accurate band gaps of extended systems via efficient vertex corrections in , Phys. Rev. B 92, 041115 (2015).
- Deguchi et al. [2016] D. Deguchi, K. Sato, H. Kino, and T. Kotani, Accurate energy bands calculated by the hybrid quasiparticle self-consistent gw method implemented in the ecalj package, Jap. J. Appl. Phys. 55, 051201 (2016).
- Chantis et al. [2006] A. N. Chantis, M. van Schilfgaarde, and T. Kotani, Ab Initio Prediction of Conduction Band Spin Splitting in Zinc Blende Semiconductors, Phys. Rev. Lett. 96, 086405 (2006).
- Bhandari et al. [2018] C. Bhandari, M. van Schilgaarde, T. Kotani, and W. R. L. Lambrecht, All-electron quasiparticle self-consistent band structures for including lattice polarization corrections in different phases, Phys. Rev. Materials 2, 013807 (2018).
- Cunningham et al. [2018] B. Cunningham, M. Grüning, P. Azarhoosh, D. Pashov, and M. van Schilfgaarde, Effect of ladder diagrams on optical absorption spectra in a quasiparticle self-consistent framework, Phys. Rev. Materials 2, 034603 (2018).
- Cunningham et al. [2021] B. Cunningham, M. Gruening, D. Pashov, and M. van Schilfgaarde, QS: Quasiparticle Self consistent GW with ladder diagrams in W (2021), arXiv:2106.05759 [cond-mat.mtrl-sci] .
- Radha et al. [2021] S. K. Radha, W. R. L. Lambrecht, B. Cunningham, M. Grüning, D. Pashov, and M. van Schilfgaarde, Optical response and band structure of including electron-hole interaction effects, Phys. Rev. B 104, 115120 (2021).
- Onida et al. [2002] G. Onida, L. Reining, and A. Rubio, Electronic excitations: density-functional versus many-body Green’s-function approaches, Rev. Mod. Phys. 74, 601 (2002).
- Rohlfing and Louie [2000] M. Rohlfing and S. G. Louie, Electron-hole excitations and optical spectra from first principles, Phys. Rev. B 62, 4927 (2000).
- Maruska and Tietjen [1969] H. P. Maruska and J. J. Tietjen, The preparation and properties of vapor-deposited single-crystalline GaN, Applied Physics Letters 15, 327 (1969).
- Leszczynski et al. [1996] M. Leszczynski, H. Teisseyre, T. Suski, I. Grzegory, M. Bockowski, J. Jun, S. Porowski, K. Pakula, J. M. Baranowski, C. T. Foxon, and T. S. Cheng, Lattice parameters of gallium nitride, Applied Physics Letters 69, 73 (1996).
- Nery and Allen [2016] J. P. Nery and P. B. Allen, Influence of Fröhlich polaron coupling on renormalized electron bands in polar semiconductors: Results for zinc-blende GaN, Phys. Rev. B 94, 115135 (2016).
- [25] Supplementary Material is available at …and provides additional detail on the band folding effects, the JDOS, and the extrapolation of the excitons as function of k-mesh.
- Dernek and Lambrecht [2022] O. Dernek and W. R. L. Lambrecht, Quaternary -GaN alloy semiconductors for deep UV applications, Phys. Rev. B 106, 235122 (2022).
- Cardona [1969] M. Cardona, Modulation Spectroscopy, Solid State Physis Suppl. 11, edited by F. Seitz, D. Turnbull, and H. Ehrenreich (Academic Press, New York, 1969).
- Aspnes [1967] D. E. Aspnes, Electric Field Effects on the Dielectric Constant of Solids, Phys. Rev. 153, 972 (1967).
- Aspnes [1980] D. E. Aspnes, Handbook of Semiconductors, edited by M. Balkasnki, Vol. 2 (North Holland, Amsterdam, 1980).
- Lambrecht and Prikhodko [2002] W. R. Lambrecht and M. Prikhodko, Anisotropy of UV-reflectivity in wurtzite crystals: a comparison between GaN and CdSe, Solid State Communications 121, 549 (2002).
- Cappellini et al. [1993] G. Cappellini, R. Del Sole, L. Reining, and F. Bechstedt, Model dielectric function for semiconductors, Phys. Rev. B 47, 9892 (1993).
- Paudel and Lambrecht [2008] T. R. Paudel and W. R. L. Lambrecht, First-principles study of phonons and related ground-state properties and spectra in Zn-IV-N2 compounds, Phys. Rev. B 78, 115204 (2008).
- Karch et al. [1998] K. Karch, J.-M. Wagner, and F. Bechstedt, Ab initio study of structural, dielectric, and dynamical properties of GaN, Phys. Rev. B 57, 7043 (1998).
- Bungaro et al. [2000] C. Bungaro, K. Rapcewicz, and J. Bernholc, Ab initio phonon dispersions of wurtzite AlN, GaN, and InN, Phys. Rev. B 61, 6720 (2000).
- Barker and Ilegems [1973] A. S. Barker and M. Ilegems, Infrared Lattice Vibrations and Free-Electron Dispersion in GaN, Phys. Rev. B 7, 743 (1973).
- Reimann et al. [1998] K. Reimann, M. Steube, D. Fröhlich, and S. Clarke, Exciton binding energies and band gaps in GaN bulk crystals, Journal of Crystal Growth 189-190, 652 (1998).
- Koster et al. [1963] G. F. Koster, J. O. Dimmock, R. G. Wheeler, and H. Statz, Properties of the Thirty-Two Point Groups (MIT Press, Cambridge, MA, 1963).
- Misaki et al. [2003] T. Misaki, A. Wakahara, H. Okada, and A. Yoshida, Optical properties of ZnGeN2 epitaxial layer, Phys. Stat. Solidi (c) 0, 2890 (2003).
- Lambrecht et al. [1995] W. R. L. Lambrecht, B. Segall, J. Rife, W. R. Hunter, and D. K. Wickenden, UV reflectivity of GaN: Theory and experiment, Phys. Rev. B 51, 13516 (1995).