Ab initio study on the stability and elasticity of brucite
Abstract
Brucite (Mg(OH)2) is a mineral of great interest owing to its various applications and roles in geological processes. Its structure, behavior under different conditions, and unique properties have been the subject of numerous studies and persistent debate. As a stable hydrous phase in subduction zones, its elastic anisotropy can significantly contribute to the seismological properties of these regions. We performed ab initio calculations to investigate brucite’s stability, elasticity, and acoustic velocities. We tested several exchange-correlation functionals and managed to obtain stable phonons for the phase with SCAN for the first time at all relevant pressures up to the mantle transition zone. We show that SCAN performs very well in brucite, reproducing the experimental equation of state and several key structure parameters related to hydrogen positions. The room temperature elasticity results in reproduces the experimental results at ambient pressure. These results, together with the stable phonon dispersion of at all relevant pressures, indicate is the stable candidate phase not only at elevated pressures but also at ambient conditions. The success of SCAN in brucite, suggests this functional should be suitable for other challenging layer-structured minerals, e.g., serpentines, of great geophysical significance.
I Introduction
Water, incorporated stoichiometrically in hydrous minerals, as hydrous defects, or in melts, plays a pivotal role in Earth’s interior dynamics. It lowers the sub-solidus viscosity of rocks and internal frictions facilitating earthquakes [1, 2]. Each year, significant amounts of water ( kg) enter Earth’s mantle through the subduction process [3]. In the upper mantle, water reacts with rocks beneath the crust to form hydrous minerals and enters the subduction process. Carried to greater depths, increased pressure and temperature produce dehydration, resulting in slab embrittlement. Formed at the early stages of the subduction process, sheet-like hydrous minerals, e.g., brucite and serpentine phases, are the major water carriers at upper mantle depths. These minerals consist of Mg-Si-O-containing layers bounded only by hydrogen bonds (H-bonds) and are weak in shear strengths, facilitating the slab subduction process [4, 5]. Given the intricate details of their formation and participation in geotectonic processes, the understanding of serpentine phases deepens our grasp of geological processes in the upper mantle and the importance of water in shaping them.
To address phase relations in these hydrous phases, it is necessary to address brucite (Mg(OH)2) first. As one of the simplest and most water-abundant minerals within the ternary MgO-SiO2-H2O (MSH) system [6], brucite is central in the many geochemical processes of serpentine formation and transformation that occur in subducted slabs. For example, brucite participates in the retrograde formation of antigorite from olivine (Mg2SiO4) or dehydration of antigorite (Mg3m-3Si2mO5m(OH)4m-6) [4] and in the lizardite (Mg3Si2O5(OH)4) to antigorite transition [4, 7, 8], both being serpentine-type phases. So, we need to address brucite also to understand phase relations between these complex serpentine phases.
Ever since the structure of brucite was first refined in 1967 with the space group [9], such assignment has been a subject of continuous debate. The original work did not account for the “riding” motion of hydrogen and got an inaccurate O—H bond length [10]. Neutron diffraction [11, 12] and ab initio molecular dynamics simulations [13] suggest protons are displaced from the threefold axis at elevated pressures. To accommodate this disordered displacement of protons from high-symmetry positions, an enlarged supercell structure with lower, symmetry, was proposed in 2006 [14]. Still, no consensus has been reached on whether , [15, 16] or [17], or a structure with even lower symmetry [18] describes brucite’s stable phase at ambient conditions.
Resolving the structure of brucite and being able to describe its vibrational properties is the first step to computing its thermodynamic and thermoelastic properties at high pressures and high temperatures (high-). The Wu-Wentzcovitch semi-analytical method (SAM-Cij) [19, 20] is a concise and predictive formalism to calculate the thermoelastic tensor (Cij) of crystalline solids that depends on the existence of stable phonons [21, 22, 23], still debatable for brucite minerals [18, 15]. This method has been successfully applied to materials across all crystal systems in conjunction with ab initio calculations of static elastic coefficients and phonon frequencies.
This work reevaluates brucite’s phonon stability issue using density-functional theory (DFT) with SCAN [24] description of the exchange-correlation energy. Compared to PBE [25] and LDA [26], the SCAN meta-GGA functionals [27] describes better the H-bond compressive behavior[28, 29, 30]. The SCAN functional has the same accuracy as the SCAN functional but performs better numerically. It also slightly improves dynamic stability [31]. This method stabilizes the structure’s phonon dispersion in a wide pressure range of geophysical significance. Here we report the high-temperature elastic properties and velocities of brucite, for the first time, using the SAM-Cij method.
II Method
All density-functional theory calculations were conducted using the projector augmented wave (PAW) method [32] implemented in the VASP code [33]. We employed the SCAN [24] exchange-correlation functional. Local density approximations (LDA) [26] and generalized gradient approximations (GGA) parameterized by the Perdew-Burke-Ernzerhof formula (PBE) [25] were also used to compare with the SCAN results. A plane-wave basis was used with a kinetic energy cutoff of 800 eV. We chose a -point of 4 × 4 × 4, which ensures the calculations are converged to eV. The full Brillouin zone phonon spectra were calculated on the 2 × 2 × 2 supercells using the finite displacement method implemented in Phonopy [34]. The structures at elevated pressures are calculated by uniformly scaling the structure at ambient pressure and then relaxing at constant volumes. The static elastic coefficient tensor was obtained using the stress vs. strain relations resulting from 1% infinitesimal strain.
The high-temperature elastic tensor is calculated using the Python package cij [20]. Its components are written as a derivative of the Helmholtz free energy under isothermal conditions [35, 19, 20]:
| (1) |
Here, () represents the infinitesimal strains, represents pressure, represents the Kronecker delta symbol, and represents the Helmholtz free energy, which can be calculated using the quasiharmonic approximation (QHA) [36]:
| (2) |
Here, represents the vibrational frequency of the -th normal mode with the phonon wave vector . , represent the equilibrium volume and temperature. and are the reduced Planck and Boltzmann constant, respectively.
Crystal structure images are created using VESTA [37].
III Results and Discussion
III.1 Structure optimization
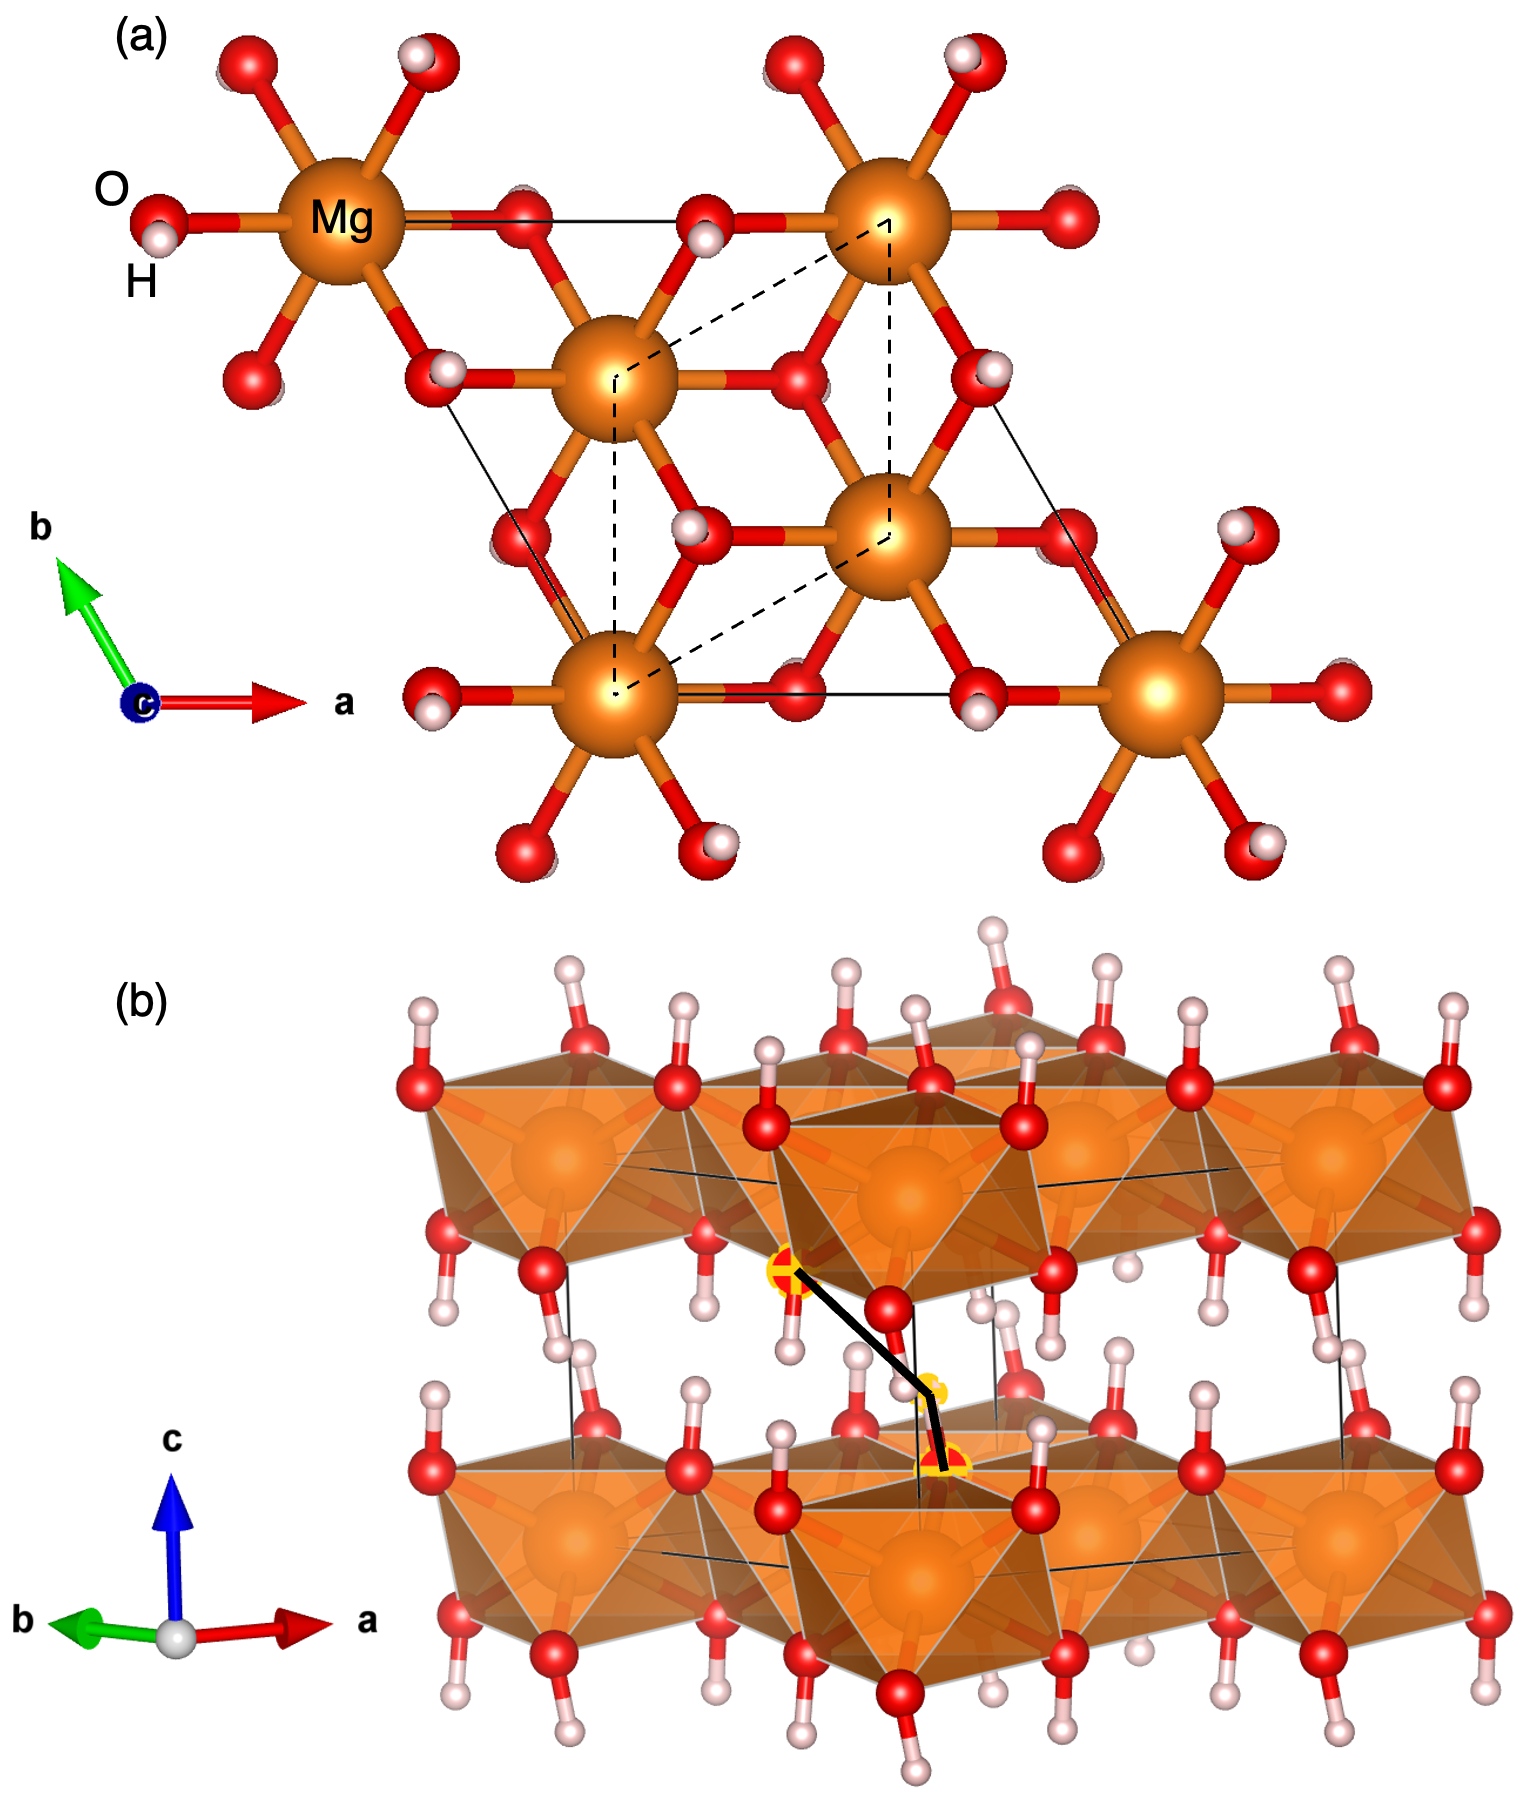
The crystal structure of brucite was first refined by Zigan and Rothbauer [9] in the space group with protons on the threefold axis corresponding to the Wyckoff position . Each hydroxyl is surrounded by three oppositely oriented hydroxyl groups of the overlying layer. Subsequent theoretical [13] and experimental studies [38] found the protons tend to displace from the site to the Wyckoff site at with an occupation of 1/3 at elevated pressure. The value of could be either (so-called the greater than third, or XGT, arrangement) or (the less than third, or XLT, arrangement). In ab initio calculations, the 1/3 occupation can be simulated by supercells. Mookerjee and Stixrude [14] modeled the transition of hydrogen to XGT position using an enlarged supercell. This model minimizes the interlayer HO distance, resulting in a symmetry (a maximum subgroup of ) for brucite. The XLT arrangement conserves the symmetry but is energetically unfavorable. It is important to note that the model is equivalent to with displaced hydrogen at the position. The relation of and brucite is shown in Figure 1.
Table 1 shows the lattice parameters and volumes at ambient conditions compared to the previous calculations and measurements. In , is divided by for comparison with . All experiments in Table 1 are at room temperature and ambient pressure, and all calculations are static 0 GPa unless otherwise stated. It is also important to notice that even though all experiments assume the space group of , some did obtain the results where hydrogen atoms are favored at positions [12, 38, 11]. The most important factor for all calculations is the choice of exchange-correlation functionals. Our results are similar to previous results with the same exchange-correlation functionals. The brucite is slightly smaller than the counterpart. The difference between the two phases also depends heavily on the choice of exchange-correlation functionals. For PBE or PBEsol functionals, the difference is minor, at 0.001 Å for and 0.01 Å for . Our LDA results show a difference of 0.02 Å in and 0.1 Å in . Also, since all measurements are performed at room temperature, an ideal description of static volume needs to be smaller than the measurements (volume Å3). In Table 1, only LDA, B3YLP-D, and SCAN satisfy this condition. In addition, Ref. [7] showed the LDA results with 300 K thermal correction, and the results still differ considerably from the experimental results. From the static results, SCAN and B3YLP are better choices for the brucite system than LDA and PBE, but LDA and PBE provide good lower and upper bounds for the key structure parameters.
| Space group | (Å) | (Å) | Volume (Å3) | Method | Reference | |
|---|---|---|---|---|---|---|
| 3.146 | 4.768 | 1.515 | 40.868 | X-ray Diffraction | Fei and Mao (1993) [39] | |
| 3.138 | 4.713 | 1.502 | 40.200 | Neutron Diffraction | Parise (1994) [12] | |
| 3.150 | 4.720 | 1.498 | 40.560 | Neutron Diffraction | Catti (1995) [11] | |
| 3.145 | 4.769 | 1.516 | 40.851 | X-ray Diffraction | Duffy (1995) [40] | |
| 3.148 | 4.779 | 1.518 | 41.015 | Neutron Diffraction | Desgranges (1996) [38] | |
| 3.148 | 4.771 | 1.516 | 40.930 | X-ray Diffraction | Fukui (2003) [41] | |
| 3.150 | 4.783 | 1.518 | 41.101 | Brillouin Scattering | Jiang (2006) [42] | |
| 3.155 | 4.772 | 1.512 | 41.147 | Neutron Diffraction | Xu (2013) [43] | |
| 3.147 | 4.757 | 1.512 | 40.793 | X-ray Diffraction | Ma (2013) [44] | |
| 3.146 | 4.770 | 1.516 | 40.890 | X-ray Diffraction | Pilai (2021) [15] | |
| 3.199 | 4.844 | 1.514 | 41.780 | PBE | Moohkerjee and Stixrude (2006) [14] | |
| 3.070 | 4.400 | 1.433 | 36.000 | LDA | Ghaderi (2015) [7] | |
| 3.080 | 4.440 | 1.442 | 36.660 | LDA+MGD 300 K | Ghaderi (2015) [7] | |
| 3.200 | 4.840 | 1.513 | 41.700 | PBE | Ghaderi (2015) [7] | |
| 3.188 | 4.786 | 1.501 | 42.120 | PBEsol | Treviño (2018) [18] | |
| 3.186 | 4.777 | 1.499 | 42.000 | PBEsol | Treviño (2018) [18] | |
| 3.141 | 4.666 | 1.486 | 39.900 | B3YLP-D | Ulian (2019) [45] | |
| 3.129 | 4.657 | 1.488 | 39.500 | B3YLP-D | Ulian (2019) [45] | |
| 3.186 | 4.848 | 1.522 | 42.611 | vdW-DF2 | Pilai (2021) [15] | |
| 3.092 | 4.510 | 1.458 | 37.350 | LDA | This work | |
| 3.074 | 4.418 | 1.437 | 36.164 | LDA | This work | |
| 3.183 | 4.900 | 1.539 | 42.997 | PBE | This work | |
| 3.182 | 4.894 | 1.538 | 42.927 | PBE | This work | |
| 3.139 | 4.730 | 1.507 | 40.374 | SCAN | This work | |
| 3.129 | 4.662 | 1.490 | 39.532 | SCAN | This work |
III.2 Phonon stability
Phonon stability in brucite has been a debated topic in recent years. Treviño et al. [18] suggested that brucite needs to transform into a structure with an even lower symmetry than or . They ruled out and phases as they display unstable temperature-dependent phonons at 300 K. According to their 300 K calculations using PBEsol, only has stable phonons; at higher temperatures, the other phases would also display stable phonons. However, in their comparison, the -path for the phase dispersion is non-equivalent from those in and , which makes the comparison ambiguous. Also, their choice of PBEsol overestimates the volume of both and phases (see Table 1).
Ab initio phonon calculations performed by Pillai et al. [15] suggested the symmetry would be the stable structure at ambient conditions using a non-empirical van der Waals functional (vdW-DF2) method. The discrepancy in their results suggests the importance of suitable exchange-correlation functionals for brucite. However, as shown in Table 1, the vdW-DF2 results also overestimate the volume.
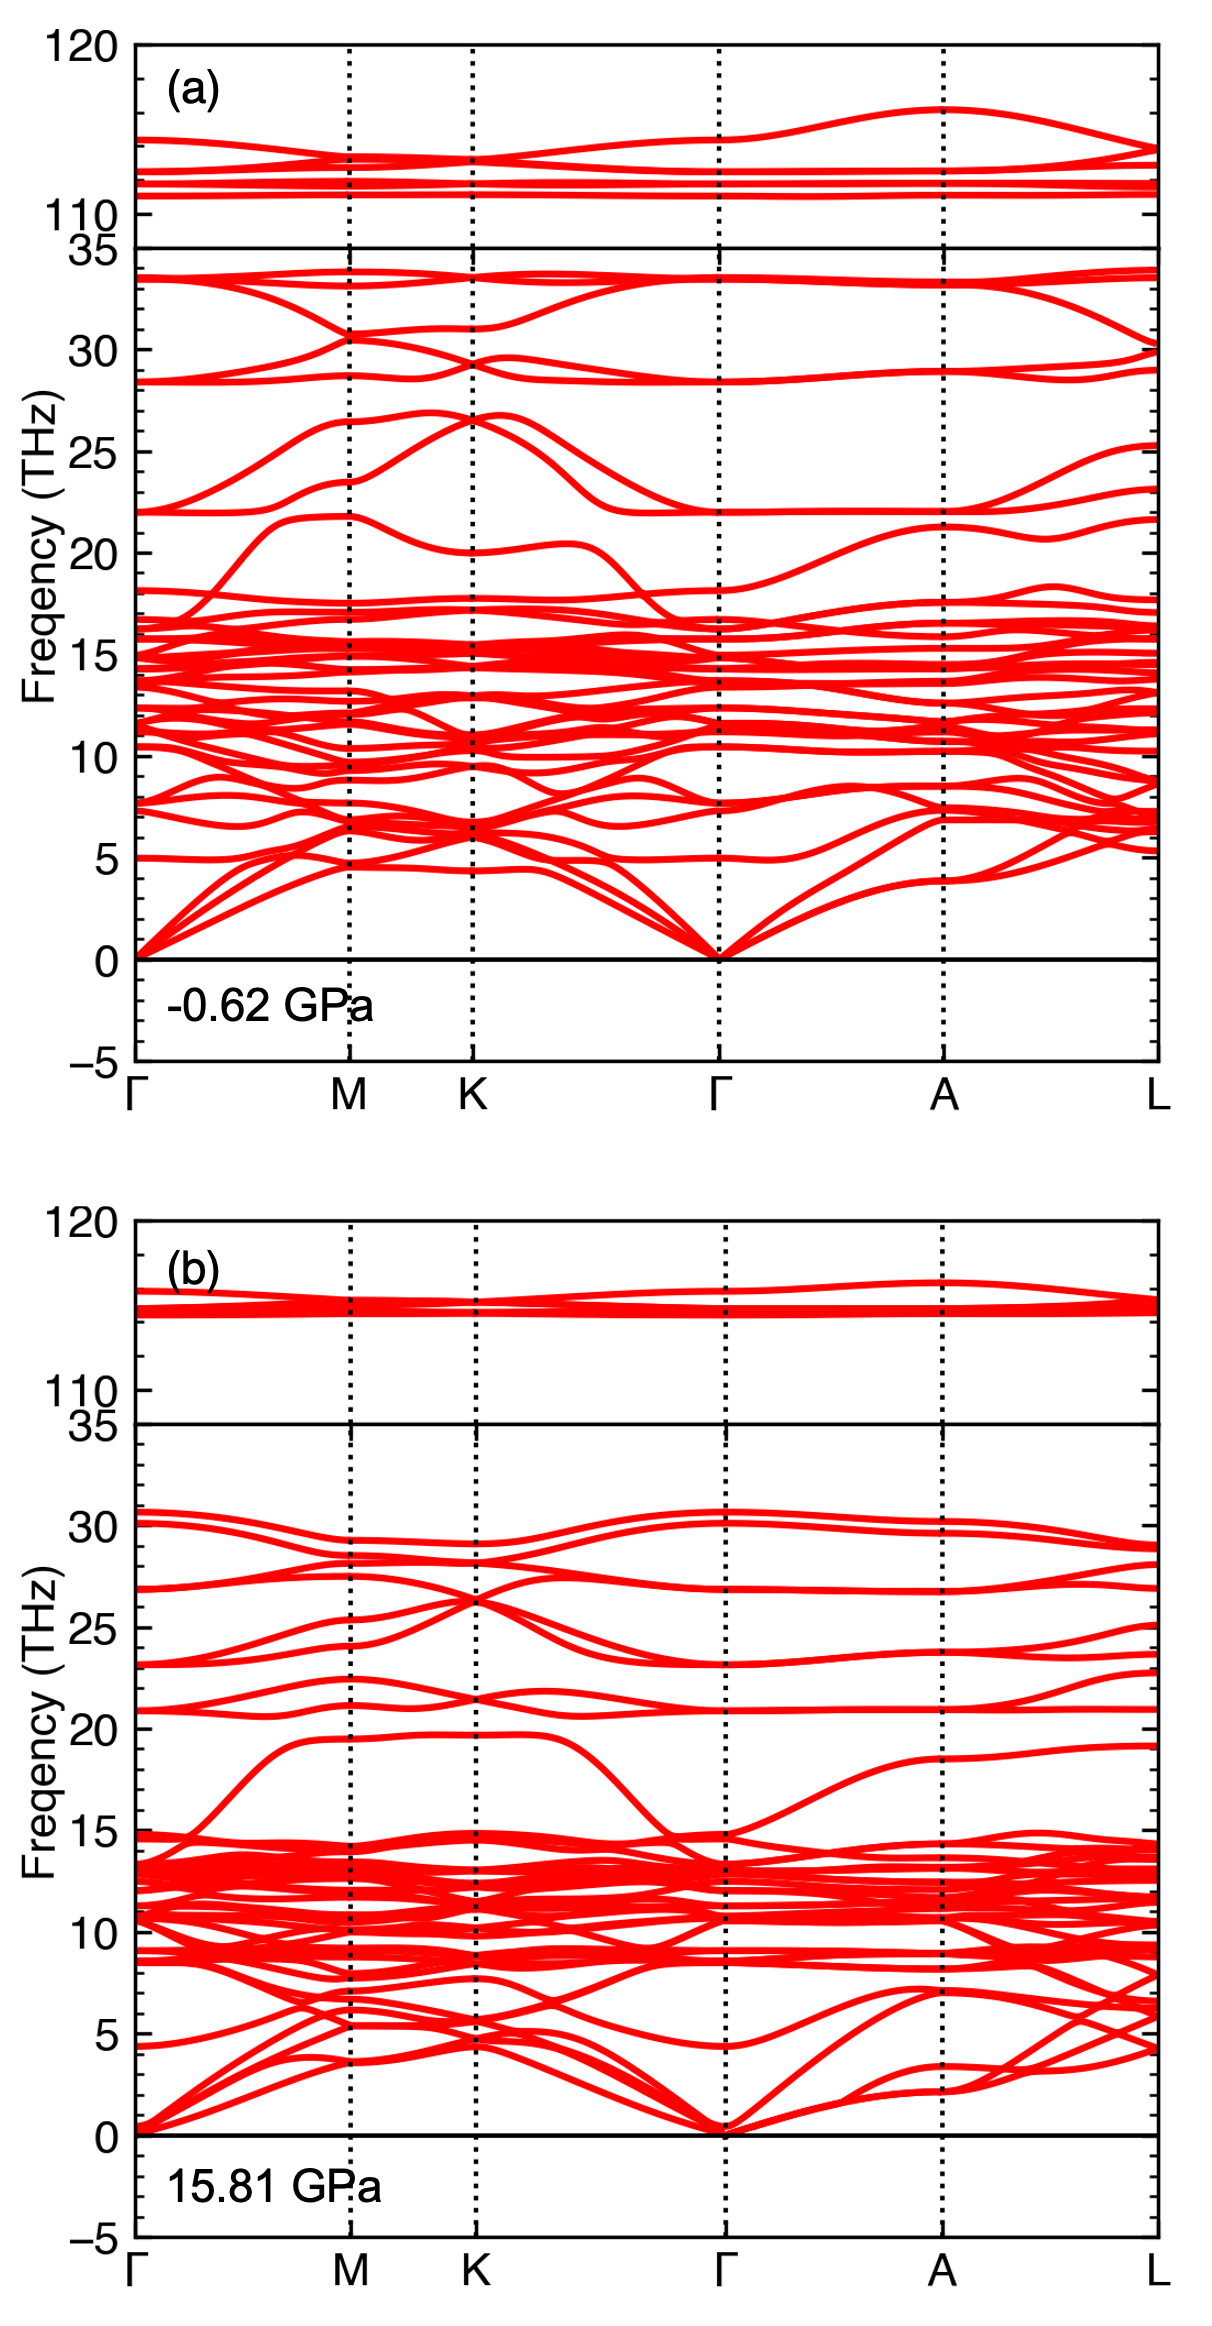
The success of SCAN in describing the brucite structures suggests this functional should also be successful for phonon calculations. We calculate phonon dispersions for and phases at a series of pressures. Figure 2 shows the phonon dispersions of brucite at ambient and elevated pressures. Detailed phonon dispersions for and brucite at several pressures can be found in the supplemental Figs. S1 and S2. In contrast to previous results using other functionals [18, 15], we find stable phonons for at all investigated pressures and unstable modes for (Figs. S1 and S2). This indicates that SCAN , a functional that successfully describes H-bonds, can also stabilize brucite at low and elevated pressures. Although the consensus seems to be that is the stable brucite phase at higher pressure, this is the first time that stable phonons of brucite are shown at elevated pressures.
III.3 Equation of state (EoS)
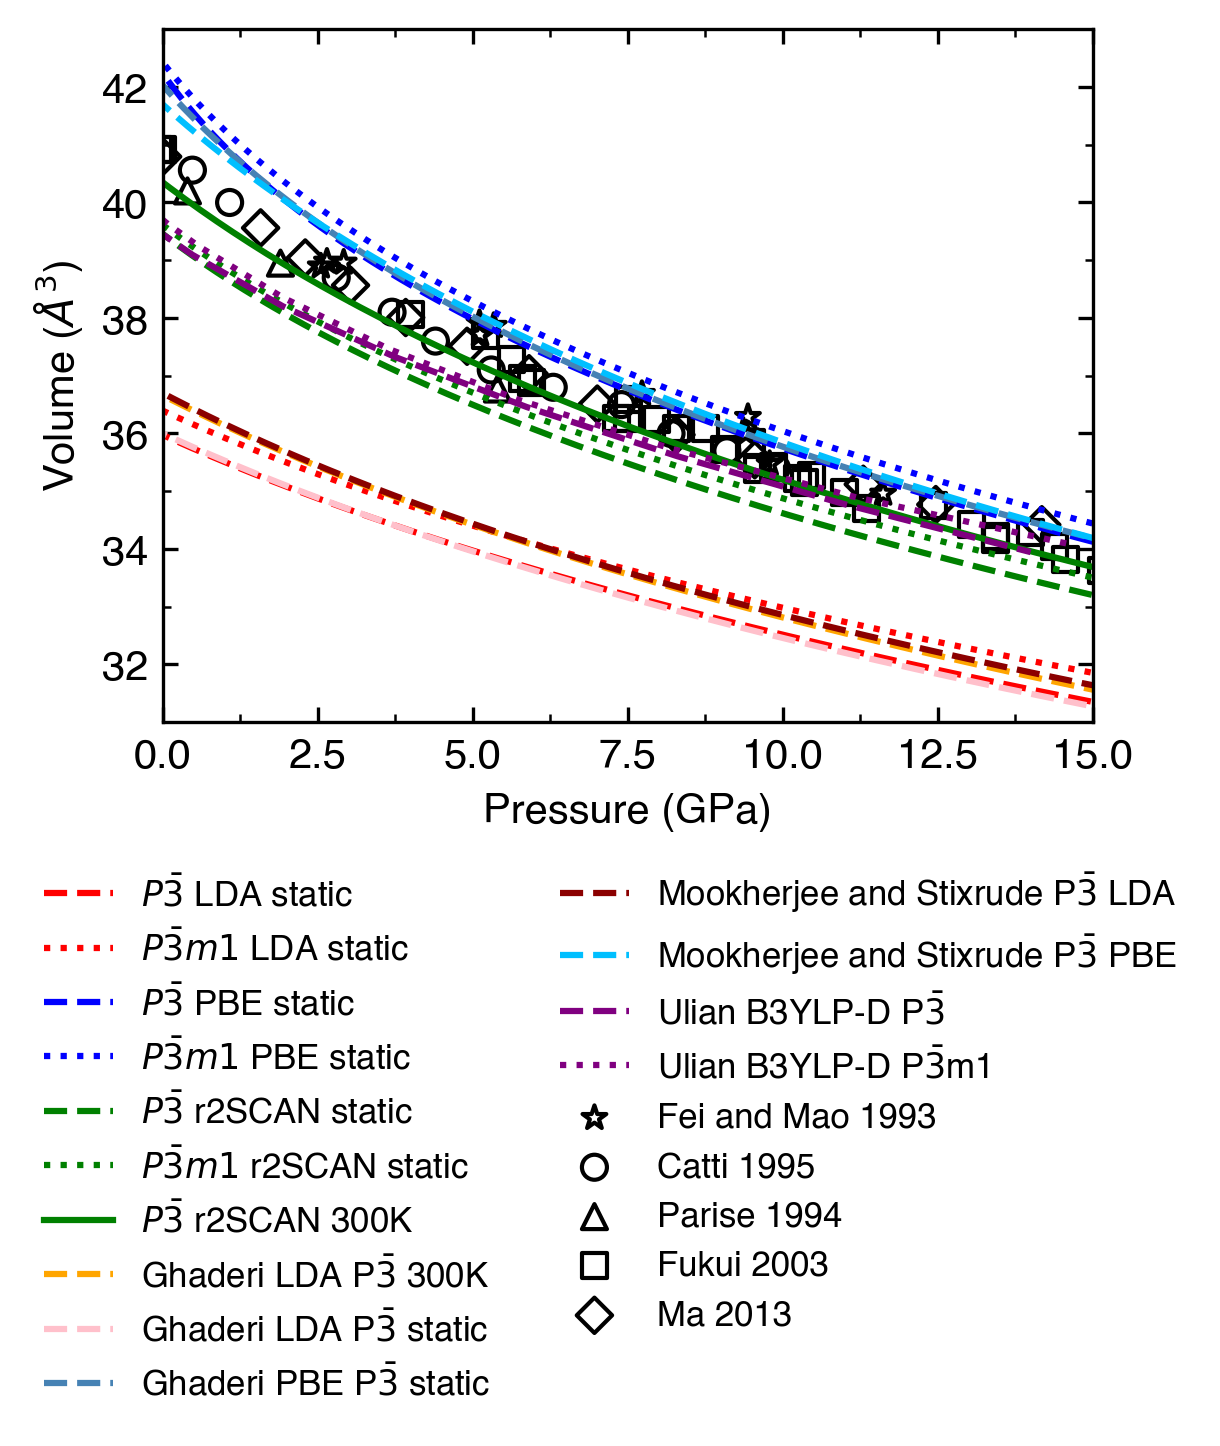
Fig. 3 shows our calculated equation of states using different exchange-correlation functionals and comparisons with measurements [39, 11, 12, 41, 44] and previous ab initio results [7, 14, 45]. The static compression curve is obtained by fitting the free energy vs. volume with a third-order finite strain equation of state and then computing pressure as the free energy derivative w.r.t volume. Our benchmark static LDA and PBE results agree well with previous calculations [7, 14], showing 10% underestimation of volume by LDA and 5% overestimation with PBE compared to the measurements. SCAN and B3YLP-D [45] results lie between LDA and PBE bounds and, at high pressures, lean close to PBE results. However, the semi-empirical B3YLP-D [45] functional does not seem to account for the temperature effect as the others, i.e., increase the volume uniformly from the static results, either using QHA or the Mie-Debye-Grüneisen model [14, 7]. The B3YLP-D compression curve shape differs from the measurements also. Accounting for thermal effects, the B3YLP-D functional should overestimate the volume at higher the high pressures of geophysical significance. 300 K QHA SCAN results are quite accurate between 0–5 GPa, underscoring the necessity of including the finite-temperature effects in all calculations. Vibrational effects correct the volume by 5% at all pressures. The overall difference in volumes between 300 K QHA and measurements is less than 0.5 Å3, less than the difference between measurements.
The stable SCAN dispersions of brucite can be used to calculate the finite-temperature equation of state using the QHA method. Fitting - data to third order Birch–Murnaghan EoS gives Å3, GPa, and . Table 2 compares our EoS fitting parameters with previous measurements [39, 12, 11, 46, 42, 44] and calculations [14, 7, 45]. Our is within the range of all measurements and agrees better with them than all previous calculations. Similarly, our and are also within the range of measurements. However, different measurements vary considerably, which might stem from the different pressure ranges these measurements used. Among all calculations, the fitting parameters from our SCAN 300 K results agree best with measurements.
| Space Group | (Å3) | (GPa) | Method | Reference | |
|---|---|---|---|---|---|
| 40.87 | 54.30 | 4.70 | X-ray Diffraction | Fei and Mao (1993) [39] | |
| 40.20 | 47.00 | 4.70 | Neutron Diffraction | Parise (1994) [12] | |
| 40.99 | 39.00 | 7.60 | Neutron Diffraction | Catti (1995) [11] | |
| 40.85 | 42.00 | 5.70 | X-ray Diffraction | Duffy (1995) [40] | |
| 40.93 | 41.80 | 6.60 | X-ray Diffraction | Fukui (2003) [41] | |
| 41.10 | 35.80 | 8.90 | Brillouin scattering | Jiang (2006) [42] | |
| 40.79 | 37.00 | 10.60 | X-ray Diffraction | Ma (2013) [44] | |
| 41.70 | 43.00 | 5.70 | PBE | Moohkerjee and Stixrude (2006) [14] | |
| 36.70 | 65.00 | 6.05 | LDA | Moohkerjee and Stixrude (2006) [14] | |
| 43.80 | 34.00 | 5.80 | PBE 300 K | Moohkerjee and Stixrude (2006) [14] | |
| 38.20 | 53.00 | 6.20 | LDA 300 K | Moohkerjee and Stixrude (2006) [14] | |
| 36.00 | 73.40 | 5.30 | LDA | Ghaderi (2015) [7] | |
| 36.66 | 66.90 | 5.40 | LDA 300 K | Ghaderi (2015) [7] | |
| 42.03 | 34.60 | 7.50 | PBE | Ghaderi (2015) [7] | |
| 39.70 | 47.50 | 10.10 | B3YLP-D | Ulian (2019) [45] | |
| 39.59 | 48.00 | 9.10 | B3YLP-D | Ulian (2019) [45] | |
| 40.35 | 49.35 | 5.82 | SCAN 300 K | This work |
III.4 Compression behavior
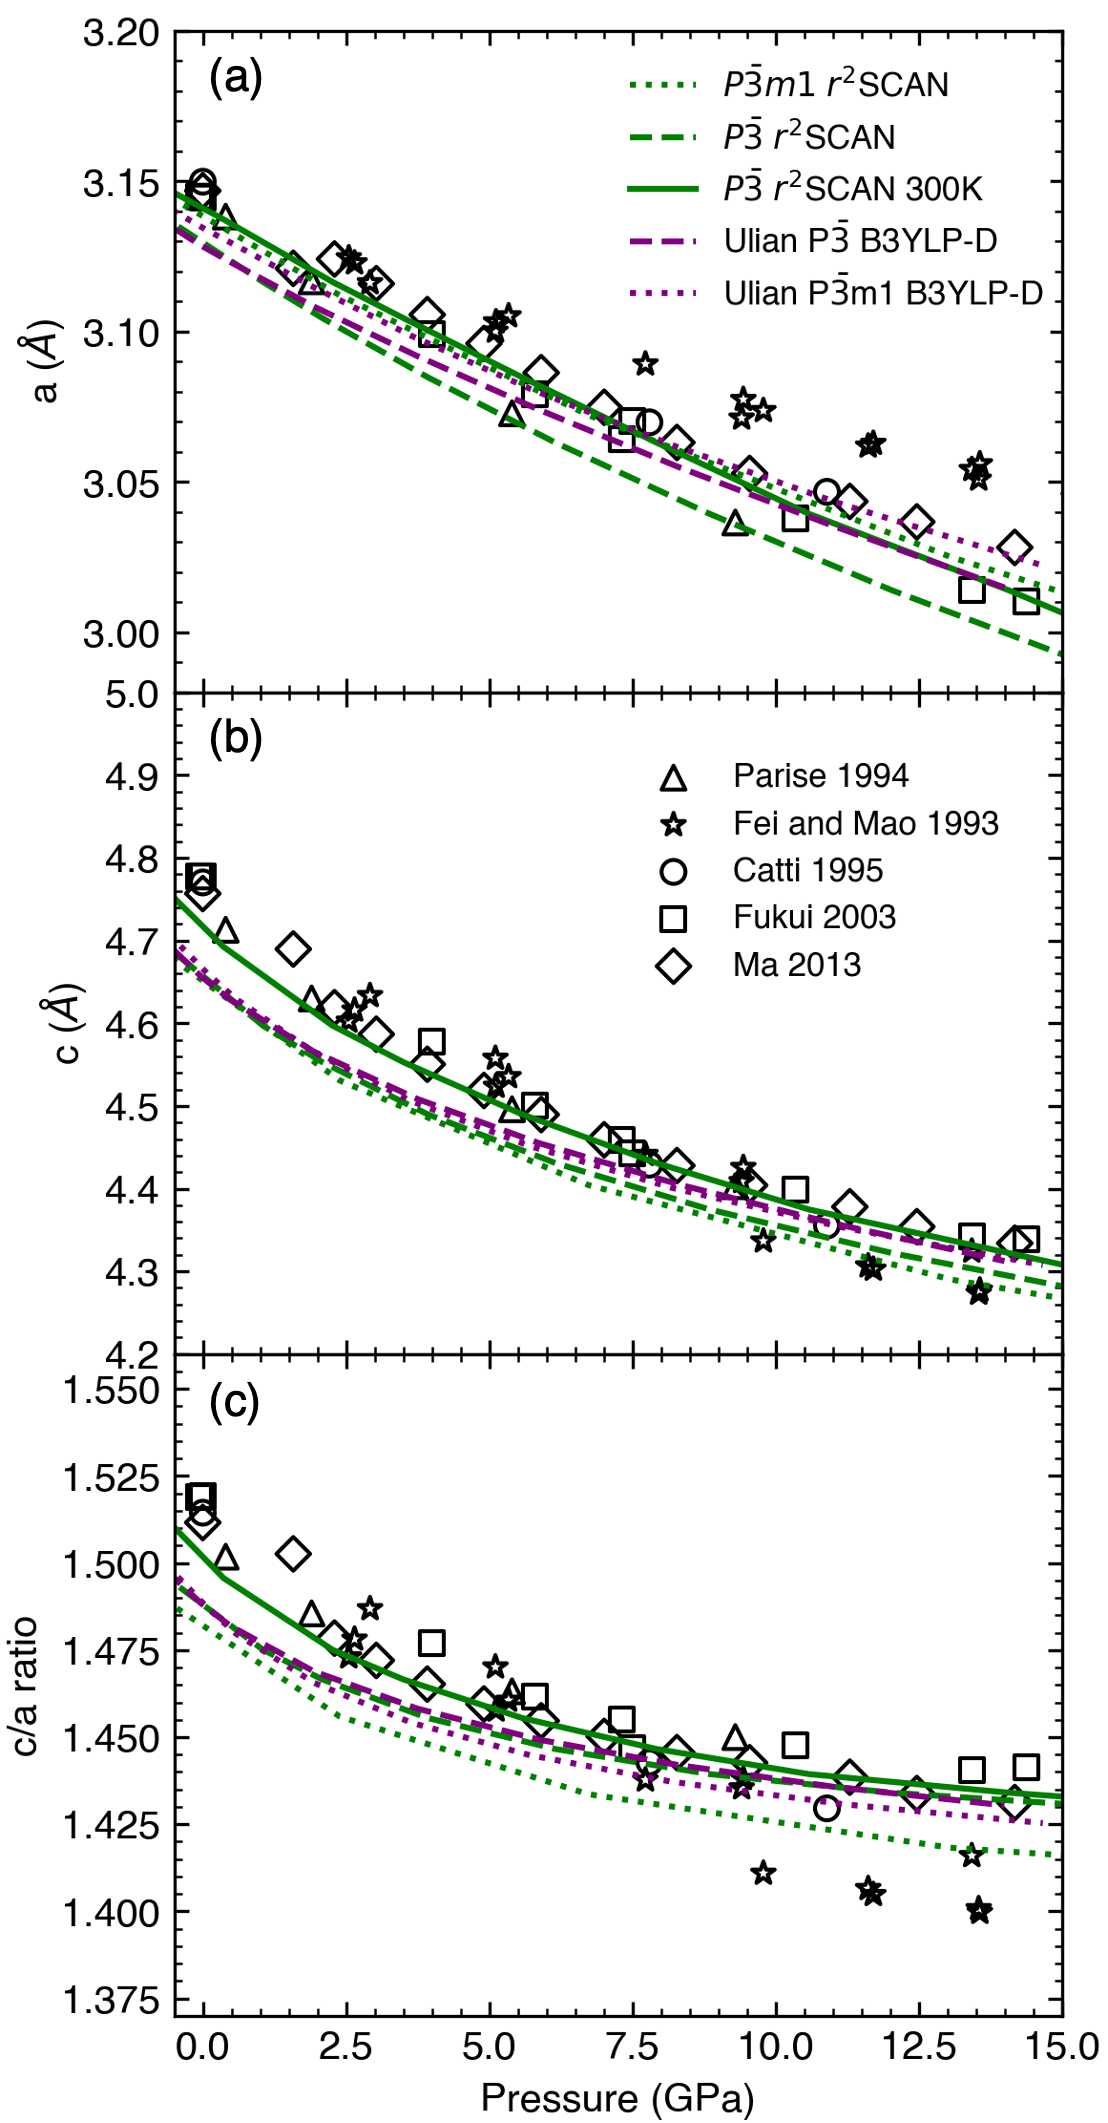
With a reliable EoS, we can investigate the structure evolution under pressure. Fig. 4 shows the lattice parameters of optimized and brucite structures obatined with SCAN compared to measurements [12, 39, 11, 44] and previous B3LYP calculations [45]. Experimental results obtained using X-ray diffraction [39, 44] and neutron diffraction [12, 11]) are consistent, except for the earliest one [39] which is slightly off. Compared to experiments, 300 K SCAN calculations give the most consistent description of the lattice parameters and the anisotropic compression behavior described by the ratio. Both and are more compressible along the -axis, as the structures have weak bonds along this direction.
Interlayer interaction is the result of the two forces: the attractive OH—O forces and the repulsive HH forces. The accurate description of both types of interactions plays an important role. Neutron diffraction experiments can reveal the position of light elements (i.e., H) in the structure. However, whether to fit the structure using (H at ) or (H at ) symmetry has been a subjective choice. For instance, proton positions in Ref. [11] were fitted to the -type site, while in Ref. [12] the -type site was used.
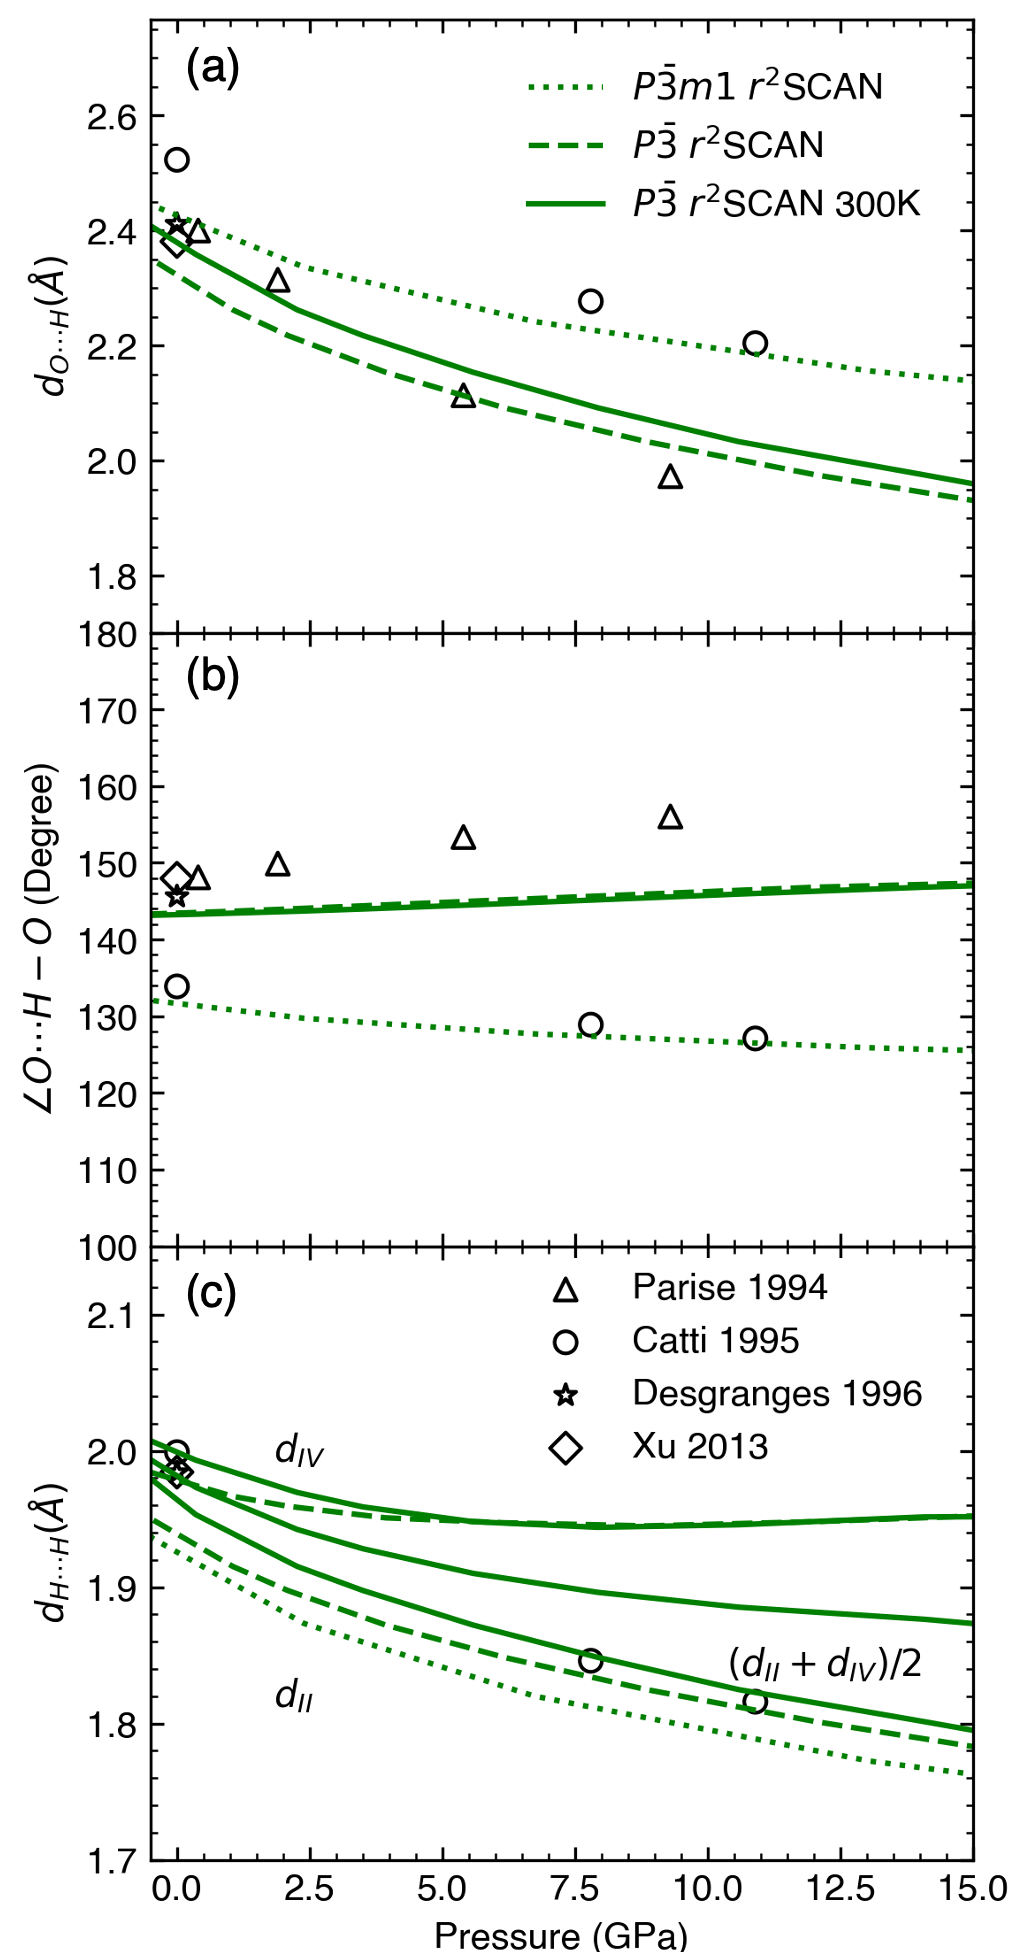
Figs 5a and b compare the H-bond length () and the bond angle () for and brucite structures obtained in the static and 300 K SCAN calculation. They also show experimental measurements fitted to these two symmetries. We notice that the H-bond prediction agrees well with measurements in both phases, especially around 0 GPa. Notice that Refs. [12, 43] reported data on D instead of H, which could change by as much as 0.1 Å in a similar system also rich in H-bonds, i.e., -AlOOH [47]. The H-bond angle (see Fig. 1b) in brucite is in excellent agreement with measurements [11]. Although the predicted H-bond angle of brucite deviates from measurements by 3–5%, the pressure dependence of the H-bond behavior is correctly captured; for brucite, H-bonds are shorter, and the connecting two layers is closer to 180∘ compared to those in the phase. This suggests the H-bond in structure is stronger than in the one. Under pressure, the H-bond in shortens and strengthens with increasing H-bond angle. The opposite happens in the structure, i.e., this bond length decreases with decreasing angle, suggesting the H-bond becomes less stable.
Figure 5c shows the distances (). As a result of lower symmetry and proton disorder, the model has two distinct distances between layers, and [14]. The visualization of and type is shown in the supplemental Fig. S3. They have distinct behavior under pressure: the decreases monotonically with pressure, while the decreases at first and starts to increase at around 7.5 GPa. This behavior is consistent with previous PBE calculations by Mookherjee and Stixrude [14]. The average , or + , agrees well with various measurements [12, 11, 38, 43] at ambient pressures. The in is much shorter than , indicating a much stronger repulsion.
The stable phonon dispersion we get using SCAN highlights the necessity of including non-local interactions in the brucite system. As shown in Fig. 5, the structure has a relatively stronger attractive H-bond and weaker repulsive interaction. The nonlocal interaction captured using SCAN stabilizes the structure and yields stable phonons that would otherwise be unattainable using functionals without nonlocal interactions as captured by this meta-GGA.
III.5 Elasticity & velocity
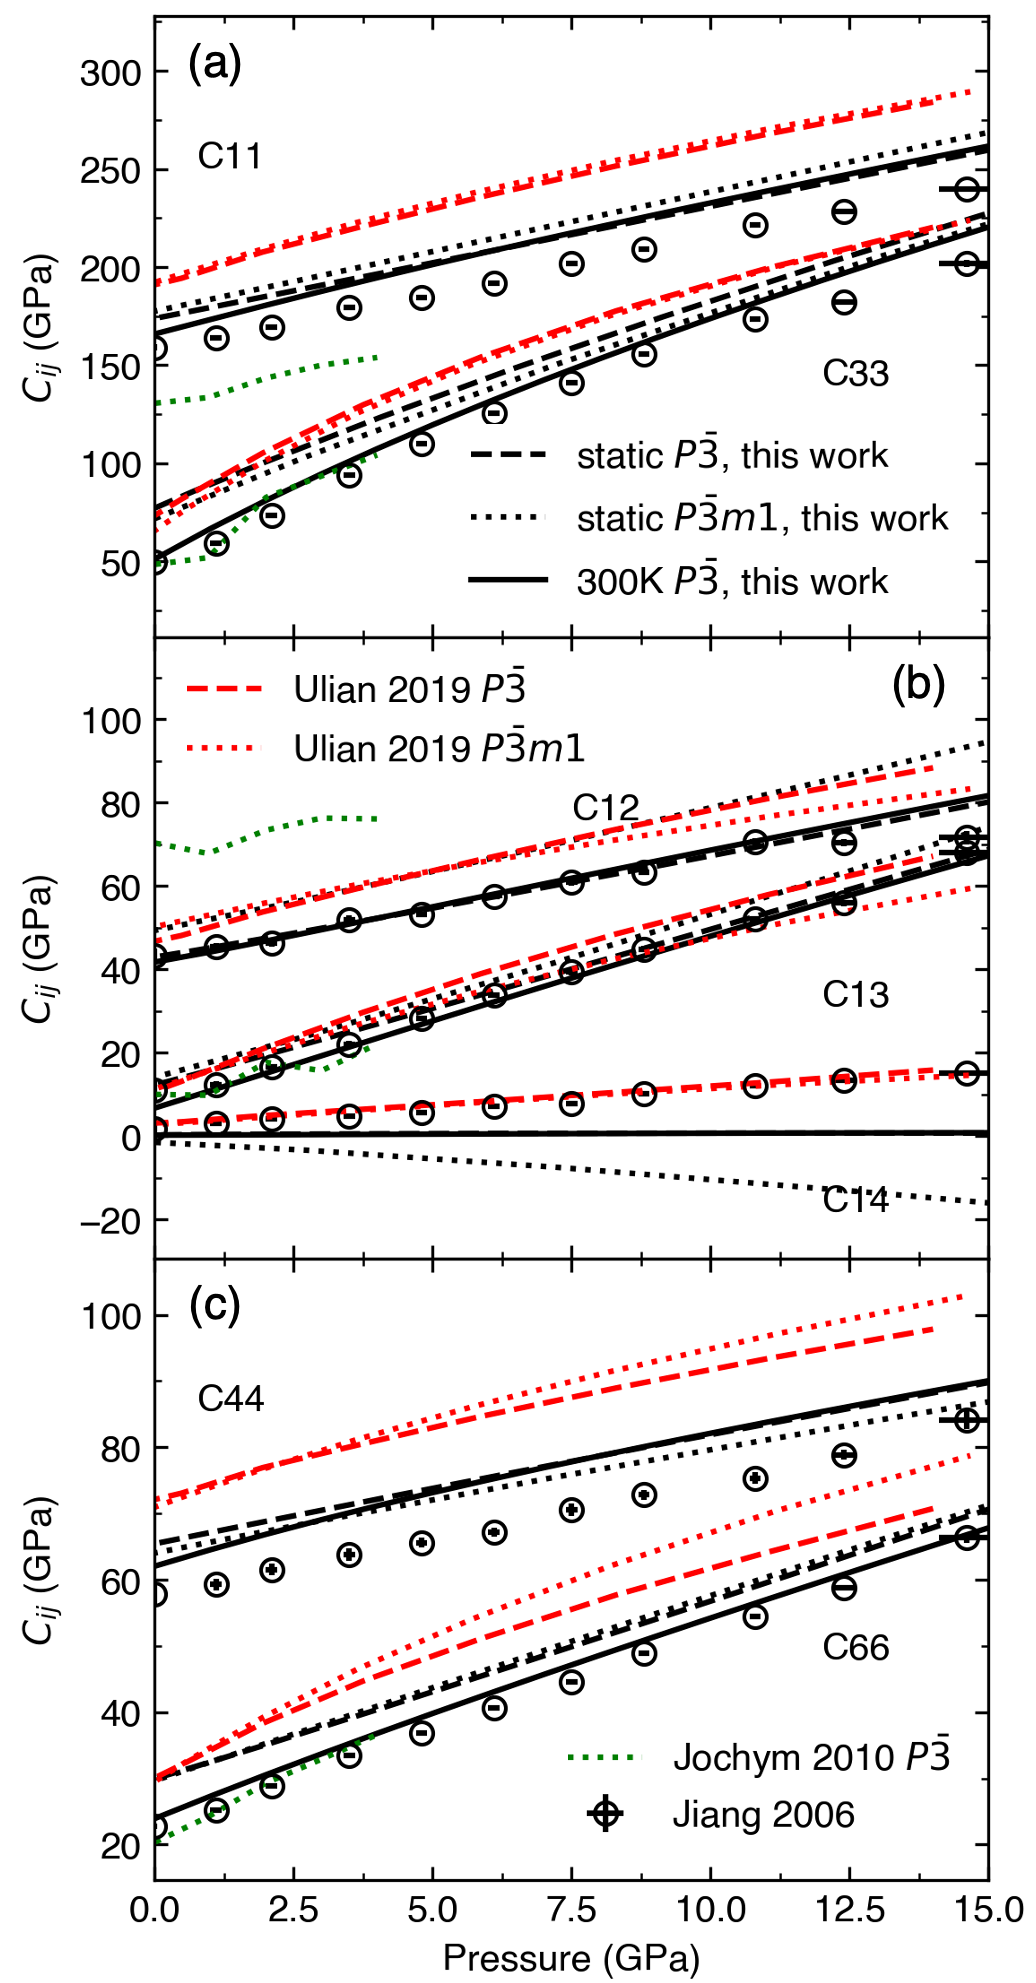
With stable phonons from SCAN calculations, we can compute the 300 K elastic properties and velocities of brucite with the SAM-Cij method [19, 20]. The numbers of independent elastic tensor terms () of and are slightly different [48]: they both have , , , , , , and . In addtion, has an independent non-zero . Fig. 6 shows the static and room temperature elastic tensor components, , of and compared to measurements [42] and previous calculations [17, 45]. Overall, for both and , SCAN results agree better with measurements than PBE [17] and B3LYP [45] calculations, except for . However, considering the relatively small value of such an elastic constant, we can conclude that SCAN performs well. Generally, the 300 K results give a correction that decreases the elastic constants and improves agreement with measurements. For , the correction can be as large as 30% at 0 GPa. Unfortunately, this type of high-temperature elastic constant calculation cannot be carried out for the structure because there are unstable phonon; nevertheless, the static results provide insight into the potential differences in elasticity between and brucite. Although the values are very similar, brucite agrees better with experiments than . This coincides with our conclusion based on phonon stability.
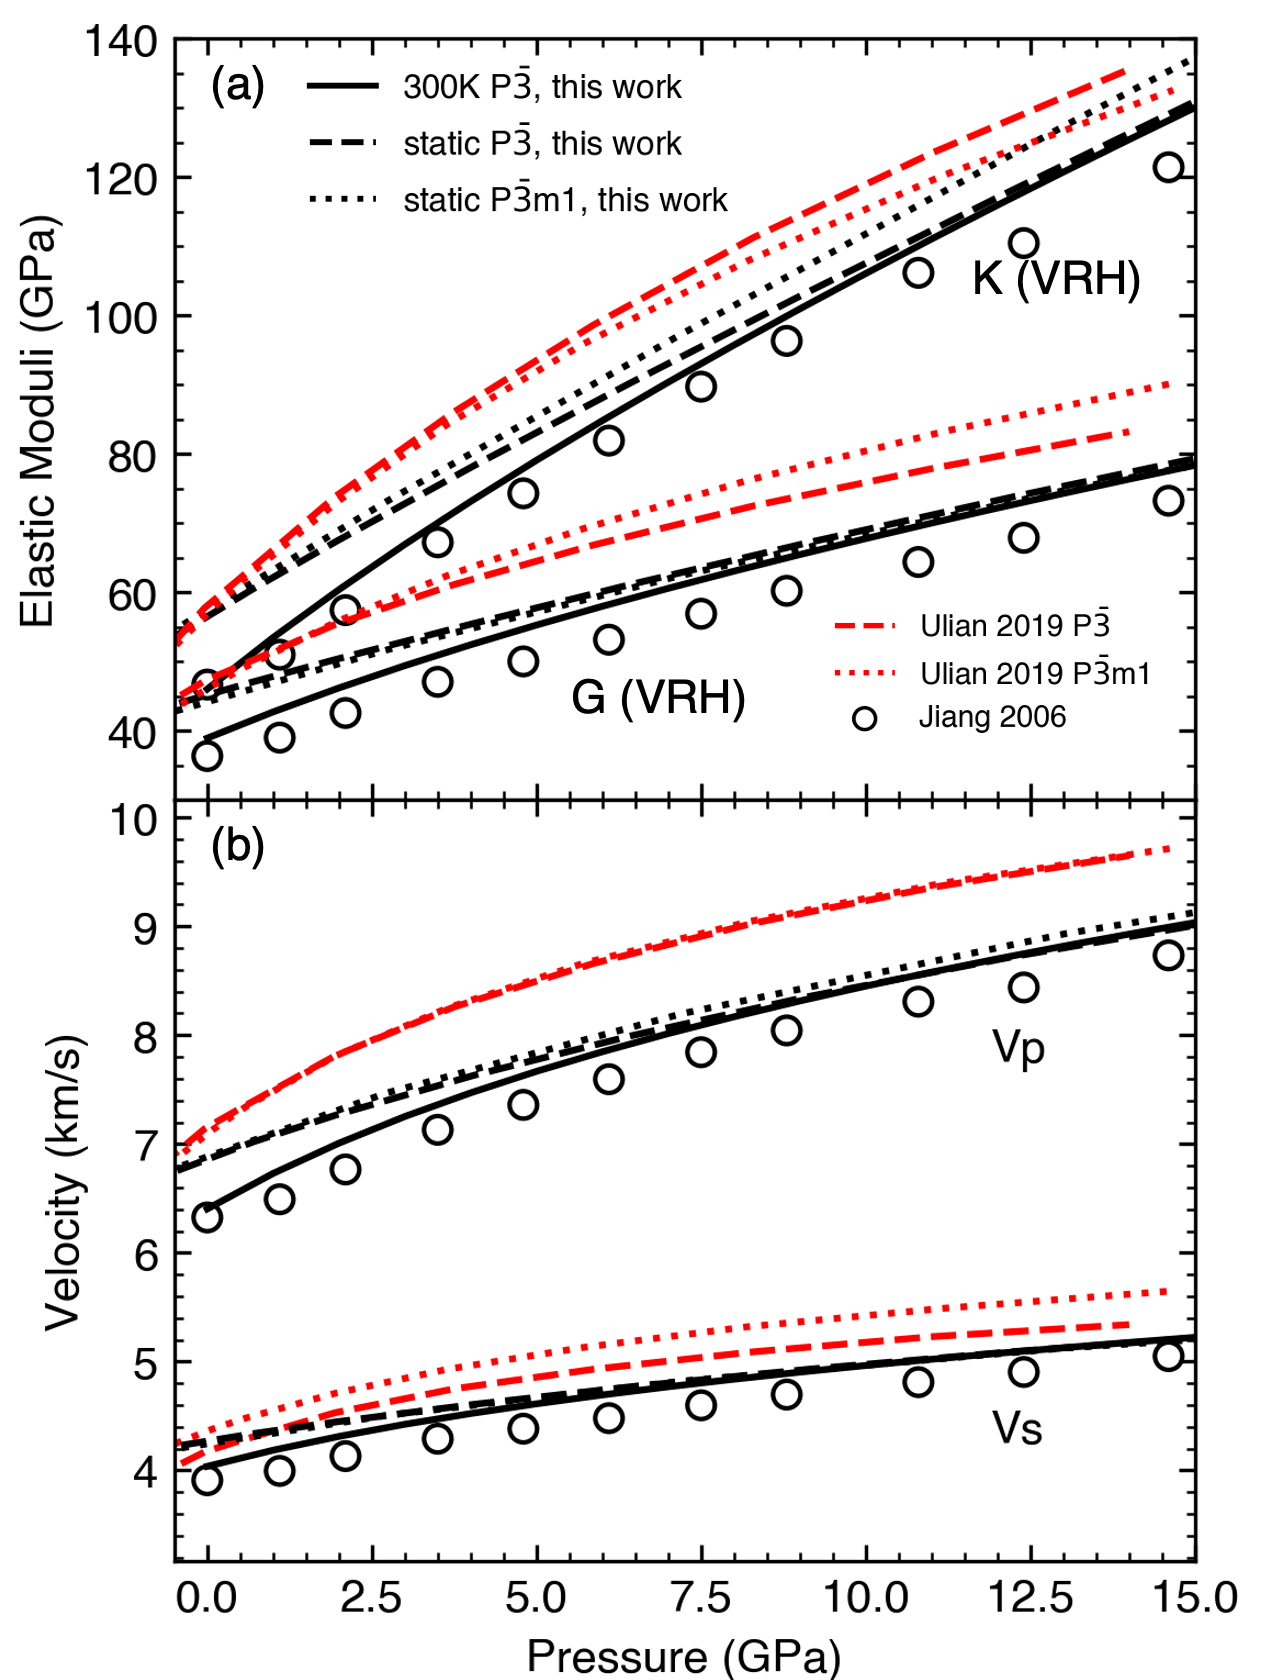
Using elastic constants, we can calculate the Voigt-Reuss-Hill (VRH) average of the bulk and shear moduli. We compare our results with measurements [42] and previous calculations [45] (Fig. 7a). Our SCAN results agree better with measurements [42] than previous B3YLP-D results [45]. In particular, our static results for the structure are closer to measurements than those for the , and with thermal correction, the 300 K results agree even better at all pressures.
The static and 300 K longitudinal and transverse velocity ( and ) and their pressure dependency are also plotted and compared with measurements [42] and previous calculations [45]. Note that the measured and are calculated from the data from the original paper [42] using the following relations: , . In the low pressures, static and 300 K results differ the most. The agreement between our 300 K results and “measurements” is excellent, especially at 0 GPa, where they are almost identical. This result affirms that SCAN can reproduce the measurements in such a system and that is the most suitable description of the brucite structure, even at ambient conditions. The and of at 300 K, 500 K, and 700 K are listed in Table SI in the supplementary materials.
IV Conclusions
Using ab initio calculations, we investigate the stability and elasticity of brucite. We tested several exchange-correlation functionals, including LDA, PBE, and SCAN . The SCAN functional outperforms other functionals (LDA, PBE, PBEsol, and B3LYP) in reproducing the 300 K compression curve and several key structure features involving H-bonds when compared to measurements. The SCAN functional also gives a dynamically stable brucite structure at relevant pressures. Such stable phonon dispersions combined with the QHA are used to compute 300 K elastic properties and acoustic velocities of brucite; results are in excellent agreement with the measurements. These successful calculations indicate that is the suitable space group description of the brucite structure at ambient and elevated pressures. The success of the SCAN functional for brucite suggests SCAN should also be a suitable choice for studying other sheet hydrous minerals at relevant geophysical conditions of pressure and temperature.
Acknowledgments
DOE Award DE-SC0019759 supported this work. Calculations were performed on the Extreme Science and Engineering Discovery Environment (XSEDE) [49] supported by the NSF grant #1548562 and Advanced Cyberinfrastructure Coordination Ecosystem: Services & Support (ACCESS) program, which is supported by NSF grants #2138259, #2138286, #2138307, #2137603, and #2138296 through allocation TG-DMR180081. Specifically, it used the Bridges-2 system at the Pittsburgh Supercomputing Center (PSC), the Anvil system at Purdue University, the Expanse system at San Diego Supercomputing Center (SDSC), and the Delta system at National Center for Supercomputing Applications (NCSA).
References
- Ohtani [2020] E. Ohtani, The role of water in earth’s mantle, National Science Review 7, 224 (2020).
- Faccenda [2014] M. Faccenda, Water in the slab: A trilogy, Tectonophysics 614, 1 (2014).
- Van Keken et al. [2011] P. E. Van Keken, B. R. Hacker, E. M. Syracuse, and G. A. Abers, Subduction factory: 4. Depth-dependent flux of H 2 O from subducting slabs worldwide, Journal of Geophysical Research 116, B01401 (2011).
- Evans [2004] B. W. Evans, The Serpentinite Multisystem Revisited: Chrysotile Is Metastable, International Geology Review 46, 479 (2004).
- Evans et al. [2013] B. W. Evans, K. Hattori, and A. Baronnet, Serpentinite: What, Why, Where?, Elements 9, 99 (2013).
- Hermann and Mookherjee [2016] A. Hermann and M. Mookherjee, High-pressure phase of brucite stable at earth’s mantle transition zone and lower mantle conditions, Proceedings of the National Academy of Sciences 113, 13971 (2016).
- Ghaderi et al. [2015] N. Ghaderi, H. Zhang, and T. Sun, Relative stability and contrasting elastic properties of serpentine polymorphs from first-principles calculations, Journal of Geophysical Research: Solid Earth 120, 4831 (2015).
- Deng et al. [2022] X. Deng, C. Luo, R. M. Wentzcovitch, G. A. Abers, and Z. Wu, Elastic anisotropy of lizardite at subduction zone conditions, Geophysical Research Letters n/a, e2022GL099712 (2022).
- Zigan and Rothbauer [1967] F. Zigan and R. Rothbauer, Neutronenbeugungsmessungen am brucit (1967).
- Partin et al. [1994] D. E. Partin, M. O’Keefe, and R. B. Von Dreele, Crystal structure and profile fitting of Mg(OD)2 by time-of-flight neutron diffraction, Journal of Applied Crystallography 27, 581 (1994).
- Catti et al. [1995] M. Catti, G. Ferraris, S. Hull, and A. Pavese, Static compression and h disorder in brucite, mg (oh) 2, to 11 gpa: a powder neutron diffraction study, Physics and Chemistry of Minerals 22, 200 (1995).
- Parise et al. [1994] J. B. Parise, K. Leinenweber, D. J. Weidnner, K. Tan, and R. B. Von Dreele, Pressure-induced h bonding: Neutron diffraction study of brucite, mg (od) 2, to 9.3 gpa, American Mineralogist 79, 193 (1994).
- Raugei et al. [1999] S. Raugei, P. L. Silvestrelli, and M. Parrinello, Pressure-induced frustration and disorder in mg(oh)2 and ca(oh)2, Physical Review Letters 83, 2222 (1999).
- Mookherjee and Stixrude [2006] M. Mookherjee and L. Stixrude, High-pressure proton disorder in brucite, American Mineralogist 91, 127 (2006).
- Pillai et al. [2021] S. B. Pillai, B. Joseph, and P. K. Jha, Brucite (mg (oh) 2) under small perturbation: A combined first principles and synchrotron x-ray diffraction study, Journal of Physics and Chemistry of Solids 154, 110078 (2021).
- Pishtshev et al. [2014] A. Pishtshev, S. Z. Karazhanov, and M. Klopov, Materials properties of magnesium and calcium hydroxides from first-principles calculations, Computational Materials Science 95, 693 (2014).
- Jochym et al. [2010] P. T. Jochym, A. M. Oleś, K. Parlinski, J. Łażewski, P. Piekarz, and M. Sternik, Structure and elastic properties of Mg(OH)2 from density functional theory, Journal of Physics: Condensed Matter 22, 445403 (2010).
- Treviño et al. [2018] P. Treviño, A. C. Garcia-Castro, S. López-Moreno, A. Bautista-Hernández, E. Bobocioiu, B. Reynard, R. Caracas, and A. H. Romero, Anharmonic contribution to the stabilization of Mg(OH) 2 from first principles, Physical Chemistry Chemical Physics 20, 17799 (2018).
- Wu and Wentzcovitch [2011] Z. Wu and R. M. Wentzcovitch, Quasiharmonic thermal elasticity of crystals: An analytical approach, Physical Review B 83, 184115 (2011).
- Luo et al. [2021] C. Luo, X. Deng, W. Wang, G. Shukla, Z. Wu, and R. M. Wentzcovitch, Cij: A Python code for quasiharmonic thermoelasticity, Computer Physics Communications 267, 108067 (2021).
- Sun et al. [2014] T. Sun, D.-B. Zhang, and R. M. Wentzcovitch, Dynamic stabilization of cubic CaSiO 3 perovskite at high temperatures and pressures from ab initio molecular dynamics, Physical Review B 89, 094109 (2014).
- Wang et al. [2023] H. Wang, J. Zhuang, Z. Zhang, Q. Zhang, and R. M. Wentzcovitch, pgm: A python package for free energy calculations within the phonon gas model, Computer Physics Communications 291, 108845 (2023).
- Zhuang et al. [2021] J. Zhuang, H. Wang, Q. Zhang, and R. M. Wentzcovitch, Thermodynamic properties of -fe with thermal electronic excitation effects on vibrational spectra, Phys. Rev. B 103, 144102 (2021).
- Furness et al. [2020] J. W. Furness, A. D. Kaplan, J. Ning, J. P. Perdew, and J. Sun, Accurate and numerically efficient r2scan meta-generalized gradient approximation, The journal of physical chemistry letters 11, 8208 (2020).
- Perdew et al. [1996] J. P. Perdew, K. Burke, and M. Ernzerhof, Generalized Gradient Approximation Made Simple, Physical Review Letters 77, 3865 (1996).
- Perdew and Zunger [1981] J. P. Perdew and A. Zunger, Self-interaction correction to density-functional approximations for many-electron systems, Physical Review B 23, 5048 (1981).
- Sun et al. [2015] J. Sun, A. Ruzsinszky, and J. P. Perdew, Strongly Constrained and Appropriately Normed Semilocal Density Functional, Physical Review Letters 115, 036402 (2015).
- Luo et al. [2023] C. Luo, Y. Sun, and R. M. Wentzcovitch, High throughput sampling of phase space with deep learning potentials: $\delta$-AlOOH at geophysical conditions (2023), arxiv:2309.06712 [cond-mat, physics:physics] .
- Wan et al. [2023] T. Wan, C. Luo, Y. Sun, and R. M. Wentzcovitch, Thermoelastic properties of bridgmanite using Deep Potential Molecular Dynamics (2023), arxiv:2307.07127 [cond-mat, physics:physics] .
- Sun et al. [2016] J. Sun, R. C. Remsing, Y. Zhang, Z. Sun, A. Ruzsinszky, H. Peng, Z. Yang, A. Paul, U. Waghmare, X. Wu, M. L. Klein, and J. P. Perdew, Accurate first-principles structures and energies of diversely bonded systems from an efficient density functional, Nature Chemistry 8, 831 (2016).
- Ning et al. [2022] J. Ning, J. W. Furness, and J. Sun, Reliable Lattice Dynamics from an Efficient Density Functional Approximation, Chemistry of Materials 34, 2562 (2022).
- Blöchl [1994] P. E. Blöchl, Projector augmented-wave method, Physical review B 50, 17953 (1994).
- Kresse and Furthmüller [1996] G. Kresse and J. Furthmüller, Efficient iterative schemes for ab initio total-energy calculations using a plane-wave basis set, Physical Review B 54, 11169 (1996).
- Togo et al. [2023] A. Togo, L. Chaput, T. Tadano, and I. Tanaka, Implementation strategies in phonopy and phono3py, J. Phys. Condens. Matter 35, 353001 (2023).
- Barron and Klein [1965] T. Barron and M. Klein, Second-order elastic constants of a solid under stress, Proceedings of the Physical Society 85, 523 (1965).
- Qin et al. [2019] T. Qin, Q. Zhang, R. M. Wentzcovitch, and K. Umemoto, Qha: A Python package for quasiharmonic free energy calculation for multi-configuration systems, Computer Physics Communications 237, 199 (2019).
- Momma and Izumi [2011] K. Momma and F. Izumi, Vesta 3 for three-dimensional visualization of crystal, volumetric and morphology data, Journal of applied crystallography 44, 1272 (2011).
- Desgranges et al. [1996] L. Desgranges, G. Calvarin, and G. Chevrier, Interlayer interactions in m (oh) 2: a neutron diffraction study of mg (oh) 2, Acta Crystallographica Section B: Structural Science 52, 82 (1996).
- Fei and Mao [1993] Y. Fei and H.-K. Mao, Static compression of Mg(OH)2 to 78 GPa at high temperature and constraints on the equation of state of fluid H2O, Journal of Geophysical Research: Solid Earth 98, 11875 (1993).
- Duffy et al. [1995a] T. S. Duffy, J. Shu, H.-k. Mao, and R. J. Hemley, Single-crystal x-ray diffraction of brucite to 14 gpa, Physics and Chemistry of Minerals 22, 277 (1995a).
- Fukui et al. [2003] H. Fukui, O. Ohtaka, T. Suzuki, and K. Funakoshi, Thermal expansion of mg (oh) 2 brucite under high pressure and pressure dependence of entropy, Physics and Chemistry of Minerals 30, 511 (2003).
- Jiang et al. [2006] F. Jiang, S. Speziale, and T. S. Duffy, Single-crystal elasticity of brucite, Mg(OH)2, to 15 GPa by Brillouin scattering, American Mineralogist 91, 1893 (2006).
- Xu et al. [2013] H. Xu, Y. Zhao, D. D. Hickmott, N. J. Lane, S. C. Vogel, J. Zhang, and L. L. Daemen, High-temperature neutron diffraction study of deuterated brucite, Physics and Chemistry of Minerals 40, 799 (2013).
- Ma et al. [2013] M. Ma, W. Liu, Z. Chen, Z. Liu, and B. Li, Compression and structure of brucite to 31 gpa from synchrotron x-ray diffraction and infrared spectroscopy studies, American Mineralogist 98, 33 (2013).
- Ulian and Valdrè [2019] G. Ulian and G. Valdrè, Equation of state and second-order elastic constants of portlanditeCa(OH)2 and brucite Mg(OH)2, Physics and Chemistry of Minerals 46, 101 (2019).
- Duffy et al. [1995b] T. S. Duffy, C. Meade, Y. Fei, H.-K. Mao, and R. J. Hemley, High-pressure phase transition in brucite, Mg(OH)2, American Mineralogist 80, 222 (1995b).
- Sano-Furukawa et al. [2018] A. Sano-Furukawa, T. Hattori, K. Komatsu, H. Kagi, T. Nagai, J. J. Molaison, A. M. Dos Santos, and C. A. Tulk, Direct observation of symmetrization of hydrogen bond in -alooh under mantle conditions using neutron diffraction, Scientific Reports 8, 15520 (2018).
- Brugger [1965] K. Brugger, Pure Modes for Elastic Waves in Crystals, Journal of Applied Physics 36, 759 (1965).
- Towns et al. [2014] J. Towns, T. Cockerill, M. Dahan, I. Foster, K. Gaither, A. Grimshaw, V. Hazlewood, S. Lathrop, D. Lifka, G. D. Peterson, R. Roskies, J. R. Scott, and N. Wilkins-Diehr, XSEDE: Accelerating Scientific Discovery, Computing in Science & Engineering 16, 62 (2014).