Comparing SCUBA-2 and ALMA Selections of Faint DSFGs in Abell 2744
Abstract
We make a comparison of deep SCUBA-2 450 m and 850 m imaging on the massive lensing cluster field Abell 2744 with Atacama Large Millimeter/submillimeter Array (ALMA) 1.2 mm data. Our primary goal is to assess how effective the wider-field SCUBA-2 sample, in combination with red JWST priors, is for finding faint dusty star-forming galaxies (DSFGs) compared to the much more expensive mosaicked ALMA observations. We cross-match our previously reported direct () SCUBA-2 sample and red JWST NIRCam prior-selected () SCUBA-2 sample to direct ALMA sources from the DUALZ survey. We find that roughly 95% are confirmed by ALMA. The red priors also allow us to probe deeper in the ALMA image. Next, by measuring the 450 m and 850 m properties of the full ALMA sample, we show that 46/69 of the ALMA sources are detected at 850 m and 24/69 are detected at 450 m in the SCUBA-2 images, with a total detection fraction of nearly 75%. All of the robust () ALMA sources that are not detected in at least one SCUBA-2 band lie at 1.2 mm fluxes 0.6 mJy and are undetected primarily due to the higher SCUBA-2 flux limits. We also find that the SCUBA-2 detection fraction drops slightly beyond , which we attribute to the increasing 1.2 mm to 850 m and 1.2 mm to 450 m flux ratios combined with the ALMA selection. The results emphasize the power of combining SCUBA-2 data with JWST colors to map the faint DSFG population.
1 Introduction
The demonstration by the COBE satellite that the cosmic infrared background (CIB) is comparable to the cosmic optical background showed that a significant fraction of the UV/optical starlight in the Universe is absorbed and reradiated by dust (Puget et al., 1996; Fixsen et al., 1998; Hauser et al., 1998; Dole et al., 2006). Resolving the CIB into individual sources has been one of the fundamental goals of modern astronomy for over two decades, which led to the submillimeter detection of extremely luminous, dusty star-forming galaxies (DSFGs; or submillimeter galaxies, SMGs) with star formation rates (SFRs) up to 1000 M⊙/yr (Smail et al., 1997; Barger et al., 1998; Hughes et al., 1998; Eales et al., 1999).
Due to the relatively low surface density of DSFGs and the strong negative K-correction at submillimeter and millimeter wavelengths, wide-field single-dish submillimeter/millimeter surveys have been most effective at obtaining large samples of these galaxies. Currently, the most efficient instruments for this are SCUBA-2 (Holland et al., 2013) at 450 m and 850 m on the James Clerk Maxwell Telescope (JCMT), NIKA2 (Monfardini et al., 2014; Calvo et al., 2016) at 1.2 mm and 2 mm on the IRAM 30 m telescope, and soon TolTEC (Wilson et al., 2020) from 1.1 mm to 2 mm on the Large Millimeter Telescope (LMT).
However, single-dish submillimeter surveys are typically limited to picking out bright SMGs ( mJy), because the low angular resolution (e.g., 14′′ for SCUBA-2 at 850 m) causes the blending of faint unresolved sources to dominate the noise below a certain flux level (the confusion limit; e.g., 1.6 mJy for SCUBA-2 at 850 m; Cowie et al. 2017). The bright SMG population constitutes –30% of the CIB. An effective method for pushing to deeper survey depths is to leverage the gravitational lensing of massive galaxy clusters (e.g., Smail et al., 1997; Cowie et al., 2002), which offers the additional benefit of increased spatial resolution. Such studies show that the majority of the CIB is made up of faint SMGs ( mJy) (e.g., Knudsen et al., 2008; Chen et al., 2013; Hsu et al., 2016).
In the last decade, substantial efforts have been made to study the faint end of the DSFG population. Interferometers, such as the Atacama Large Millimeter/submillimeter Array (ALMA), are capable of probing to deeper flux limits than SCUBA-2, but the small field-of-view means that direct searches using mosaicked observations (e.g., Hatsukade et al., 2016; Aravena et al., 2016; Walter et al., 2016; Dunlop et al., 2017; Umehata et al., 2017; González-López et al., 2017; Muñoz Arancibia et al., 2018; Hatsukade et al., 2018; González-López et al., 2020; Gómez-Guijarro et al., 2022; Casey et al., 2021; Zavala et al., 2021; Muñoz Arancibia et al., 2023; Fujimoto et al., 2023a, b) are very costly.
Using JWST data from multiple NIRCam programs (JWST-ERS-1324, JWST-GO-2561, JWST-DDT-2756) on the Abell 2744 (A2744) cluster field (Paris et al., 2023; Weaver et al., 2023), along with ALMA data from the ALMA Lensing Cluster Survey (ALCS; 1.2 mm) (Fujimoto et al., 2023a) and the ALMA Frontier Fields Survey (AFFS; 1.1 mm) (González-López et al., 2017; Muñoz Arancibia et al., 2023) and SCUBA-2 data from Cowie et al. (2022), Barger & Cowie (2023) developed a JWST NIRCam red galaxy selection that identified all known () ALMA sources (9) and nearly all known () SCUBA-2 850 m sources (17 out of 19). They then used the red galaxy priors to probe deeper into the SCUBA-2 data (), finding sources down to faint intrinsic 850 m fluxes of 0.1 mJy with the help of gravitational lensing.
Fujimoto et al. (2023b) subsequently presented the DUALZ ALMA 1.2 mm survey, which maps most of the JWST NIRCam region of the A2744 UNCOVER program (Bezanson et al., 2022). They released a catalog of 69 ALMA sources down to a minimum S/N of 4.2. However, they did not cross-reference their sources with the SCUBA-2 data to see how many of their sources had already been detected. In addition to SCUBA-2 covering much larger areas than ALMA, its extended wavelength coverage is important for studying the physical properties of DSFGs, since 450 m and m lie closer to the far-infrared (FIR) peak of the dust emission and thus can help constrain dust temperatures and redshifts (e.g., Casey et al., 2013; Zavala et al., 2018; Lim et al., 2020; Barger et al., 2022).
In this paper, we revisit the overlap between the SCUBA-2 and ALMA samples in A2744, incorporating the new DUALZ data. In Section 2, we describe the data that we use in our analysis. In Section 3, we compare the ALMA sample to the direct and red galaxy prior-based SCUBA-2 samples, and we also recover fainter ALMA sources using the priors. In Section 4, we use the 450 m and 850 m data to learn more about the properties of the ALMA sources. In Section 5, we contrast the properties of sources detected in the SCUBA-2 maps against those that are not, and we assess how effective the red galaxy priors are for recovering SCUBA-2 and ALMA sources. Finally, in Section 6, we summarize our results.
We assume a flat concordance CDM cosmology with , , and km s-1 Mpc-1.
2 Data
The massive lensing cluster field A2744 () is one of the six Hubble Frontier Fields (Lotz et al., 2017) and has been the target of hundreds of hours of multiwavelength observations from the UV to the radio. We have been observing A2744 with SCUBA-2 for a number of years and have generated deep 450 m and 850 m images covering the entire central region of the cluster (Cowie et al., 2022). The minimum 1 rms of the current 850 m image is 0.26 mJy, while the minimum 1 rms of the current 450 m image is 2.8 mJy, slightly deeper than those presented in Cowie et al. (2022). The reduction of the SCUBA-2 maps and the source detection follow that described in Chen et al. (2013) and Cowie et al. (2017).
A2744 has been observed in several JWST surveys, including deep NIRCam imaging from the UNCOVER (Bezanson et al., 2022), GLASS-JWST (Treu et al., 2022), and DDT #2756 programs (PI: W. Chen; Roberts-Borsani et al. 2023). In addition to lensing models released by five independent teams prior to JWST, Furtak et al. (2023) published a lensing model for the cluster region using the UNCOVER JWST observations.
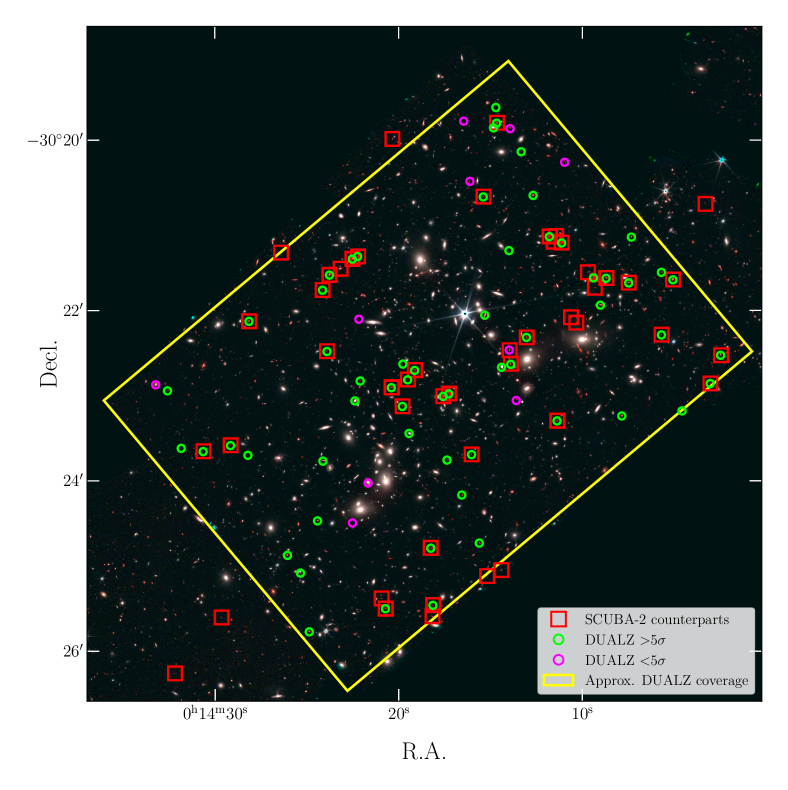
The ALMA data for this field come primarily from the DUALZ program (Fujimoto et al., 2023b), which mapped the UNCOVER NIRCam area with ALMA Band 6 observations (effective wavelength of 1.2 mm) down to a minimum rms noise of 32.7 Jy. The data from the 1.2 mm ALCS (Fujimoto et al., 2023a) and 1.1 mm AFFS (González-López et al., 2017; Muñoz Arancibia et al., 2023) surveys were combined into the Deep maps. The Wide maps use only the DUALZ observations. From the Deep and Wide maps (both with and without -tapering applied), Fujimoto et al. (2023b) produced a source catalog of 69 ALMA sources down to a minimum S/N of 4.2 (their detection threshold varied depending on which map was used for the detection). In Figure 1, we show their 69 sources and the coverage of the DUALZ survey overlaid on the JWST NIRCam image of Paris et al. (2023).
3 ALMA properties of SCUBA-2 sources
Restricting to the DUALZ ALMA area, we first compare the 17 SCUBA-2 sources with the DUALZ catalog. Barger & Cowie (2023) found red NIRCam counterparts (defined as / 3.5 and Jy) within 4′′ of 15 of these SCUBA-2 sources (note that in one case, two SCUBA-2 sources share one counterpart). The ALMA data confirm all but one of these; for the remaining source, the ALMA detection matches to a different but similarly red galaxy at a slightly larger separation from the SCUBA-2 centroid. The two SCUBA-2 sources without a red NIRCam counterpart do not appear to have ALMA detections, though for one, there is an ALMA source at 5.3′′ from the SCUBA-2 position. In summary, 15/17 (88%) of the SCUBA-2 detections have ALMA 1.2 mm counterparts.
With the ALMA data, we can check whether multiple DSFGs may be contributing to the 850 m flux. We find that only two of the 15 SCUBA-2 sources (SCUBA7 and SCUBA8) have multiple ALMA counterparts within of the SCUBA-2 850 m position, giving a multiplicity of 13% (2/15).
Barger & Cowie (2023) also used the red NIRCam galaxies in the field as priors to identify fainter sources than could be securely extracted from the SCUBA-2 data alone. They compiled a sample of 44 priors with associated SCUBA-2 fluxes (their Table 3), 39 of which fall within the DUALZ area. Twelve of these correspond to 13 of the 15 direct SCUBA-2 sources with red NIRCam counterparts in the area, since two SCUBA-2 sources have the same red counterpart. The other two sources (SCUBA9 and SCUBA12) are not included in this sample due to differences in the SCUBA-2 deblending when using priors. We show the positions of all the red NIRCam counterparts to the SCUBA-2 sources in Figure 1 with red squares.
Thirty-one of the 39 sources match to the DUALZ catalog, while eight do not. Combining these 31 with SCUBA9 and SCUBA12, the SCUBA-2 sources account for 33/69 (48%) of the DUALZ ALMA sample. If we consider only the 59 DUALZ sources, then the SCUBA-2 sources account for 32/59 (54%).
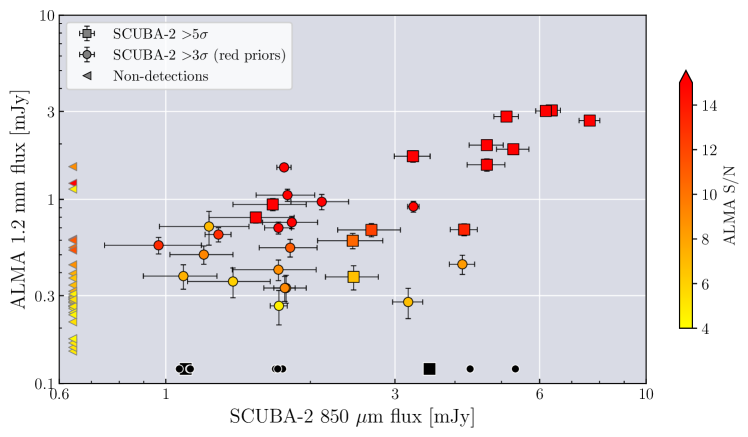
In Figure 2, we show the 1.2 mm and 850 m fluxes for any ALMA or SCUBA-2 source in the DUALZ area, distinguishing between those with direct SCUBA-2 detections (squares) and those based on the red galaxy priors (circles). We show the ALMA sources not matched to a SCUBA-2 source as leftward-facing arrows, and the SCUBA-2 detections not in the DUALZ catalog in black along the bottom. For the sources detected in both ALMA and SCUBA-2, the median 850 m to 1.2 mm flux ratio is 2.6, with a 16–84th percentile range of 1.8 to 5.4. From Figure 2, we can also see that most of the sources detected by DUALZ but not by SCUBA-2 are faint and/or lower signal-to-noise (S/N) ALMA sources (righthand color scale).
Next, we investigate whether any of the eight red prior-selected SCUBA-2 sources not in the DUALZ catalog are detected in the ALMA image at a lower significance. To test this, we measure the ALMA 1.2 mm fluxes at the positions of these eight SCUBA-2 sources by finding the largest local peak within of the red NIRCam prior, using the natural weighted DUALZ Wide map with primary beam correction applied. The local noise is estimated by measuring the dispersion in random pixels within 12′′ of the source, after masking out any sources nearby.
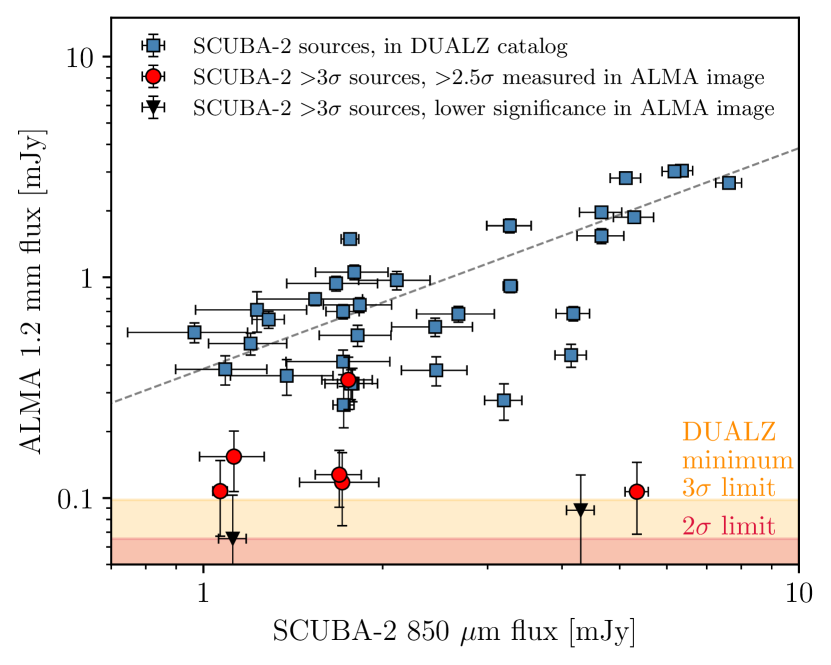
We find that of these eight sources, six are detected at (three at ). However, we note that one of the sources falls near the edge where the noise is higher, so the error measured by our method may be an underestimate of the actual uncertainty for this source. In Figure 3, we show the 1.2 mm and 850 m fluxes for all the SCUBA-2 sources in the DUALZ area, including the eight sources for which we measure the ALMA fluxes. We show the SCUBA-2 sources that match to direct DUALZ detections as blue squares, and mark the median 850 m to 1.2 mm flux ratio of 2.6 on the plot (dashed line). The six red prior-selected sources for which we measure 1.2 mm fluxes are shown as red circles, while the two sources at lower significance are shown as black triangles. The deepest 2 and 3 limits of the DUALZ Wide map are also shown (shaded region), though the local 2 and 3 limits will generally be higher than this at any given point in the maps. This figure illustrates that the red NIRCam priors enable us to probe to fainter ALMA fluxes than would be possible with a direct search.
In total, we find that within the DUALZ area, 37/39 of the red prior-selected SCUBA-2 sources from Barger & Cowie (2023) are detected at in the ALMA image (34/39 if restricted to ), confirming the robustness of this selection. We summarize the numbers of direct and prior-selected SCUBA-2 sources and the fractions that have red galaxy and/or ALMA counterparts in Table 1.
4 SCUBA-2 450 and 850 micron properties of ALMA sources
Having shown that a high fraction of the SCUBA-2 sources detected either directly or with the red galaxy priors are confirmed with ALMA, we next invert the analysis and study the SCUBA-2 450 m and 850 m properties of the 69 ALMA sources in the DUALZ catalog. All of these sources fall on the deep SCUBA-2 450 m and 850 m maps from Cowie et al. (2022).
We extract the 450 m and 850 m fluxes and errors for the ALMA priors using an iterative procedure to avoid contamination of fainter sources by brighter ones: We first measure the SCUBA-2 flux at the position of each ALMA source; then, working down the catalog from brighter to fainter SCUBA-2 flux, we measure the peak flux and the error within 4′′ from the ALMA position and subtract from the residual image the SCUBA-2 PSF scaled to the peak flux. We then repeat for the next brightest SCUBA-2 flux until all sources have been measured. Although this process is not strictly necessary for the 450 m maps due to the higher angular resolution, we perform the iteration on both SCUBA-2 maps anyway.
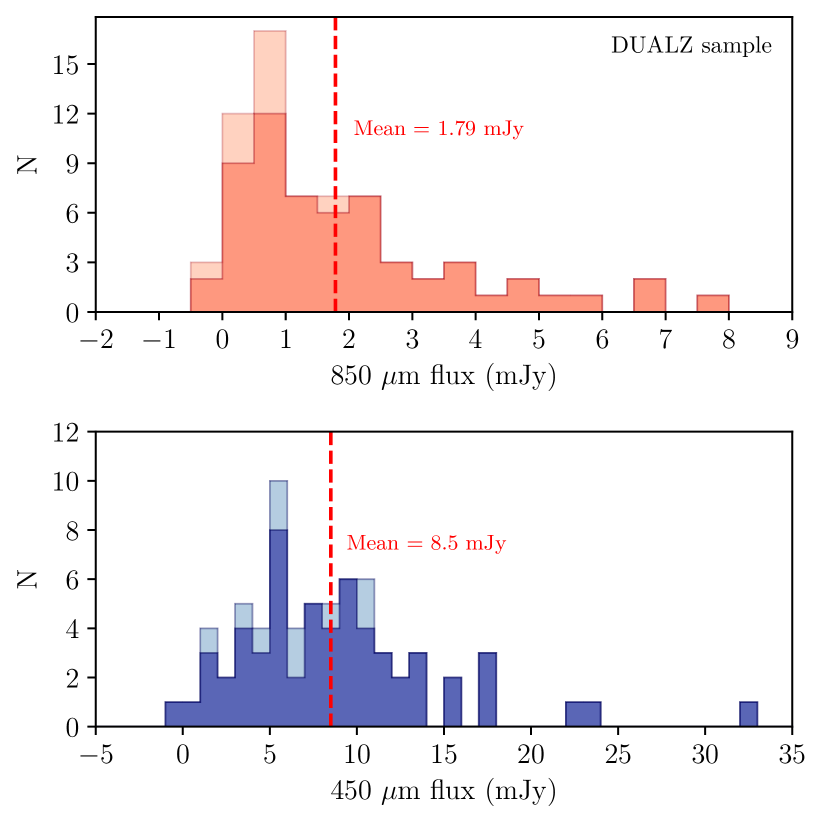
The resulting distribution of SCUBA-2 450 m and 850 m fluxes for the ALMA sample is shown in Figure 4. The mean of the respective distributions is also shown: The mean 850 m flux is 1.79 mJy, which is roughly six times the central rms noise of 0.28 mJy, while the mean 450 m flux is 8.5 mJy, or three times the central rms of 2.8 mJy.
We find that 37 of the ALMA sources (54%) are detected at at 850 m, with an additional six detected at . All of the direct SCUBA-2 sources previously matched to DUALZ sources are recovered by this method, as are all but three of the SCUBA-2 sources based on the red galaxy priors that were previously matched to the DUALZ sources. Since the SCUBA-2 sources were extracted using the same method as Barger & Cowie (2023), the fact that three of them are at lower significance here is likely because the prior sample is different (ALMA versus JWST) and thus our extraction is deblending the sources differently. Combining the 43 ALMA sources detected at in the 850 m map with the three that were previously identified as SCUBA-2 counterparts but were not selected by this method, we estimate an upper limit on the fraction of ALMA sources detected at 850 m of 46/69 (67%). By searching for peaks within 4′′ of 5000 random positions in the SCUBA-2 map, we estimate that the false positive rate for this method is 8% at 2.5; in other words, we expect at most four of our detections could be false positives.
Of the 69 ALMA sources, 24 are detected at at 450 m. Eighteen of these are also detected at 850 m, with a median / ratio of 3.75. By measuring the fluxes and errors at random positions, we estimate that the false positive rate is 3%. Thus, we expect that at most one of our 24 detections could be a false positive. Of the six sources detected at 450 m but not detected at 850 m, one source corresponds to one of the three previously-identified red priors that was deblended differently in the 850 m extraction, as mentioned above. This leaves five unique sources detected at 450 m that are not counted in the 850 m total. If we combine the 46 sources detected at 850 m with these five sources, then 51/69 (74%) of the ALMA sources have SCUBA-2 detections in at least one band.
In Table 1, we include a summary of the fraction of DUALZ ALMA sources detected at SCUBA-2 850 m and/or 450 m. We list the measured SCUBA-2 450 m and 850 m fluxes, errors, and S/N ratios for all the DUALZ sources in Table 2.
5 Discussion
5.1 Properties of ALMA Sources Detected in SCUBA-2 versus Non-detections
The analysis of the previous section has shown that nearly 75% of the ALMA sources in DUALZ are also detected in SCUBA-2 at either 850 m, 450 m, or both. Here we compare the flux and redshift properties of these sources to study any correlations with SCUBA-2 detection rate.
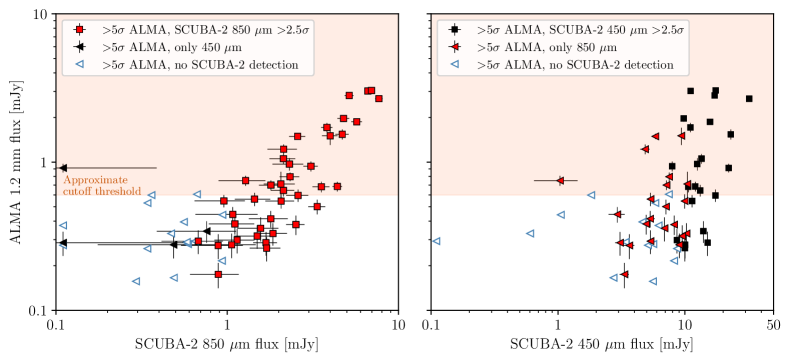
We have already seen from Figure 2 that most of the DUALZ sources not in the SCUBA-2 catalogs of Barger & Cowie (2023) are those with lower ALMA S/N ratios and/or 1.2 mm fluxes. In Figure 5, we make this more quantitative by comparing the ALMA fluxes to the SCUBA-2 850 m and 450 m fluxes directly measured at each ALMA position, limiting the sample to the 59 DUALZ sources with ALMA S/N 5.
We first see that down to a 1.2 mm flux limit of 0.6 mJy (shaded region), we detect all the ALMA sources in at least one SCUBA-2 band at , but below this limit, we start to lose SCUBA-2 detections. Only one of the ALMA sources (#23 in Table 2) above the 0.6 mJy limit at 1.2 mm is detected only at 450 m and not at 850 m; this source is a low-redshift ( = 1.498 from Muñoz Arancibia et al. 2023) galaxy that is one of the brightest detections at 450 m (22.1 mJy). We can also see that the loss of SCUBA-2 detections below the 0.6 mJy cut at 1.2 mm is primarily an issue of SCUBA-2 image depth: The strong correlation between 1.2 mm and 850 m flux implies that fainter ALMA sources will start to fall below the SCUBA-2 850 m 2.5 detection limit (0.8 mJy in the current images).
We next use the available redshifts for these sources to investigate how the SCUBA-2-detected fraction (i.e., the fraction of ALMA sources with 450 m and/or 850 m detections) varies with redshift. Fujimoto et al. (2023b) published photometric redshifts (photzs) estimated with prospector (Johnson et al., 2021) and eazy (Brammer et al., 2008) and spectroscopic redshifts (speczs) from NIRSpec prism observations for the DUALZ catalog (both the speczs and photzs are discussed in more detail in Wang et al. 2023). For the 27 sources with speczs, they find excellent agreement with the photz estimates.
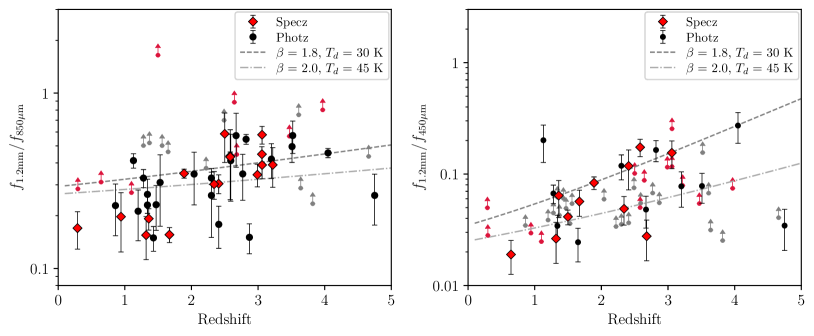
In Figure 6, we show the 1.2 mm to 850 m flux ratios (left) and 1.2 mm to 450 m flux ratios (right) versus redshift for the DUALZ sources with redshifts (two ALMA sources have neither speczs nor photzs and are not shown). We show 2 lower limits (upward-pointing arrows) in cases where the SCUBA-2 fluxes have less than significance. In each panel, we also show the expected tracks for simple modified blackbody models of the form with varying emissivity indices, , and dust temperatures, (see figure legend; e.g., McKay et al. 2023). In the right panel, we see good alignment between the measured 1.2 mm to 450 m flux ratios and the models; while in the left panel, the measured 1.2 mm to 850 m flux ratios show a larger degree of scatter. This is likely because the 850 m and 1.2 mm bands lie close to each other and are therefore more susceptible to uncertainties in the flux ratios.
There is a slight evolution with redshift in the SCUBA-2-detected fraction of ALMA sources. Specifically, the SCUBA-2-detected fraction for the ALMA sources with is 81%, while for it is 60%. From the modified blackbody tracks in both panels of Figure 6, we can see that the expected 1.2 mm to 850 m and 1.2 mm to 450 m flux ratios increase from to , which suggests that some of these galaxies may be undetected simply because of the deeper ALMA flux limits combined with the higher mm to submm flux ratios as we move to higher redshift.
Other authors have compared submm/mm flux ratios to published speczs and photzs (Casey et al., 2013; Lim et al., 2020; Barger et al., 2022; Cowie et al., 2023) or used them to make rough redshift estimates for sources whose optical/near-infrared (NIR) counterparts are faint or not identified (e.g., Wang et al., 2019). These estimates rely on the fact that the submm bands lie closer to the peak of the dust emission in the FIR and therefore have flux ratios that change substantially as the spectral energy distribution (SED) is redshifted.
For the DUALZ sources with ALMA S/N 5, we find that the 1.2 mm to 450 m flux ratio (right panel of Figure 6) shows a steeper dependence on redshift than the 1.2 mm to 850 m ratio, reflecting the larger separation between the observed wavelengths. The best-fit line is , with some scatter. The 1.2 mm to 850 m flux ratio has a slightly shallower best-fit line of . Although other studies (e.g., Barger et al., 2022) have found a good redshift correlation with the 450 m to 850 m ratio, there are not enough sources with both 450 m and 850 m detections to constrain this relationship for the DUALZ sample. Deepening the 450 m imaging on the field (which is substantially shallower than the data used in Barger et al. 2022) would help constrain these relationships and could help to further refine the redshifts and dust properties of these galaxies.
We note that nearly all of the DUALZ sources are at , with just two sources between and only one source at . Fujimoto et al. (2023b) discuss the latter object (#66 in Table 2; this object is not shown in Figure 6 since it has an ALMA S/N of 4.9), which has , suggesting that it may be an example of a JWST-dark galaxy. We find that this source is not detected in either the 450 m or 850 m data. This is not unexpected if the source is real and located at , since a simple modifed blackbody fit to the ALMA point would suggest the 850 m flux should be around 0.20 mJy (with some dependence on the assumed and ), just below the noise level. Nevertheless, the 450 m and 850 m upper limits could provide additional constraints on the photz fitting.
5.2 Using Red JWST Priors to Identify Counterparts to Faint SCUBA-2 Galaxies
The expanded ALMA data in the A2744 field provided by the DUALZ survey allows us to test how well the red NIRCam selection of Barger & Cowie (2023) picks out the ALMA counterparts to submillimeter-bright DSFGs. As described in Section 3, 31/39 of the red priors with SCUBA-2 fluxes are also in the DUALZ catalog of Fujimoto et al. (2023b), with another six detected at in the DUALZ map. This corresponds to a total fraction of red galaxies with SCUBA-2 fluxes confirmed by ALMA of 95%.
This result emphasizes the utility of the red color selection as a method for probing to fainter submillimeter fluxes, and shows that one can obtain large samples of faint DSFGs in fields with both deep SCUBA-2 and JWST coverage. Furthermore, this red selection provides an efficient way to identify sources for high-resolution ALMA follow-up imaging or for millimeter spectral scans at a much lower investment of observing time than large mosaicked surveys (e.g., Cowie et al., 2022).
We note that a red NIRCam prior selection used to select the SCUBA-2 sources does introduce a potential selection bias against faint submillimeter/millimeter sources with less red NIR counterparts, including some of the other ALMA sources in the Fujimoto et al. (2023b) catalog. In an upcoming paper (McKay et al., 2024, in preparation), we will further discuss the selection effects of using red counterparts to pick out DSFGs and study the properties of red sources detected in the submillimeter/millimeter versus non-detections. In addition, we note that upcoming ALMA Band 7 follow-up observations (ALMA project #2023.1.00468.S; PI: F. Bauer) of over 80 SCUBA-2 850 m-selected DSFGs across three lensing cluster fields with JWST data (including A2744) will help to pin down the fraction of SCUBA-2 sources that can be recovered with red priors. Furthermore, these observations will greatly increase the number of faint DSFGs with ALMA detections while constraining the cosmic variance between fields. Finally, the combination of the ALMA and SCUBA-2 data with JWST NIRCam imaging will make it possible to measure stellar masses and star formation rates from panchromatic SED fits.
6 Summary
We used complementary ALMA and SCUBA-2 observations to compare submillimeter and millimeter galaxy selections in the A2744 cluster field. We showed that 15/17 of the SCUBA-2 sources are detected in the DUALZ ALMA 1.2 mm mosaic of Fujimoto et al. (2023b), with a low multiplicity of 13%. We also showed that about 95% of the red galaxy priors identified as SCUBA-2 sources in Barger & Cowie (2023) are detected by ALMA. Six of these are not detected outright in the DUALZ catalog but are detected at lower significance () in the ALMA image. From the high ALMA detection fraction, we concluded that red prior selection combined with SCUBA-2 data is a straightforward and efficient way to select faint DSFGs.
We also analyzed the SCUBA-2 450 m and 850m fluxes of the DUALZ sample and found that 74% of the ALMA sources are detected in at least one submillimeter band: 46/69 are detected at at 850 m, with an additional five detected at in the 450 m data but not at 850 m. All of the ALMA sources that are not detected in SCUBA-2 have 1.2 mm fluxes 0.6 mJy. Thus, we concluded that the lack of detections in SCUBA-2 is primarily an issue of depth.
Using the photzs and speczs for the DUALZ sample, we compared the variation in the measured submillimeter/millimeter fluxes and the SCUBA-2 detection fraction with redshift. We found that the SCUBA-2 detection fraction of ALMA sources dropped slightly beyond , possibly due to higher millimeter to submillimeter flux ratios combined with the deeper ALMA flux limits. Furthermore, we showed that the 1.2 mm to 450 m flux ratio is well correlated with redshift for this sample. Deeper 450 m imaging, in particular, could help constrain the redshifts and dust properties of the full ALMA sample.
ADS/JAO.ALMA#2015.1.01425.S,
ADS/JAO.ALMA#2017.1.01219.S,
ADS/JAO.ALMA#2018.1.00035.L,
and ADS/JAO.ALMA#2022.1.00073.S.
ALMA is a partnership of ESO (representing its member states), NSF (USA), and NINS (Japan), together with NRC (Canada), MOST and ASIAA (Taiwan), and KASI (Republic of Korea), in cooperation with the Republic of Chile. The Joint ALMA Observatory is operated by ESO, AUI/NRAO, and NAOJ. The James Clerk Maxwell Telescope is operated by the East Asian Observatory on behalf of The National Astronomical Observatory of Japan, Academia Sinica Institute of Astronomy and Astrophysics, the Korea Astronomy and Space Science Institute, the National Astronomical Observatories of China and the Chinese Academy of Sciences (grant No. XDB09000000), with additional funding support from the Science and Technology Facilities Council of the United Kingdom and participating universities in the United Kingdom and Canada. We wish to recognize and acknowledge the very significant cultural role and reverence that the summit of Maunakea has always held within the indigenous Hawaiian community. We are most fortunate to have the opportunity to conduct observations from this mountain.
References
- Aravena et al. (2016) Aravena, M., Decarli, R., Walter, F., et al. 2016, ApJ, 833, 68
- Astropy Collaboration et al. (2022) Astropy Collaboration, Price-Whelan, A. M., Lim, P. L., et al. 2022, ApJ, 935, 167
- Barger & Cowie (2023) Barger, A. J., & Cowie, L. L. 2023, arXiv e-prints, arXiv:2303.07419
- Barger et al. (2022) Barger, A. J., Cowie, L. L., Blair, A. H., & Jones, L. H. 2022, ApJ, 934, 56
- Barger et al. (1998) Barger, A. J., Cowie, L. L., Sanders, D. B., et al. 1998, Nature, 394, 248
- Bezanson et al. (2022) Bezanson, R., Labbe, I., Whitaker, K. E., et al. 2022, arXiv e-prints, arXiv:2212.04026
- Brammer et al. (2008) Brammer, G. B., van Dokkum, P. G., & Coppi, P. 2008, ApJ, 686, 1503
- Calvo et al. (2016) Calvo, M., Benoît, A., Catalano, A., et al. 2016, Journal of Low Temperature Physics, 184, 816
- Casey et al. (2013) Casey, C. M., Chen, C.-C., Cowie, L. L., et al. 2013, MNRAS, 436, 1919
- Casey et al. (2021) Casey, C. M., Zavala, J. A., Manning, S. M., et al. 2021, ApJ, 923, 215
- Chen et al. (2013) Chen, C.-C., Cowie, L. L., Barger, A. J., et al. 2013, ApJ, 776, 131
- Cowie et al. (2023) Cowie, L. L., Barger, A. J., & Bauer, F. E. 2023, ApJ, 952, 28
- Cowie et al. (2022) Cowie, L. L., Barger, A. J., Bauer, F. E., et al. 2022, ApJ, 939, 5
- Cowie et al. (2017) Cowie, L. L., Barger, A. J., Hsu, L. Y., et al. 2017, ApJ, 837, 139
- Cowie et al. (2002) Cowie, L. L., Barger, A. J., & Kneib, J. P. 2002, AJ, 123, 2197
- Dole et al. (2006) Dole, H., Lagache, G., Puget, J. L., et al. 2006, A&A, 451, 417
- Dunlop et al. (2017) Dunlop, J. S., McLure, R. J., Biggs, A. D., et al. 2017, MNRAS, 466, 861
- Eales et al. (1999) Eales, S., Lilly, S., Gear, W., et al. 1999, ApJ, 515, 518
- Fixsen et al. (1998) Fixsen, D. J., Dwek, E., Mather, J. C., Bennett, C. L., & Shafer, R. A. 1998, ApJ, 508, 123
- Fujimoto et al. (2023a) Fujimoto, S., Kohno, K., Ouchi, M., et al. 2023a, arXiv e-prints, arXiv:2303.01658
- Fujimoto et al. (2023b) Fujimoto, S., Bezanson, R., Labbe, I., et al. 2023b, arXiv e-prints, arXiv:2309.07834
- Furtak et al. (2023) Furtak, L. J., Zitrin, A., Weaver, J. R., et al. 2023, MNRAS, 523, 4568
- Gómez-Guijarro et al. (2022) Gómez-Guijarro, C., Elbaz, D., Xiao, M., et al. 2022, A&A, 658, A43
- González-López et al. (2017) González-López, J., Bauer, F. E., Romero-Cañizales, C., et al. 2017, A&A, 597, A41
- González-López et al. (2020) González-López, J., Novak, M., Decarli, R., et al. 2020, ApJ, 897, 91
- Hatsukade et al. (2016) Hatsukade, B., Kohno, K., Umehata, H., et al. 2016, PASJ, 68, 36
- Hatsukade et al. (2018) Hatsukade, B., Kohno, K., Yamaguchi, Y., et al. 2018, PASJ, 70, 105
- Hauser et al. (1998) Hauser, M. G., Arendt, R. G., Kelsall, T., et al. 1998, ApJ, 508, 25
- Holland et al. (2013) Holland, W. S., Bintley, D., Chapin, E. L., et al. 2013, MNRAS, 430, 2513
- Hsu et al. (2016) Hsu, L.-Y., Cowie, L. L., Chen, C.-C., Barger, A. J., & Wang, W.-H. 2016, ApJ, 829, 25
- Hughes et al. (1998) Hughes, D. H., Serjeant, S., Dunlop, J., et al. 1998, Nature, 394, 241
- Johnson et al. (2021) Johnson, B. D., Leja, J., Conroy, C., & Speagle, J. S. 2021, ApJS, 254, 22
- Knudsen et al. (2008) Knudsen, K. K., van der Werf, P. P., & Kneib, J. P. 2008, MNRAS, 384, 1611
- Lim et al. (2020) Lim, C.-F., Wang, W.-H., Smail, I., et al. 2020, ApJ, 889, 80
- Lotz et al. (2017) Lotz, J. M., Koekemoer, A., Coe, D., et al. 2017, ApJ, 837, 97
- McKay et al. (2024, in preparation) McKay, S. J., Barger, A. J., & Cowie, L. L. 2024, in preparation
- McKay et al. (2023) McKay, S. J., Barger, A. J., Cowie, L. L., Bauer, F. E., & Rosenthal, M. J. N. 2023, ApJ, 951, 48
- Monfardini et al. (2014) Monfardini, A., Adam, R., Adane, A., et al. 2014, Journal of Low Temperature Physics, 176, 787
- Muñoz Arancibia et al. (2018) Muñoz Arancibia, A. M., González-López, J., Ibar, E., et al. 2018, A&A, 620, A125
- Muñoz Arancibia et al. (2023) —. 2023, A&A, 675, A85
- Paris et al. (2023) Paris, D., Merlin, E., Fontana, A., et al. 2023, ApJ, 952, 20
- Puget et al. (1996) Puget, J. L., Abergel, A., Bernard, J. P., et al. 1996, A&A, 308, L5
- Roberts-Borsani et al. (2023) Roberts-Borsani, G., Treu, T., Chen, W., et al. 2023, Nature, 618, 480
- Smail et al. (1997) Smail, I., Ivison, R. J., & Blain, A. W. 1997, ApJ, 490, L5
- Treu et al. (2022) Treu, T., Roberts-Borsani, G., Bradac, M., et al. 2022, ApJ, 935, 110
- Umehata et al. (2017) Umehata, H., Tamura, Y., Kohno, K., et al. 2017, ApJ, 835, 98
- Walter et al. (2016) Walter, F., Decarli, R., Aravena, M., et al. 2016, ApJ, 833, 67
- Wang et al. (2023) Wang, B., Leja, J., Labbé, I., et al. 2023, arXiv e-prints, arXiv:2310.01276
- Wang et al. (2019) Wang, T., Schreiber, C., Elbaz, D., et al. 2019, Nature, 572, 211
- Weaver et al. (2023) Weaver, J. R., Cutler, S. E., Pan, R., et al. 2023, arXiv e-prints, arXiv:2301.02671
- Wilson et al. (2020) Wilson, G. W., Abi-Saad, S., Ade, P., et al. 2020, in Society of Photo-Optical Instrumentation Engineers (SPIE) Conference Series, Vol. 11453, Millimeter, Submillimeter, and Far-Infrared Detectors and Instrumentation for Astronomy X, ed. J. Zmuidzinas & J.-R. Gao, 1145302
- Zavala et al. (2018) Zavala, J. A., Aretxaga, I., Dunlop, J. S., et al. 2018, MNRAS, 475, 5585
- Zavala et al. (2021) Zavala, J. A., Casey, C. M., Manning, S. M., et al. 2021, ApJ, 909, 165
| SCUBA-2 (Barger & Cowie, 2023) | DUALZ (Fujimoto et al., 2023b) | ||||||
|---|---|---|---|---|---|---|---|
| (direct) | (red priors) | ||||||
| Number | % | Number | % | Number | % | ||
| Total in ALMA coverage | 17 | 100% | 39 | 100% | Total | 69 | 100% |
| With red counterparts | 15aaTwo SCUBA-2 sources match to the same counterpart (see Section 3).bbOne red counterpart was corrected by the ALMA data to a different red prior slightly further from the SCUBA-2 centroid (see Section 3). | 88% | 39 | 100% | in ALMA maps | 59 | 86% |
| With DUALZ counterparts | 15aaTwo SCUBA-2 sources match to the same counterpart (see Section 3). | 88% | 31 | 80% | , SCUBA-2 850 m | 43ccThree ALMA sources which correspond to red-prior-selected SCUBA-2 850 m sources were not detected with SCUBA-2 at 850 m using the ALMA priors; however, one was detected at 450 m (see Section 4). We include these sources in the final total. | 62% |
| ALMA detections | 15aaTwo SCUBA-2 sources match to the same counterpart (see Section 3). | 88% | 37 | 95% | , SCUBA-2 450 m | 24 | 35% |
| , both SCUBA-2 bands | 18 | 26% | |||||
| , at least one SCUBA-2 band | 49 | 71% | |||||
| Total with SCUBA-2 detections | 51ccThree ALMA sources which correspond to red-prior-selected SCUBA-2 850 m sources were not detected with SCUBA-2 at 850 m using the ALMA priors; however, one was detected at 450 m (see Section 4). We include these sources in the final total. | 74% | |||||
Note. — Thirteen of the direct SCUBA-2 detections correspond to 12 of the red-prior-selected SCUBA-2 sources.
| ALMA | SCUBA-2 | SCUBA-2 | ALMA | ||||||||
|---|---|---|---|---|---|---|---|---|---|---|---|
| No. | R.A. | Decl. | Error | S/N | Error | S/N | Error | S/N | |||
| J2000.0 | J2000.0 | (mJy) | (mJy) | (mJy) | |||||||
| 1 | 3.6036340 | -30.429562 | 3.65 | 3.82 | 1.0 | 0.89 | 0.35 | 2.5 | 0.27 | 0.05 | 5.3 |
| 2 | 3.5755829 | -30.424378 | 11.1 | 3.39 | 3.3 | 6.62 | 0.30 | 22.2 | 3.02 | 0.12 | 41.4 |
| 3 | 3.5863515 | -30.425044 | 7.52 | 3.46 | 2.2 | 2.33 | 0.31 | 7.6 | 0.80 | 0.05 | 15.0 |
| 4 | 3.6056155 | -30.418061 | 10.0 | 3.49 | 2.9 | 0.49 | 0.31 | 1.6 | 0.28 | 0.05 | 5.3 |
| 5 | 3.5760482 | -30.413200 | 17.5 | 3.00 | 5.8 | 6.96 | 0.27 | 25.9 | 3.04 | 0.12 | 45.2 |
| 6 | 3.6085748 | -30.414591 | 11.4 | 3.46 | 3.3 | 0.96 | 0.31 | 3.1 | 0.55 | 0.05 | 10.5 |
| 7 | 3.5650518 | -30.412200 | 5.11 | 3.07 | 1.7 | -0.14 | 0.27 | -0.5 | 0.28 | 0.05 | 6.1 |
| 8 | 3.5690146 | -30.402798 | 5.36 | 2.93 | 1.8 | 0.68 | 0.26 | 2.6 | 0.29 | 0.05 | 6.3 |
| 9 | 3.5723726 | -30.395954 | 4.63 | 2.93 | 1.6 | 0.56 | 0.26 | 2.1 | 0.40 | 0.05 | 7.5 |
| 10 | 3.6276995 | -30.394278 | 13.5 | 3.92 | 3.4 | 2.13 | 0.37 | 5.8 | 1.06 | 0.08 | 21.5 |
| 11 | 3.6005232 | -30.396158 | 3.34 | 2.97 | 1.1 | 0.89 | 0.28 | 3.2 | 0.18 | 0.03 | 5.2 |
| 12 | 3.6175369 | -30.395013 | 5.63 | 3.45 | 1.6 | 0.59 | 0.32 | 1.8 | 0.28 | 0.06 | 6.0 |
| 13 | 3.5667961 | -30.394888 | 7.16 | 3.00 | 2.4 | 1.80 | 0.27 | 6.8 | 0.70 | 0.05 | 15.3 |
| 14 | 3.6326635 | -30.393642 | 7.47 | 4.08 | 1.8 | 0.67 | 0.38 | 1.8 | 0.61 | 0.06 | 14.0 |
| 15 | 3.6214798 | -30.393109 | 5.36 | 3.57 | 1.5 | 1.44 | 0.34 | 4.3 | 0.56 | 0.06 | 13.2 |
| 16 | 3.5809797 | -30.390749 | 3.08 | 2.87 | 1.1 | 1.68 | 0.27 | 6.3 | 0.29 | 0.05 | 5.5 |
| 17 | 3.5474111 | -30.388289 | 17.1 | 3.64 | 4.7 | 5.16 | 0.31 | 16.8 | 2.82 | 0.07 | 55.2 |
| 18 | 3.5327226 | -30.387320 | 6.20 | 4.38 | 1.4 | 0.08 | 0.36 | 0.2 | 0.37 | 0.06 | 6.6 |
| 19 | 3.5719637 | -30.383018 | 12.1 | 3.05 | 4.0 | 4.40 | 0.28 | 15.7 | 0.68 | 0.05 | 13.5 |
| 20 | 3.5190588 | -30.386326 | 9.36 | 5.10 | 1.8 | 3.99 | 0.41 | 9.6 | 1.50 | 0.20 | 8.9 |
| 21 | 3.5825067 | -30.385468 | 5.85 | 2.92 | 2.0 | 2.58 | 0.28 | 9.3 | 1.49 | 0.06 | 42.0 |
| 22 | 3.5850010 | -30.381794 | 11.1 | 2.98 | 3.7 | 3.82 | 0.29 | 13.2 | 1.71 | 0.12 | 24.5 |
| 23 | 3.5732507 | -30.383497 | 22.1 | 3.01 | 7.3 | 0.05 | 0.28 | 0.2 | 0.91 | 0.06 | 24.6 |
| 24 | 3.6357675 | -30.382387 | 1.82 | 3.98 | 0.5 | 0.36 | 0.43 | 0.8 | 0.60 | 0.06 | 11.3 |
| 25 | 3.5126766 | -30.380966 | 10.4 | 5.27 | 2.0 | 2.06 | 0.42 | 4.9 | 0.71 | 0.15 | 6.9 |
| 26 | 3.5920643 | -30.380487 | 5.85 | 3.02 | 1.9 | 0.34 | 0.30 | 1.1 | 0.53 | 0.06 | 11.5 |
| 27 | 3.5812925 | -30.380250 | 0.60 | 3.04 | 0.2 | 0.47 | 0.29 | 1.6 | 0.33 | 0.05 | 9.1 |
| 28 | 3.5797072 | -30.378413 | 7.94 | 3.04 | 2.6 | 3.08 | 0.30 | 10.4 | 0.94 | 0.07 | 21.5 |
| 29 | 3.5599876 | -30.377804 | 3.40 | 3.35 | 1.0 | 0.58 | 0.30 | 1.9 | 0.29 | 0.06 | 5.9 |
| 30 | 3.5579207 | -30.377236 | 8.23 | 3.43 | 2.4 | 2.52 | 0.31 | 8.1 | 0.38 | 0.06 | 6.7 |
| 31 | 3.5823806 | -30.377170 | 8.65 | 3.08 | 2.8 | 1.14 | 0.30 | 3.8 | 0.30 | 0.06 | 5.8 |
| 32 | 3.5995954 | -30.374707 | 4.95 | 3.22 | 1.5 | 1.11 | 0.33 | 3.4 | 0.38 | 0.06 | 7.4 |
| 33 | 3.5103148 | -30.375438 | 6.91 | 5.18 | 1.3 | 1.57 | 0.42 | 3.7 | 0.36 | 0.07 | 6.1 |
| 34 | 3.5543533 | -30.371955 | 13.2 | 3.60 | 3.7 | 2.13 | 0.33 | 6.4 | 0.64 | 0.06 | 13.1 |
| 35 | 3.6172782 | -30.368795 | 9.80 | 3.58 | 2.7 | 4.78 | 0.38 | 12.5 | 1.97 | 0.10 | 35.6 |
| 36 | 3.5237288 | -30.371469 | 10.3 | 4.53 | 2.3 | 1.85 | 0.38 | 4.8 | 0.33 | 0.06 | 8.7 |
| 37 | 3.5638035 | -30.367614 | 9.99 | 3.54 | 2.8 | 1.70 | 0.34 | 4.9 | 0.26 | 0.05 | 5.4 |
| 38 | 3.5375675 | -30.365649 | 14.0 | 4.06 | 3.4 | 0.76 | 0.37 | 2.0 | 0.34 | 0.06 | 6.9 |
| 39 | 3.5311608 | -30.361294 | 7.09 | 4.14 | 1.7 | 3.35 | 0.38 | 8.8 | 0.50 | 0.06 | 9.2 |
| 40 | 3.6006013 | -30.362714 | 1.04 | 3.70 | 0.3 | 1.28 | 0.39 | 3.3 | 0.75 | 0.06 | 16.0 |
| 41 | 3.5391400 | -30.360300 | 17.4 | 3.97 | 4.4 | 2.59 | 0.38 | 6.8 | 0.60 | 0.06 | 10.6 |
| 42 | 3.5362850 | -30.360378 | 32.1 | 4.02 | 8.0 | 7.69 | 0.38 | 20.2 | 2.68 | 0.09 | 50.4 |
| 43 | 3.5211455 | -30.360680 | 9.95 | 4.40 | 2.3 | 2.06 | 0.40 | 5.2 | 0.55 | 0.06 | 11.1 |
| 44 | 3.5990300 | -30.359757 | 10.6 | 3.78 | 2.8 | 3.55 | 0.40 | 8.9 | 0.68 | 0.06 | 12.2 |
| 45 | 3.5938354 | -30.356617 | 23.0 | 3.98 | 5.8 | 4.70 | 0.42 | 11.2 | 1.54 | 0.12 | 24.7 |
| 46 | 3.5237434 | -30.359221 | -0.51 | 4.33 | -0.1 | 0.65 | 0.39 | 1.7 | 0.29 | 0.06 | 5.9 |
| 47 | 3.5926433 | -30.356140 | 2.93 | 4.05 | 0.7 | 1.08 | 0.43 | 2.5 | 0.44 | 0.05 | 8.3 |
| 48 | 3.5583154 | -30.354969 | 4.86 | 3.92 | 1.2 | 2.13 | 0.42 | 5.1 | 1.22 | 0.09 | 23.8 |
| 49 | 3.5463709 | -30.353476 | 9.03 | 3.92 | 2.3 | 1.06 | 0.40 | 2.6 | 0.28 | 0.05 | 6.8 |
| 50 | 3.5491494 | -30.352245 | 15.8 | 3.93 | 4.0 | 5.71 | 0.41 | 13.9 | 1.87 | 0.07 | 39.3 |
| 51 | 3.5305552 | -30.352317 | 9.51 | 4.10 | 2.3 | 1.49 | 0.40 | 3.8 | 0.32 | 0.06 | 7.6 |
| 52 | 3.5612866 | -30.326963 | 8.22 | 4.27 | 1.9 | 0.93 | 0.46 | 2.0 | 0.22 | 0.04 | 5.4 |
| 53 | 3.5555550 | -30.335627 | 8.67 | 4.15 | 2.1 | 0.34 | 0.45 | 0.8 | 0.26 | 0.05 | 6.3 |
| 54 | 3.5528434 | -30.344173 | 1.05 | 4.07 | 0.3 | 0.94 | 0.44 | 2.1 | 0.44 | 0.05 | 8.8 |
| 55 | 3.5641531 | -30.344466 | 12.5 | 4.21 | 3.0 | 2.31 | 0.47 | 4.9 | 0.97 | 0.09 | 17.1 |
| 56 | 3.5611003 | -30.330043 | 5.33 | 4.22 | 1.3 | 1.80 | 0.46 | 3.9 | 0.42 | 0.05 | 8.8 |
| 57 | 3.5566688 | -30.384299 | 10.3 | 3.31 | 3.1 | 0.66 | 0.29 | 2.3 | 0.26 | 0.06 | 4.5 |
| 58 | 3.6384449 | -30.381213 | 6.38 | 4.07 | 1.6 | 1.51 | 0.45 | 3.4 | 0.31 | 0.07 | 4.6 |
| 59 | 3.5582541 | -30.374437 | 5.58 | 3.47 | 1.6 | 0.7 | 0.32 | 2.2 | 0.26 | 0.06 | 4.7 |
| 60 | 3.5923715 | -30.368396 | 4.90 | 3.42 | 1.4 | 0.91 | 0.35 | 2.6 | 0.26 | 0.06 | 4.6 |
| 61 | 3.5580404 | -30.331104 | 10.6 | 4.20 | 2.5 | 0.16 | 0.46 | 0.3 | 0.26 | 0.05 | 4.9 |
| 62 | 3.5456886 | -30.337678 | 8.42 | 4.1 | 2.1 | 0.66 | 0.44 | 1.5 | 0.24 | 0.05 | 4.5 |
| 63 | 3.5671705 | -30.341419 | 5.84 | 4.32 | 1.4 | 0.07 | 0.48 | 0.1 | 0.24 | 0.05 | 4.4 |
| 64 | 3.5618008 | -30.330958 | 15.1 | 4.22 | 3.6 | -0.06 | 0.46 | -0.1 | 0.29 | 0.05 | 5.4 |
| 65 | 3.5685704 | -30.329642 | 3.05 | 4.32 | 0.7 | -0.13 | 0.46 | -0.3 | 1.14 | 0.24 | 4.7 |
| 66 | 3.5938125 | -30.408263 | 1.16 | 3.02 | 0.4 | 0.47 | 0.27 | 1.7 | 0.15 | 0.05 | 4.9 |
| 67 | 3.6017503 | -30.407851 | 5.60 | 3.17 | 1.8 | 0.29 | 0.29 | 1.0 | 0.16 | 0.04 | 5.2 |
| 68 | 3.5932584 | -30.384375 | 2.74 | 2.95 | 0.9 | 0.49 | 0.29 | 1.7 | 0.17 | 0.05 | 5.0 |
| 69 | 3.5902747 | -30.400439 | 6.64 | 2.89 | 2.3 | 0.76 | 0.27 | 2.9 | 0.18 | 0.04 | 4.2 |
Note. — Fluxes have not been corrected for magnification.