Analyzing the Influence of Language Model-Generated Responses in Mitigating Hate Speech on Social Media Directed at Ukrainian Refugees in Poland
Abstract.
In the context of escalating hate speech and polarization on social media, this study investigates the potential of employing responses generated by Large Language Models (LLM), complemented with pertinent verified knowledge links, to counteract such trends. Through extensive A/B testing involving the posting of 753 automatically generated responses, the goal was to minimize the propagation of hate speech directed at Ukrainian refugees in Poland.
The results indicate that deploying LLM-generated responses as replies to harmful tweets effectively diminishes user engagement, as measured by likes/impressions. When we respond to an original tweet, i.e., which is not a reply, we reduce the engagement of users by over 20% without increasing the number of impressions. On the other hand, our responses increase the ratio of the number of replies to a harmful tweet to impressions, especially if the harmful tweet is not original. Additionally, the study examines how generated responses influence the overall sentiment of tweets in the discussion, revealing that our intervention does not significantly alter the mean sentiment.
This paper suggests the implementation of an automatic moderation system to combat hate speech on social media and provides an in-depth analysis of the A/B experiment, covering methodology, data collection, and statistical outcomes. Ethical considerations and challenges are also discussed, offering guidance for the development of discourse moderation systems leveraging the capabilities of generative AI.
1. Introduction
The full-scale conflict in Ukraine that started in February 2022 resulted in a humanitarian crisis and forced millions of people to leave their homes. In neighboring Poland, the conflict, its financial aspects, and help towards refugees were heavily discussed on social media platforms such as X (previously Twitter). In such a conversational environment, hate speech develops and is used as a tool to reinforce the narratives on each side. It also contributes to the propagation of disinformation by distancing it from facts and highlighting the emotional aspect. Due to its strong impact on attitudes and beliefs, hate speech requires neutralization, which should take place as soon as possible after publication. In social media, where information spreads rapidly, there arises a need for a tool that can automatically detect, respond to, and neutralize hate speech. Additionally, it should perform well in the local language, in our case – Polish. In this work, we address the challenges posed by hate speech toward Ukrainian refugees in Poland, which is often fueled by nationalism and disinformation.
The phenomenon of hate speech in social media is particularly important, where there are much fewer objections to creating and publishing radical and antagonizing content. It becomes an expression of contempt, lack of respect, humiliation, and violation of dignity. However, the impact of hate speech does not end in the online sphere. It moves to the real world, where it takes forms ranging from insults or incitement to hatred to acts of aggression and physical violence. Leaving hate speech without intervention perpetuates its message, even after a long time after publication. This significantly affects the level of the entire public debate through information disorder in the ecosystem.
In 2023, Twitter released its Digital Services Act (DSA) Transparency Report (Twitter, 2023). This report provides extensive information related to how content moderation works on Twitter, including details such as, cite: ,,the number of people in our content moderation team who possess professional proficiency in the most commonly spoken languages in the EU on our platform”. For English, it is 2,294 people – a reasonable amount. However, for the second most popular language, German, it is only 81. Shockingly, for Polish, the number is just one person (Twitter, 2023). The single content moderator is the only team member who ,,possess professional proficiency” in Polish. The same report also states that there were 6.5 million logged-in users in Poland.
It does not seem feasible for one person to properly moderate such an amount of content. We believe that an AI-powered tool with the capability to analyze and effectively intervene on a larger scale could be of great assistance. This motivated us to develop a prototype system that employs various Large Language Models (LLMs) provided by the OpenAI API and conduct experiments to confirm its effectiveness. We demonstrate that our intervention can decrease user engagement (measured as the ratio of likes to impressions) and improve the sentiment of tweets in the discussion.
In this work, we outline the design of our automatic detection and response system, describe the methodology of the experiment, analyze and provide commentary on the results, and share additional insights that may be valuable for future work in automatic moderation systems. Furthermore, we discuss the ethical aspects of such interventions.
Our primary contribution in this work include:
-
(1)
Developing a detection model for harmful tweets, which combines OpenAI embedding with logistic regression.
-
(2)
Designing an intervention system to address harmful tweets. The system is based on a two-stage approach: first, it identifies verified news articles that are most relevant to the detected tweet, and then it generates a neutralizing message based on this verified content.
-
(3)
Conducting a live A/B test on Twitter.
-
(4)
Analyzing and discussing the results.
2. Related Work
Hate Speech Detection
Detecting hate speech on Twitter is a highly significant problem that has been studied by numerous research groups, see for example (Watanabe et al., 2018; Shah and Singh, 2023). Deep learning techniques for this task have also been explored in (Badjatiya et al., 2017). With the breakthrough of introducing the Transformer architecture (Vaswani et al., 2023) and Large Language Models like BERT (Devlin et al., 2019), the work (Mozafari et al., 2019) has demonstrated that using them for this problem yields satisfying results. Moreover, BERT models enable the utilization of transfer-learning (Zhuang et al., 2020) and fine-tuning techniques to adapt models for new tasks with limited data (Ali et al., 2022) (Tida and Hsu, 2022). With the availability of large RoBERTa models trained on Polish language data (Dadas et al., 2020), we can leverage transfer learning to develop our own hate speech classifier in the Polish language.
Sentence embeddings generated by BERT also prove to be meaningful features in the hate speech detection tasks (Rajput et al., 2021); authors of this paper compared hate speech classifiers trained on GloVe (Pennington et al., 2014), fastText (FT) (Bojanowski et al., 2016) and Word2Vec (Mikolov et al., 2013) embeddings with one trained on BERT embeddings. Results showed that the classifier using BERT embeddings outperformed other classifiers and that with good sentence embeddings, we can create a valid classifier. Using contrastive loss (Khosla et al., 2021) for pre-training of transformer models, one can create even better embeddings (Neelakantan et al., 2022a), which, we hypothesize, can lead to even better hate speech classifiers.
LLM Generated Responses
Generative models, especially GPT models (Radford et al., 2019), have proved to perform well in different generative tasks without any additional training or fine-tuning, just by giving a couple of examples in prompt (Brown et al., 2020). This technique of adapting LLMs for new tasks by demonstrating examples is referred to as few-shot learning or in-context learning (Dong et al., 2023). Wang et al. show (Wang et al., 2023a) that by using in-context learning, GPT-3 (Brown et al., 2020) model can generate high-quality, informative, and persuasive explanations of why the given text is hateful. Authors identify the potential of GPT-3 as a valuable tool for combating hate speech. On the other hand, the GPT models can generate biased (Lucy and Bamman, 2021) or hallucinated (Zhang et al., 2023) content, and the generated texts should be approached with caution. Usage of GPT models for content moderation online has already been researched with promising results on datasets (Axelsen et al., 2023), but to the best of our knowledge, there is no documented live experiment of posting LLM-generated replies as an intervention to combat hate speech.
3. Detecting Hate Speech
To detect harmful tweets, we tried two approaches: a) fine-tuning an open-source RoBERTa model pre-trained on a Polish dataset (Dadas et al., 2020) b) obtaining high-quality text embeddings from OpenAI API and then training a simple statistical classifier on the vector representations. Developing the fine-tuning-based classifier was done simultaneously with creating the hate speech detection dataset in the iterative process. Due to the sparsity of tweets that strictly matched our topic, we only labeled a small set of samples and then repeatedly trained the classifier on them and used it to score a larger set of new samples, which were then manually labeled again. The final training dataset obtained after six iterations of this process consisted of 632 tweets with 211 positive (harmful) samples. The test set consisted of 49 negative samples and 52 positive samples, which consisted of both real tweets and manually created examples.
3.1. First approach: fine-tuning
Our initial choice was motivated by the possibility of having an in-house solution. We utilized open-source Polish RoBERTa (Dadas et al., 2020) and used transfer learning techniques to fine-tune the model on our training dataset. It was shown that transfer-learning can help achieve a plausible performance (Lee et al., 2019) while drastically decreasing computational requirements. Our final classifier obtained by this method had an accuracy of 79.2% and a 2% false positive rate on the test set — the best we achieved in this approach. The advantage of using our own fine-tuned model is that there is no need to pay for and rely on third-party services. On the other hand, training the model was inconvenient – even with frozen layers, the training required multiple hours of training on multiple GPUs. This is especially problematic if we want to update the model often to capture new trends and topics on social media.
3.2. Second approach: embeddings + logistic regression
After experimenting with fine-tuning, we tried using a simpler statistical model for classification and high-quality word embeddings. For this part, we utilized embeddings offered by ada-embedding LLM accessed through OpenAI API, as these were shown previously to reach at least close to state-of-the-art scores on multiple benchmarks (Neelakantan et al., 2022b). For the classification method, we chose simple logistic regression. This approach required payment to obtain embeddings for every tweet analyzed but was much simpler and yielded satisfactory results comparable to the first approach. It is good to note that it did not require planned-ahead training – the model fitted to our training data in seconds. This allows changing the model behavior almost instantly by adding new samples to the training dataset. This is the method that we chose for the experiment.
4. Fact-checked responses generation
4.1. Vector embeddings of verified articles
To make our responses more factual and enhance the generative model’s ability to produce truthful responses, we decided to enhance model knowledge by adding relevant, verified articles to model prompts.
We maintained a database of 23 articles, including their text and URLs, sourced from reputable news outlets. We extended this database on a rolling basis as we observed new instances of misinformation during the experiment, which were not covered by the existing articles. Additionally, we introduced new articles when we noticed that our model relies too heavily on one particular news source. Diversity in information sources was a priority for us to avoid posting biased responses.
We stored the articles in the database with their vector embeddings generated by the same ada-embedding model as in the harmful tweet classifier. When we detected a harmful tweet, we calculated its relevance to every news article and selected the top K articles (K=3) with the best relevance. As a metric of relevance, we used cosine similarity:
A summary of the most relevant articles and the links to them were included in the GPT prompt so that our replies could refer to a piece of specific, verified information and provide its source.
4.2. Response generation
The quality of the generated text was our main area of focus. At the initial stage of our work, we conducted a survey in which we displayed to the 12 respondents samples of 30 harmful tweets with different neutralizing responses. Respondents were asked to assign if a response possessed a given feature (Pro-Ukrainian, Following the topic, Comprehensible, Written by a bot) or not. The respondents were not informed that, in fact, all the responses were generated by language models.
Among the methods used, there were:
-
(1)
GPT-3 Davinci model, accessed through the OpenAI API, with a proper prompt and a few examples.
-
(2)
GPT-3.5 model, accessed through the OpenAI API, with a proper prompt and a few examples.
-
(3)
Polish GPT-2 Medium (Dadas, 2019) model, fine-tuned on a dataset consisting of 100,000 tweet-response pairs and further fine-tuned on a smaller set of 4,200 harmful tweets and neutralizing response pairs. These pairs were collected from Twitter, generated by the GPT-3.5 model, or written by human annotators.
-
(4)
Polish GPT-2 XL, which is an upscaled version of the previous model, prepared in the same manner.
The survey results, as presented in Figure 1, show that responses generated by GPT-3.5 are mostly pro-Ukrainian, comprehensible, and following the discussion topic. Due to these results, we decided that further system development would be based on models provided by OpenAI as these models provide highest quality outputs. Ultimately, we chose GPT-4 as it outperformed other models on the most important NLP- and reasoning-related tasks (OpenAI, 2023). GPT-4 was not accessible to open public when performing the survey. We have tested that it was able to incorporate into the response additional information provided in the prompt, whereas GPT-3.5 rarely succeded on this task.
In particular, our prompt consisted of an instruction for the model to generate a response to a given tweet in a style that matches one used on Twitter, a short description of the situation of war in Ukraine, news summaries and their sources, and a couple of example interactions. We instructed the model to write answers in the style of a Twitter user who adheres to humanitarian values. News sources were presented as a summary of the news article – most of the time, a manually selected paragraph of the original text and a link to the article, which was to be used by GPT in the response. We present the whole prompt template in Appendix B.
A crucial aspect of generating responses was not posting harmful tweets, accidentally generated by the model. Modern models offered by OpenAI are known to be enforced against producing biased, illegal, or otherwise harmful content but are still not guaranteed to do so. We reviewed 100 responses generated by GPT-4 before the experiment and found none that would be inappropriate for posting. Furthermore, during the experiments, all the replies were also manually approved for posting.
| Feature | GPT-3 Davinci | GPT-3.5 | Polish GPT-2 medium | Polish GPT-2 xl |
| Pro-Ukrainian (%) | 44.10% | 84.24% | 61.67% | 75.56% |
| Following the topic | 43.59% | 86.67% | 27.22% | 52.22% |
| Comprehensible | 50.77% | 85.45% | 50.00% | 69.44% |
| Written by a bot | 39.49% | 23.03% | 50.00% | 37.78% |
5. Experiment
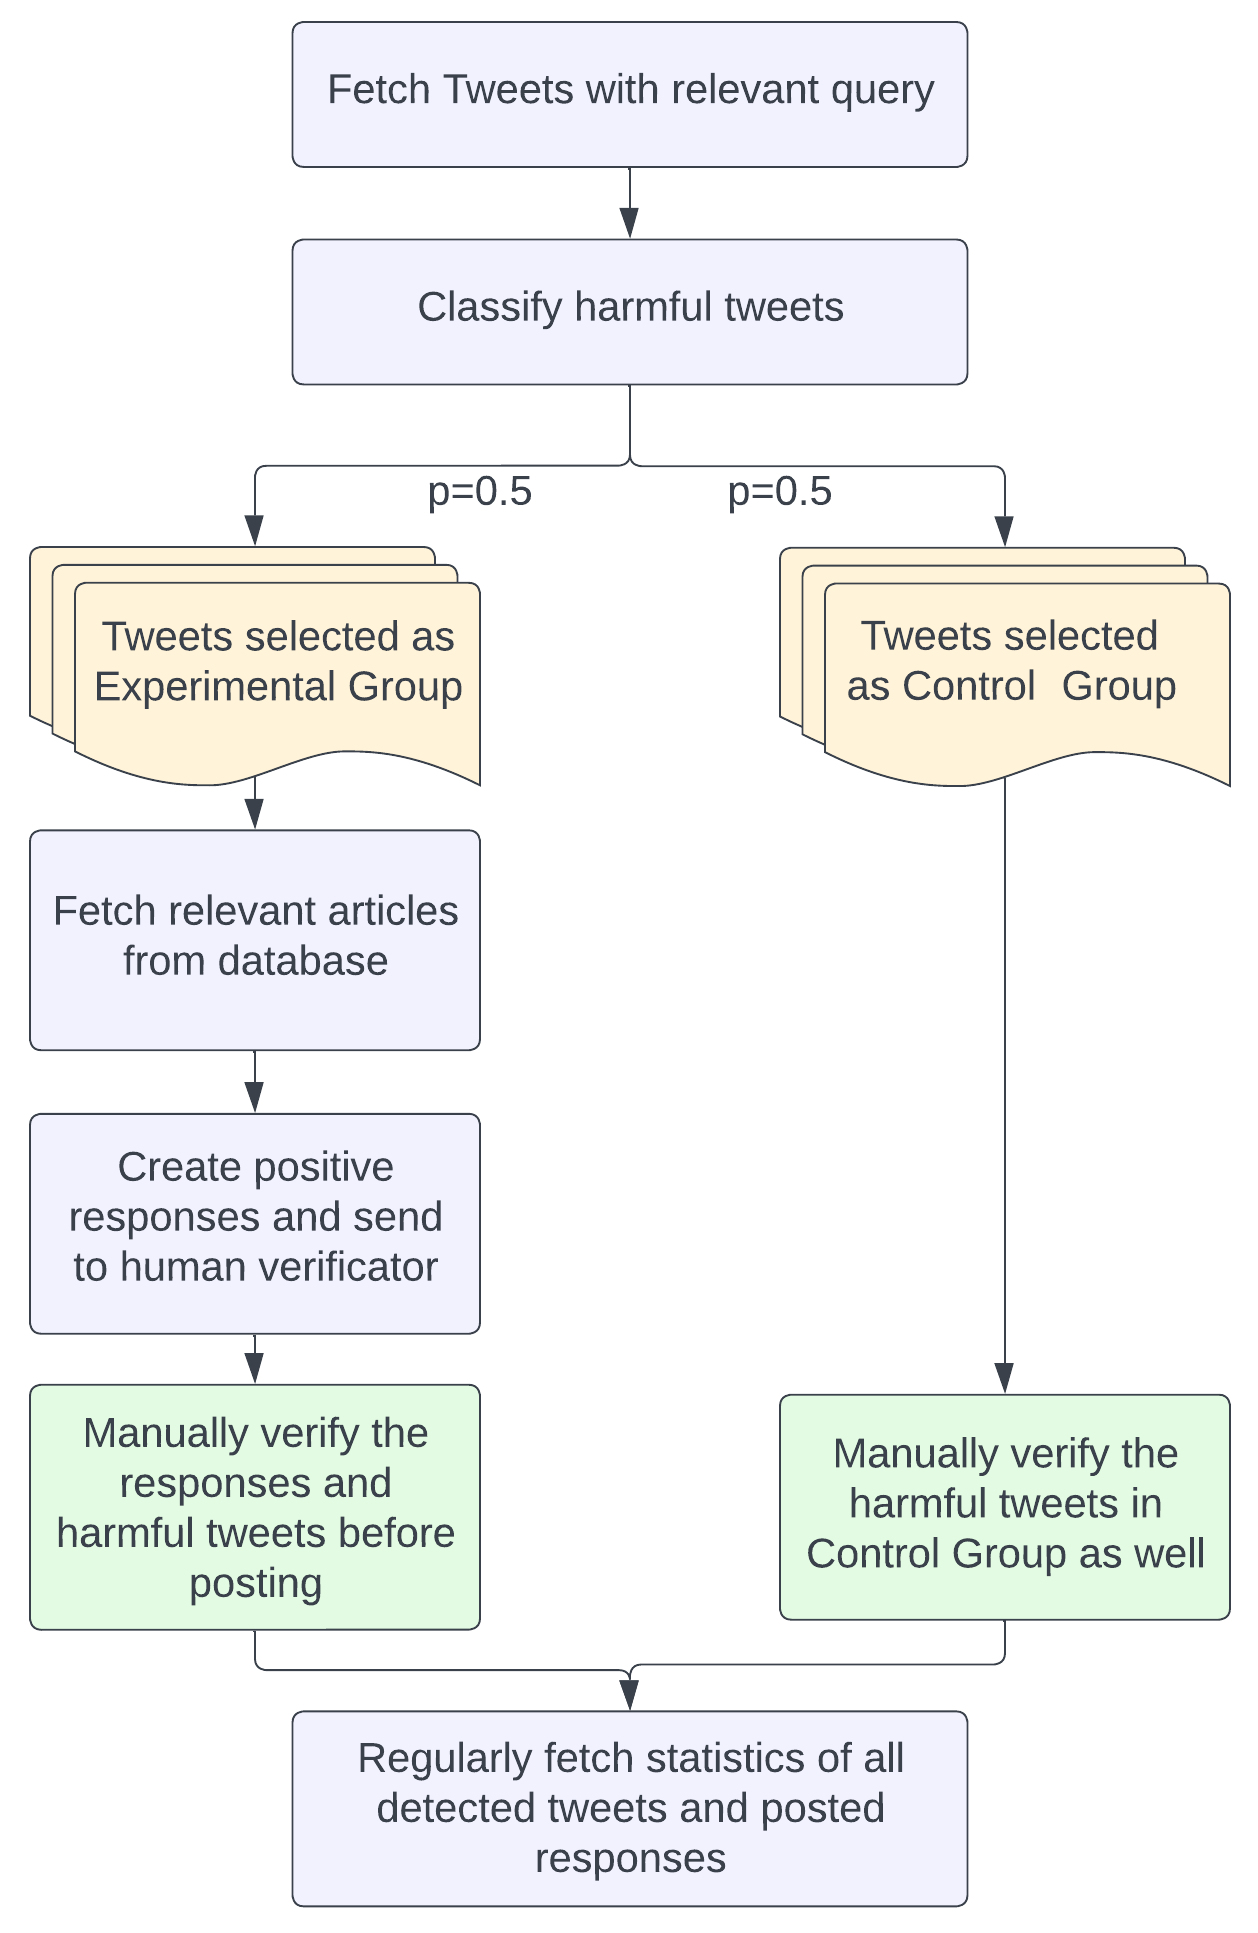
In our experiment, we utilized the previously described hate speech detection and response generation systems. We created a Twitter account for the bot, which is further described in subsection 5.1, and established a process to fetch tweets related to Ukrainian refugees in Poland. These tweets were classified four times a day, at 10 AM, 2 PM, 6 PM, and 10 PM. In order to collect tweets, we utilized the Twitter v2 API, using a query that can be found in Appendix A. We retrieved only tweets posted within the past 4 hours. This enabled us to respond to harmful tweets before they gained their final popularity. The classified responses were then split into the Experimental group and the Control group with equal probability. For the first group, we generated responses with verified knowledge and sent them to a human verifier who had to accept or block them in a 45-minute period. This safety measure was implemented because our system was still prototypical, and we did not want to generate harm during our experiment.
We rejected responses based on the following criteria:
-
•
the original tweet was not harmful (classifier false positive),
-
•
our response itself was controversial (e.g. it could be interpreted as agreeing with the harmful tweet),
-
•
false or unverified information or a hallucinated link was generated in the response.
If the generated tweet was not blocked, it was posted, and in 15 minutes, the first metrics (likes, impressions, replies) about both the harmful tweet and our bot’s reply were fetched. The full process can be seen in figure Figure 2, and further details related to reproducibility, e.g., query to X API, or prompts, can be found in Appendix A and Appendix B. Our detection and intervention pipeline was active from 03/09/2023 to 19/09/2023, and we monitored the data (fetched metrics without posting new replies) for the next six days, from 19/09/2023 to 25/09/2023.
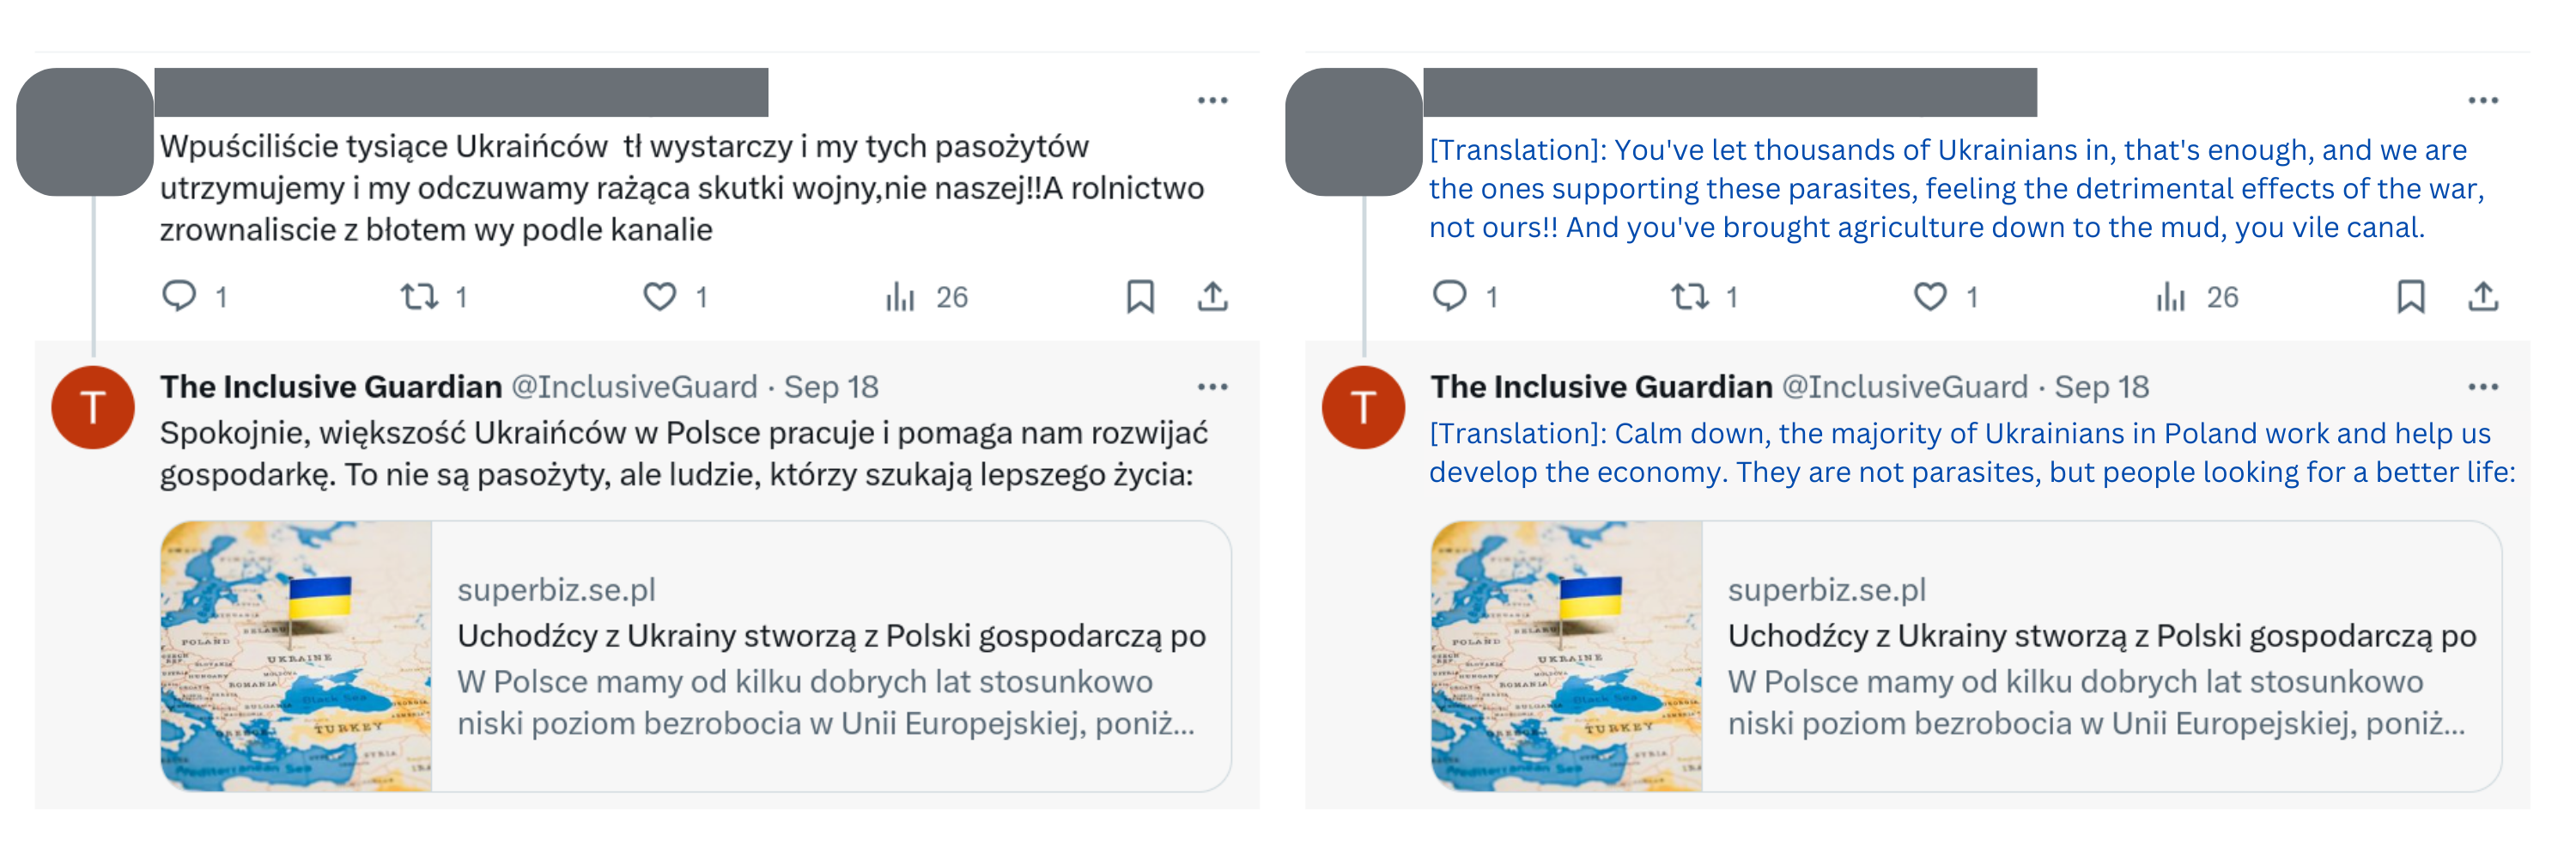
During the responding period, we fetched 61507 tweets from Twitter API related to the conflict in Ukraine, out of which our hate speech model classified 3143 as harmful. Out of this set, we posted successfully (after human verification) 753 replies to harmful tweets. An example of our intervention can be seen in Figure 4. We also collected 1530 tweets as the Control group, which, after manual human verification, resulted in 729 harmful tweets in the Control group. We share the tweet IDs of Experimental and Control tweets, as well as our reply ids 111Tweet IDs after verification: https://tinyurl.com/nhervdfb.
We observe that the hate speech classification model precision is lower than expected (49.6% in the Control group). This is probably because, during the experiment period, many new discussion topics appeared on social media that were not included in the training dataset. The conclusion is that when classifying content on social media, regular re-training and adding more up-to-date knowledge is required. Fortunately, the proposed classifier allows for that, as it trains on new data samples in seconds. This low performance of the classifier resulted in many model replies not being posted, as the human verifier blocked the interventions when the detected tweet was not harmful.
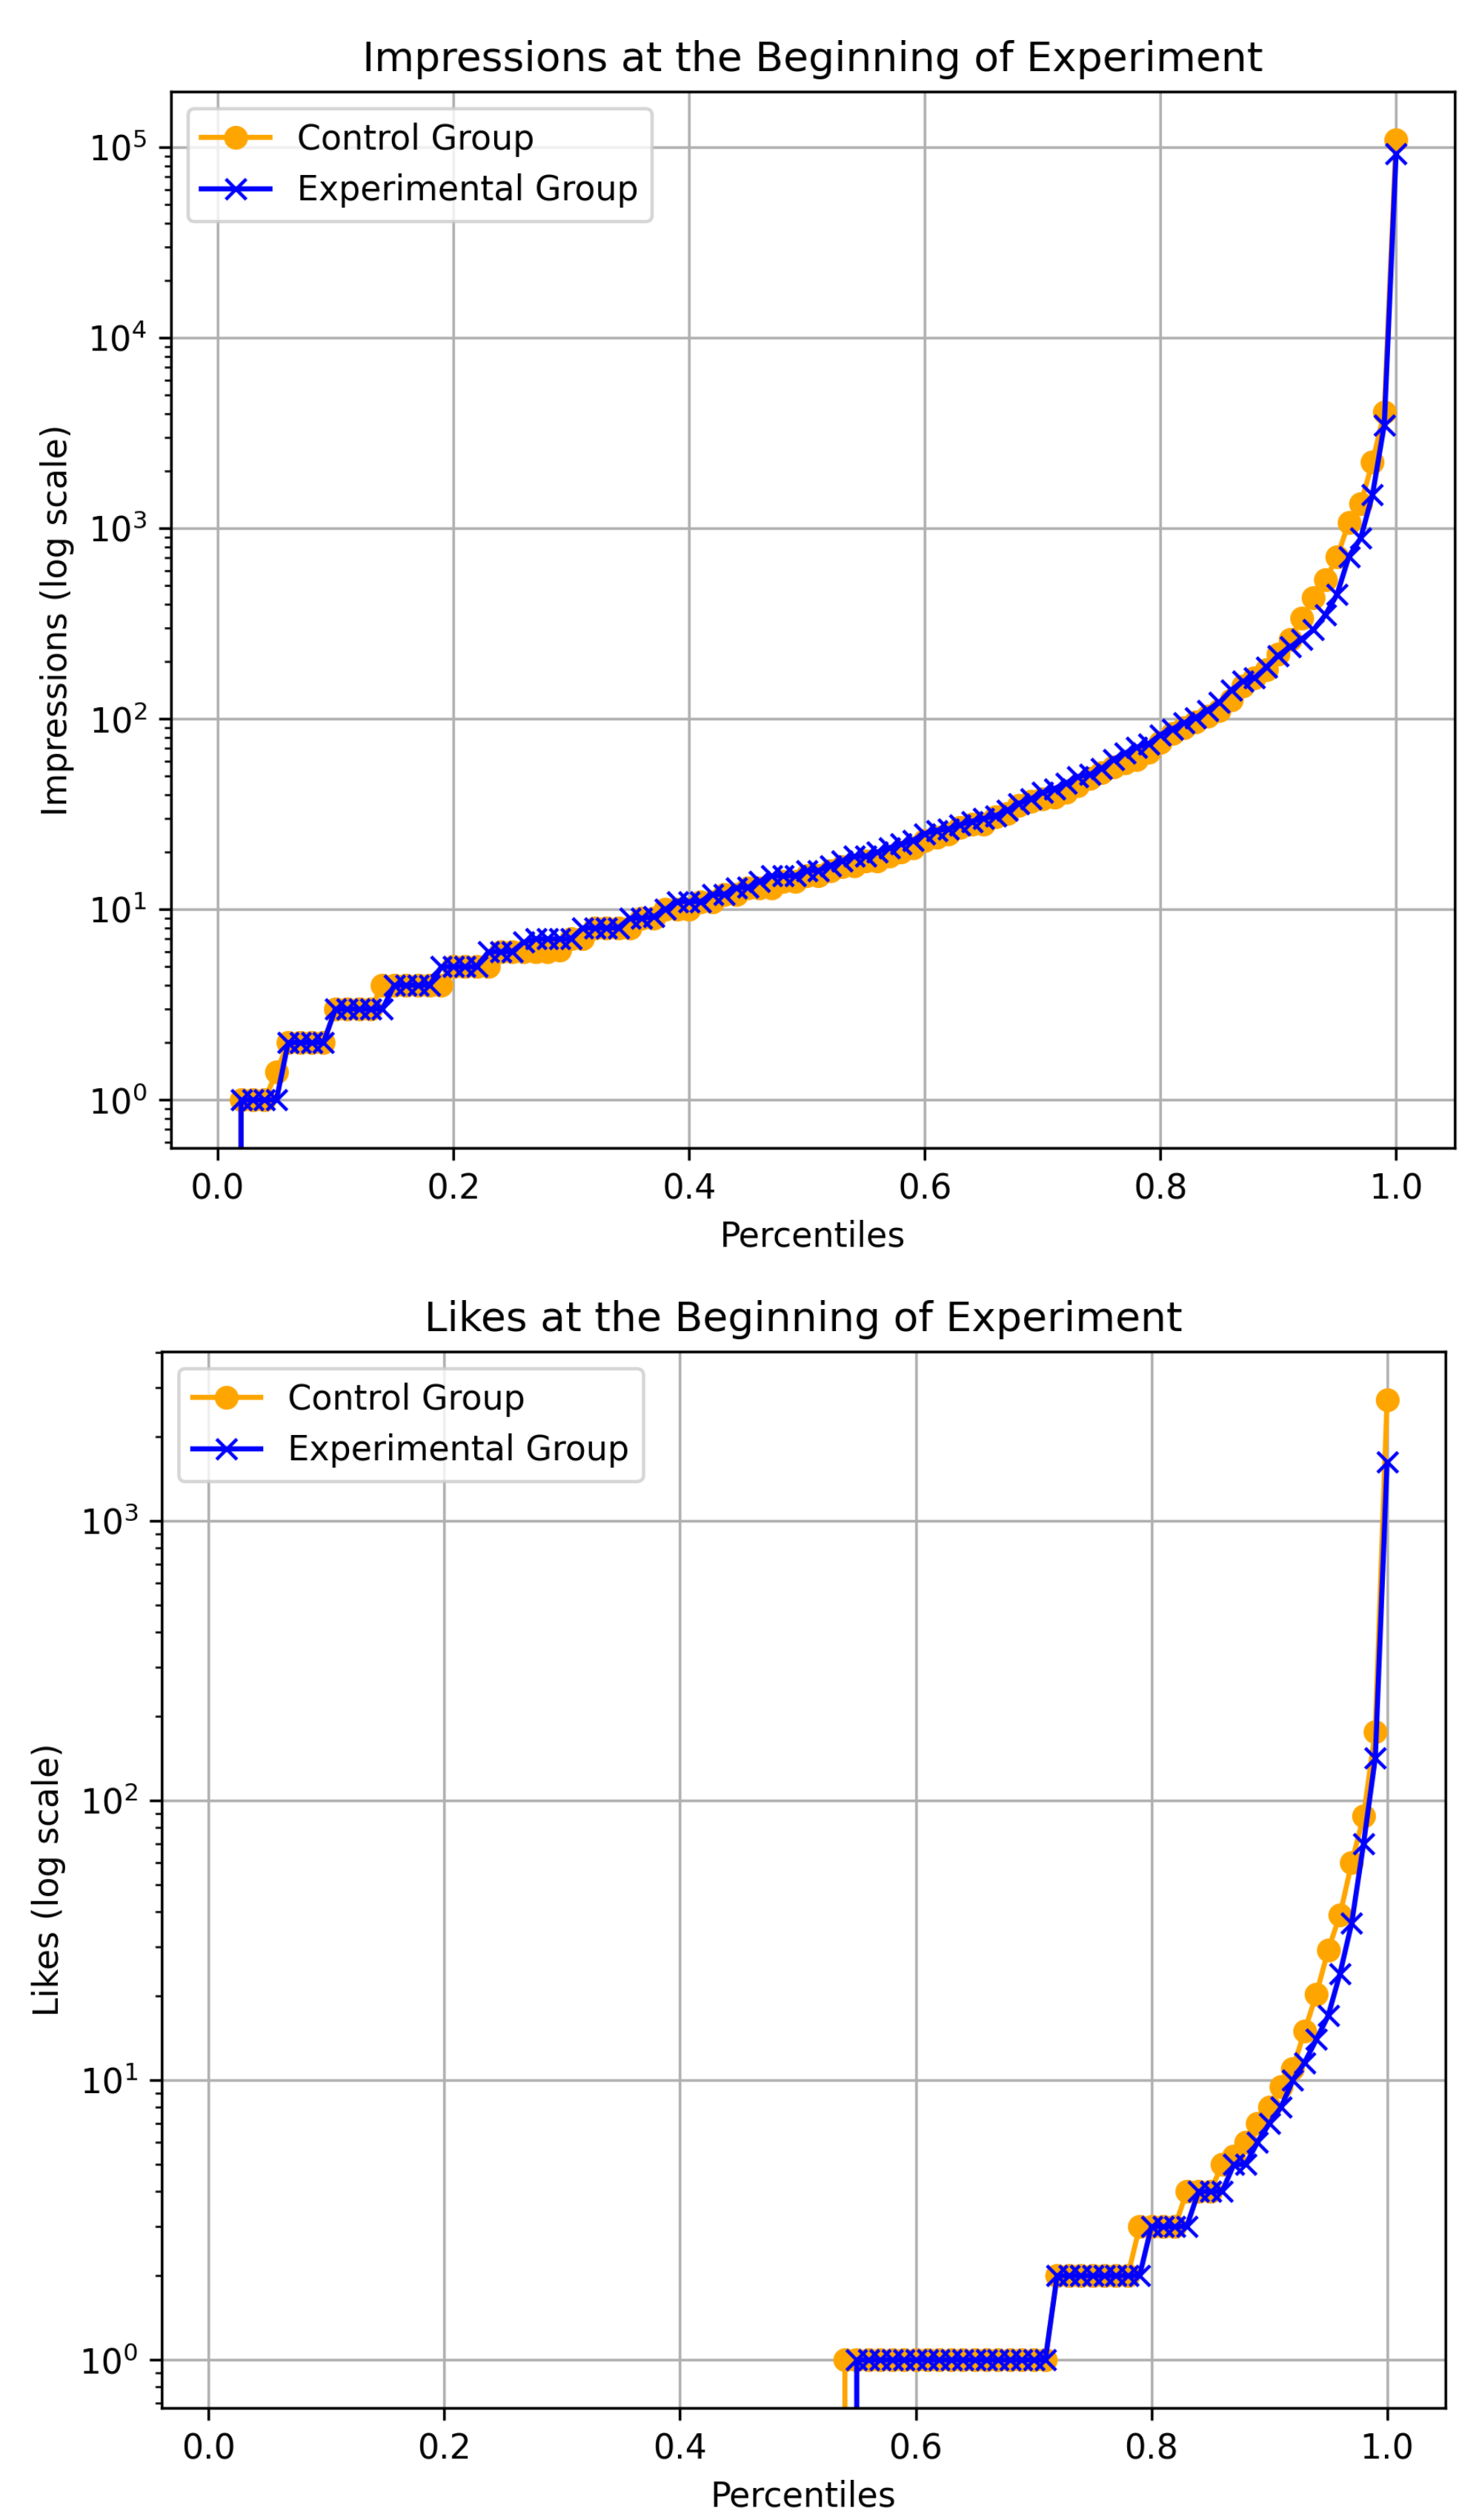
Our replies received 2845 impressions, 35 likes, and 120 replies. This gives around impressions per one posted reply. Our most popular reply (in terms of impressions) received 304 impressions. What is important is that tweets in both the Control and Experimental groups of harmful tweets had nearly identical distributions of likes and impressions right after the detection – see Figure 3. This may prove that the split between the Control and Experimental groups was not biased by any property of the tweets.
5.1. Ethical considerations and X account
Counteracting hate speech has become a social responsibility in the face of the challenges of the information world. The geometric increase in information daily makes it impossible to manage this system manually. Tools to identify and neutralize hate speech seem necessary, especially in places like social media, where regular content quality Control is not performed. A tool that detects manifestations of hate speech and changes the course of the discussion by changing the mind or closing it completely is a response to the challenge of disinformation and discrimination on the Internet. Our system is a step toward creating and improving tools that make the information ecosystem more empathetic and based on real information. X platform encourages researchers to work and create bots to fight hate speech and disinformation.222X policies page: https://help.twitter.com/en/rules-and-policies/x-automation
We informed the Ethics Committee of the major European university accordingly about the details of the experiment, and the experiment was thus performed under their supervision. To ensure our bot does not generate any harm, we manually verified each generated reply before letting the bot post the response. Thus, we ensured no harmful, misleading or impolite content was posted. Everyone interacting with our bot had access to proper information, that this account is indeed a bot, not a human being. The collected data was anonymous, with the only information stored being IDs of tweets, public metrics, and text. All this information is available publicly on X social media platform.
The bot account was named ”The Inclusive Guardian” with the description: ”I’m a bot dedicated to fostering neutral and empathetic discussions on Ukrainian refugees in Poland. Let’s combat hate together and promote a safe space!”.333Bot account: https://twitter.com/InclusiveGuard.
6. Findings
Detected harmful tweets can be the roots of discussions (original tweet) or a reply to another existing tweet (not original tweet). In the next sections, we will validate our hypotheses in both groups as the results differ.
6.1. Engagement change
We hypothesized that our responses reduce users’ engagement with the harmful tweet because, with our fact-checked pro-Ukrainian responses, the harmful content may be less convincing for users.
We measure the engagement of the tweet as the:
Where and is the number of likes and impressions of harmful tweet just after detection and intervention (possible 15-minute delay). The and are the values at the end of the experiment monitoring (6 days after the last detection and intervention).
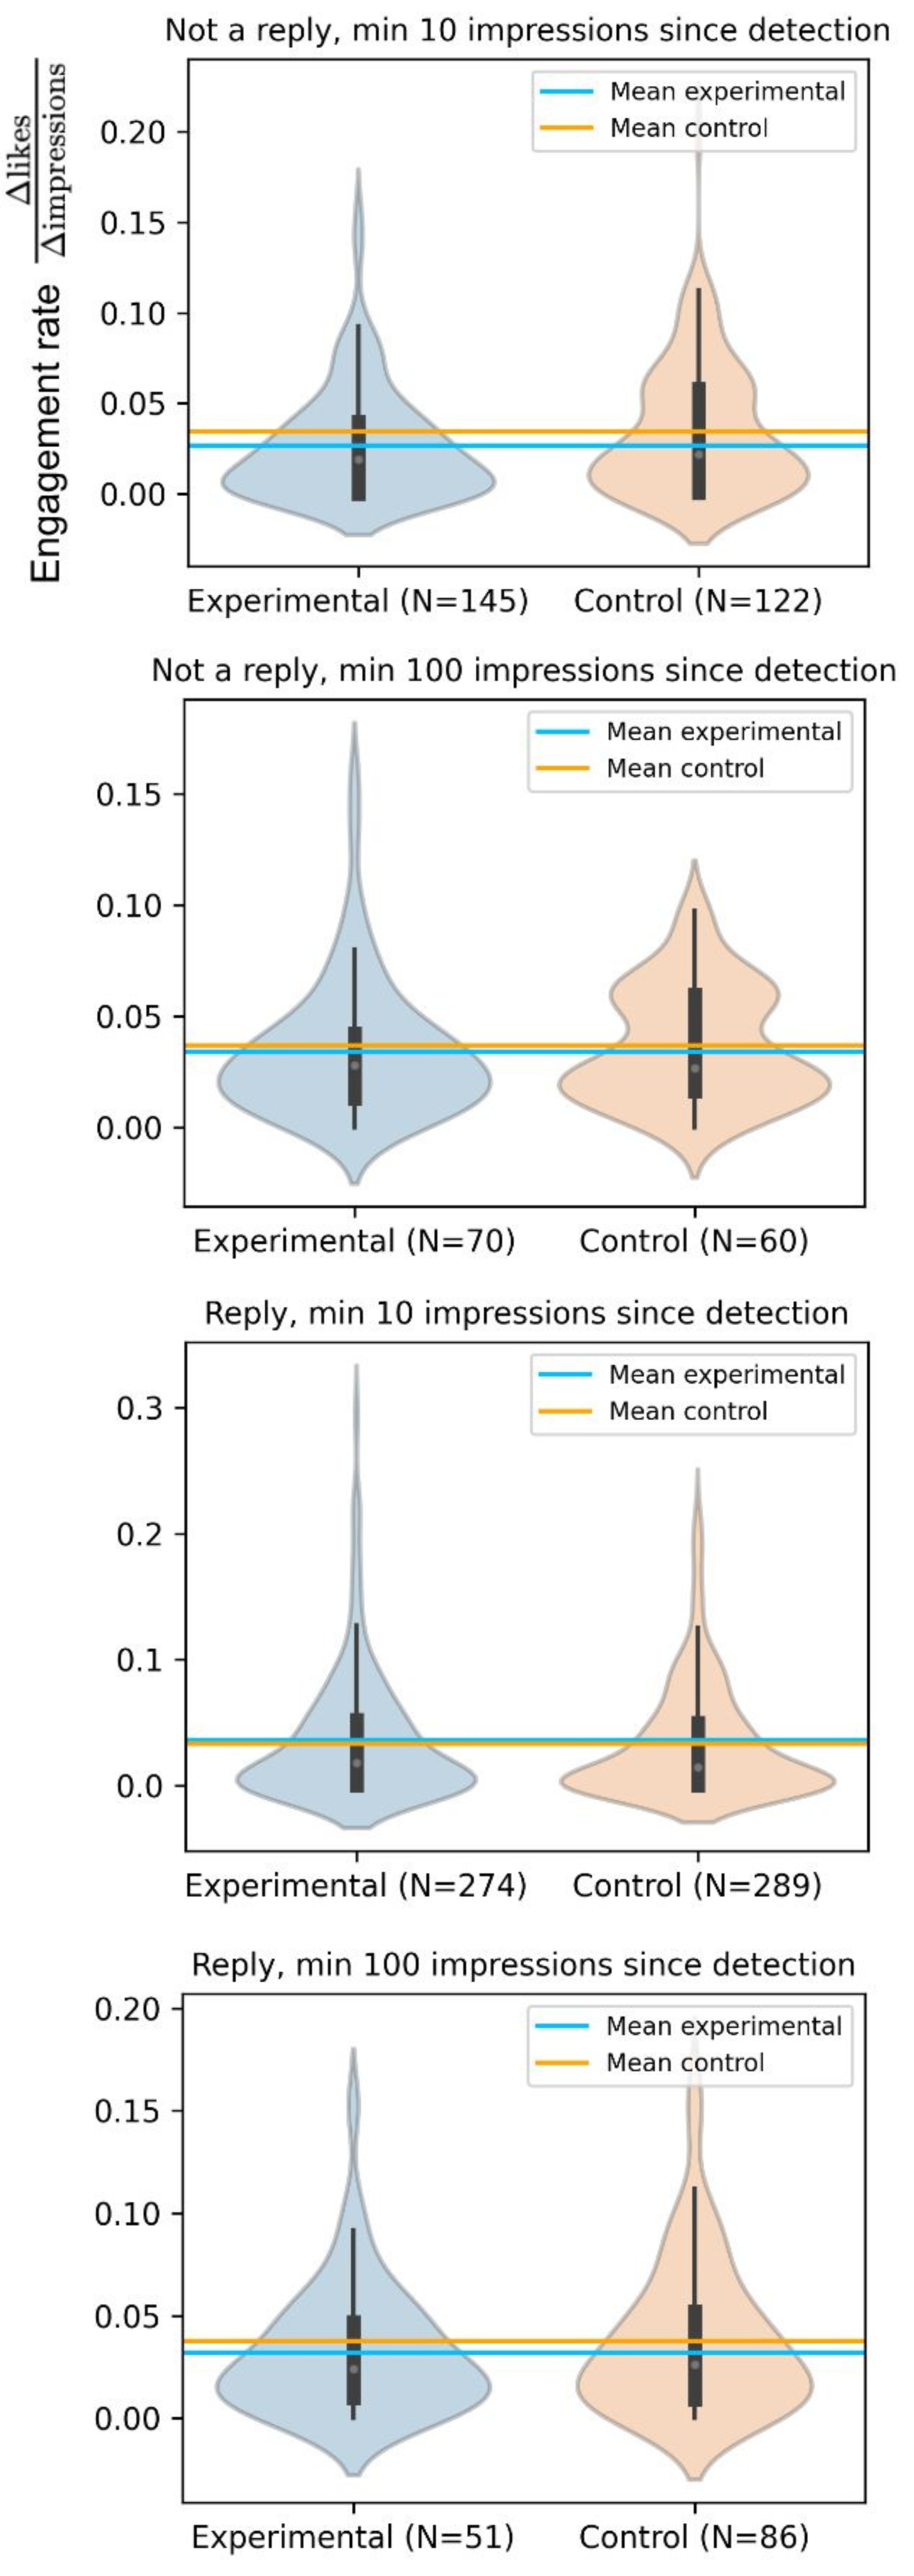
To validate our hypotheses, we want to verify if the mean value is significantly lower in the Experimental group than in the Control group. Furthermore, to correctly calculate the value, we must select the minimum value for the – we check what happens with a minimum threshold equal to and . These four sets can be found visualized in Figure 5. We removed tweets with the anomaly, where the final number of likes is lower than on detection (this happens if someone unliked the post during the experiment period – it is 1% of collected data).
| Set of harmful tweets | Control mean | Experim. mean | Difference (% Control) | p (t-test) | p (Bootstrapped) |
| Not a reply, min 10 impressions | 0.0346 | 0.0266 | -23% | 0.027 | 0.003 |
| Not a reply, min 100 impressions | 0.0365 | 0.0337 | -8% | 0.279 | 0.175 |
| Reply, min 10 impressions | 0.0362 | 0.0331 | +8.3% | 0.775 | 0.865 |
| Reply, min 100 impressions | 0.0379 | 0.0319 | -16% | 0.148 | 0.106 |
| Set of harmful tweets | Control mean | Experim. mean | Difference (% Control) | p (t-test) | p (Bootstrapped) |
| Not a reply, min 10 impressions | 0.00315 | 0.00811 | +58% | 0.00118 | 0.000 |
| Not a reply, min 100 impressions | 0.00263 | 0.00336 | +28% | 0.12343 | 0.011 |
| Reply, min 10 impressions | 0.00276 | 0.01344 | +287% | 1.26e-9 | 0.000 |
| Reply, min 100 impressions | 0.00215 | 0.00302 | +40% | 0.13992 | 0.081 |
We observe that across these four scenarios, in three of them, the mean engagement is lower in the Experimental group Figure 6. Only when we reply to a harmful tweet that is also a reply the mean engagement is slightly larger in the Experimental than in the Control group ( vs ).
The most significant change can be seen when we reply to a harmful, original tweet with a minimum of 10 impressions in the monitoring period - In this group, we reduce the engagement by 23% (from to ). To test the significance, we use the p-value obtained with the t-test. Also, we used the bootstrapping technique to calculate the p-value. To do that, we sampled data samples from the Control group and compared the distribution of their means with our Experimental mean. Welch’s t-test gives a p-value ¡ 0.05, and the bootstrapped p-value is ¡ 0.01, which makes the result statistically significant.
It is worth noting that the lower engagement coefficient can also be a result of an increased number of impressions. This would not be a good result – we want to reduce the engagement of users without increasing the number of impressions of harmful tweets. Indeed, in the Experimental group, the median value ( percentile) of both likes and impressions is lower compared to the Control group (Figure 8).
This significant, positive change is not observed when we respond to non-original tweets with fewer impressions (min 10). This is particularly important due to the cascading arrangement of comment content. A person joining the discussion may not notice entries in the cascades, but they will certainly notice the main comment segment, which will make neutralizing information reach them faster. Activating the bot in main discussions, as replies to original tweets, will, therefore, be more effective in neutralizing the social consequences of hate speech.
| Percentile | Experimental Likes Change | Control Likes Change | Experimental Impressions Change | Control Impressions Change |
| min | 0 | 0 | 10 | 10 |
| 25% | 0 | 0.25 | 27 | 27.25 |
| 50% | 1 | 3 | 78 | 87.5 |
| 75% | 14 | 59 | 606 | 1701 |
| max | 2067 | 2292 | 240651 | 173173 |
6.2. Sentiment analysis
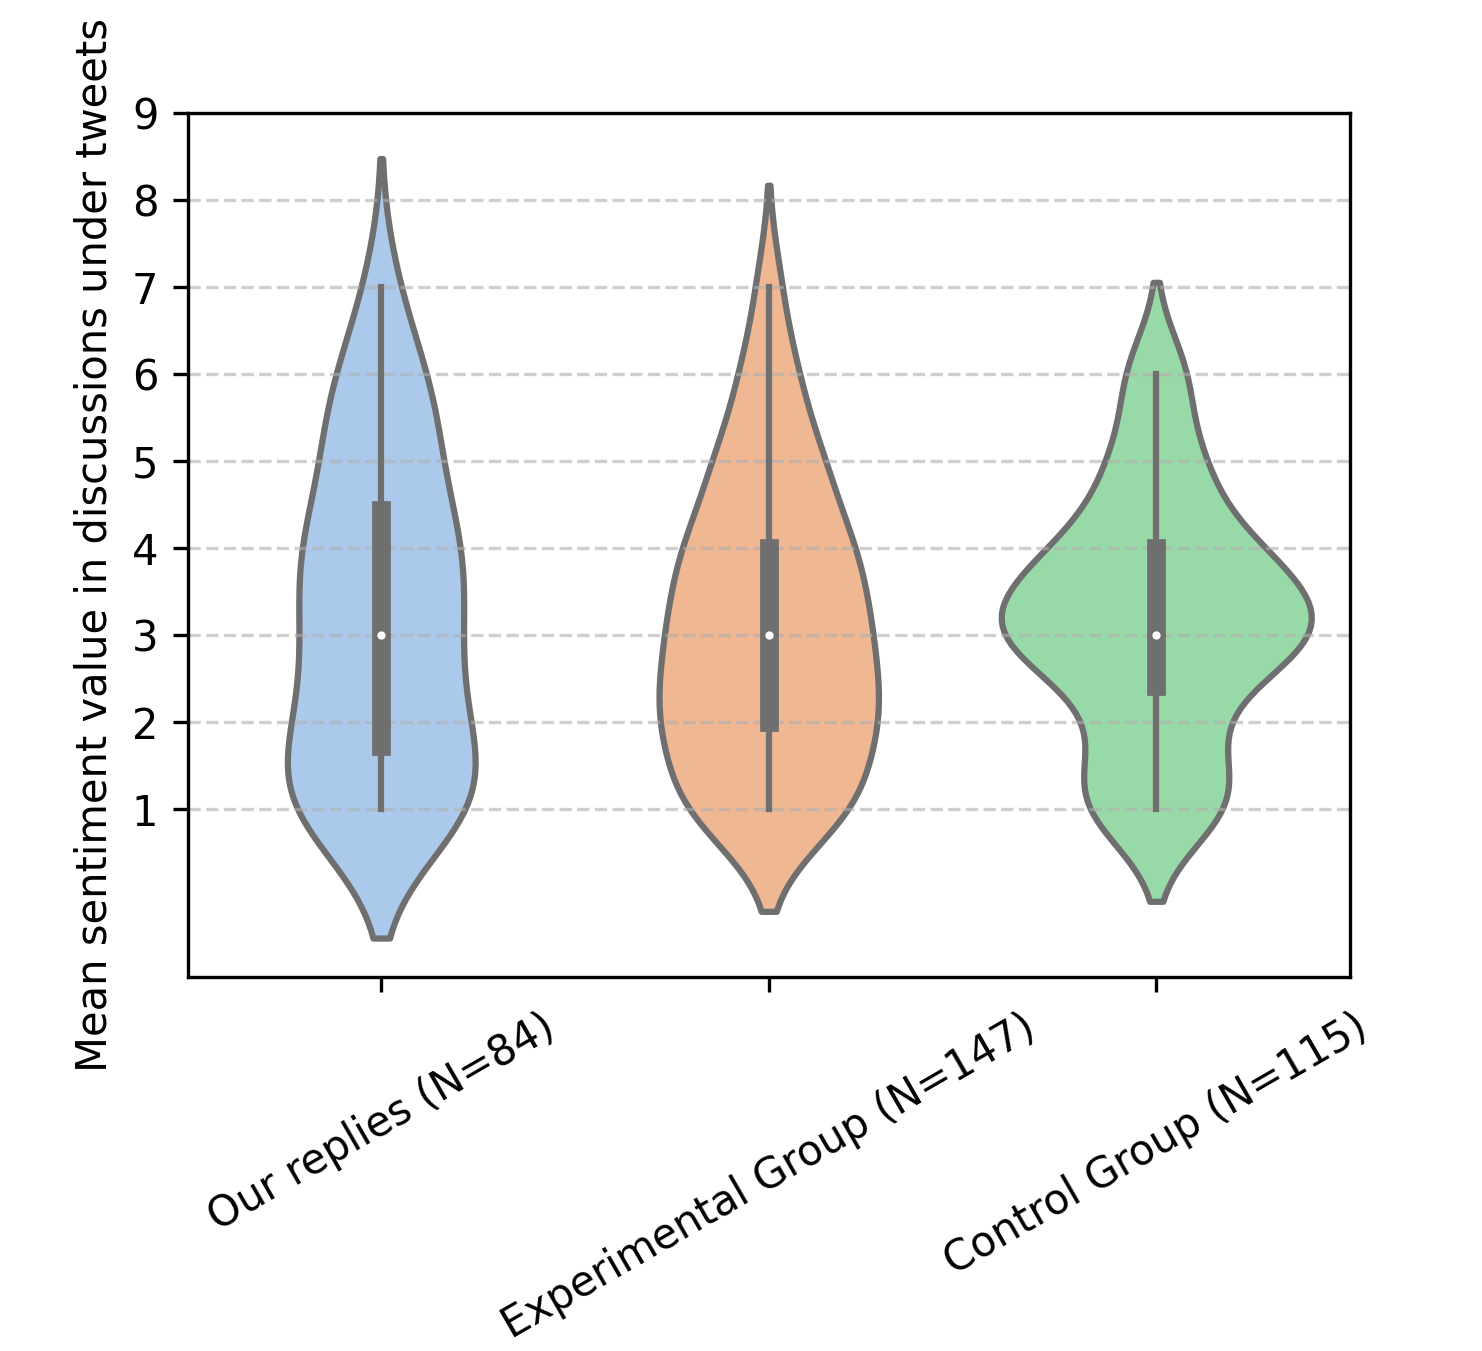
We hypothesized that our responses could increase the sentiment of tweets in the discussion by lowering the arousal and directing the discussion into a more pro-ukraine attitude. To verify that, for each harmful tweet we detected, we want to calculate the mean sentiment of replies (direct and non-direct) posted after the detection. We refer to these replies as ”discussion under a tweet”. By comparing the results in the Control group and the Experimental group, we can see if our intervention changes the sentiment of discussion or not.
In order to perform this study, we fetched the tweets’ texts from conversations in the Control and Experimental groups. Because of the Twitter API limits, we downloaded only about 61 percent of tweets in discussions. More details about reproducibility can be found in the appendix. To analyze sentiment, we decided to compare two methods. The first was to translate our tweets with Google Cloud Translate (from Polish to English) and then use the existing R package sentimetr (Rinker, 2021). However, this resulted in only a 0.3 correlation (Spearman) with the mean of 2 human expert scores on 100 random tweets. This is probably because our tweets are often short, and word-based sentiment analysis methods have too little text to make correct predictions.
To overcome this issue, we used the OpenAI GPT-3.5 model, proven to rate sentiment correctly (Wang et al., 2023b). We provided the GPT-3.5 model with context and example tweets with human ratings and asked to return sentiment on a 1-9 scale. We described the scores 1 to 9 with words (extremely low to extremely high) to make it more suitable for the LLM. The prompt can be found in the appendix. This method yielded a 0.84 correlation with the mean of 2 human expert scores on 100 random tweets.
For calculating the statistic for each detected harmful tweet, we take all the tweets in discussion under these tweets that occurred after our detection and take the mean sentiment of them. This results in having a single value – the mean sentiment of discussion – for each harmful tweet. This approach allows us to be agnostic of the number of replies for each harmful tweet. We removed harmful tweets with 0 new replies during the experiment period. Additionally, we calculate the mean sentiment of discussions under our bot replies. Because of the small number of resulting data points, we did not perform any further data splitting into subgroups to perform analysis.
After calculating statistics, no evidence exists that our replies improve the sentiment; the resulting means are similar: Experimental mean: 3.10 0.26, Control mean: 3.17 0.25. The errors are calculated with 95% confidence intervals. The distribution of mean sentiment values can be found in Figure 9. We see that the Experimental group has more low sentiment and high sentiment values, and the variance of sentiment is higher than in the Control group. This may indicate that our replies break the information bubble, and users start discussing the topic. The exact interpretation of this observation, however, requires further, more detailed studies.
6.3. Change in replies
As a result of further analysis of our data, we discovered that the ratio of the number of replies to a harmful tweet to its impressions is greater among the tweets that our bot interacted with. Similarly, as in the case of engagement, we measure the change in number of replies to the tweet as the:
Where analogously, and is the number of replies and impressions to the tweet after detection and and are the number of replies and impressions at the end of the monitoring. This statistic does not count our bot’s replies, so we measure only the change in other user’s replies.
We compare mean ratios in the Experimental and the Control group by selecting our tweets with respect to minimum impression change and whether a harmful tweet was a reply or not. We also exclude tweets for which the number of replies decreased over a period of the monitoring (users deleted their responses) – it is about of collected data.
In each of the four scenarios, the mean ratio increased. For tweets with a minimum impressions change of 10 the increase is greater than for tweets with a minimum impressions change of 100. And the greatest increase, by is observed when selecting not original tweets with minimum impression change 10.
We also tested the significance using bootstrapping and Welsch’s t-test with the null hypothesis that the mean of the analyzed ratio is equal among groups and the alternative – that it is greater in the Experimental group. The results are presented in the Figure 7. Only when selecting tweets with minimum impression change of 10, the change seem to be significant with zero444That means that every mean ratio of the tweets sampled from the Control group was less than the mean ratio of the Experimental group. p-value by bootstrapping for both original and non-original tweets and Welsch’s t-test p-value 0.0012 for original and 1.26e-9 for not original. For tweets with a minimum impression change of 100, bootstrapping yields a p-value of 0.011 for original tweets and 0.081 for non-original tweets, whereas Welsch’s t-test yields a p-value of 0.123 for original tweets and 0.139 for non-original tweets.
Given that a vast part of our replies initiate a discussion under a tweet, our findings appear to align with the principles of the social proof phenomenon, an idea that people are more likely to engage in action if they see that others have already done so (Kelman, 1958). We proved that at least of our replies to an original tweet with a minimum impression change of 10, and at least of our replies to a non-original tweet with a minimum impression change of 10, were actually the first reply to the tweet. The difference may explain why our experiment increased the mean ratio for non-original tweets more than for original ones.
6.4. Verified links and their impact
In this subsection, we explore other interesting observation regarding the verified links included in the tweets that we found after performing the experiment. The results may serve as an insight for future automatic response generation systems.
Our model was prompted to support its responses with links from our base of verified sources whenever they were applicable to the subject of a tweet it responded to. Out of the 753 responses posted during our experiment, 398 contained a link to one of them. Most of those responses consisted of a short statement that pointed to a fact that contradicted the original post and encouraged to check the source provided through a link at the end of the response. It is possible that in some cases, when the model decided not to put a link to the source, it still utilized the knowledge from the provided text passages.
The knowledge base consisted of government and non-profit sources associated with subjects related to Ukrainians in Poland that were popular on X before the experiment and in its duration. The sources were regularly updated during the experiment based on changing trends and encompassed many categories, such us welfare, taxation, statistical data regarding Ukrainians in Poland, and news on military actions in Ukraine. The main goal of those links was to fight the spread of disinformation and fake news in discussions.
One interesting observation we made is that when we answered to original tweets (non-responses) with a response containing a link to a source, the increase of replies to the tweet was 24% higher than in the case of responses that were not backed by a source. We observed this on the set of tweets with an impression change of at least 10. The results we observed have a t-test p-value ¡ 0.02 and bootstrap p-value ¡ 0.001, which makes this finding even more interesting.
It could be hypothesized that this result has one of many causes: our method of preparation of the knowledge base, the particular topics to which our sources were relevant, or sources more often leading to a social proof phenomenon. It is also important to keep in mind that the model was prompted only to use the sources provided when they were relevant to the topic of the post it was answering, so it is possible that this result is an effect of differences between user behaviors in threads regarding different topics. For example, tweets discussing financial aspects could have received more replies, and also our bot posted more links when intervening with them. This could be a base for further study.
Another observation we made was the lack of impact of links to sources on the changes to engagement (likes over impressions). One of our goals when providing links was to reduce user engagement in threads debunked by a verified source. Harmful tweets for which our bot replied with a link had a similar engagement ratio during the experiment as those for which our bot replied without a link. As before, this could have many causes and needs further research to give definitive results.
7. Conclusions and remarks
This paper proposes an automatic system based on the OpenAI GPT model for detecting hate speech on social media and counteracting it by posting automatically generated responses. The proposed system utilizes verified knowledge through fact-checked articles that the generative model can incorporate into intervention replies. We performed an Experiment in which we focused on Polish tweets regarding the conflict in Ukraine. We showed that harmful tweets that are not a reply have a 23% lower engagement rate (measured as likes over impressions) in the Experimental group compared to the Control group. We find that this effect is not visible when we reply to a non-original tweet, which suggests that automatic moderation systems such as ours perform better when engaged only on the highest level of discussion. The mean sentiment value of tweets posted in discussions during our intervention is very similar to the mean sentiment in the Control group – that means that our automated replies do not change it.
As an interesting result of our analysis, we present an effect of our replies on the ratio of change in replies to a harmful tweet to change in its impressions. We conclude that our replies increase this ratio, and we observe the greatest change for non-original tweets with a minimum impression count 10.
We analyzed the impact of verified links on changes our responses made to the discussion and made a statistically significant observation of a 24% higher increase in the response-to-impression ratio in responses supported by a source compared to those without one. This analysis was purely exploratory, so no concrete conclusions can be derived. However, we believe that further research on it could provide compelling results.
We also discuss the ethical aspects of such experiments and automated moderation systems and believe that this work can help develop better tools and systems for building safer online communities.
8. Acknowledgements
This work was supported by the National Science Center (NCN) grant no. 2020/37/B/ST6/04179 and the ERC CoG grant TUgbOAT no 772346.
References
- (1)
- Ali et al. (2022) Raza Ali, Umar Farooq, Umair Arshad, Waseem Shahzad, and Mirza Omer Beg. 2022. Hate speech detection on Twitter using transfer learning. Computer Speech & Language 74 (2022), 101365. https://doi.org/10.1016/j.csl.2022.101365
- Axelsen et al. (2023) Henrik Axelsen, Johannes Rude Jensen, Sebastian Axelsen, Valdemar Licht, and Omri Ross. 2023. Can AI Moderate Online Communities? arXiv:2306.05122 [cs.CY]
- Badjatiya et al. (2017) Pinkesh Badjatiya, Shashank Gupta, Manish Gupta, and Vasudeva Varma. 2017. Deep Learning for Hate Speech Detection in Tweets. In Proceedings of the 26th International Conference on World Wide Web Companion - WWW '17 Companion. ACM Press. https://doi.org/10.1145/3041021.3054223
- Bojanowski et al. (2016) Piotr Bojanowski, Edouard Grave, Armand Joulin, and Tomas Mikolov. 2016. Enriching Word Vectors with Subword Information. arXiv preprint arXiv:1607.04606 (2016).
- Brown et al. (2020) Tom B. Brown, Benjamin Mann, Nick Ryder, Melanie Subbiah, Jared Kaplan, Prafulla Dhariwal, Arvind Neelakantan, Pranav Shyam, Girish Sastry, Amanda Askell, Sandhini Agarwal, Ariel Herbert-Voss, Gretchen Krueger, Tom Henighan, Rewon Child, Aditya Ramesh, Daniel M. Ziegler, Jeffrey Wu, Clemens Winter, Christopher Hesse, Mark Chen, Eric Sigler, Mateusz Litwin, Scott Gray, Benjamin Chess, Jack Clark, Christopher Berner, Sam McCandlish, Alec Radford, Ilya Sutskever, and Dario Amodei. 2020. Language Models are Few-Shot Learners. arXiv:2005.14165 [cs.CL]
- Dadas (2019) Sławomir Dadas. 2019. A repository of Polish NLP resources. Github. https://github.com/sdadas/polish-nlp-resources/
- Dadas et al. (2020) Sławomir Dadas, Michał Perełkiewicz, and Rafał Poświata. 2020. Pre-training Polish Transformer-based Language Models at Scale. arXiv:2006.04229 [cs.CL]
- Devlin et al. (2019) Jacob Devlin, Ming-Wei Chang, Kenton Lee, and Kristina Toutanova. 2019. BERT: Pre-training of Deep Bidirectional Transformers for Language Understanding. arXiv:1810.04805 [cs.CL]
- Dong et al. (2023) Qingxiu Dong, Lei Li, Damai Dai, Ce Zheng, Zhiyong Wu, Baobao Chang, Xu Sun, Jingjing Xu, Lei Li, and Zhifang Sui. 2023. A Survey on In-context Learning. arXiv:2301.00234 [cs.CL]
- Kelman (1958) Herbert C. Kelman. 1958. Compliance, identification, and internalization three processes of attitude change. Journal of Conflict Resolution 2, 1 (1958), 51–60. https://doi.org/10.1177/002200275800200106 arXiv:https://doi.org/10.1177/002200275800200106
- Khosla et al. (2021) Prannay Khosla, Piotr Teterwak, Chen Wang, Aaron Sarna, Yonglong Tian, Phillip Isola, Aaron Maschinot, Ce Liu, and Dilip Krishnan. 2021. Supervised Contrastive Learning. arXiv:2004.11362 [cs.LG]
- Lee et al. (2019) Jaejun Lee, Raphael Tang, and Jimmy Lin. 2019. What Would Elsa Do? Freezing Layers During Transformer Fine-Tuning. arXiv:1911.03090 [cs.CL]
- Lucy and Bamman (2021) Li Lucy and David Bamman. 2021. Gender and Representation Bias in GPT-3 Generated Stories. In Proceedings of the Third Workshop on Narrative Understanding, Nader Akoury, Faeze Brahman, Snigdha Chaturvedi, Elizabeth Clark, Mohit Iyyer, and Lara J. Martin (Eds.). Association for Computational Linguistics, Virtual, 48–55. https://doi.org/10.18653/v1/2021.nuse-1.5
- Mikolov et al. (2013) Tomas Mikolov, Kai Chen, Greg Corrado, and Jeffrey Dean. 2013. Efficient Estimation of Word Representations in Vector Space. arXiv:1301.3781 [cs.CL]
- Mozafari et al. (2019) Marzieh Mozafari, Reza Farahbakhsh, and Noel Crespi. 2019. A BERT-Based Transfer Learning Approach for Hate Speech Detection in Online Social Media. arXiv:1910.12574 [cs.SI]
- Neelakantan et al. (2022a) Arvind Neelakantan, Tao Xu, Raul Puri, Alec Radford, Jesse Michael Han, Jerry Tworek, Qiming Yuan, Nikolas Tezak, Jong Wook Kim, Chris Hallacy, Johannes Heidecke, Pranav Shyam, Boris Power, Tyna Eloundou Nekoul, Girish Sastry, Gretchen Krueger, David Schnurr, Felipe Petroski Such, Kenny Hsu, Madeleine Thompson, Tabarak Khan, Toki Sherbakov, Joanne Jang, Peter Welinder, and Lilian Weng. 2022a. Text and Code Embeddings by Contrastive Pre-Training. arXiv:2201.10005 [cs.CL]
- Neelakantan et al. (2022b) Arvind Neelakantan, Tao Xu, Raul Puri, Alec Radford, Jesse Michael Han, Jerry Tworek, Qiming Yuan, Nikolas Tezak, Jong Wook Kim, Chris Hallacy, Johannes Heidecke, Pranav Shyam, Boris Power, Tyna Eloundou Nekoul, Girish Sastry, Gretchen Krueger, David Schnurr, Felipe Petroski Such, Kenny Hsu, Madeleine Thompson, Tabarak Khan, Toki Sherbakov, Joanne Jang, Peter Welinder, and Lilian Weng. 2022b. Text and Code Embeddings by Contrastive Pre-Training. arXiv:2201.10005 [cs.CL]
- OpenAI (2023) OpenAI. 2023. GPT-4 Technical Report. arXiv:2303.08774 [cs.CL]
- Pennington et al. (2014) Jeffrey Pennington, Richard Socher, and Christopher Manning. 2014. GloVe: Global Vectors for Word Representation. In Proceedings of the 2014 Conference on Empirical Methods in Natural Language Processing (EMNLP), Alessandro Moschitti, Bo Pang, and Walter Daelemans (Eds.). Association for Computational Linguistics, Doha, Qatar, 1532–1543. https://doi.org/10.3115/v1/D14-1162
- Radford et al. (2019) Alec Radford, Jeff Wu, Rewon Child, David Luan, Dario Amodei, and Ilya Sutskever. 2019. Language Models are Unsupervised Multitask Learners. (2019).
- Rajput et al. (2021) Gaurav Rajput, Narinder Singh Punn, Sanjay Kumar Sonbhadra, and Sonali Agarwal. 2021. Hate Speech Detection Using Static BERT Embeddings. In Big Data Analytics. Springer International Publishing, 67–77. https://doi.org/10.1007/978-3-030-93620-4_6
- Rinker (2021) Tyler W. Rinker. 2021. sentimentr: Calculate Text Polarity Sentiment. Buffalo, New York. https://github.com/trinker/sentimentr version 2.9.0.
- Shah and Singh (2023) Seyed Muzaffar Ahmad Shah and Satwinder Singh. 2023. Hate Speech and Offensive Language Detection in Twitter Data Using Machine Learning Classifiers. In Innovations in Computer Science and Engineering, H. S. Saini, Rishi Sayal, A. Govardhan, and Rajkumar Buyya (Eds.). Springer Nature Singapore, Singapore, 221–237.
- Tida and Hsu (2022) Vijay Srinivas Tida and Sonya Hsu. 2022. Universal Spam Detection using Transfer Learning of BERT Model. arXiv:2202.03480 [cs.CL]
- Twitter (2023) Twitter. 2023. DSA Transparency Raport. https://transparency.twitter.com/dsa-transparency-report.html#/
- Vaswani et al. (2023) Ashish Vaswani, Noam Shazeer, Niki Parmar, Jakob Uszkoreit, Llion Jones, Aidan N. Gomez, Lukasz Kaiser, and Illia Polosukhin. 2023. Attention Is All You Need. arXiv:1706.03762 [cs.CL]
- Wang et al. (2023a) Han Wang, Ming Shan Hee, Md Rabiul Awal, Kenny Tsu Wei Choo, and Roy Ka-Wei Lee. 2023a. Evaluating GPT-3 Generated Explanations for Hateful Content Moderation. arXiv:2305.17680 [cs.CL]
- Wang et al. (2023b) Zengzhi Wang, Qiming Xie, Zixiang Ding, Yi Feng, and Rui Xia. 2023b. Is ChatGPT a Good Sentiment Analyzer? A Preliminary Study. arXiv:2304.04339 [cs.CL]
- Watanabe et al. (2018) Hajime Watanabe, Mondher Bouazizi, and Tomoaki Ohtsuki. 2018. Hate Speech on Twitter: A Pragmatic Approach to Collect Hateful and Offensive Expressions and Perform Hate Speech Detection. IEEE Access 6 (2018), 13825–13835. https://doi.org/10.1109/ACCESS.2018.2806394
- Zhang et al. (2023) Yue Zhang, Yafu Li, Leyang Cui, Deng Cai, Lemao Liu, Tingchen Fu, Xinting Huang, Enbo Zhao, Yu Zhang, Yulong Chen, Longyue Wang, Anh Tuan Luu, Wei Bi, Freda Shi, and Shuming Shi. 2023. Siren’s Song in the AI Ocean: A Survey on Hallucination in Large Language Models. arXiv:2309.01219 [cs.CL]
- Zhuang et al. (2020) Fuzhen Zhuang, Zhiyuan Qi, Keyu Duan, Dongbo Xi, Yongchun Zhu, Hengshu Zhu, Hui Xiong, and Qing He. 2020. A Comprehensive Survey on Transfer Learning. arXiv:1911.02685 [cs.LG]
Appendix A Reproducibility
In this section, we describe additional technical details which may be useful to reproduce obtained results.
Harmful tweets fetching
In order to fetch harmful tweets, we used elevated access to X v2 API and ‘GET /2/tweets/search/recent‘ endpoint through Tweepy python library. To construct the API query, we used a list of words, and hashtags that can be seen in Figure 10. There is also the extra language mark ”lang:pl” to ensure we fetch only tweets in Polish.
’(ukraina OR ukraiński OR ukraińcy OR ukraińców OR ukraińca OR bandera OR banderowcy OR banderowscy OR upadlina OR upadlińscy OR ukropol OR ukropolin OR wołyń OR wołyński OR wołyńskie OR ukrainizacja OR ukrainizacji OR ukrainizację OR przebywający OR pomoc OR dzicz OR ukry OR ukrowie OR przywileje OR dziczy OR wynocha OR pobór OR dezerter OR #StopUkrainizacjiPolski OR #ToNieNaszaWojna OR #StopUkroPol OR #StopbanderyzacjiPolski OR #żebyPolskabyłapolska) -is:retweet lang:pl’
Tweets classification
In order to classify tweets, we used the ‘text-embedding-ada-002‘ embedding model offered by OpenAI API and the logistic regression model from the scikit-learn package. We calibrated the model using ‘sklearn.calibration.CalibratedClassifierCV‘ to compensate for the unbalance of training classes.
Response generation and verified links
Links to verified articles and their text were stored in the online sheet tool, which allowed for the quick addition of new articles. The articles were fetched each time the responses were generated, and relevant ones were included in the system prompt of the generative model. As a generative model, we’ve chosen the ‘gpt-4‘ model accessed through OpenAI API. The prompt used to generate the responses is shown in the section below.
Statistics and metrics of tweets
In order to fetch statistics of harmful tweets and our replies, we used the ‘GET /2/tweets‘ endpoint of Twitter v2 API. To fetch additional data like tweets in discussions that are not detected harmful tweets (e.g., for sentiment analysis), we used a 3rd party, publicly available scraper. This allowed us to obtain the tree structure of the conversations we monitored and correctly join the parent tweets with the children’s tweets. Unfortunately, due to the technical limitations of the tool, we have not been able to fetch all discussions. Having the number of tweets from the Experimental and Control group and the number of replies for tweets in discussions, we estimate to have fetched only about 61% of the tweets in discussions.
Appendix B Used Prompts
Jesteś pomocnym analitykiem danych dotyczących polaryzacji w Social Media. Twoim zadaniem jest określenie sentymentu w podanych twittach pochodzących z sieci Twitter. Będą one pochodziły z dyskusji dotyczących trwającej wojny na Ukrainie i czy powinniśmy jako Polska ją wspie rać. Mogą też dotyczyć krytyki postępowania rządu, lub zachęcać do pomocy. Oceniając tweety, sugeruj się wcześniej nadanymi ocenami jako punkt odniesienia. Zwróć wartości w postaci list słowników Python, w tej samej kolejności co podane Tweety. Możliwe wartości sentymentu:1 - ekstremalnie negatywny 2 - bardzo negatywny 3 - negatywny 4 - raczej negatywny 5 - nuetralny 6 - raczej pozytywny 7 - pozytywny 8 - bardzo pozytywny 9 - ekstremalnie pozytywny
+ 5 examples of tweets and target sentiment
Jest lipiec 2023. Nie jesteś modelem językowym. Jesteś użytkownikiem Twittera, Polakiem w wieku około 20-30 lat który wyznaje humanitarne wartości i uważa że warto pomagać innym. Twoim zadaniem jest rozmowa na Twitterze i walka z nienawistnymi bądź fałszywymi treściami propagowanymi przez innych użytkowników. Używaj przy tym luźnego języka typowego dla mediów społecznościowych (social media). Długość tekstu nie powinna przekraczać 200 znaków, czyli około 60 słów. Postaraj się przytaczać w argumentacji wymienione poniżej artykuły i linki do nich. — PODSTAWOWA WIEDZA Z WIKIPEDII — W lutym 2022 roku Ukraina została zaatakowana przez Federację Rosyjską. Pierwsze dni konfliktu nie przyniosły Rosjanom spektakularnych sukcesów, za to w ogromnym stopniu zjednoczyły Ukraińców w oporze przeciw najeźdźcom, natomiast opinię publiczną większości państw świata włączając w to rządy i organizacje międzynarodowe, w proteście przeciw inwazji. Wobec Rosji zostały wdrożone znaczące sankcje gospodarcze a oprócz nich także działania symboliczne, m.in. wykluczenie rosyjskich reprezentacji z ważnych sportowych imprez międzynarodowych. Natomiast Ukraina otrzymała pomoc, włączając w to zarówno wsparcie humanitarne jak i wojskowe. — DODATKOWA ZWERYFIKOWANA WIEDZA — Źródło informacji (możesz umieścić link do tego serwisu w swojej odpowiedzi, ale nie używaj formatowania linku z nawiasami kwadratowymi):
verified articles texts and links
+ 2 examples of tweets and positive responses