Tracking a Year of Polarized Twitter Discourse on Abortion
Abstract
Abortion is one of the most contentious issues in American politics. The Dobbs v. Jackson Women’s Health Organization ruling in 2022, which shifted the authority to regulate abortion from the federal government to the states, triggering intense protests and emotional debates across the nation. Yet, little is known about how online discourse about abortion rights fluctuated on social media platforms. This study analyzes a corpus of over 57M abortion-related tweets from January 2022 to January 2023 to show how emotions, hateful rhetoric, toxic speech, use of obscenities and insults, and also framing strategies fluctuated over the span of one year among liberal and conservative users. We offer three key findings. (1) Fluctuations in emotions were temporary; key events during the analyzed period did not bring about lasting shifts in expressed emotions. (2) We observe significant ideological differences in the use of hate speech: conservatives resorted to hateful rhetoric more than liberals. Yet, liberals were especially likely to use obscenities and insults, especially on the days the ruling was leaked and after the Dobbs decision. In turn, toxic language sharply increased among both groups following the leak and after the SCOTUS ruling. (3) Conservatives employ religious and fetal personhood frames, while liberals emphasize women’s health and bodily autonomy, with each group reacting negatively to the other group’s frames. Our results offer an in-depth insight into the dynamics of online discourse on one of the most contentious issues in contemporary America.
Keywords Abortion Twitter Emotions Hate speech Toxicity
1 Introduction
Abortion remains one of the most contentious, divisive, and emotionally charged issues in American society. Survey data suggest that Democrats and Republicans have grown increasingly polarized on abortion rights Saad (2010a, b); DiMaggio et al. (1996); Evans (2003), disagreeing on its morality and the circumstances in which it should be legal Brenan (2010). In addition, violence against abortion providers and patients rose by a staggering in the past few years NAF (2022). Polarization further increased in the aftermath of the historic ruling in Dobbs v. Jackson Women’s Health Organization on June 24, 2022. The United States Supreme Court struck down federal protections made available in Roe v. Wade (1973) and Casey v. Planned Parenthood (1992) and transferred power to regulate it to the states. As a result, women across the U.S. lost the constitutional right to abortion. When delivering the opinion of the court, Justice Samuel Alito noted that abortion presents a profound moral issue on which Americans hold sharply contrasting views SCOTUS (2022).
The leaked draft of the Supreme Court’s decision on May 2, 2022, ignited passions on both sides. Activists took to the streets and online platforms with slogans like “Bans Off Our Bodies” and “Equal Rights for the Unborn,” reflecting the emotionally charged mood of a deeply divided populace. Despite the availability of online behavioral data and the fact that it can offer unprecedented insights into the fluctuations in public opinion, we know relatively little about how online discussions and collective emotions in the abortion rights debate evolved, especially after the overturning of Roe v. Wade. Several pivotal questions remain unexplored: How did public emotions fluctuate in response to external events? How did the tone of discussions change: did they remain civil or did they devolve into toxicity and hate? Were there discernible variations in these online expressions based on ideological stances? How did conservatives and liberals frame the discourse on abortion access, especially across blue and red states? How did each group react to the frames used by the other? These questions are central to our understanding of the nuanced expressions surrounding abortion and the specific context of Roe v. Wade’s reversal.
To fill these gaps in knowledge, we collect and analyze a corpus of over 57M tweets related to abortion over the span of one year (January 2022 to January 2023) from over 5.5M users. The large volume of messages about abortion coupled with advances in natural language processing and quantitative text analysis enable us to characterize public opinion expressions at scale. We estimate users’ ideology based on their URL sharing behaviors Rao et al. (2021); Cinelli et al. (2021) (SI Appendix 44.1) and rely on state-of-the-art transformer-based classifiers to identify emotions, hateful and toxic speech, insults and obscenities expressed in the tweets (see SI Appendix 44.3.2,44.3.3,44.3.4). We show the fluctuations in these expressions and also use interrupted time series to quantify the immediate effects of key events on emotions, hateful and toxic speech, insults, and obscenities by users’ ideology. Lastly, relying on linguistic analysis techniques (see Methods and SI Section 4.5), we extract five prominent frames utilized by liberals and conservatives in their discussions of abortion, including religious justifications, opinions on bodily autonomy, considerations for women’s health, allowance for exceptions, and the assertion of fetal personhood. Using geolocation inference, we highlight geographic differences in activity with respect to these five frames and contrast the emotions of liberals and conservatives in these discussions.
We use these extensive and granular social media data to address the following research questions: (1) How did emotions, hateful rhetoric, toxic speech, insults, and obscenities in tweets about abortion vary over time among liberals and conservatives? (2) Were there ideological asymmetries in the use of emotions, hate speech, toxic language, obscenities, and insults in response to key events within the abortion rights debate (i.e., the leak, the official Dobbs ruling, the Kansas referendum, and the U.S. midterm elections)? (3) What were the prominent frames employed by liberals and conservatives when discussing abortion rights, and were there variations in emotions and by geographical location in these frames?
Public behavioral data collected from social media platforms, coupled with advanced linguistic analysis tools, provide researchers a novel avenue to study public opinion and individual expressions at granular level and over-time. Such data offer several advantages over survey-based measurements, allowing researchers to assess individual political leanings and issue stances without biases inherent in survey self-reports, especially on contentious political issues (e.g., social desirability bias). Large-scale social media datasets are used to analyze protest mobilization Breuer et al. (2015); Steinert-Threlkeld (2017); Munn (2021), misinformation spread Nikolov et al. (2020); Rao et al. (2021); Chen et al. (2021), moral attitudes Guo et al. (2022); Priniski et al. (2021), echo chambers and ideological biases on platforms Barberá (2015); Wojcieszak et al. (2022), among other phenomena. Social media data are also used to examine how online discourse reflects and shapes societal debates about controversial topics Yardi and Boyd (2010); Garimella et al. (2018); Cinelli et al. (2021), including abortion, finding that those debates on social media are deeply polarized with distinctive textual and psycho-linguistic cues Sharma et al. (2017). The analysis of large-scale social media data at pivotal points like the COVID-19 pandemic Huang et al. (2020); Chen et al. (2020), 2020 US Presidential elections Chen et al. (2022); Abilov et al. (2021), or the Russian invasion of Ukraine Chen and Ferrara (2022) helps researchers capture the pulse of an increasingly volatile world. In this project, we contribute to this research, capturing another pivotal point in the American history, the overturn of Roe vs. Wade.
We offer several key findings. First, fluctuations in anger, anxiety, sadness, and joy were temporary; key events during the analyzed twelve months (e.g., the leak, the Supreme Court decision, the midterm elections) did not bring about lasting emotional shifts in online discourse among liberals and conservatives. Instead, emotions oscillated, reflecting the collective mood of each group, and reverted to the baseline shortly after. We observe significant ideological differences in the use of hate speech: conservatives resorted to hateful rhetoric more than liberals. Yet, liberals were especially likely to use obscenities and insults, especially on the days the ruling was leaked and after the Dobbs decision. In turn, toxic language sharply increased among both groups following the leak and especially after the SCOTUS ruling. Third, we shed light on how liberals and conservatives frame their online discussions about abortion. Conservatives employ religious and fetal personhood frames, while liberals emphasize women’s health and bodily autonomy. Furthermore, the frames favored by one side provoke strong negative reactions from the other: liberals express more anger and toxicity when discussing religion, while conservatives use more toxic language and hate speech when addressing women’s health. The increased expression of anger, fear, and toxic rhetoric among liberals regarding frames central to conservative abortion discourse, paralleled by a corresponding increase in negative emotions among conservatives when addressing issues pivotal to liberal discourse underscores the stark divisions between these two ideological groups. Although these patterns may be expected, ours is the first study to show key fluctuations in abortion discourse using online behavioral data from millions of partisan Twitter users in the United States.
Our study sheds light on how the polarized abortion debate post Dobbs is shaping the US political landscape. We find that key events elicit distinct emotional responses from ideological groups, and frames that resonate with one side often trigger strong negative reactions from the other, highlighting the polarization inherent in this contentious issue. Through the lens of social media data, we capture a pivotal moment in American history–—the overturning of Roe v. Wade–—offering valuable insights into the evolving landscape of public opinion and political discourse in the digital age. Our research contributes to the broader understanding of how online discussions reflect and influence societal debates on complex and divisive topics.
2 Data and Methods
Data
In this study, we leverage the large-scale Twitter dataset we collected Chang et al. (2023), comprising of tweets about abortion rights between January 1, 2022 to January 6, 2023. Relying on a carefully curated list of keywords and hashtags that reflect both sides of the abortion rights debate in the United States, Chang et al. (2023) identifies over tweets generated by users. Given that this dataset predates both Politico’s leak of SCOTUS’s draft judgment on May 3, 2022 and SCOTUS’s June 24,2022 official ruling in Dobbs vs Jackson Women’s Health Organization, makes possible the analysis of assessing the impact of both these events.
In order to identify tweets generated from within the United States and also to identify the location of the users (whether in red or blue state), we utilize Carmen Dredze et al. (2013), a geo-location inference technique that relies solely on tweet metadata. This includes the “place” and “coordinates” objects that encode location information, such as country, city, and geographic coordinates. Additionally, the technique also relies on mentions of locations in a user’s bio on Twitter to infer their location. A manual review confirmed that this approach was effective in identifying a user’s home state. As a result, we were left with roughly tweets generated by users in the United States. Additional statistics about the per-state activity are available under the SI Appendix 4.2.
We leverage state-of-the-art statistical inference techniques and transformer based language models to infer at the user level - ideology (liberal or conservative) and – at the tweet level – basic emotions Plutchik (1980) expressed - anger, fear, sadness, and joy, hate and toxic speech, obscenities and insults.
User Ideology
Extensive work estimates ideology using social media data. Previous studies have relied on hashtags Conover et al. (2011), following relationships, network interactions Barberá (2015); Badawy et al. (2018), and URL sharing behaviors Le et al. (2019); Nikolov et al. (2020); Cinelli et al. (2021); Rao et al. (2021). In this study, we rely on the method discussed in Rao et al. (2021) to quantify ideology at the user level. This method works by first computing the weighted average of ideological leanings of the URLs users share. The scores are then used to train a linear classifier with embeddings of users’ tweets obtained from a pretrained fastText embedding model Pagliardini et al. (2018) as features. The trained linear classifier is then used to estimate ideological leaning, liberal or conservative for all users in our dataset. Refer to the SI Appendix 44.1 for a detailed description of the approach.
Inferring Geolocation
In order to identify locations of tweets, we used Carmen Dredze et al. (2013), a geolocation inference tool. Carmen harnesses a multitude of signals within the tweet object to carry out this inference process. While geolocation information, both provided by the user and inferred by Twitter, is directly accessible within the tweet-object under the “coordinates” and “place” objects, it’s worth noting that this data is available in less than of the tweets in our dataset. However, a significant portion of users often include location details, at least down to the city or state of residence, within their profile biographies. Carmen utilizes this additional information to infer geolocation data at the county, state, and country levels. State level geolocation statistics are shown in SI Appendix 4.2 in Table 6.
Emotions
Most motion detection approaches are based on one of two theories - Ekman’s Theory of Emotions Ekman and Davidson (1994) and, Plutchik’s Wheel of Emotions Plutchik (1980). Ekman’s theory finds that facial expressions are universal indicators of basic emotions and identifies six primary emotions as universally recognized across cultures - happiness, sadness, anger, fear, disgust, and surprise. Plutchik’s theory, in turn, categorizes emotions into eight primary emotions, positioned on a colored wheel and that other emotions are a combination of these primary emotions. These include joy, trust, fear, surprise, sadness, disgust, anger, and anticipation.
Traditionally emotions and sentiment have been quantified using lexicon based approaches Tausczik and Pennebaker (2010); Mohammad and Turney (2013); Hutto and Gilbert (2014). While sentiment classification Tausczik and Pennebaker (2010); Hutto and Gilbert (2014) categorizes text into positive, negative and neutral, emotion classification Mohammad and Turney (2013) delves intointo nuanced emotions. Lexicon based approaches however suffer from a lack of ability to judge context. The advent of transformers Vaswani et al. (2017) and large-language models Devlin et al. (2018); Liu et al. (2019) enabled researchers to design approaches that considered context.
In this study, for quantifying emotions expressed in tweets, we rely on SpanEmo, a BERT-based state-of-the-art emotions classifier Alhuzali and Ananiadou (2021), fine-tuned on the SemEval 2018 Task 1e-c Mohammad et al. (2018) dataset. This classifier identifies 11 different emotions - anger, disgust, fear, joy, sadness, love, anticipation, optimism, pessimism, surprise and trust, described under the Plutchik’s wheel of emotions Plutchik (1980). A recent study Jack et al. (2014) however, suggests that there are four basic emotions - anger, joy, sadness and fear. We limit the focus of this work to these four emotions. Validation of this emotion classifier against these four emotions was performed against human annotated data and is further discussed in SI Appendix 4.3 under Table 10. The codebook used in gathering human annotations for a subset of the data is discussed in SI Appendix 4.3 under Table 4.3.6.
Hate speech
Hate speech, commonly defined as any form of communication expressing discrimination, hostility, or prejudice against individuals or groups based on attributes such as race, ethnicity, nationality, religion, gender, sexual orientation, disability, and other characteristics, has been a subject of extensive research in the realm of social media content identification Waseem and Hovy (2016); Davidson et al. (2017); Gambäck and Sikdar (2017); Barbieri et al. (2020); Siegel et al. (2021); Calabrese et al. (2022). Similar to challenges faced in emotion detection, lexicon-based approaches Siegel et al. (2021) often encounter false positives due to the absence of contextual cues.
In this work, we employ a state-of-the-art hate speech detection classifier, specifically a RoBERTa-based model Liu et al. (2019), fine-tuned using the SemEval 2019 Task 5 dataset Basile et al. (2019). This dataset was designed to identify hate speech directed at women and immigrants, and is well suited for the objectives of this study. The binary classifier categorizes tweets as either hate speech or not. Validation of the hate speech classifier was performed against human annotated data. The codebook used in gathering human annotations for a subset of the data is discussed in SI Appendix 4.3 under Table 4.3.6.
Toxicity
Toxic speech is a broader term encompassing varied forms of harmful or abusive communication that can include hate speech but is not limited to it. Toxic speech, unlike hate speech, is not targeted towards specific groups or identities. Unitary AI’s Detoxify Hanu and Unitary team (2020) and Google Jigsaw’s Perspective API Google-Jigsaw (2021) are two current state-of-the-art multilabel deep learning models that identify toxic and abusive speech in text. While both APIs aim to primarily identify toxicity they also identify severe toxicity, profanity, insults, threats, identity attacks and sexually explicit content. In this study, we rely on Detoxify Hanu and Unitary team (2020) to identify toxic speech and also insults and offensive language.
Interrupted Time Series
Interrupted time series analysis Wagner et al. (2002) allows us to disentangle the heterogeneous effects of user ideology on affect. Previous works Bernal et al. (2017); Green et al. (2021); Wang and Inbar (2021) have leveraged this approach to quantify the discontinuity introduced in trends post exposure to a certain treatment. We define two separate regression models, one for each ideological group, to identify discontinuities in trends in response to a sociopolitical event. The models are specified as:
where, the outcome variable, is the share of tweets that in a 4-hour window that express a particular affect. is a continuous variable indicating the time passed in number of 4-hour windows since the occurrence of the event (treatment), treatment is a dummy variable encoding whether the time window was before or after the event (before = 0, after = 1) and, days post treatment is a continuous variable with 0 before the treatment and the number of 4-hour windows passed since the treatment. is the slope of the trend in affect before the event, is the change in slope post-event, and is the “jump” in affect immediately post the event’s occurrence. We model this separately for liberals and conservatives for each expression of interest (i.e., emotions, hate speech, toxicity, insults, and obscenities) and using , we test the hypothesis that a given expression increased/decreased for a particular group immediately post-event.
Frame Identification
To identify and measure the prevalence of key aspects of the abortion rights debate in the U.S., we first curated phrases and keywords that can identify discourse related to religion, bodily autonomy, fetal personhood, women’s rights and fetal viability in the context of the abortion, five frames identified as central in past work on abortion-related considerations and arguments Marquis (1989); Harris and Mills (1985); Cohen (2015); Greasley (2017); Mackenzie (2020); Pew (2022); Hartig (2022). The curation of these phrases and keywords was done by leveraging, SAGE, a keyword extraction method discussed in Eisenstein et al. (2011). SAGE identifies keywords by assigning each word in a document a score that represents its prominence compared to a baseline document. More specifically, SAGE calculates the deviation in log-frequencies of words from a baseline lexical distribution.
We applied SAGE on frame-relevant Wikipedia articles (See SI Appendix 4.5 Table 14) while using a random concatenation of articles across all five frames as a baseline document. We use SAGE to identify frame-relevant n-grams, when . We manually verified the keywords identified by SAGE to ensure precision and relevance. Keywords/phrases extracted for each frame is shown in SI Appendix 4.5 Table 15 lists all the keywords/phrases extracted for each frame. While advances have been made in topic-modeling approaches Blei et al. (2003); Peinelt et al. (2020); Grootendorst (2022), the stochasticity in terms of topics detected dictated our choice towards a statistical approach in Eisenstein et al. (2011) that allowed us to define the frames of interest.
Upon identifying relevant phrases, we identify tweets that contain them. The statistics of tweets identified using this approach are shown in Appendix 4.5 Table 16. The goal is to automatically identify all words used in association with these anchors, i.e., words that were used significantly more frequently to modify frame-relevant terms than general terms. More specifically, these modifying terms are adjectives, verbs, and nouns that are associated with the anchor term. We identify them by applying part-of-speech tagging 111https://spacy.io/usage/linguistic-features#pos-tagging and dependency parsing 222https://spacy.io/api/dependencyparser on all tweets identified to be frame-relevant.
Results
The Materials and Methods section provides information on the data and methodology used in this study, and the Supplementary Information (SI) offers additional details about materials and methods as well as robustness checks and validation of the machine learning classifiers. From the set of 57M tweets collected in Chang et al. (2023), we excluded retweets, replies, and quoted tweets to focus primarily on original tweets. This left us with roughly 3.6M original tweets from 1.1M users between January 1, 2022 to January 1, 2023.
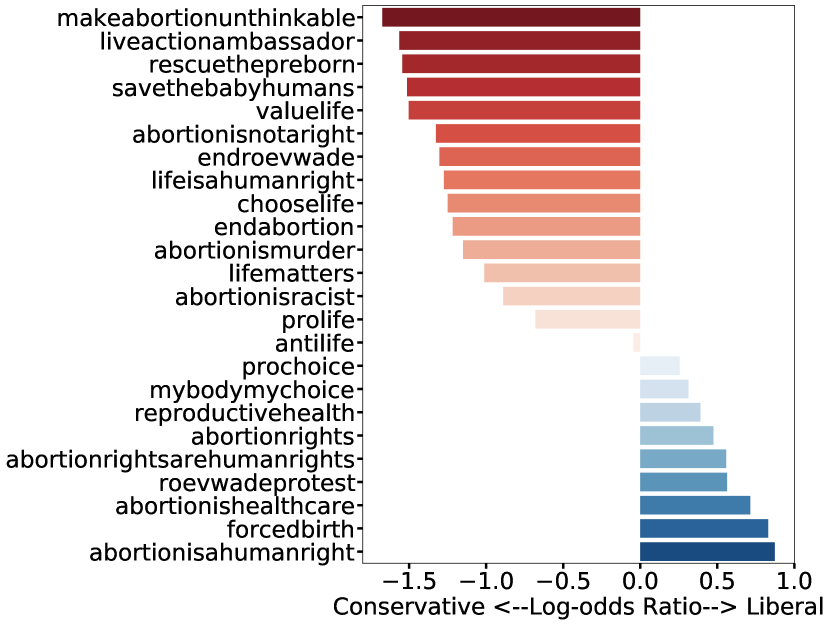
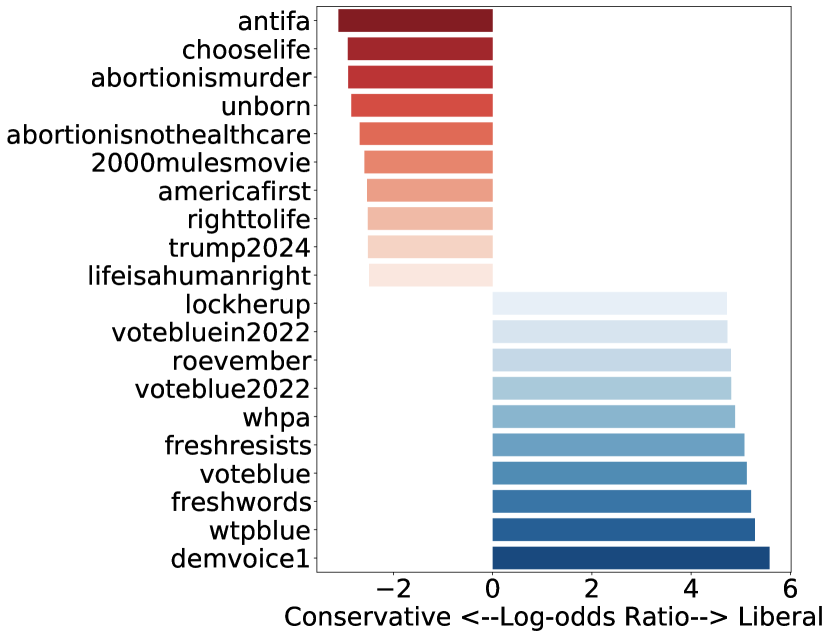
We estimate political ideology of each user by analyzing URLs embedded in users’ original tweets, as done in Rao et al. (2021). The Materials and Methods section and SI Appendix 4 4.1 offer details on this approach. We also perform extensive validation of user-level ideology estimates by comparing our estimates with those produced in previous works Barberá (2015); Wojcieszak et al. (2024); Rao et al. (2021) (See SI Appendix 44.1.1). In addition, we plot the estimated the share of conservative users in a state and compare it to that state’s vote share, finding high agreement. Further, we examine the differential use of hashtags used for data collection, finding, for example, that users estimated to be conservative using our approach were roughly 1.5 more likely to use hashtags such as “makeabortionunthinkable” or “safethebabyhumans,” whereas users estimated to be liberal were more likely to use hashtags such as “abortionisahumanright” or “forcedbirth” (Refer SI Appendix 4.1.1 Figure 7). Lastly, we also plot the log odds ratios of the top-10 most frequently used hashtags, not necessarily abortion related, by ideology, showing their predicted use by liberals (e.g., “voteblue2022”, “onev1” and “wtpblue”) and conservatives (e.g., “god”, “trump2024”, “2000mulesmovie”) (Refer SI Appendix 4.1.1 Figure 7).
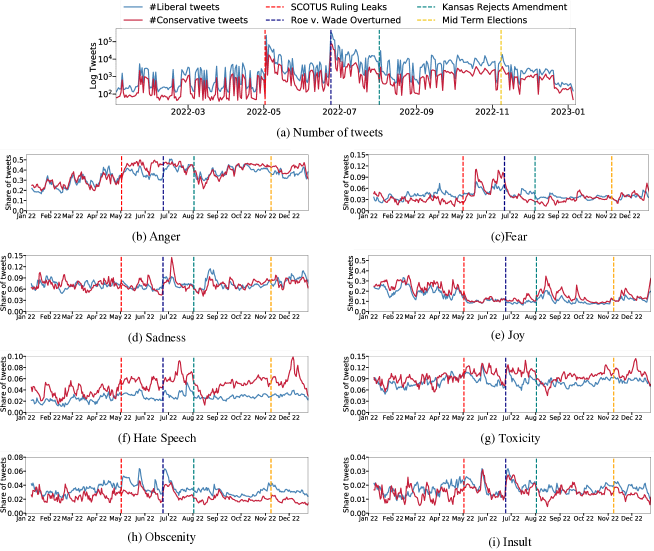
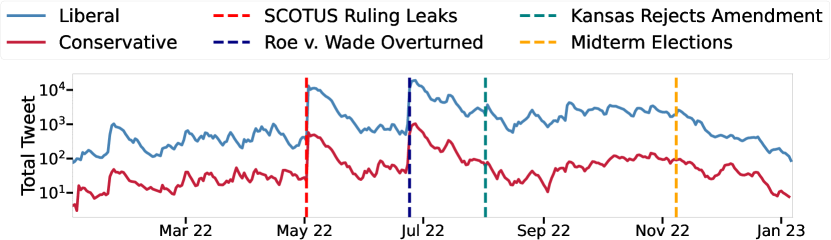
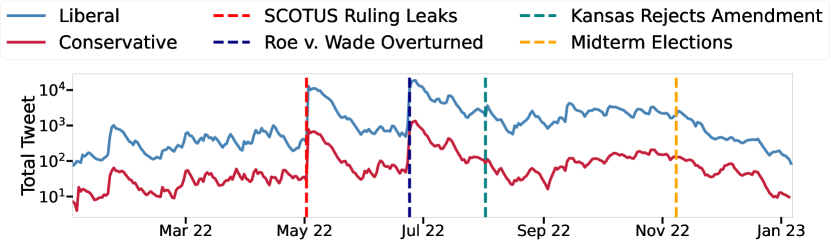
Figure 1(a) shows fluctuations in the volume of abortion-related tweets over a one-year period by users’ ideological leaning. We see notable spikes in activity, with volume of tweets increasing by almost two orders of magnitude on May 3rd, 2022, and June 24th, 2022, the dates the draft of the decision was leaked and of the Supreme Court decision itself. Further, we see an uptick in engagement on August 3rd, 2022, coinciding with the vote on the Kansas constitutional amendment. Figure 1(a) also highlights a consistent trend in which liberals consistently generated a higher volume of abortion-related tweets compared to conservatives.
Ideological Differences in Reactions to Key Events
We then examine how emotions, hateful speech, toxicity, obscenity, and insults in tweets about abortion vary over time and by the political leaning (RQ1) (Fig.1). The number of original tweets, retweets and replies expressing these indicators is shown in SI Appendix 4.3 Table 7. In addition, in SI Appendix 4.3.1 Fig. 9, we discuss the relationship between these different indicators. Furthermore, SI Appendix 4.3 shows detailed statistical results comparing liberals and conservatives on the mean emotional expression and the prevalence of hate speech, toxic language, and obscenities in all tweets (see Table 8) and original tweets see (Table 9).
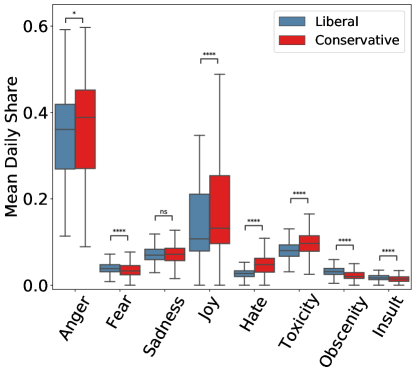
Overall, conservatives expressed more anger in their tweets about abortion but also more joy and less fear than liberals (Fig.2). The emotional responses of the two groups fluctuated over time and especially in the aftermath of key events, specifically the leak (May 3rd, 2022), the official Dobbs ruling (June 24th, 2022), the Kansas referendum (August 3rd, 2022) and the US midterm elections (November 8, 2022). Fig. 1a) shows that the periods after the leak and the Supreme Court ruling were characterized by increases in negative emotions like anger (Fig. 1b) and fear (Fig. 1c), hate speech (Fig. 1f) and toxicity (Fig. 1g), and decrease of joy (Fig. 1e).
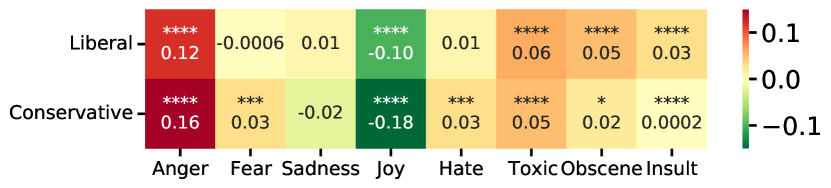
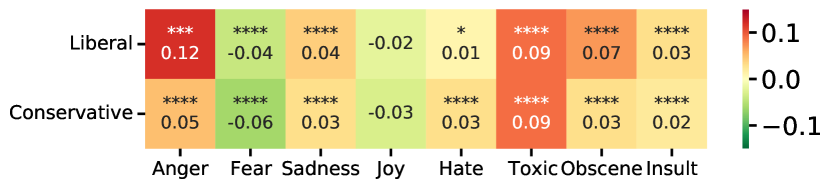
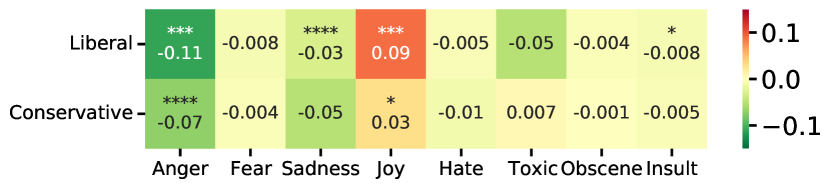
We use the interrupted time series design to measure emotional reactions to key events. This analysis enables us to quantify discontinuities in affect in response to a treatment, i.e., an event, test their significance and disentangle the heterogeneous effects of users’ ideology Wagner et al. (2002). We examine changes in trends at a 4-hour resolution over a time period covering the week before and after the event. We define separate regression models for liberals and conservatives (see Materials and Methods section). The heatmaps in Fig. 3(a)-(d) show the coefficients of the treatment variable for liberals and conservatives, which represent the immediate change in intercept after an event. Asterisks highlight statistically significant changes in the intercept. Regression plots highlighting the trends for liberals and conservatives pre- and post-events are shown in SI Appendix 4.4 Fig. 13.
After the leak, both groups expressed significantly more anger (Fig.3a). The share of angry tweets by liberals increased by 15%, from 30% to 45%, and only by 2% among conservatives, from 45% to 47%. These shifts are confirmed in Fig.3(b). While the increase among conservatives is counter intuitive, it reflects frustration among conservatives who viewed the leak as an attempt by liberals to delegitimize the court and intimidate conservative justices. The rejection of the proposed amendment in Kansas on August 3, 2022 led to a decline in anger for liberals 42% to 35% in comparison to conservatives (43% to 39%) ((Fig. 1b) and Fig.3c).
Although liberals expressed more fear overall (4.9% vs 3.8%) overall (Fig.2), conservatives gradually increased their use of fear after the leak, from 3% to over 12% after the leak and in the lead up to the official ruling (Fig. 1c). A review of the tweets suggests that this was due to their worries that the decision would unleash violent mass protests. Fear decreased after the ruling for both groups, especially for conservatives from about 10% to under 4% (Figs 1c and 3b).
With regard to sadness, there were no statistically significant differences between the two groups overall (Fig. 2). Yet, expressions of sadness fluctuated differently for liberals and conservatives around key events (Fig. 1d). While there was an immediate, significant increase in sadness for liberals post ruling, from 7% to 9% (Figs. 1d and 3b), the increase in sadness for conservatives was more gradual from roughly 7% to over 12% by July 9th, 2022. While the increase for liberals can be attributed to their disappointment at the overruling of Roe vs Wade, the increase in conservative sadness mainly stems from tweets referring to liberals as “baby killers” or “demonic liberals,” which were classified as expressing sadness. The peak in conservative sadness on July 9, 2022 reflects reactions to President Biden’s executive order to protect access to reproductive health care.
While conservatives express more joy in their abortion-related tweets than liberals (18.1% versus 14.2%) (Fig. 2), tweets expressing joy declined on both sides over the analyzed time period (Fig. 1e). Expression of joy declined from 20% to roughly 10% for both groups immediately after the leak of the draft ruling, as indicated by statistically significant coefficients for both the groups in Fig. 3(a). A review of the tweets also suggests that conservatives did not greet the repeal of Roe v. Wade as a victory, even though this was their long-term goal. We validate the results for emotions using sentiment analysis. We quantify the overall sentiment expressed by liberals and conservatives during this time period and present the results in SI Appendix 4.3.5.
When it comes to problematic speech, i.e., hate speech, toxicity, insults, and obscenity, we observe substantial ideological asymmetries. In the aggregate, hate speech is more prevalent among conservatives than liberals (5% versus 2%) (Fig 2). The use of hate speech further increased among conservatives after the leak and the Dobbs decision (Fig. 3a,b) and (Fig 1f). On the day of the leak, conservative usage of hateful speech significantly increased from 2% of their tweets to roughly 6%, and to almost 10% after the official verdict. These increases for conservatives are statistically significant as seen in Figs.3(a) and 3(b). An examination of the tweets suggests that these increases are due to the prevalence of misogynistic and xenophobic sentiments among this group. One prominent surge in mid-July was directed at immigrants, following news of a 10 year old girl from Ohio who was allegedly raped by an immigrant and who was seeking abortion in Indianapolis. Another notable surge in hateful speech occurred in the lead up to the 2022 midterm elections. Although conservative hate speech temporary declined following the Kansas referendum from 7% to under 2%, it again increased before the 2022 midterm elections culminating close to over 10% at the end of December 2022. In contrast, the incidence of hate speech among liberals remains consistently low, below 5% throughout the year and with no significant spikes.
Similarly, conservative users were more toxic overall than liberals (10% versus 8%) (Fig. 2). Yet both liberals and conservatives sharply increased their use of toxic language following the leak (from 7% to 11% and from 8% to 15%, respectively) and even more so after the decision, from 7% to 15% and from 7% to 16% respectively (Figs.3a,b). Toxicity among liberals decreased shortly afterwards in both cases (Fig. 1g), while it remained stable among conservatives. The increases in toxic speech is seen to be statistically significant through interrupted time series analysis in Figs.3(a) and 3(b). In the lead up to the midterm elections, conservatives remain more toxic overall in comparison to liberals.
In contrast, liberals generally use more obscenities and insults than conservatives (obscenities 3.5% versus 2.3%, insults 2% versus 1%) (Fig 2). Liberal expression of obscenities marginally increases from 4% to 5.5% after the leak and more substantially from 3% to 6% after the official ruling (Fig 1h and 3a,b). Liberals substantially increased their use of insults on the day of the leak from 0.6% to 3% of all original tweets as opposed to a marginal increase for conservatives from 1.6% to 1.7%. Both liberals and conservatives increased their use of insults on the day of the Dobbs ruling, from 1% to 4% (Fig 1i). The fact that obscenities and insults fluctuate in parallel ways among both liberals and conservatives reflects the intensity of online debates.In addition, Fig. 10 in SI Appendix 4.3.2 shows the share of all liberal or conservative tweets expressing anger, fear, sadness and joy, hateful speech, toxicity, obscenity and insults.
Frames
To better understand how liberals and conservatives discuss abortion, we extract five frames previously identified as relevant to abortion debate in the U.S.: Marquis (1989); Harris and Mills (1985); Cohen (2015); Greasley (2017); Mackenzie (2020); Pew (2022); Hartig (2022): religious beliefs, bodily autonomy, fetal personhood, women’s health, and abortion exceptions (see Materials and Methods and SI Appendix 4.5).
We examine the use of these frames by each group and also the context in which these frames are used. Figure 12(a) shows the log-odds ratio of which group — liberals or conservatives — is more likely to use each frame when tweeting about abortion, showing that conservatives were more likely to use religious and fetal personhood frames and liberals were more likely to frame their discourse around bodily autonomy and women’s reproductive health. Conversations around exceptions to the abortion ban were also marginally more liberal.
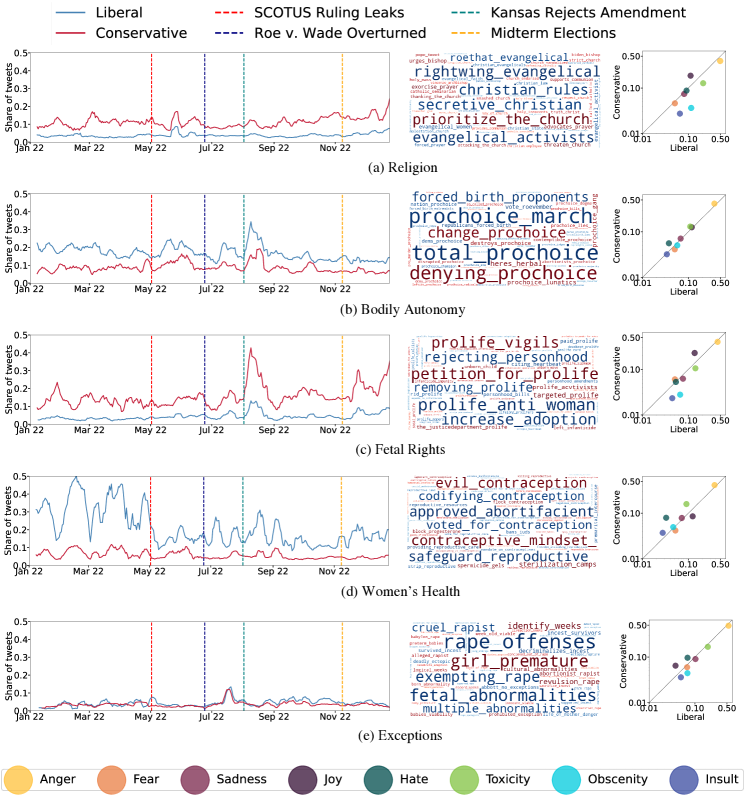
Figures 4(a)-(e), shed light on the use of these five frames over time by both liberal and conservatives. We see a substantial decline in the prevalence of the women’s health frame in liberal discourse after the leak, from 41% to merely 10%. The use of the bodily autonomy frame became more prevalent instead: the use of this frame increased among liberals from 18% to 32% following the Kansas referendum. In contrast, conservatives reacted to this event with an increase use of fetal personhood frame, which climbed from 12% to 40%.
In addition, we employ simple linguistic techniques of part-of speech tagging and dependency parsing to extract the context in which liberals and conservatives use these five frames. Word clouds in Fig. 4(a)-(e) highlight the diverging perspectives of the two groups. In religious discourse related to abortion (see Fig. 4a), liberals use the term “evangelical,” while conservatives use “catholic.” Furthermore, liberal messaging adopts a critical tone, utilizing phrases such as “secretive christian,”“right-wing evangelical,” or “molestation church,” among others. In contrast, conservatives employ phrases like “prioritize the church,” “advocates prayer,” or “way of the church.” When discussing bodily autonomy (Fig. 4b), liberals rely on pro-choice messaging (e.g., “pro-choice march” or “total pro-choice”) while conservatives actively reject the pro-choice stance through phrases such as “denying pro-choice” or “change pro-choice”.
The anti-abortion stance of conservatives is further seen in the context of fetal personhood frame (Fig. 4c), where they use phrases such as - “left infanticide”, “petition for prolife”, “defenceless unborn”, “gorgeous babies”, or “patriots for unborn.” In contrast, liberals remain critical of the personhood argument, using phrases such as - “condemn personhood,” “lose personhood,” “reject personhood.” or “prolife anti woman.” Furthermore, conservatives rely on words such as “baby” and “unborn,” which are not used in liberal framing Simon and Jerit (2007). In conversations around general reproductive care and contraception (Fig. 4d), liberals use phrases such as “protection for contraception,” “voted for contraception,” “legalize contraception,”or “approval for mifepristone,” among other mentions of reproductive laws. In contrast, conservative discussion of the women’s health frame relies on phrases such as “evil contraception”, “sterilization camps,” or “block progesterone.” Similarly, liberals and conservatives discuss fetal viability (Fig. 4e), exceptions to abortion restrictions, and gestational limits in divergent contexts. Liberal discourse reflects criticism of a total ban on abortion access with a frequent use of phrases such as “fetal abnormalities,” “multiple abnormalities,” “cruel rapist,” or “exempting rape.” In contrast, conservatives question these exemptions using phrases such as“alleged rapist”, “fabricated rape” or “conceived out of rape”, as well as “week old viable” or “preterm babies.” SI Appendix 4.5 offers an extended list of the words and phrases used for each of the five frames.
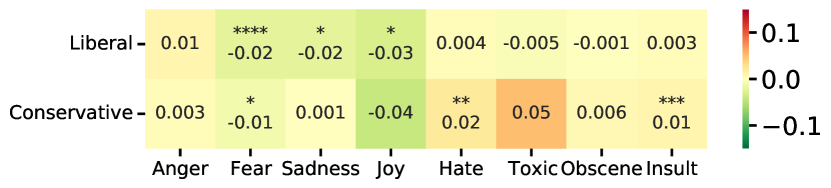
Lastly, we examine whether and the extent to which there are ideological asymmetries in the expression of anger, fear, sadness, joy, hate speech, toxicity, obscenities, and insults in the discussions of the five frames.
The diagonal represents equal expression of anger, fear, sadness, joy, hate speech, toxicity, insults, and obscenities by both groups. Values above the diagonal indicate a heightened presence of these expressions in conservative tweets, whereas values below the diagonal indicate a greater presence of these expressions in liberal tweets. The scatterplots in Figs. 4(a-e) show that liberals express more negative attitudes when discussing the religion and fetal personhood frames, whereas conservatives express more negative attitudes when discussing women’s health and bodily autonomy. Interestingly, discussions of abortion exceptions elicit the highest levels of anger, fear, hate speech, and toxicity from both groups, but especially for liberals, suggesting the potency of the issue to liberals.
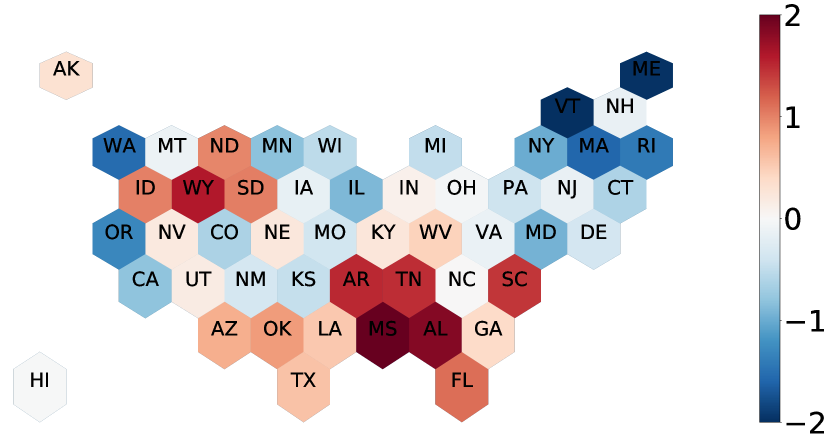
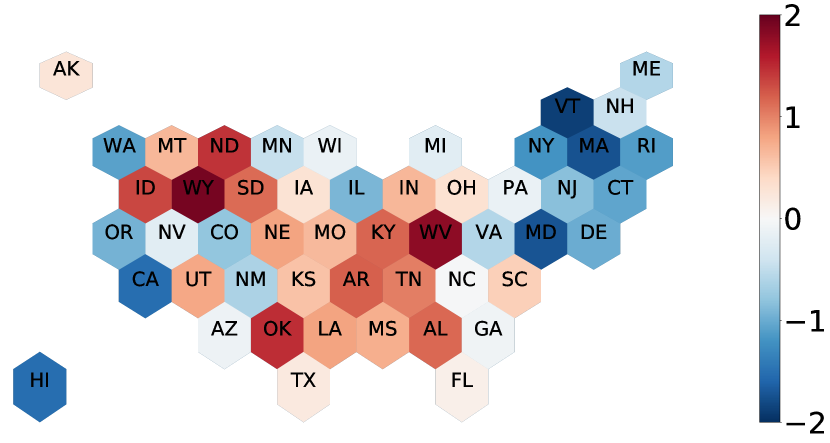
Utilizing inferred geolocations (see Materials and Methods section), we assign Twitter users to specific states and quantify the proportion of tweets mentioning each frame that originate in each state. Fig. 12(b)-(f) visualizes state-level distribution of the proportion of tweets discussing these five frames. Discourse associated with religion and fetal personhood, used by conservatives (see Fig. 12(a)), is substantially more frequent in the South. In turn, discussions centered on bodily autonomy and women’s health, primarily favored by liberals (Fig. 12a)), are more pronounced in the Northeast and the West. Intriguingly, users in North Carolina heavily rely on both fetal personhood and bodily autonomy frames, potentially indicating the divides in public opinion in that state.
Discussion
This study examined how online discussion around abortion access fluctuated over the period of twelve months that encompass the decision by the Supreme Court of the United States (SCOTUS) to overturn the Roe vs. Wade. This decision offers a unique opportunity to explore online conversations during the times of a major societal upheaval. Leveraging an extensive datasetChang et al. (2023), we investigate the fluctuations in the expressions of anger, fear, sadness, and joy, of problematic speech (i.e., hateful speech, toxicity, insults, and obscenity), and also of the use of key frames central to the abortion debate. We tested these expressions along the ideological divide between liberals and conservatives, a divide that has widened in recent years, with Democrats increasingly becoming pro-abortion and Republicans opposed to it Hartig (2022); Saad (2022).
We offer three key findings. First, anger was the dominant emotion in abortion-related tweets, a finding that underscores the contentious nature of the abortion rights debate and the tensions following the overturn of Roe v Wade. Emotional expressions differed between liberals and conservatives in response to key events. Anger surged immediately after the leak, especially among conservatives, who perceived it as an attempt to delegitimize the court and intimidate conservative justices. While the expressions of anger remained stable among conservatives, liberals’ expression of anger increased after the leak and decreased after the Kansas referendum. Fear increased significantly for conservatives after the leak, an increase driven by concerns about potential left-wing protests. Both liberals and conservatives experienced peaks in sadness after the official verdict. Liberals were disappointed by the overruling of Roe vs. Wade, while conservatives were displeased with President Biden’s executive order protecting abortion access. These fluctuations, however, were temporary and pivotal events did not bring about lasting emotional shifts. Instead, emotions oscillated, reflecting the collective mood of each group in response to the various events analyzed, and reverted to the initial equilibrium shortly after.
Second, we observe significant ideological differences in the use of hate speech. We find that conservatives resorted to hateful rhetoric more than liberals. Yet, liberals were especially likely to use obscenities and insults, especially on the days the ruling was leaked and after the Dobbs decision. In turn, toxic language sharply increased among both groups following the leak and especially after the SCOTUS ruling.
These two findings suggest potential emotional contagion and the fact that liberals and conservatives mobilize and trigger each other in their online discourse. The utilization of hateful rhetoric, toxic language, and the incorporation of obscenities consistently diverge between these groups throughout the entire period.
Third, we shed light on how online discussions about abortion are driven by and reflect key frames: religion, bodily autonomy, fetal personhood, and women’s health and exceptions Marquis (1989); Simon and Jerit (2007); Pew (2012); Cohen (2015); Greasley (2017); Mackenzie (2020); Pew (2022); Hartig (2022); Norrander and Wilcox (2023). We show that conservatives tend to employ religious and fetal personhood frames, while liberals emphasize women’s health and bodily autonomy. Although these patterns may be expected, ours is the first study to show the use and the prevalence of these patterns using online behavioral data from millions of partisan Twitter users in the United States. Furthermore, we show that the frames favored by one side provoke strong negative reactions from the other: liberals express more anger and toxicity when discussing religion, while conservatives use more toxic language and hate speech when addressing women’s health. Interestingly, abortion exceptions, particularly for cases of rape or incest, trigger powerful negative reactions from both sides, underscoring the issue’s centrality in the abortion debate. Furthermore, geographical variations closely align with ideological asymmetries. The increased expression of anger, fear, and toxic rhetoric among liberals regarding frames central to conservative abortion discourse, paralleled by a corresponding increase in negative emotions among conservatives when addressing issues pivotal to liberal discourse underscores the stark divisions between these two ideological groups.
Furthermore, examining the time series of frames over the period of one year, we show that important events related to the abortion debate, namely the leak and the Dobbs ruling, did not generate substantial fluctuations in the used frames. Instead, it was the Kansas referendum that changed the discussions and led to fluctuations in the used frames. This finding indicates the stability and persistance of these key five frames in partisan discourse around abortion and also may suggest that more unexpected events (i.e., the Kansas referendum) may have larger impacts on the shifts in online discourse.
Our research throws light on the impact of the Dobbs v. Jackson Women’s Health Organization decision on the abortion rights debate, exposing the intricate interplay between collective emotions and evolving narratives in ideological cohorts. Analyzing a vast dataset of over over 57 million tweets from more than 5 million users over a year, we unveil a stark divide in emotional responses, hate speech, toxic language, and ideological perspectives among liberals and conservatives. Our findings not only underscore the influence of significant events on these discussions but also shed light on the evolving public sentiment. Furthermore, our study identifies frames that resonate strongly with one side while evoking vehement opposition from the other. This research offers a comprehensive perspective on how online discourse not only reflects but actively shapes societal dialogues on contentious issues, underscoring the dynamic and transformative nature of the abortion debate in contemporary America.
References
- Saad [2010a] Lydia Saad. Republicans’, dems’ abortion views grow more polarized. https://news.gallup.com/poll/126374/republicans-dems-abortion-views-grow-polarized.aspx, 2010a. [Online; accessed 11-January-2023].
- Saad [2010b] Lydia Saad. Americans still split along pro-choice pro-life lines. https://news.gallup.com/poll/147734/americans-split-along-pro-choice-pro-life-lines.aspx, 2010b. [Online; accessed 11-January-2023].
- DiMaggio et al. [1996] Paul DiMaggio, John Evans, and Bethany Bryson. Have american’s social attitudes become more polarized? American journal of Sociology, 102(3):690–755, 1996.
- Evans [2003] John H Evans. Have americans’ attitudes become more polarized?—an update. Social Science Quarterly, 84(1):71–90, 2003.
- Brenan [2010] Megan Brenan. Record-high 47% in u.s. think abortion is morally acceptable. https://news.gallup.com/poll/350756/record-high-think-abortion-morally-acceptable.aspx, 2010. [Online; accessed 11-January-2023].
- NAF [2022] NAF. 2021 violence and disruption report. https://prochoice.org/national-abortion-federation-releases-2021-violence-disruption-report/, 2022. [Online; accessed 9-January-2023].
- SCOTUS [2022] SCOTUS. Dobbs, state health officer of the mississippi department of health vs jackson women’s health organization. https://www.supremecourt.gov/opinions/21pdf/19-1392_6j37.pdf, 2022. [Online; accessed 11-January-2023].
- Rao et al. [2021] Ashwin Rao, Fred Morstatter, Minda Hu, Emily Chen, Keith Burghardt, Emilio Ferrara, and Kristina Lerman. Political partisanship and antiscience attitudes in online discussions about covid-19: Twitter content analysis. Journal of medical Internet research, 23(6):e26692, 2021.
- Cinelli et al. [2021] Matteo Cinelli, Gianmarco De Francisci Morales, Alessandro Galeazzi, Walter Quattrociocchi, and Michele Starnini. The echo chamber effect on social media. Proceedings of the National Academy of Sciences, 118(9):e2023301118, 2021.
- Breuer et al. [2015] Anita Breuer, Todd Landman, and Dorothea Farquhar. Social media and protest mobilization: Evidence from the tunisian revolution. Democratization, 22(4):764–792, 2015.
- Steinert-Threlkeld [2017] Zachary C Steinert-Threlkeld. Spontaneous collective action: Peripheral mobilization during the arab spring. American Political Science Review, 111(2):379–403, 2017.
- Munn [2021] Luke Munn. More than a mob: Parler as preparatory media for the us capitol storming. First Monday, 2021.
- Nikolov et al. [2020] Dimitar Nikolov, Alessandro Flammini, and Filippo Menczer. Right and left, partisanship predicts (asymmetric) vulnerability to misinformation. arXiv preprint arXiv:2010.01462, 2020.
- Chen et al. [2021] Emily Chen, Herbert Chang, Ashwin Rao, Kristina Lerman, Geoffrey Cowan, and Emilio Ferrara. Covid-19 misinformation and the 2020 us presidential election. The Harvard Kennedy School Misinformation Review, 2021.
- Guo et al. [2022] Siyi Guo, Keith Burghardt, Ashwin Rao, and Kristina Lerman. Emotion regulation and dynamics of moral concerns during the early covid-19 pandemic. arXiv preprint arXiv:2203.03608, 2022.
- Priniski et al. [2021] J Hunter Priniski, Negar Mokhberian, Bahareh Harandizadeh, Fred Morstatter, Kristina Lerman, Hongjing Lu, and P Jeffrey Brantingham. Mapping moral valence of tweets following the killing of george floyd. arXiv preprint arXiv:2104.09578, 2021.
- Barberá [2015] Pablo Barberá. Birds of the same feather tweet together: Bayesian ideal point estimation using twitter data. Political analysis, 23(1):76–91, 2015.
- Wojcieszak et al. [2022] Magdalena Wojcieszak, Andreu Casas, Xudong Yu, Jonathan Nagler, and Joshua A Tucker. Most users do not follow political elites on twitter; those who do show overwhelming preferences for ideological congruity. Science advances, 8(39):eabn9418, 2022.
- Yardi and Boyd [2010] Sarita Yardi and Danah Boyd. Dynamic debates: An analysis of group polarization over time on twitter. Bulletin of science, technology & society, 30(5):316–327, 2010.
- Garimella et al. [2018] Kiran Garimella, Gianmarco De Francisci Morales, Aristides Gionis, and Michael Mathioudakis. Political discourse on social media: Echo chambers, gatekeepers, and the price of bipartisanship. In Proceedings of the 2018 world wide web conference, pages 913–922, 2018.
- Sharma et al. [2017] Eva Sharma, Koustuv Saha, Sindhu Kiranmai Ernala, Sucheta Ghoshal, and Munmun De Choudhury. Analyzing ideological discourse on social media: A case study of the abortion debate. In Proceedings of the 2017 international conference of the computational social science society of the americas, pages 1–8, 2017.
- Huang et al. [2020] Xiaolei Huang, Amelia Jamison, David Broniatowski, Sandra Quinn, and Mark Dredze. Coronavirus twitter data: A collection of covid-19 tweets with automated annotations, Mar 2020. URL https://doi.org/10.5281/zenodo.3735015. http://twitterdata.covid19dataresources.org/index.
- Chen et al. [2020] Emily Chen, Kristina Lerman, Emilio Ferrara, et al. Tracking social media discourse about the covid-19 pandemic: Development of a public coronavirus twitter data set. JMIR public health and surveillance, 6(2):e19273, 2020.
- Chen et al. [2022] Emily Chen, Ashok Deb, and Emilio Ferrara. # election2020: The first public twitter dataset on the 2020 us presidential election. Journal of Computational Social Science, 5(1):1–18, 2022.
- Abilov et al. [2021] Anton Abilov, Yiqing Hua, Hana Matatov, Ofra Amir, and Mor Naaman. Voterfraud2020: a multi-modal dataset of election fraud claims on twitter. arXiv preprint arXiv:2101.08210, 2021.
- Chen and Ferrara [2022] Emily Chen and Emilio Ferrara. Tweets in time of conflict: A public dataset tracking the twitter discourse on the war between ukraine and russia. arXiv preprint arXiv:2203.07488, 2022.
- Chang et al. [2023] Rong-Ching Chang, Ashwin Rao, Qiankun Zhong, Magdalena Wojcieszak, and Kristina Lerman. # roeoverturned: Twitter dataset on the abortion rights controversy. In Proceedings of the International AAAI Conference on Web and Social Media, volume 17, pages 997–1005, 2023.
- Dredze et al. [2013] Mark Dredze, Michael J Paul, Shane Bergsma, and Hieu Tran. Carmen: A twitter geolocation system with applications to public health. In AAAI workshop on HIAI, volume 23, page 45. Citeseer, 2013.
- Plutchik [1980] Robert Plutchik. A general psychoevolutionary theory of emotion. In Theories of emotion, pages 3–33. Elsevier, 1980.
- Conover et al. [2011] Michael Conover, Jacob Ratkiewicz, Matthew Francisco, Bruno Gonçalves, Filippo Menczer, and Alessandro Flammini. Political polarization on twitter. In Proceedings of the international aaai conference on web and social media, volume 5, pages 89–96, 2011.
- Badawy et al. [2018] Adam Badawy, Emilio Ferrara, and Kristina Lerman. Analyzing the digital traces of political manipulation: The 2016 russian interference twitter campaign. In 2018 IEEE/ACM international conference on advances in social networks analysis and mining (ASONAM), pages 258–265. IEEE, 2018.
- Le et al. [2019] Huyen Le, Raven Maragh, Brian Ekdale, Andrew High, Timothy Havens, and Zubair Shafiq. Measuring political personalization of google news search. In The World Wide Web Conference, pages 2957–2963, 2019.
- Pagliardini et al. [2018] Matteo Pagliardini, Prakhar Gupta, and Martin Jaggi. Unsupervised Learning of Sentence Embeddings using Compositional n-Gram Features. In NAACL 2018 - Conference of the North American Chapter of the Association for Computational Linguistics, 2018.
- Ekman and Davidson [1994] Paul Ed Ekman and Richard J Davidson. The nature of emotion: Fundamental questions. Oxford University Press, 1994.
- Tausczik and Pennebaker [2010] Yla R Tausczik and James W Pennebaker. The psychological meaning of words: Liwc and computerized text analysis methods. Journal of language and social psychology, 29(1):24–54, 2010.
- Mohammad and Turney [2013] Saif M Mohammad and Peter D Turney. Crowdsourcing a word–emotion association lexicon. Computational intelligence, 29(3):436–465, 2013.
- Hutto and Gilbert [2014] Clayton Hutto and Eric Gilbert. Vader: A parsimonious rule-based model for sentiment analysis of social media text. In Proceedings of the international AAAI conference on web and social media, volume 8, pages 216–225, 2014.
- Vaswani et al. [2017] Ashish Vaswani, Noam Shazeer, Niki Parmar, Jakob Uszkoreit, Llion Jones, Aidan N Gomez, Łukasz Kaiser, and Illia Polosukhin. Attention is all you need. Advances in neural information processing systems, 30, 2017.
- Devlin et al. [2018] Jacob Devlin, Ming-Wei Chang, Kenton Lee, and Kristina Toutanova. Bert: Pre-training of deep bidirectional transformers for language understanding. arXiv preprint arXiv:1810.04805, 2018.
- Liu et al. [2019] Yinhan Liu, Myle Ott, Naman Goyal, Jingfei Du, Mandar Joshi, Danqi Chen, Omer Levy, Mike Lewis, Luke Zettlemoyer, and Veselin Stoyanov. Roberta: A robustly optimized bert pretraining approach. arXiv preprint arXiv:1907.11692, 2019.
- Alhuzali and Ananiadou [2021] Hassan Alhuzali and Sophia Ananiadou. SpanEmo: Casting multi-label emotion classification as span-prediction. In Proc. European Chapter of the ACL, pages 1573–1584, 2021.
- Mohammad et al. [2018] Saif Mohammad, Felipe Bravo-Marquez, Mohammad Salameh, and Svetlana Kiritchenko. Semeval-2018 task 1: Affect in tweets. In Proceedings of the 12th international workshop on semantic evaluation, pages 1–17, 2018.
- Jack et al. [2014] Rachael E Jack, Oliver GB Garrod, and Philippe G Schyns. Dynamic facial expressions of emotion transmit an evolving hierarchy of signals over time. Current biology, 24(2):187–192, 2014.
- Waseem and Hovy [2016] Zeerak Waseem and Dirk Hovy. Hateful symbols or hateful people? predictive features for hate speech detection on twitter. In Proceedings of the NAACL student research workshop, pages 88–93, 2016.
- Davidson et al. [2017] Thomas Davidson, Dana Warmsley, Michael Macy, and Ingmar Weber. Automated hate speech detection and the problem of offensive language. In Proceedings of the international AAAI conference on web and social media, volume 11, pages 512–515, 2017.
- Gambäck and Sikdar [2017] Björn Gambäck and Utpal Kumar Sikdar. Using convolutional neural networks to classify hate-speech. In Proceedings of the first workshop on abusive language online, pages 85–90, 2017.
- Barbieri et al. [2020] Francesco Barbieri, Jose Camacho-Collados, Luis Espinosa Anke, and Leonardo Neves. Tweeteval: Unified benchmark and comparative evaluation for tweet classification. In Findings of the Association for Computational Linguistics: EMNLP 2020, pages 1644–1650, 2020.
- Siegel et al. [2021] Alexandra A Siegel, Evgenii Nikitin, Pablo Barberá, Joanna Sterling, Bethany Pullen, Richard Bonneau, Jonathan Nagler, Joshua A Tucker, et al. Trumping hate on twitter? online hate speech in the 2016 us election campaign and its aftermath. Quarterly Journal of Political Science, 16(1):71–104, 2021.
- Calabrese et al. [2022] Agostina Calabrese, Björn Ross, and Mirella Lapata. Explainable abuse detection as intent classification and slot filling. Transactions of the Association for Computational Linguistics, 10:1440–1454, 2022.
- Basile et al. [2019] Valerio Basile, Cristina Bosco, Elisabetta Fersini, Debora Nozza, Viviana Patti, Francisco Manuel Rangel Pardo, Paolo Rosso, and Manuela Sanguinetti. Semeval-2019 task 5: Multilingual detection of hate speech against immigrants and women in twitter. In Proceedings of the 13th international workshop on semantic evaluation, pages 54–63, 2019.
- Hanu and Unitary team [2020] Laura Hanu and Unitary team. Detoxify. Github. https://github.com/unitaryai/detoxify, 2020.
- Google-Jigsaw [2021] Google-Jigsaw. Perspective api. https://developers.perspectiveapi.com, 2021.
- Wagner et al. [2002] Anita K Wagner, Stephen B Soumerai, Fang Zhang, and Dennis Ross-Degnan. Segmented regression analysis of interrupted time series studies in medication use research. Journal of clinical pharmacy and therapeutics, 27(4):299–309, 2002.
- Bernal et al. [2017] James Lopez Bernal, Steven Cummins, and Antonio Gasparrini. Interrupted time series regression for the evaluation of public health interventions: a tutorial. International journal of epidemiology, 46(1):348–355, 2017.
- Green et al. [2021] Mark Green, Elena Musi, Francisco Rowe, Darren Charles, Frances Darlington Pollock, Chris Kypridemos, Andrew Morse, Patricia Rossini, John Tulloch, Andrew Davies, et al. Identifying how covid-19-related misinformation reacts to the announcement of the uk national lockdown: An interrupted time-series study. Big Data & Society, 8(1):20539517211013869, 2021.
- Wang and Inbar [2021] Sze-Yuh Nina Wang and Yoel Inbar. Moral-language use by us political elites. Psychological Science, 32(1):14–26, 2021.
- Marquis [1989] Don Marquis. Why abortion is immoral. Journal of Philosophy, 86:183–202, 1989.
- Harris and Mills [1985] Richard J Harris and Edgar W Mills. Religion, values and attitudes toward abortion. Journal for the Scientific Study of Religion, pages 137–154, 1985.
- Cohen [2015] I Glenn Cohen. Are all abortions equal? should there be exceptions to the criminalization of abortion for rape and incest? Journal of Law, Medicine & Ethics, 43(1):87–104, 2015.
- Greasley [2017] Kate Greasley. Arguments about abortion: personhood, morality, and law. Oxford University Press, 2017.
- Mackenzie [2020] Catriona Mackenzie. Abortion and embodiment 1. In Women, medicine, ethics and the law, pages 73–92. Routledge, 2020.
- Pew [2022] Pew. America’s abortion quandry. https://www.pewresearch.org/religion/2022/05/06/americans-views-on-whether-and-in-what-circumstances-abortion-should-be-legal/, 2022.
- Hartig [2022] Hannah Hartig. Wide partisan gaps in abortion attitudes, but opinions in both parties are complicated. https://www.pewresearch.org/short-reads/2022/05/06/wide-partisan-gaps-in-abortion-attitudes-but-opinions-in-both-parties-are-complicated/, 2022.
- Eisenstein et al. [2011] Jacob Eisenstein, Amr Ahmed, and Eric P Xing. Sparse additive generative models of text. In Proceedings of the 28th international conference on machine learning (ICML-11), pages 1041–1048, 2011.
- Blei et al. [2003] David M Blei, Andrew Y Ng, and Michael I Jordan. Latent dirichlet allocation. Journal of machine Learning research, 3(Jan):993–1022, 2003.
- Peinelt et al. [2020] Nicole Peinelt, Dong Nguyen, and Maria Liakata. tbert: Topic models and bert joining forces for semantic similarity detection. In Proceedings of the 58th annual meeting of the association for computational linguistics, pages 7047–7055, 2020.
- Grootendorst [2022] Maarten Grootendorst. Bertopic: Neural topic modeling with a class-based tf-idf procedure. arXiv preprint arXiv:2203.05794, 2022.
- Wojcieszak et al. [2024] Magdalena Wojcieszak, Rong-Ching Chang, and Ericka Menchen-Trevino. Less partisan polarization in consumption of non-political youtube videos compared to news and political videos: Evidence from online data in the u.s. JQD:DM, 2024.
- Simon and Jerit [2007] Adam F Simon and Jennifer Jerit. Toward a theory relating political discourse, media, and public opinion. Journal of communication, 57(2):254–271, 2007.
- Saad [2022] Lydia Saad. Pro-choice identification rises to near record high in u.s. https://news.gallup.com/poll/393104/pro-choice-identification-rises-near-record-high.aspx, 2022.
- Pew [2012] Pew. Public divided over birth control insurance mandate. https://www.pewresearch.org/politics/2012/02/14/public-divided-over-birth-control-insurance-mandate/, 2012.
- Norrander and Wilcox [2023] Barbara Norrander and Clyde Wilcox. Trends in abortion attitudes: From roe to dobbs. Public Opinion Quarterly, page nfad014, 2023.
- Barbieri et al. [2022] Francesco Barbieri, Luis Espinosa Anke, and Jose Camacho-Collados. Xlm-t: Multilingual language models in twitter for sentiment analysis and beyond. In Proceedings of the Thirteenth Language Resources and Evaluation Conference, pages 258–266, 2022.
- [74] Media Bias/Fact Check. Media bias/fact check. https://mediabiasfactcheck.com/methodology/.
- McCabe et al. [2022] Stefan McCabe, Jon Green, Allison Wan, and David Lazer. New tweetscores, or, did donald trump break tweetscores? OSF Preprint OSF:ch8gj, 2022. URL https://osf.io/794va/.
- Warriner et al. [2013] Amy Beth Warriner, Victor Kuperman, and Marc Brysbaert. Norms of valence, arousal, and dominance for 13,915 english lemmas. Behavior research methods, 45:1191–1207, 2013.
- Dodds et al. [2015] Peter Sheridan Dodds, Eric M Clark, Suma Desu, Morgan R Frank, Andrew J Reagan, Jake Ryland Williams, Lewis Mitchell, Kameron Decker Harris, Isabel M Kloumann, James P Bagrow, et al. Human language reveals a universal positivity bias. Proceedings of the national academy of sciences, 112(8):2389–2394, 2015.
- Card et al. [2022] Dallas Card, Serina Chang, Chris Becker, Julia Mendelsohn, Rob Voigt, Leah Boustan, Ran Abramitzky, and Dan Jurafsky. Computational analysis of 140 years of us political speeches reveals more positive but increasingly polarized framing of immigration. Proceedings of the National Academy of Sciences, 119(31):e2120510119, 2022.
Appendix
3 Data Collection
3.1 Keyword Selection
Prior to collecting the tweets, we identified a set of keywords that are representative of the discourse about abortion in the United States by different sides, as detailed below. These keywords are listed in Table 1. We followed a three-pronged data collection strategy. We gathered tweets in real-time from June 25, 2022 to January 6, 2023. In addition, we leveraged Twitter Academic API’s Full-Archive Search 333https://developer.twitter.com/en/docs/twitter-api/tweets/search/api-reference/get-tweets-search-all to collect historical tweets from January 1, 2022 to June 24, 2022. In order to verify coverage, we use the count end-point from the Twitter API 444https://developer.twitter.com/en/docs/twitter-api/tweets/counts/api-reference/get-tweets-counts-all to compare the number of tweets in our collection versus the number of tweets identified on Twitter. We use the Full-Archive Search endpoint to recollect the data if the total number of tweets per day in our dataset is less than the number of tweets identified on Twitter. Twitter provides a language field in its tweet object using which we restrict our collection to English tweets. In all, we have 57,540,676 tweets made by 5,426,555 unique users.
| Category | Keywords |
|---|---|
| Neutral | #Abortion, #roevswade, #Roeverturned, #roevwade, abortion, roe vs wade, roe v wade, roe overturned |
| Pro-choice | #roevwadeprotest, roe v wade protest, pro choice, pro-choice, #prochoice, #forcedbirth, forced birth, #AbortionRightsAreHumanRights, abortion rights Are Human Rights, #MyBodyMyChoice, My Body My Choice, #AbortionisHealthcare, abortion is healthcare, AbortionIsAHumanRight, abortion is a human right, ReproductiveHealth, Reproductive Health, AbortionRights, abortion rights |
| Pro-life | #prolife, pro life, pro-life, #EndAbortion, end abortion, #AbortionIsMurder, Abortion Is Murder, #LifeIsAHumanRight, Life Is A Human Right, #ChooseLife, Choose Life, #SaveTheBabyHumans, Save The Baby Humans, #ValueLife, Value Life, #RescueThePreborn, Rescue The Preborn, #EndRoeVWade, End Roe V Wade, #LifeMatters, Life Matters, #MakeAbortionUnthinkable, make abortion unthinkable, #LiveActionAmbassador, Live Action Ambassador, Abortion Is Not A Right, #AbortionIsNotARight, #AbortionIsRacist, Abortion is racist, anti life, #antilife |
3.2 Keyword Collection
To identify the set of relevant keywords to serve as search terms for the Full-Archive Search endpoint of Twitter Academic API, we conducted an exploratory data collection of abortion-focused discussions reflecting different political stances. The identified keywords represent both phrases and hashtags. We then build a systematic data collection pipeline.
3.2.1 Hashtag Sampling
We identified seed hashtags reflecting different sides of the abortion debate: #roevwade (neutral), #prochoice (pro-abortion), and #prolife (anti-abortion). We collected tweets mentioning these hashtags using Twitter API.555https://developer.twitter.com/en/docs/twitter-api/tweets/search/api-reference/get-tweets-search-recent We identified hashtags that frequently co-occur with the seed hashtags within tweets. For #prochoice, these include #roevwadeprotest, #forcedbirth, #AbortionRightsAreHumanRights, #MyBodyMyChoice, #abortionishealthcare, #abortionisahumanright, #ReproductiveHealth, and #abortionrights; for #prolife, these include #EndAbortion, #AbortionIsMurder, #LifeIsAHumanRight, #ChooseLife. #valueLife, #rescuethepreborn, #endroevwade, #lifematters, #antilife, #makeabortionunthinkable, #liveActionAmbassador,#catholic, #AbortionIsNotARight, and #Abortionisracist; and for #roevswade these include #Abortion, #Roeverturned.
3.2.2 Creating keywords
Not all Twitter users include hashtags in their tweets. Therefore, we create a list of keywords based on the above hashtags by simply removing # from the hashtags. We break up composite hashtags into phrases (e.g., #makeabortionunthinable becomes “make abortion unthinkable”). The final set of hashtags and phrases shown in Table 1 forms the search terms in our query. Specifically, we create a search query connecting keywords with the ’OR’ operator, which tells the search endpoint to return tweets that have at least one keyword in it. The search is not case-sensitive. We removed non-English tweets from the dataset.
4 Classifiers
We used state-of-the-art statistical and language models to classify users’ political ideology, emotions, hate speech, toxicity, insults, and obscenities in the text of the tweets Rao et al. [2021], Alhuzali and Ananiadou [2021], Hanu and Unitary team [2020], Barbieri et al. [2022]. Below, we present the additional details on the models and the validations we executed to ensure reliability of predictions.
4.1 User Ideology
We estimate each individual’s ideological leaning as the weighted average of the political bias scores of the URLs they share. These bias scores are determined by Media Bias-Fact Check (MBFC) Check , which scores more than 3K Pay-Level Domains (PLDs) as Left/Hardline Liberal (score=), Left-Center (), Least-Biased/Center (), Right-Center (), Right/Hardline Conservative (). We use tldextract 666https://github.com/john-kurkowski/tldextract to extract pay-level domains from URLs in tweets. We filter out tweets and retweets containing pay-level domains that are not categorized under either of the two ideological polarities of interest (Table 2).
| Dimension | Polarity | Pay-Level Domains |
|---|---|---|
| Politics | Left | cnn.com, huffpost.com, dailybeast.com, (350+ PLD s) |
| Center-Left | aljazeera.com, independent.co.uk, lincolnproject.us (500+ PLDs) | |
| Center | gallup.com, pewresearch.co.uk, wikipedia.com (500+ PLDs) | |
| Center-Right | bostonherald.com, chicagotribune.com, wsj.com (250+ PLDs) | |
| Right | foxnews.com, gppusa.com, thenationalherald.com (250+ PLDs) |
The model described in Rao et al. [2021] works in two passes. In the first pass, we identify the ideology of users who embed URLs from sources/domains with known ideological leaning in their tweets. This is done by computing the weighted-average of domain scores of the URLs as provided by Media Bias-Fact Check Check . More specifically, we calculate user ’s scores along the ideological dimension using Eq. 1. We denote the set of pay-level domains shared by user as . These include only the domains appearing in ’s original tweets (and not retweets). returns the ideological leaning of each domain as provided in Check .
| (1) |
These scores are then binarized with a threshold of for liberals () and for conservatives () and are used to train a text-based classifier to predict user ideology in the second pass.
The first pass identifies ideology for a smaller subset of users in the dataset as not all users embed their tweets with URLs to external sources. In the second pass, the approach in Rao et al. [2021] leverages a fastText embedding model pre-trained on Twitter data Pagliardini et al. [2018] to generate embeddings for user’s tweets over time. These embeddings serve as features to train a Logistic Regression classifier to predict the binarized ideological leanings for all users, including users who have not shared URLs from domains in the MBFC. We categorized users as liberal or conservative by binarizing the output of logistic regression using threshold of 0.5. In all, we were able to label the ideology of all 5.4M users in our data. The logistic regression model achieves a F1 score of 86% (93% accuracy, 88% precision, 84% recall) on a held out test-set from the first pass. Given that this classifier was binarized, identifying moderate users was not possible. Out of the users in our dataset, (77%) were labeled liberal and (23%) were labeled conservative. Of the users who share original content (not retweets, replies or quoted tweets), (79%) of them are liberal and (21%) are conservative. Liberal users were also found to be more active compared to conservative users in our dataset with a tweets per user as opposed to for conservatives (see Table. 3).
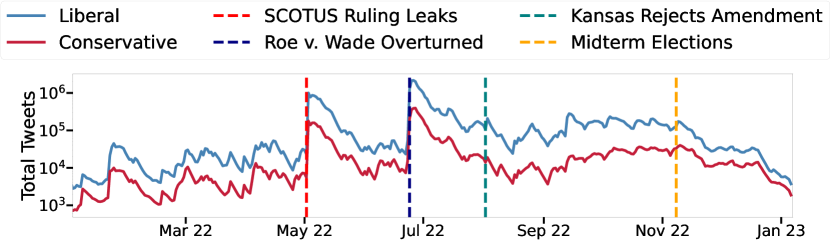
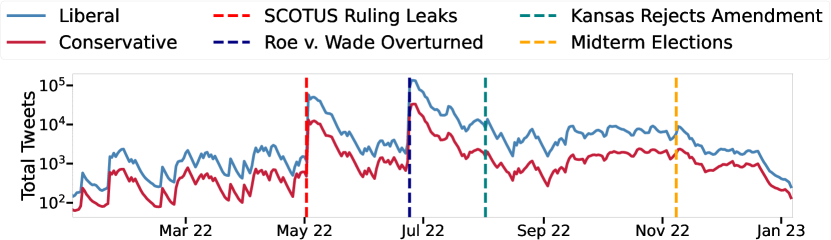
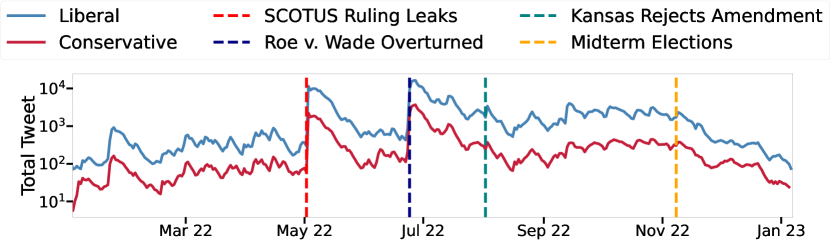
Figure 5 shows the total number of tweets disaggregated by user partisanship.777All time series plots use exponential smoothing.
| Liberals | Conservatives | Total | |
|---|---|---|---|
| Tweets | 48,589,545 | 8,951,131 | 57,540,676 |
| Users | 4,188,214 | 1,238,341 | 5,426,555 |
| Original Tweets | 2,839,513 | 706,552 | 3,546,065 |
| Retweets | 39,410,734 | 6,050,761 | 45,561,495 |
| Replies | 5,610,747 | 1,968,619 | 7,579,366 |
| Quoted Tweets | 661,551 | 192,199 | 853,750 |
4.1.1 Validation
| Metric | Ideal-Point Estimate Barberá [2015] | Elite Average Wojcieszak et al. [2024] |
|---|---|---|
| Accuracy | 0.81 | 0.83 |
| Fleiss Kappa | 0.49 | 0.52 |
| Jaccard Overlap | 0.83 | 0.87 |
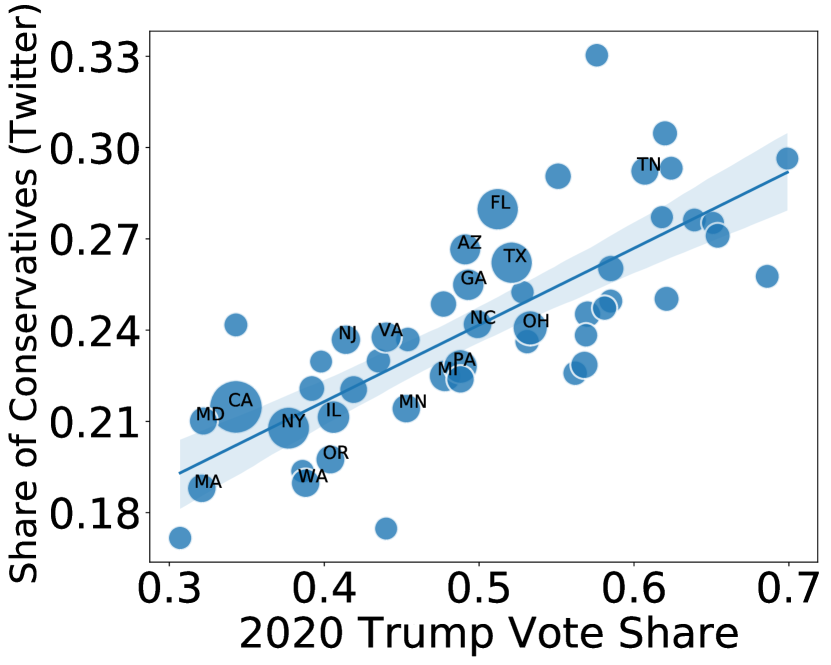
In order to assess the validity of our ideology estimates, we first compare them, at the state level, against percentage of votes for President Donald Trump in the 2020 Presidential elections. More specifically, relying on the geolocation inference technique discussed previously Dredze et al. [2013], we isolate users to respective states. We then calculate the proportion of each state’s users who are conservative and assess its similarity to the state’s Trump vote share. Figs. 6(a) and (b) show the share of conservative Twitter users in each state and the percentage of votes for Trump in the 2020 Federal elections. The ideology estimates using the two approaches are considerably similar. The strong state-level correlation (Pearson’s ) between these two measures, shown in Fig. 6(c), also affirms the validity of this approach.
In addition, we perform further validation of the user ideology estimates by comparing our estimation approach to the results of prior methods that are based on 1) the structure of follow interactions Wojcieszak et al. [2024], Barberá [2015] and 2) domain sharing behaviors Rao et al. [2021]. More specifically, Barberá [2015] infers user ideology based on the Twitter accounts the user follows. The underlying assumption is that users follow political figures with congruent views. McCabe et al. [2022] applied the same methodology using an updated list of political figures, and Wojcieszak et al. [2024] used it to infer the ideology of a set of Twitter users. In contrast, Ref. Rao et al. [2021] relied on content in the form of URLs and tweet text to draw estimations on user political leaning. Note that neither of these alternative methods applies to all users in our dataset. We compare the ideology estimated by the different methods on a subset of 252,492 users that overlap across the three methods Barberá [2015], Wojcieszak et al. [2024], Rao et al. [2021] in Table 4. The methods discussed in Barberá [2015], Wojcieszak et al. [2024] rely on expensive to collect follow relationships and curating estimates using these approaches for all 5.5M users can be cumbersome. Relying on features in text offers greater flexibility. In addition to this, the estimates of user ideology used in Rao et al. [2021] agree highly with previous methods. In comparison to Wojcieszak et al. [2024], our estimates were 81% accurate and in comparison to the ideal-point estimates in Wojcieszak et al. [2024] and 83% when compared to Barberá [2015] (Table 4). Additionally, using Jaccard scores as a measure of similarity, our ideology classification has 98% Jaccard similarity to Wojcieszak et al. [2024] and 83% to Barberá [2015] (Table 4).
| Ideology | Ideal-Point EstimateBarberá [2015] | Elite Average Wojcieszak et al. [2024] | URL+Text EmbeddingRao et al. [2021] |
|---|---|---|---|
| Liberal | 72% | 75% | 79% |
| Conservative | 28% | 25% | 21% |
We provide further validation by presenting figures of the total number of tweets over time by partisanship across different user ideology methodologies - neighborhood elite averages (Ref. Wojcieszak et al. [2024], ideal point estimates Barberá [2015] and URL-text features Rao et al. [2021]) in figure 8. We can clearly see that the highs and lows in the time series for various ideological methods closely mirror each other.
As an additional validation, we assess the prominent hashtags used by liberals and conservatives (Fig. 7. We find that conservative users were roughly 1.5 more likely to use hashtags such as “makeabortionunthinkable” or “safethebabyhumans.” In turn, liberal users were more likely to use hashtags such as “abortionisaumanright” or “forcedbirth.” By plotting the log odds ratios of the top-10 most frequently used hashtags, we find that some hashtags, although not necessarily abortion related, express ideology, as indicated by the liberals’ usage of hashtags such as “voteblue2022”, “onev1” and “wtpblue” in comparison to “god”, “trump2024”, “2000mulesmovie”, used by conservatives. We provide further validation by presenting figures of the total number of tweets over time by partisanship across different user ideology methodologies in Fig. 8. We can clearly see that the the peaks in the time series for various ideological methods closely mirror each other.
In conclusion, our estimates of user ideology are highly accurate, as determined by validating them with estimates from alternate methods and using the text of the tweets, and can be applied successfully to infer the ideology of most users in our dataset.
4.2 Geolocation
We utilized Carmen Dredze et al. [2013] 888https://github.com/mdredze/carmen-python, a geo-location identification technique for Twitter data to assign tweets to locations within the U.S. This method leverages tweet metadata, including “place” and “coordinates” objects that encode location information, such as country, city, and geographic coordinates. Additionally, the technique uses mentions of locations in a user’s bio on Twitter to infer their location. A manual review confirmed that this approach was effective in identifying a user’s home state. Among the 57M tweets in our dataset, state-level locations were inferred for about 15M tweets. California, New York, Florida and Texas together accounted for roughly 39% of all tweets from the US. California, in particular, accounted for the most activity (14%) among all states in the US as detailed in Table 6.
| State | Count | Percent |
|---|---|---|
| California | 1913971 | 14.82 |
| New York | 1027713 | 7.96 |
| Florida | 1013958 | 7.85 |
| Texas | 1003907 | 7.77 |
| Ohio | 552474 | 4.28 |
| Pennsylvania | 527912 | 4.09 |
| Illinois | 461500 | 3.57 |
| Michigan | 414321 | 3.21 |
| Arizona | 397988 | 3.08 |
| Georgia | 384480 | 2.98 |
| District of Columbia | 349089 | 2.70 |
| Virginia | 345393 | 2.67 |
| New Jersey | 300889 | 2.33 |
| Oregon | 282594 | 2.19 |
| Minnesota | 263161 | 2.04 |
| North Carolina | 260194 | 2.02 |
| Washington | 256440 | 1.99 |
| Massachusetts | 251572 | 1.95 |
| Tennessee | 228870 | 1.77 |
| Maryland | 225423 | 1.75 |
| Colorado | 220164 | 1.71 |
| Wisconsin | 206368 | 1.60 |
| Missouri | 195743 | 1.52 |
| South Carolina | 159713 | 1.24 |
| Nevada | 156149 | 1.21 |
| Indiana | 152024 | 1.18 |
| Louisiana | 144701 | 1.12 |
| Connecticut | 124563 | 0.96 |
| Alabama | 95774 | 0.74 |
| Kentucky | 91538 | 0.71 |
| Oklahoma | 87046 | 0.67 |
| New Hampshire | 72467 | 0.56 |
| Kansas | 72392 | 0.56 |
| New Mexico | 71068 | 0.55 |
| Iowa | 70547 | 0.55 |
| Utah | 63257 | 0.49 |
| Nebraska | 50987 | 0.39 |
| Hawaii | 49066 | 0.38 |
| Arkansas | 47666 | 0.37 |
| West Virginia | 47434 | 0.37 |
| Idaho | 42808 | 0.33 |
| Washington, D.C. | 34856 | 0.27 |
| Rhode Island | 32603 | 0.25 |
| Mississippi | 31179 | 0.24 |
| Montana | 29910 | 0.23 |
| Alaska | 25908 | 0.20 |
| Vermont | 20725 | 0.16 |
| South Dakota | 13703 | 0.11 |
| Maine | 11177 | 0.09 |
| North Dakota | 10954 | 0.08 |
| Wyoming | 9887 | 0.08 |
| Delaware | 8110 | 0.06 |
4.3 Tweet-Level Predictions
Using state-of-the-art classifiers we identify anger, fear, sadness, joy, hateful and toxic speech, obscenities and insults in the content of the tweets. Statistics on the tweets are shown in Table 7.
| Affect | #All Tweets | #Original Tweets |
|---|---|---|
| Anger | 27,899,673 | 1,564,102 |
| Fear | 2,577,870 | 153,749 |
| Sadness | 4,240,726 | 300,601 |
| Joy | 3,754,015 | 289,424 |
| Hate Speech | 1,359,485 | 151,090 |
| Toxicity | 5.837,417 | 410,759 |
| Obscenity | 2,154,141 | 186,208 |
| Insult | 1,157,443 | 100,749 |
4.3.1 Correlation
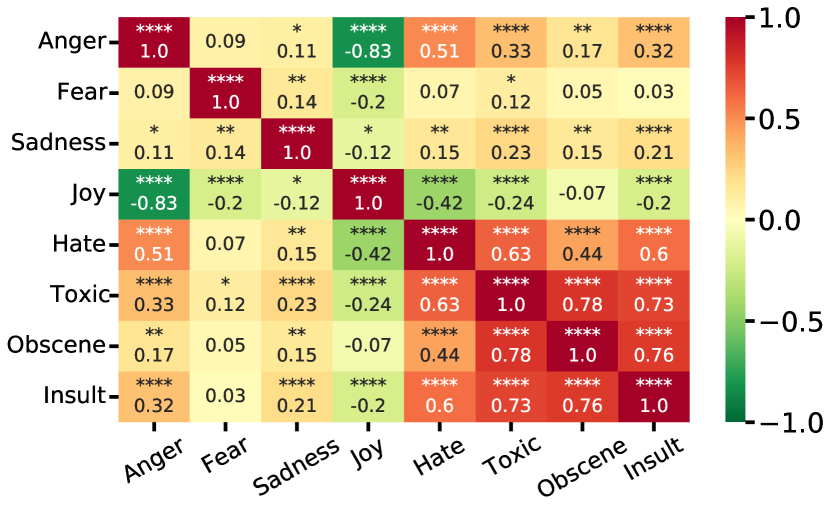
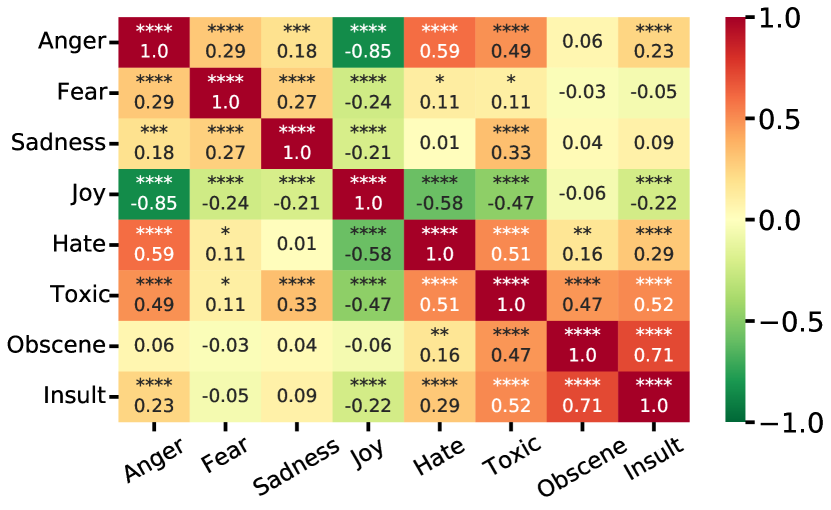
We then proceeded to compute the correlations among the temporal patterns of emotions, hate speech, obscenity, and insult, focusing on individuals with liberal and conservative affiliations (see Fig. 9). Upon examining these correlations, we uncovered intriguing dissimilarities between the two groups.
| Feature Name | Liberal | Conservative | -value |
|---|---|---|---|
| Mean Fraction of Anger | 0.434 | 0.416 | |
| Mean Fraction of Fear | 0.048 | 0.037 | **** |
| Mean Fraction of Sadness | 0.072 | 0.079 | **** |
| Mean Fraction of Joy | 0.110 | 0.150 | **** |
| Mean Fraction of Hate Speech | 0.020 | 0.041 | **** |
| Mean Fraction of Toxicity | 0.085 | 0.107 | **** |
| Mean Fraction of Obscene | 0.032 | 0.011 | **** |
| Mean Fraction of Insult | 0.015 | 0.010 | ** |
| Mean Fraction of Positive Sentiment | 0.089 | 0.096 | |
| Mean Fraction of Negative Sentiment | 0.634 | 0.605 | *** |
| Mean Fraction of Neutral Sentiment | 0.276 | 0.299 | *** |
| Fraction of Original Tweets | 0.066 | 0.091 | **** |
| Fraction of Quoted Tweets | 0.013 | 0.021 | **** |
| Fraction of Retweets | 0.818 | 0.687 | **** |
| Fraction of Replies | 0.115 | 0.219 | **** |
| Total Number of Unique Partisan Users | 4,882,120 | 1,421,454 | |
| Total Number of Tweets | 48,589,545 | 8,951,131 |
| Feature Name | Liberal | Conservative | -value |
|---|---|---|---|
| Mean Fraction of Anger | 0.346 | 0.366 | *** |
| Mean Fraction of Fear | 0.041 | 0.033 | **** |
| Mean Fraction of Sadness | 0.073 | 0.075 | |
| Mean Fraction of Joy | 0.142 | 0.182 | **** |
| Mean Fraction of Hate Speech | 0.026 | 0.047 | **** |
| Mean Fraction of Toxicity | 0.082 | 0.096 | **** |
| Mean Fraction of Severe Toxicity | 0.0007 | 0.0005 | **** |
| Mean Fraction of Obscene | 0.033 | 0.023 | **** |
| Mean Fraction of Threat | 0.001 | 0.003 | **** |
| Mean Fraction of Insult | 0.021 | 0.014 | **** |
| Mean Fraction of Positive Sentiment | 0.086 | 0.101 | * |
| Mean Fraction of Negative Sentiment | 0.483 | 0.518 | **** |
| Mean Fraction of Neutral Sentiment | 0.429 | 0.379 | **** |
| Total Number of Unique Partisan Users | 870,145 | 234,699 |
| Emotion | Accuracy | Precision | Recall | F1 |
|---|---|---|---|---|
| Anger | 0.829 | 0.657 | 0.900 | 0.795 |
| Fear | 0.956 | 0.700 | 0.618 | 0.656 |
| Joy | 0.955 | 0.608 | 0.925 | 0.733 |
| Sadness | 0.941 | 0.400 | 0.744 | 0.520 |
Anger exhibited a strong association with fear among conservatives, whereas this connection was not evident among liberals. A surge in the expression of anger on a given day displayed strong links with heightened sadness, hate speech, and toxicity for conservatives. In contrast, liberals demonstrated a more pronounced tendency to employ obscenities and insults in conjunction with anger. Furthermore, fear among conservatives exhibited heightened correlations with sadness and an increased proclivity toward employing hate speech compared to liberals. The expression of sadness by liberals concurrently manifested an elevated use of hate speech, a phenomenon not observed among conservatives. Additionally, liberals exhibited a proclivity for utilizing more insults and obscenities when experiencing sadness, while conservatives displayed a higher incidence of toxic behavior. Moreover, when liberals exhibited heightened toxicity, they also displayed a greater propensity for hate speech, insults, and obscenities compared to conservatives.
4.3.2 Emotions
For our emotion detection task, we employed SpanEmo Alhuzali and Ananiadou [2021], a state-of-the-art multi-label emotion detection model. This model was fine-tuned using the SemEval 2018 Task 1e-c dataset Mohammad et al. [2018]. SpanEmo, using a transformer-based architecture. It surpasses previous methods in its ability to capture the correlations among various emotions. When presented with the text of a tweet, the model generates confidence scores for the presence of a wide spectrum of emotions. We later bin these confidence scores using a threshold to binarize the output. The emotions it can identify include anticipation, joy, love, trust, optimism, anger, disgust, fear, sadness, pessimism, and surprise. In this study, we focus on the four basic emotions of anger, fear, sadness and joy. We compare the performance of the classifier against a manually coded sample of tweets (See Table 12). The performance is shown in Table 10. Barring sadness, the model’s performance is fairly robust as noticed by the high F1 scores. We show the daily share of all tweets expressing anger, fear, sadness and joy for liberals and conservatives in Fig. 10(a)-(d).
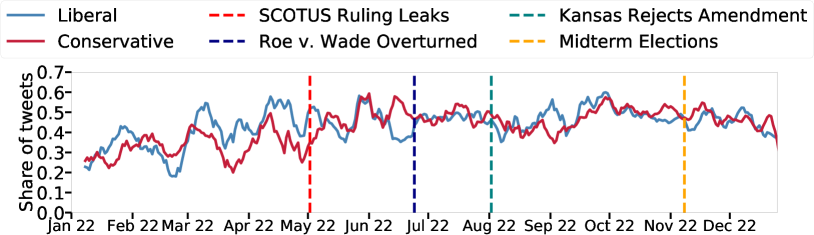
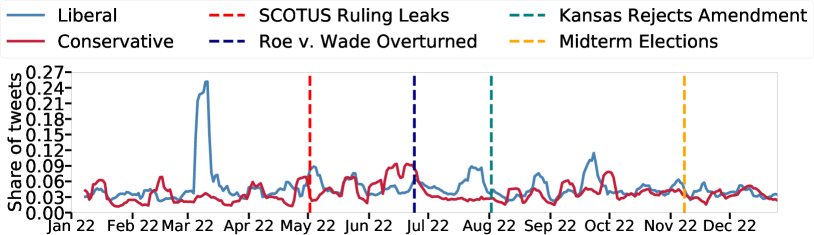
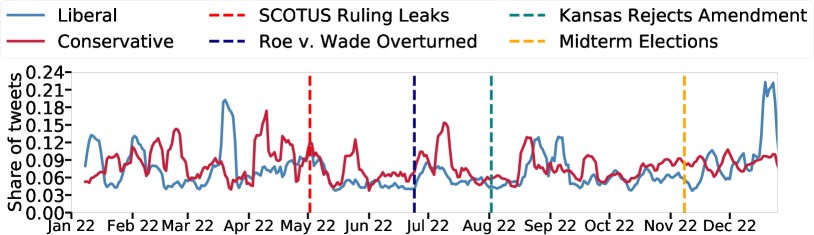
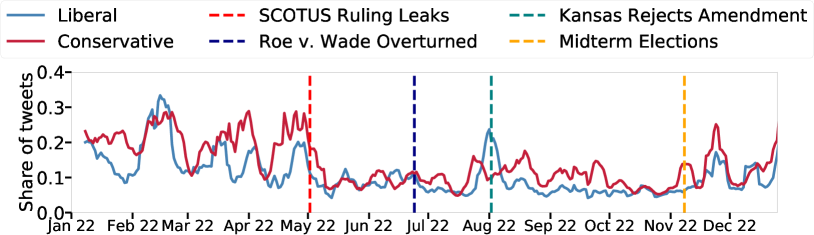
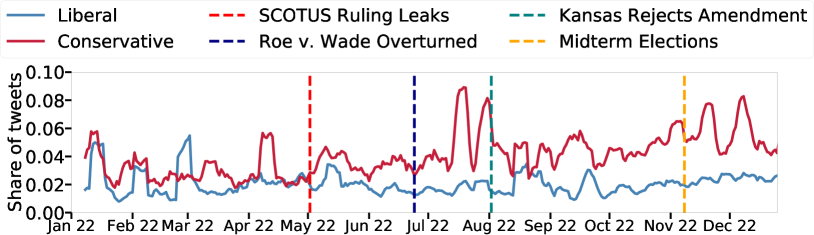
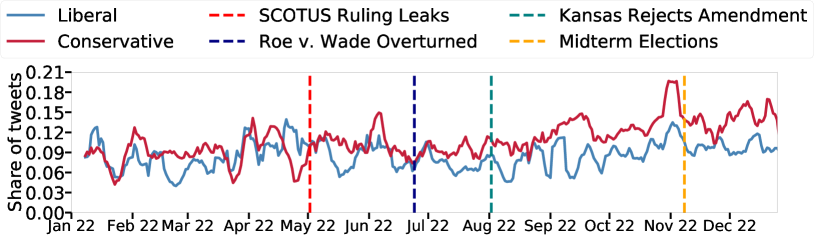
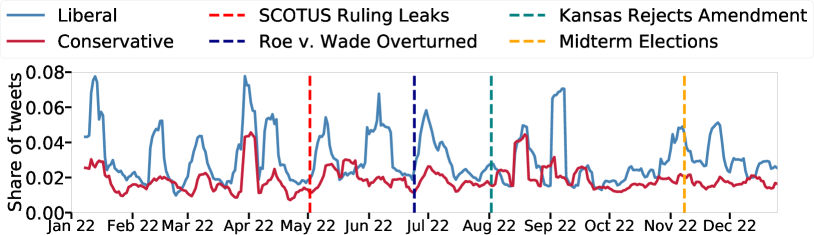
4.3.3 Hate Speech
Dictionary based detection of hateful content Siegel et al. [2021] often struggles to factor in context. In this study, we use the hate speech detection model 999https://huggingface.co/cardiffnlp/twitter-roberta-base-hate described in Barbieri et al. [2020]. This model was trained on a Twitter data retrained RoBERTa Liu et al. [2019] model, further finetuned on the SemEval-2019 Task 5’s HatEval dataset as a downstream task. The HatEval dataset discussed in Basile et al. [2019] predominantly comprises of a multilingual dataset of hate speech tweets against women and immigrants. Given that our study primarily revolves around the abortion rights debate in the U.S., a model finetuned to detect hate speech against women is ideal. The classifier provides a continuous value from 0 to 1 as its output which quantifies the model’s confidence of a piece of text expressing hate. We then binarize this using a threshold to classify the tweet as hate () and not-hate ().
4.3.4 Toxicity
To measure toxicity in tweets, we used Detoxify Hanu and Unitary team [2020], an open-source classifier. Detoxify is trained on multi-label toxic comment classification task to predict the level of toxicity in a tweet. The model outputs a score (a continuous value between 0 to 1) that captures the likelihood the tweet expresses toxicity, severe toxicity, obscenity, a threat, an insult, or an identity attack. Figure 10(f)-(j) shows the share of daily tweets expressing toxicity, obscenity, insults, severe toxicity and threat for liberals and conservatives. Our dataset contains more tweets expressing toxic, obscene and insulting tweets than threats or severe toxicity. Less than 1% of the tweets in our dataset expresses severe toxicity and less than 2% involve threats. As such, these two aspects are not analyzed in this work. Toxicity of both liberal and conservative users increases over time, suggesting rising partisan animosity. Liberal users also use more insulting and obscene language in their tweets than conservative users. All types of toxic language increase suddenly on the day of the Dobbs ruling.
4.3.5 Sentiment
Sentiment classification is more simplified in comparison to emotion detection. Instead of the more nuanced categorization of an individual’s feeling at an instant, sentiment classification aims to identify whether the feeling is positive, negative or neutral. Lexical approaches Warriner et al. [2013], Hutto and Gilbert [2014], Dodds et al. [2015] have been extensively leveraged by prior studies to identify sentiment expressed in a body of text. The lack of contextual cues and use of free flowing text and slang influenced the use of large language models to classify sentiment. Sentiment provides a robustness check on inferences drawn from emotions.
We used a roBERTa based sentiment model fine-tuned on 58M tweets described in Barbieri et al. [2022] to classify the sentiment of tweets as positive, neutral or negative. We validated the classifier results against the manually coded tweets showing good performance (see Table 11).
| Sentiment | Accuracy | Precision | Recall | F1 |
|---|---|---|---|---|
| Positive | 0.959 | 0.743 | 0.714 | 0.728 |
| Negative | 0.858 | 0.825 | 0.952 | 0.884 |
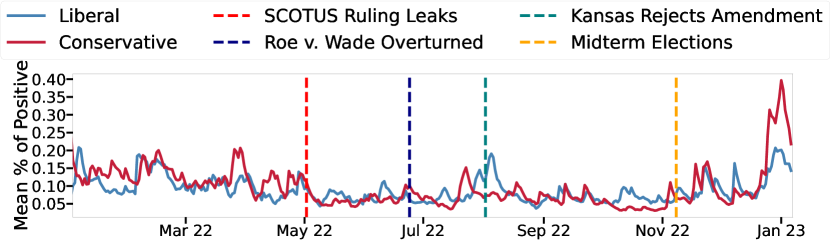
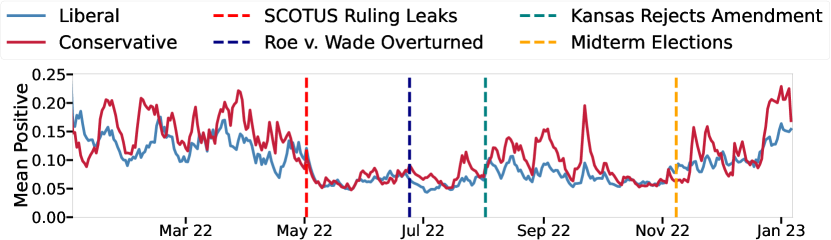
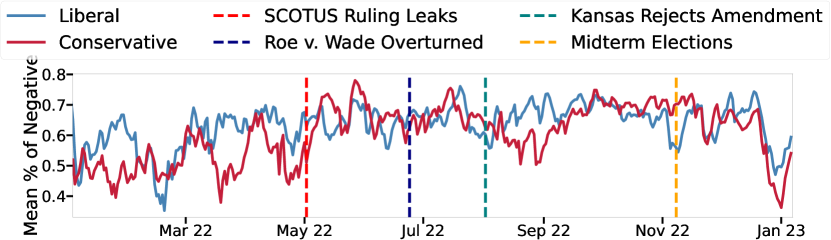
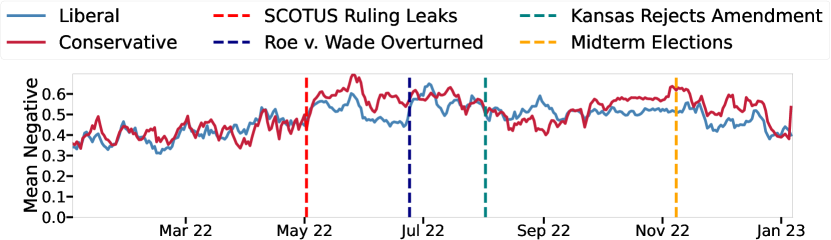
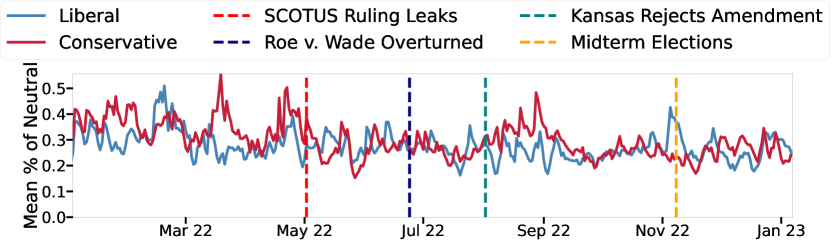
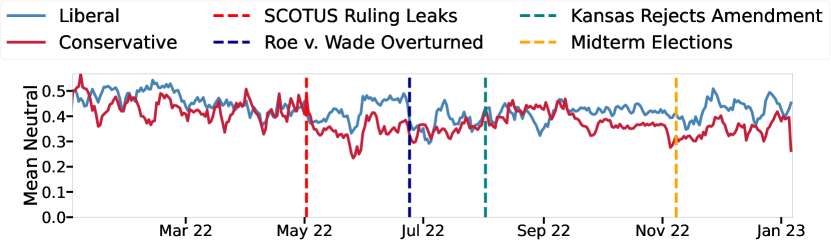
We found that overall, 61% of tweets have a negative sentiment, 30% are neutral, and 9% of tweets have positive sentiment. This stands in stark contrast to the strong positivity bias of human language, including much of online speech Dodds et al. [2015]. Figure 11 shows the fraction of daily tweets with positive, negative, and neutral sentiment over time. We observe that a larger portion of the tweets by conservatives are positive than for liberals (also see Table 8) in line with what we saw in Fig. 1(e).
Conservative users post marginally more negative original tweets as a share of total tweets compared to liberal users, although the majority of tweets by both liberal and conservative users have negative sentiment. Similar observations were made in Fig. 1(b). We also observe an increase in the fraction of negative tweets after the leak, especially among conservatives, in agreement with the rise of anger in that group. Decrease in positive sentiment by both sides following the leak is similar to the suppression of joy.
4.3.6 Validation Codebook
We validated the emotions, and sentiment classifiers using manual coding. The codebook for human annotators is specified below. Human annotators categorized the emotions, hateful content, and sentiment of each tweet. Following are the concepts, categories, and examples of each variable. After 2 training sessions, 2 graduate coders coded independently through the same 100 tweets to establish inter-coder reliability for - anger (), fear(), sadness (), joy (), and sentiment (). The two coders then coded 450 tweets each to have a manual coding sample to validate the machine coding result. We show the validation results of the automatic classifiers in the following sessions.
| Affect | Type | Label | Example |
| Emotions | Anger | 0 = No, 1 = Yes. | (yes) @KenPaxtonTX Stop wasting our money. Wtf is wrong with you. How the hell do ppl keep voting for you. WE CANT AFFORD GAS AND YOURE WORRIED ABOUT THIS SHIT. |
| Fear | 0 = No, 1 = Yes. | (yes) An abortion ban will result in more men committing murder. This isn’t hysteria or a false panic. It’s an objective truth. Homicide is the number 1 cause of death for pregnant women. Boyfriends and husbands who don’t want to have a baby will take matters into their own hands. | |
| Sadness | 0 = No, 1 = Yes. | (yes) @RexChapman My mum had a stillborn before I was born in 1969, and she had to carry it to term, from about 7-8 months pregnant. It nearly killed her. | |
| Joy | 0 = No, 1 = Yes. | (yes) @GovWhitmer Thank you for fighting for us. | |
| Sentiment | 0 = negative | @shaylarmyers @RickCarusoLA thinks LA voters are stupid. He’s lying through his teeth cuz he knows no anti-abortion candidate could every win in LA. He lost the primary he will lose the general. | |
| 1 = positive | @GovWhitmer Thank you for fighting for us | ||
| Hateful speech | 0 = no | "These crimes against the people will never be completely ended — and the guarantee of reproductive care and justice will never be fully realized until capitalism is defeated." @PopResistance nhttps://t.co/qLBPTDgG9L | |
| 1 = yes | Calling Evangelicals for Biden…anyone home? We are truly seeing the madness, the incredible evil, of the secular left. They LOVE death, they LOVE abortion, and they will take YOUR tax dollars to make sure babies can die *everywhere.* https://t.co/AFBUmjLFTC |
4.4 Interrupted Time Series Analysis
We use interrupted time series design to quantify the fluctuations in online expressions, test their significance and disentangle the heterogeneous effects of user ideology. Interrupted time series analysis Wagner et al. [2002] identifies discontinuities in trends in response to a treatment, in our case an event. The four events we focus on are: the leak of SCOTUS’s draft ruling (May 3rd, 2022), the official Dobbs ruling (June 24th, 2022), the Kansas referendum (August 3rd, 2022) and the US midterm elections (November 8, 2022), all of which generated online discussions about abortion rights. We examine changes in trends at a 4-hour resolution over a time period covering the week preceding and following the event (see Fig. 13). Our regression models are designed to quantify the discontinuity in affect within each ideological group immediately after the event. We define separate regression models for liberals and conservatives. A more positive coefficient for the regression coefficient indicates that the group (liberal or conservative) had an increase in the outcome.
We define two separate regression models, one for each ideological group, to identify discontinuities in trends in response to a the events. The models are specified as:
where, the outcome variable, is the share of tweets that in a 4-hour window that express a particular affect. is a continuous variable indicating the time passed in number of 4-hour windows since the occurrence of the event (treatment), treatment is a dummy variable encoding whether the time window was before or after the event (before = 0, after = 1) and, days post treatment is a continuous variable with 0 before the treatment and the number of 4-hour windows passed since the treatment. is the slope of the trend in affect before the event, is the change in slope post-event, and is the “jump” in affect immediately post the event’s occurrence. We model this separately for liberals and conservatives for each affect of interest and using , we test the hypothesis that affect increased/decreased for a particular group immediately post-event.
In Fig. 13, we present regression plots illustrating the trends for liberals and conservatives before and after the event. The light-blue and light-red scatter points denote the pre-event trends for liberals and conservatives, while the dark-blue and dark-red scatter points depict their respective post-event trends. We see significant shifts in the regressions post occurrence for most events as discussed in the main paper.
| Ruling Leak | ||||||
|---|---|---|---|---|---|---|
| Official Ruling | ||||||
| Kansas Referendum | ||||||
| Midterm Elections |
4.5 Frames
To identify and measure the prevalence of key aspects of the abortion rights debate in the U.S., we first curated phrases and keywords that can identify discourse related to religion, bodily autonomy, fetal personhood, women’s rights and fetal viability in the context of abortion. The curation of these phrases and keywords is done by leveraging, SAGE, a keyword extraction method discussed in Eisenstein et al. [2011]. SAGE identifies keywords by assigning each word in a document a score that represents its prominence compared to a baseline document. More specifically, SAGE calculates the deviation in log-frequencies of words from a baseline lexical distribution.
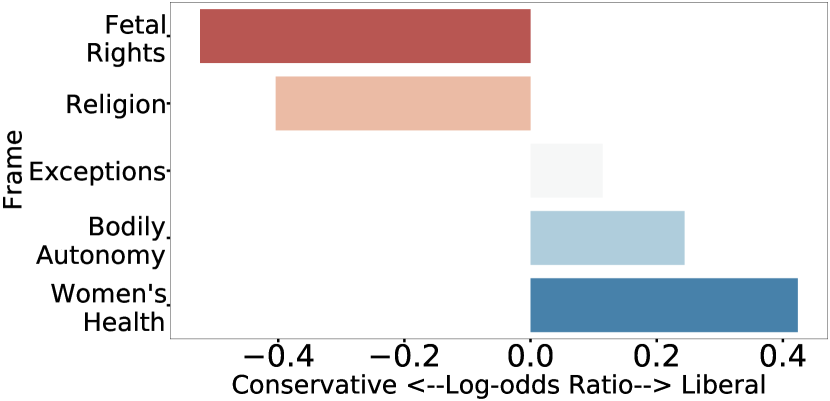
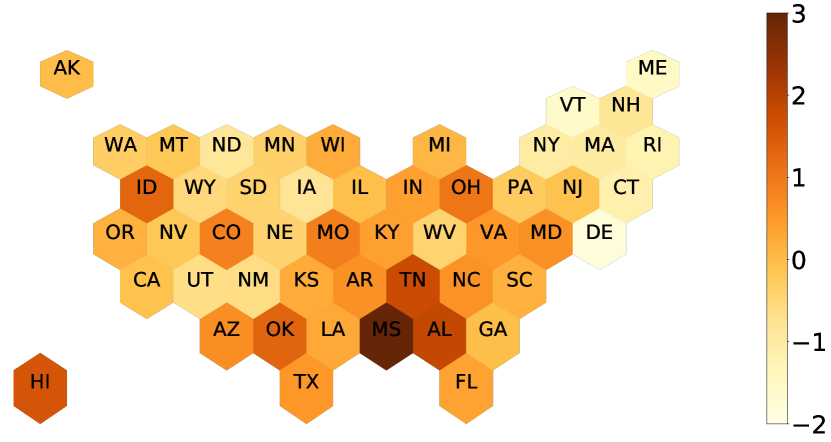
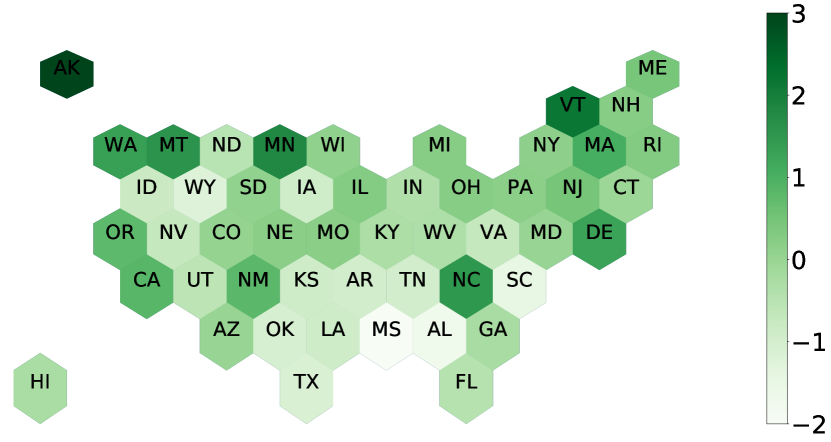
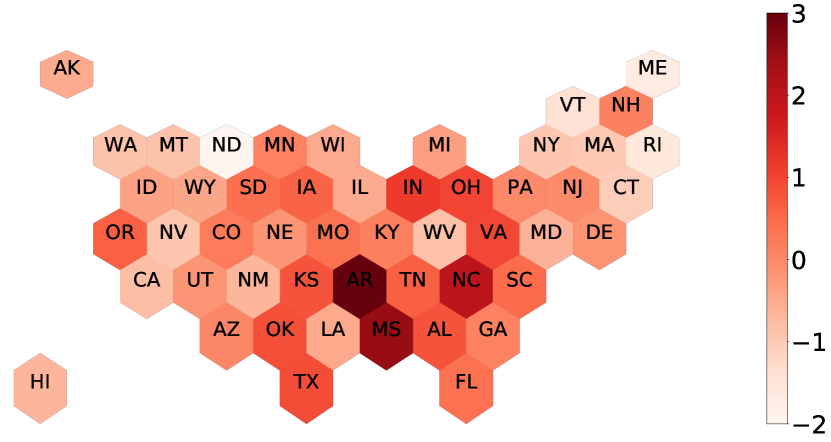
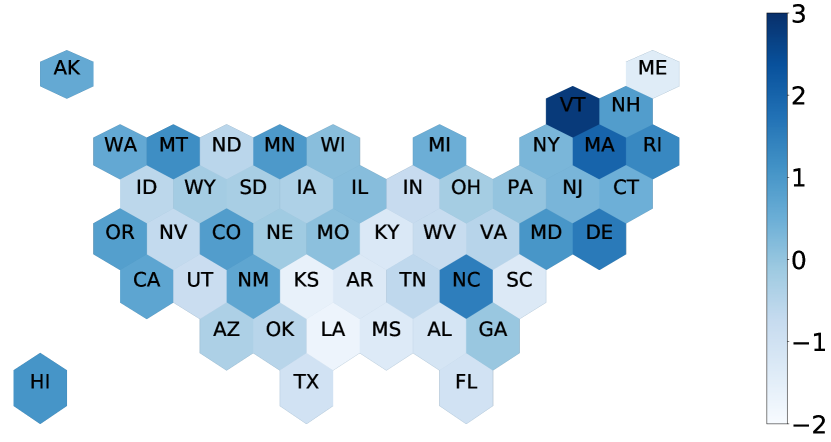
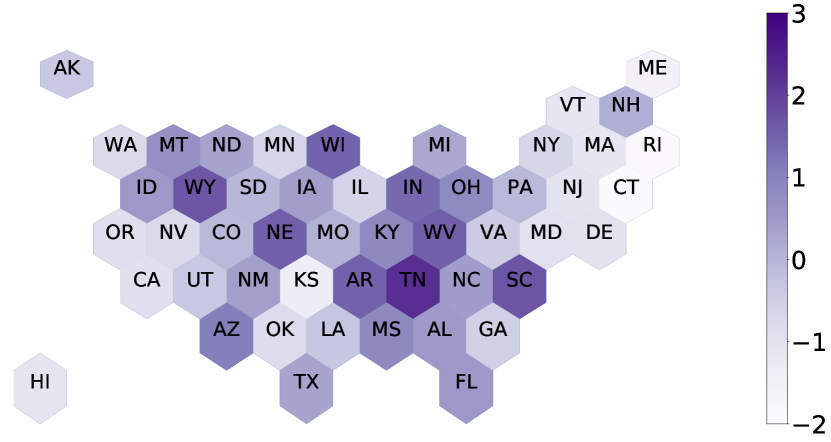
We applied SAGE on frame-relevant Wikipedia articles (See Table 14) while using a random concatenation of articles across all five frames as a baseline document. We use SAGE to identify frame-relevant n-grams, when . We manually verified the keywords identified by SAGE to ensure precision and relevance. Table 15 lists all the keywords/phrases extracted for each frame. While advances have been made in topic-modeling approaches Blei et al. [2003], Peinelt et al. [2020], Grootendorst [2022], the stochasticity in terms of topics detected dictated our choice towards a statistical approach in Eisenstein et al. [2011] that allowed us to define the frames of interest.
Upon identifying relevant phrases, we identify tweets that contain them. The statistics of tweets identified using this approach are shown in Table 16. The goal is to automatically identify all words used in association with these anchors, i.e., words that were used significantly more frequently to modify frame-relevant terms than general terms. More specifically, these modifying terms are adjectives, verbs, and nouns that are associated with the anchor term. We identify them by applying part-of-speech tagging 101010https://spacy.io/usage/linguistic-features#pos-tagging and dependency parsing 111111https://spacy.io/api/dependencyparser on all tweets identified to be frame-relevant.
In the next step, our goal is to automatically identify all words used in association with the anchor terms described in Table 15. These identified words are ones that likely to be used by liberals and conservatives to modify their abortion related discourse. To identify modifying words, we applied part-of-speech and dependency parsing to all frame-relevant tweets (See Table 16. The dependency parsing adopted rules discussed in Card et al. [2022] and is shown in Table 17. For a given anchor term and frame, we collected all adjectives, verbs, and nouns that follows these dependency relations to the anchor term. For example, we collected the adjective modifier “harmful” directed towards the anchor term “prolife” in the phrase “harmful prolife”. Using this approach, we collected five different corpora, one for each frame that consists of all the adjectives, nouns and verbs that modify the issue-relevant anchors.
| Frame | Wikipedia Articles |
|---|---|
| Religion | Religion and Abortion, History of Christian Thought on Abortion, Christianity and Abortion, Catholic Church and Abortion, Abortion and the Catholic Church in the US, Ensoulment |
| Fetal Rights | Fetal Rights, Born Alive Laws in the US, Unborn Victims of Violence Act, Heartbeat Bill, Prenatal Perception, Beginning of Human Personhood, Philosophical Aspects of the Abortion Debate |
| Bodily Autonomy | My Body My Choice, United States Abortion Rights Movement, Medical Abortion, Planned Parenthood, Women’s Health Protection Act, Bodily Integrity, Reproductive Justice |
| Fetal Viability and Exceptions | Pregnancy from Rape, Minors and Abortion, Late Termination of Pregnancy, Fetal Viability, Ectopic Pregnancies, Pregnancy Complications |
| Women’s Health | Women’s Health, Mifepristone, Abortifacient, Hysterotomy Abortion, Dilation and Curettage, Unsafe Abortion, Self-Induced Abortion, Sexual and Reproductive Health, Maternal Mortality in the US, Birth Control in the US, Emergency Contraception, Abortion and Mental Health |
| Frame | Phrases |
|---|---|
| Religion | god, abortion is morally, american catholics, anglican, aquinas, archbishop, augustine, baptist, bishop, catholic, christ, christian, christianity, church, communion, ensoulment, evangelical, excommunication, good catholic, holy, human soul, lutheran, methodist, morally wrong, nrlc, penance, pius, pope, presbyterian, protestant, sacrament, sexual immorality, sinful, soul, synod, prayer |
| Bodily Autonomy | abortion access, abortionaccess, abortion is a humanright, abortion is essential, abortion is healthcare, abortion rights, abortion rights are human rights, access to abortion, american taliban, reproductive autonomy, bans off our bodies, bodily autonomy, bodily integrity, bodily right, coat hanger, codify roe, coerced sterilization, forced birth, forced sterilization, forcedbirth, freedom of choice, herbal, her body her choice, induce abortion, knitting, mybody, my body my rights, my choice, parenthood clinic, planned parenthood, pro choice, pro-choice, prochoice, promaternalhealth, provide abortion, rcrc, reproductive choice, reproductive freedom, reproductive justice, reproductive right, reproductive freedom, reproductive justice, reproductive right, reprorights, right to choose, roevember, roevemberiscoming, safe abortion, saveroe, scienceoverideology, scotusiscompromised, scotusiscorrupt, self induced aboriton, unsafe abortion, waronwomen, wewontgoback, womens right, womenshealth, womensright, womensrightsarehumanrights |
| Fetal Personhood | abortion Is murder, abortion Is not a right, abortion is racist, abortion is violence, abortion kills babies, antilife, babies lives matter, choose life, end abortion, life is a human right, life matters, life wins, live action ambassador, love them both, march for life, pregnancy center, pro-life, probirth, pro choice violence, pro control, pro family, prolife, prolife gen, prolife generation, rescue the preborn, right to life, save the babies, save the baby humans, value life, violent protestor, we will end abortion, abortion kills babies, adoption, babies lives matter, baby right, baby rights, cerebral cortex, don marquis, end abortion, fetal pain, fetal right, fetalright, fetal right to life, heartbeat, hominization, infanticide, love them both, marquis argument, personhood, rescue the preborn, right to life, save the babies, save the baby humans, unborn |
| Women’s Health | abortifacient, abortion is a human right, abortion is healthcare, abortion rights are humanrights, adverse effect, antiglucocorticoid, antiprogestogen, birth control, coat hanger, comstock bill, contraception, contraceptive, curettage, curette, ethinylestradiol, female sterilization, gemeprost, hysterotomy, increase maternal, intercourse, intrauterine, iuds, levonorgestrel, maternal death, maternal health, maternal morbidity, maternal mortality, medication abortion, mental health, methotrexate, mifegyne, mifepristone, misoprostol, mortality ratio, oral contraceptive, postcoital, potassium permanganate, prenatal care, progesterone, progesterone receptor, progestin, progestogen, promaternalhealth, prostaglandin, reproductive, reproductive hazard, reproductive health, reproductivefreedom, side effect, spermicide, sterilization, tetragynon, uclaf, ulipristal, ulipristal acetate, unintended pregnancy, vasectomy, mothers health |
| Exceptions | abnormalities, abnormality, adoption, chance of survival, consent notification, ectopic, exception, gestation, incest, late term, limit viability, malformation, minor abortion, minor preganancy, parent consent, parental consent, parental involvement, parental notification, premature, preterm, rape, rapist, require second physician, survival, underage, viability, viable, week limit, weeks |
| Frame | #Tweets | #Original Tweets |
|---|---|---|
| Religion | 2,709,287 | 182,480 |
| Bodily Autonomy | 7,257,934 | 492,488 |
| Fetal Personhood | 2,730,391 | 200,396 |
| Women’s Health | 5,564,412 | 301,068 |
| Exceptions | 5,442,829 | 171,643 |
| Part-of-Speech | Dependency Path to Anchor |
|---|---|
| Adjective | XX-amodANC |
| XX-amod YY amod-ANC | |
| ANC-nsubjXX | |
| Verb (Subject) | XX-relclANC |
| XX-aclANC | |
| Verb (Object) | ANC-dobjXX |
| ANC-pobjYY-prepXX | |
| Noun | ANC-amodXX |
| ANC-compundXX |