J. Alcolea, V. Bujarrabal, A. Castro-Carrizo, et al. \righttitleThe Red Rectangle: a thin disk with big grains
Planetary Nebulae: a Universal Toolbox in the Era of Precision Astrophysics \jnlDoiYr2023 \doival10.1017/xxxxx \volno384
Proceedings IAU Symposium
The Red Rectangle: a thin disk with big grains
Abstract
The Red Rectangle is a nebula surrounding the post-AGB star HD 44179. It is the prototype of a particular class of nebulae associated with post-AGB binaries characterised by the presence of stable circumbinary disks in (quasi-)Keplerian rotation. Here we present the results of new high-resolution (0.′′02 – 0.′′05) ALMA observations of continuum and line emissions at 0.9 mm. The continuum maps are analysed through a simple model of dust emission, which can reproduce the observational data. We find that most dust emission in the Red Rectangle is concentrated in the central regions of the rotating disk and that the settlement of dust grains onto the equatorial plane is very significant, particularly in comparison with the much larger scale height displayed by the gas distribution. The diameter of the dust-emitting region is about 250 au, with a total width of about 50 au. This region coincides with the warm PDR where certain molecules (like HCN), CI, and CII are presumably formed, as well as probably PAHs. From the spectral index, we confirm the presence in the disk of large grains, with a typical radius of about 150 m, which supports the long-lived hypothesis for this structure. We also confirm the existence of a compact ionised wind at the centre of the nebula, probably emerging from the accretion disk around the companion, for which we derive an extent of about 10 au and a total flux of 8 mJy. We also briefly present the results on molecular lines of 12CO, 13CO, and other less abundant species.
keywords:
stars: AGB and post-AGB — circumstellar matter — radio continuum: stars — radio lines: stars — binary — planetary nebulae: individual: Red Rectangle1 Introduction
There is a class of binary stars consisting of a post-AGB primary and a main-sequence secondary, with about 85 members in our galaxy (Van Winckel, 2003; Kluska et al., 2022). These sources are systematically surrounded by circumbinary disks in (sub-)Keplerian rotation (Deroo et al., 2006; Bujarrabal et al., 2013a, b, 2015, 2016; Kluska et al., 2019). Very often, they also present a disk-wind bipolar outflow (Gallardo Cava et al., 2022, 2023). It is also believed that these disks are responsible for the observed orbital periods of 150 – 2000 d: these values lie in between the bimodal distribution of periods predicted for post-AGB binaries (Nie et al., 2012; Oomen et al., 2018; Van Winckel, 2018), suggesting a strong angular momentum exchange between the stellar system and the circumbinary rotating disk.
One of the best-studied members of this class is the post-AGB star HD 44179 in Monoceros, which lies at the centre of an X-shaped nebula known as the Red Rectangle (Cohen et al., 2004; Bujarrabal et al., 2013b, 2016). At a distance of 710 pc, this source has been modelled in detail by Men’shchikov et al. (2002) from IR imaging. The axis of the nebula is slightly off the plane of the sky, and the equatorial plane is oriented at a parallactic angle (PA) of 103∘. The binary has a period of 317 d, and the total stellar mass is 1.8 M⊙ (Thomas et al., 2011). The source has a peculiar chemistry with an O-rich component and strong C-rich extended red emission (ERE) and PAH IR features in the nebula (see e.g. Cohen et al., 2004), which in addition to the detection of CI, CII, and some molecular lines, points to the existence of a photon-dominated region (PDR) at the centre of this object (Bujarrabal et al., 2016).
The nebula was previously mapped with ALMA at a resolution of 0.′′5 by Bujarrabal et al. (2013b, 2016), revealing the structure and velocity field of the molecular gas in both the disk and the biconical outflow. Here we present new band 7 ALMA observations of the Red Rectangle but at a much higher spatial resolution, down to 0.′′020 (20 mas).
2 The new ALMA observations
The observations presented here have been obtained at the ALMA project 2019.1.00177.S (Bujarrabal et al., 2023). These are band 7 observations in two array configurations with baseline lengths from 14 m to 14.9 km. The observed frequency ranges and native spectral resolutions, as well as the main properties of the spectral lines detected in addition to the continuum, are given in Table 1.
| Observed frequency range and | Detected lines | Adopted rest | Upper level | Spectral resolution |
| native spectral resolution | frequency | energy | used in the maps | |
| 330.350 – 330.827 GHz (0.21 km·s-1) | 13CO =3–2 | 330 587.965 MHz | 31.7 K | (0.5 km·s-1) |
| 330.744 – 332.658 GHz (0.85 km·s-1) | H2O =2 =32,1–41,4 | 331 123.730 MHz | 4881.4 K | (1.0 km·s-1) |
| 343.563 – 345.448 GHz (0.85 km·s-1) | SiO =1 =8–7 | 344 916.247 MHz | 1843.6 K | (1.0 km·s-1) |
| H13CN =1 =4–3 =1e | 345 238.771 MHz | 1057.2 K | (1.0 km·s-1) | |
| H13CN =4–3 | 345 339.769 MHz | 41.4 K | (1.0 km·s-1) | |
| 345.558 – 346.032 GHz (0.21 km·s-1) | 12CO =3–2 | 345 795.990 MHz | 33.2 K | (0.5 km·s-1) |
The attained spatial resolution is about 20 mas (14 au) for the continuum data (using robust weighting) and about 55 mas (40 au) for the spectral line data (using natural weighting). All data has been calibrated with the standard ALMA pipeline plus self-calibration using the pure continuum emission. We have verified that the present data are consistent with the previous 0.′′5 resolution ALMA observations, and that no flux is filtered out in the new dataset within the 20% calibration uncertainty. Additional information on the observations and data analysis procedure can be found in Bujarrabal et al. (2023).
3 Continuum emission results
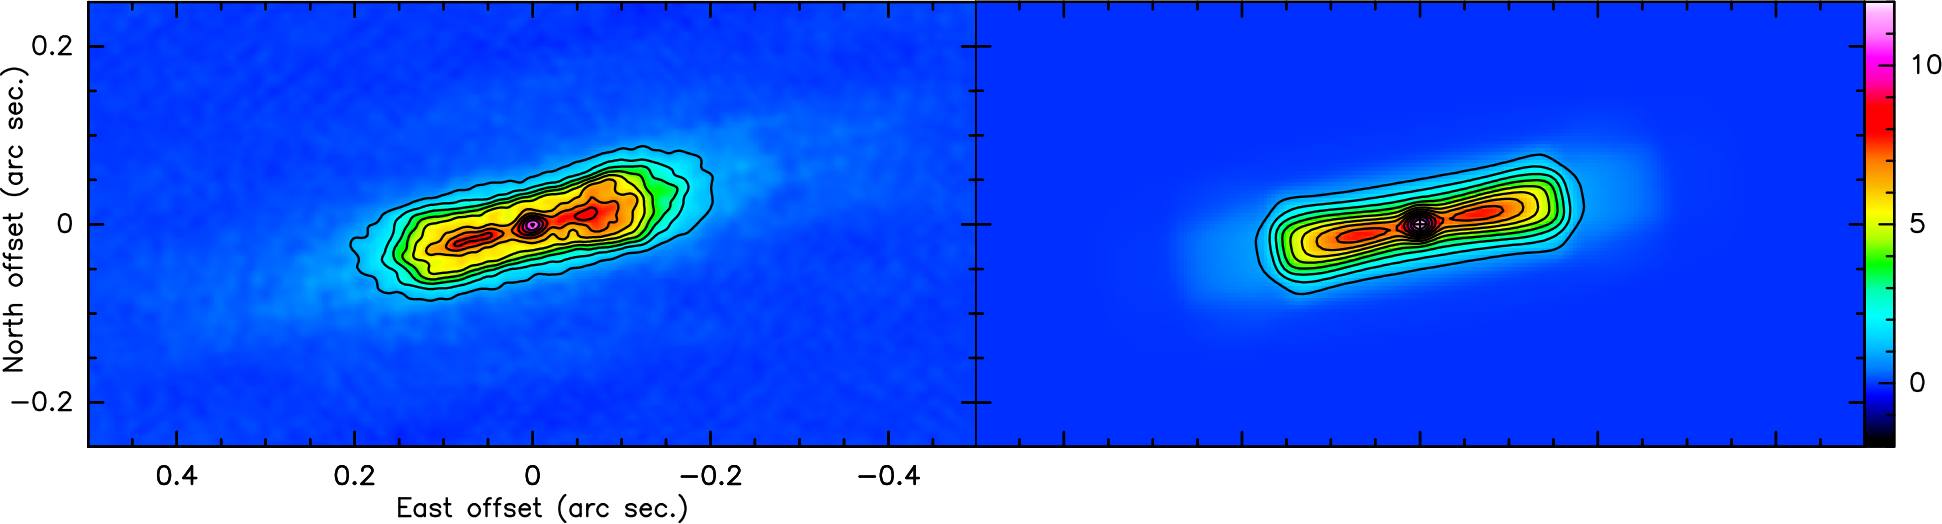
The image of the continuum emission, shown in Fig. 1, left panel, consists of a central compact component (CCC) plus the contribution of a thin disk seen almost edge-on (dust disk component, DDC hereafter). The orientation of the equatorial plane is at PA=103∘, with the symmetry axis close to the plane of the sky. For the central peak, we derive J2000 coordinates of R.A.=06h19m58.s1988 and Dec.=–10∘38′15.′′216, which have been adopted as the centre of our maps. Comparing these coordinates with those from previous VLA and ALMA observations (Jura et al., 1997; Bujarrabal et al., 2013b, 2016), we derive proper motion values of =–13.40.1 mas·a-1 and =–26.31.4 mas·a-1.
The total detected fluxes are 664 and 722 mJy at 331.7 and 344.5 GHz respectively, from which we estimate a spectral index (SI) of about 2, compatible with the emission from dust grains of relatively large size (see Jura et al., 1997). To isolate the contribution of the CCC we have performed a compact source model fitting in the uv-plane just considering baselines longer than 5 km, eliminating the contribution from the more extended structures of the DDC. We have obtained a total flux of 8.3 mJy and a size of 15 mas (10 au) for the CCC, which we attribute to the free-free emission of an ionised gas wind (see Jura et al., 1997). After removing this contribution of the CCC, we find that the strongest continuum emission comes from a region 200 mas wide in diameter (140 au) and 25 mas in height (18 au).
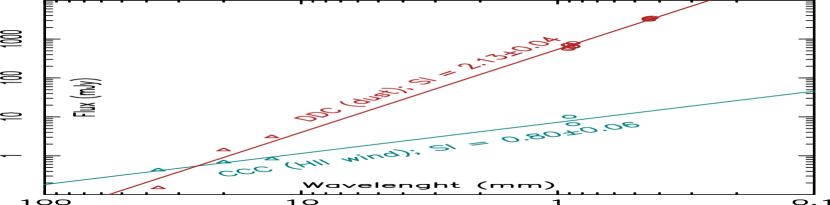
We can get a better estimate of the SI for both CCC and DDC by comparing these new fluxes with those from the literature at cm- and sub-mm-wavelengths (Jura et al., 1997; Bujarrabal et al., 2013b, 2016). The results of the SIs fittings are shown in Fig. 2, left panel. The derived SI for the CCC is 0.8, very close to the expected value of 0.6 for an isothermal ionised wind of constant mass loss (Panagia & Felli, 1975). This confirms the free-free nature of this emission but suggests deviations from the simple case of a homogeneous wind with a density. Using the CCC flux value at 0.9 mm, and assuming that the size measured for this component is several times the “so-called” characteristic radius, we derive a temperature of 3 600 – 10 000 K and a mass loss rate of 8 10-8 – 1.7 10-7 M⊙·a-1 for this ionised wind, very probably released by an accretion disk around the companion (Witt et al., 2009). The derived SI for the DDC, 2.13, is much closer to the value expected for an optically thick emission or the emission by very big grains regardless of the opacity (SI = 2.0), than to the value expected for an optically thin emission of small grains (SI = 3). In addition, the brightness measured in the disk reaches values larger than 200 K, implying that the opacity can not be very small (because the temperature of the grains cannot exceed 1000 – 1500 K). This suggests the presence of effective grain growth (see Jura et al., 1995, 1997) and moderate opacities in the strongest emitting regions of our disk.
4 Continuum modelling
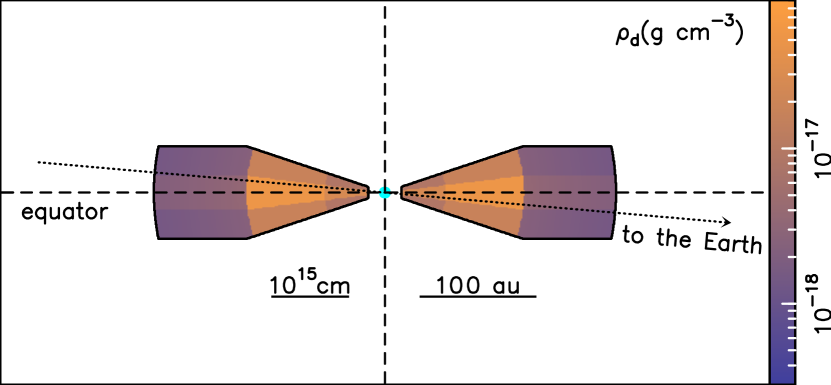
To derive the physical parameters of the dusty disk that reproduces the continuum emission of the Red Rectangle at 0.9 mm, we have developed a simple model of radiative transfer for a dusty disk. Following Tielens (2005), we have adopted very simple laws for grain absorption/emissivity (scattering is not important at these wavelengths). We have assumed constant emissivity for wavelengths smaller than a characteristic one, about 10 times the grain radius, , and an emissivity that decreases inversely proportional to the wavelength elsewhere. We have also adopted a grain density of 3.0 gr·cm-3, typical of O-rich dust material. The best fitting of the data has been obtained for a value of 150 m, comparable to the value of 200 m previously inferred by Jura et al. (1997). The density structure of the disk is described in Fig. 2, right panel. The temperature of the dust varies inversely to the square root of the distance to the centre, with a value of 400 K at 1.8 1015 cm (120 au), and an upper limit of 1200 K. The predicted emission from the model, directly comparable to the observations, is shown in Fig. 1, right panel, where we have also included the contribution from a small central component to account for the free-free emission of the CCC. Our best model geometry and density distribution are compatible with those of Men’shchikov et al. (2002). For the assumed grain density, we derive a total dust mass in the disk of 5 10-5 – 10-4 M⊙. This is 150 times smaller than the total molecular mass of the disk (Gallardo Cava et al., 2023). This gas/dust mass ratio value may look a bit low for O-rich environments but note that these circumbinary disks around binary post-AGB sources, including the Red Rectangle, are molecule deficient compared to standard AGB circumstellar envelopes (see Gallardo Cava et al., 2022).
Apart from effective grain growth, our model also finds a strong settlement of solid material onto the equatorial plane of the disk: 80% of the disk’s solid mass lies at distances from the equatorial plane smaller than 5 1014 cm ( 35 au). The extent of this dense disk is also relatively small, with a width-to-height ratio of about 5: disk radius of 2.5 1015 cm ( 175 au). These sizes are significantly smaller than the distribution shown by the molecular gas detected in quasi-Keplerian rotation (see Bujarrabal et al., 2016, and Sect. 5). The temperature of this dense dust disk varies between 350 and 1200 K at its outer and inner layers, respectively.
5 Molecular line results
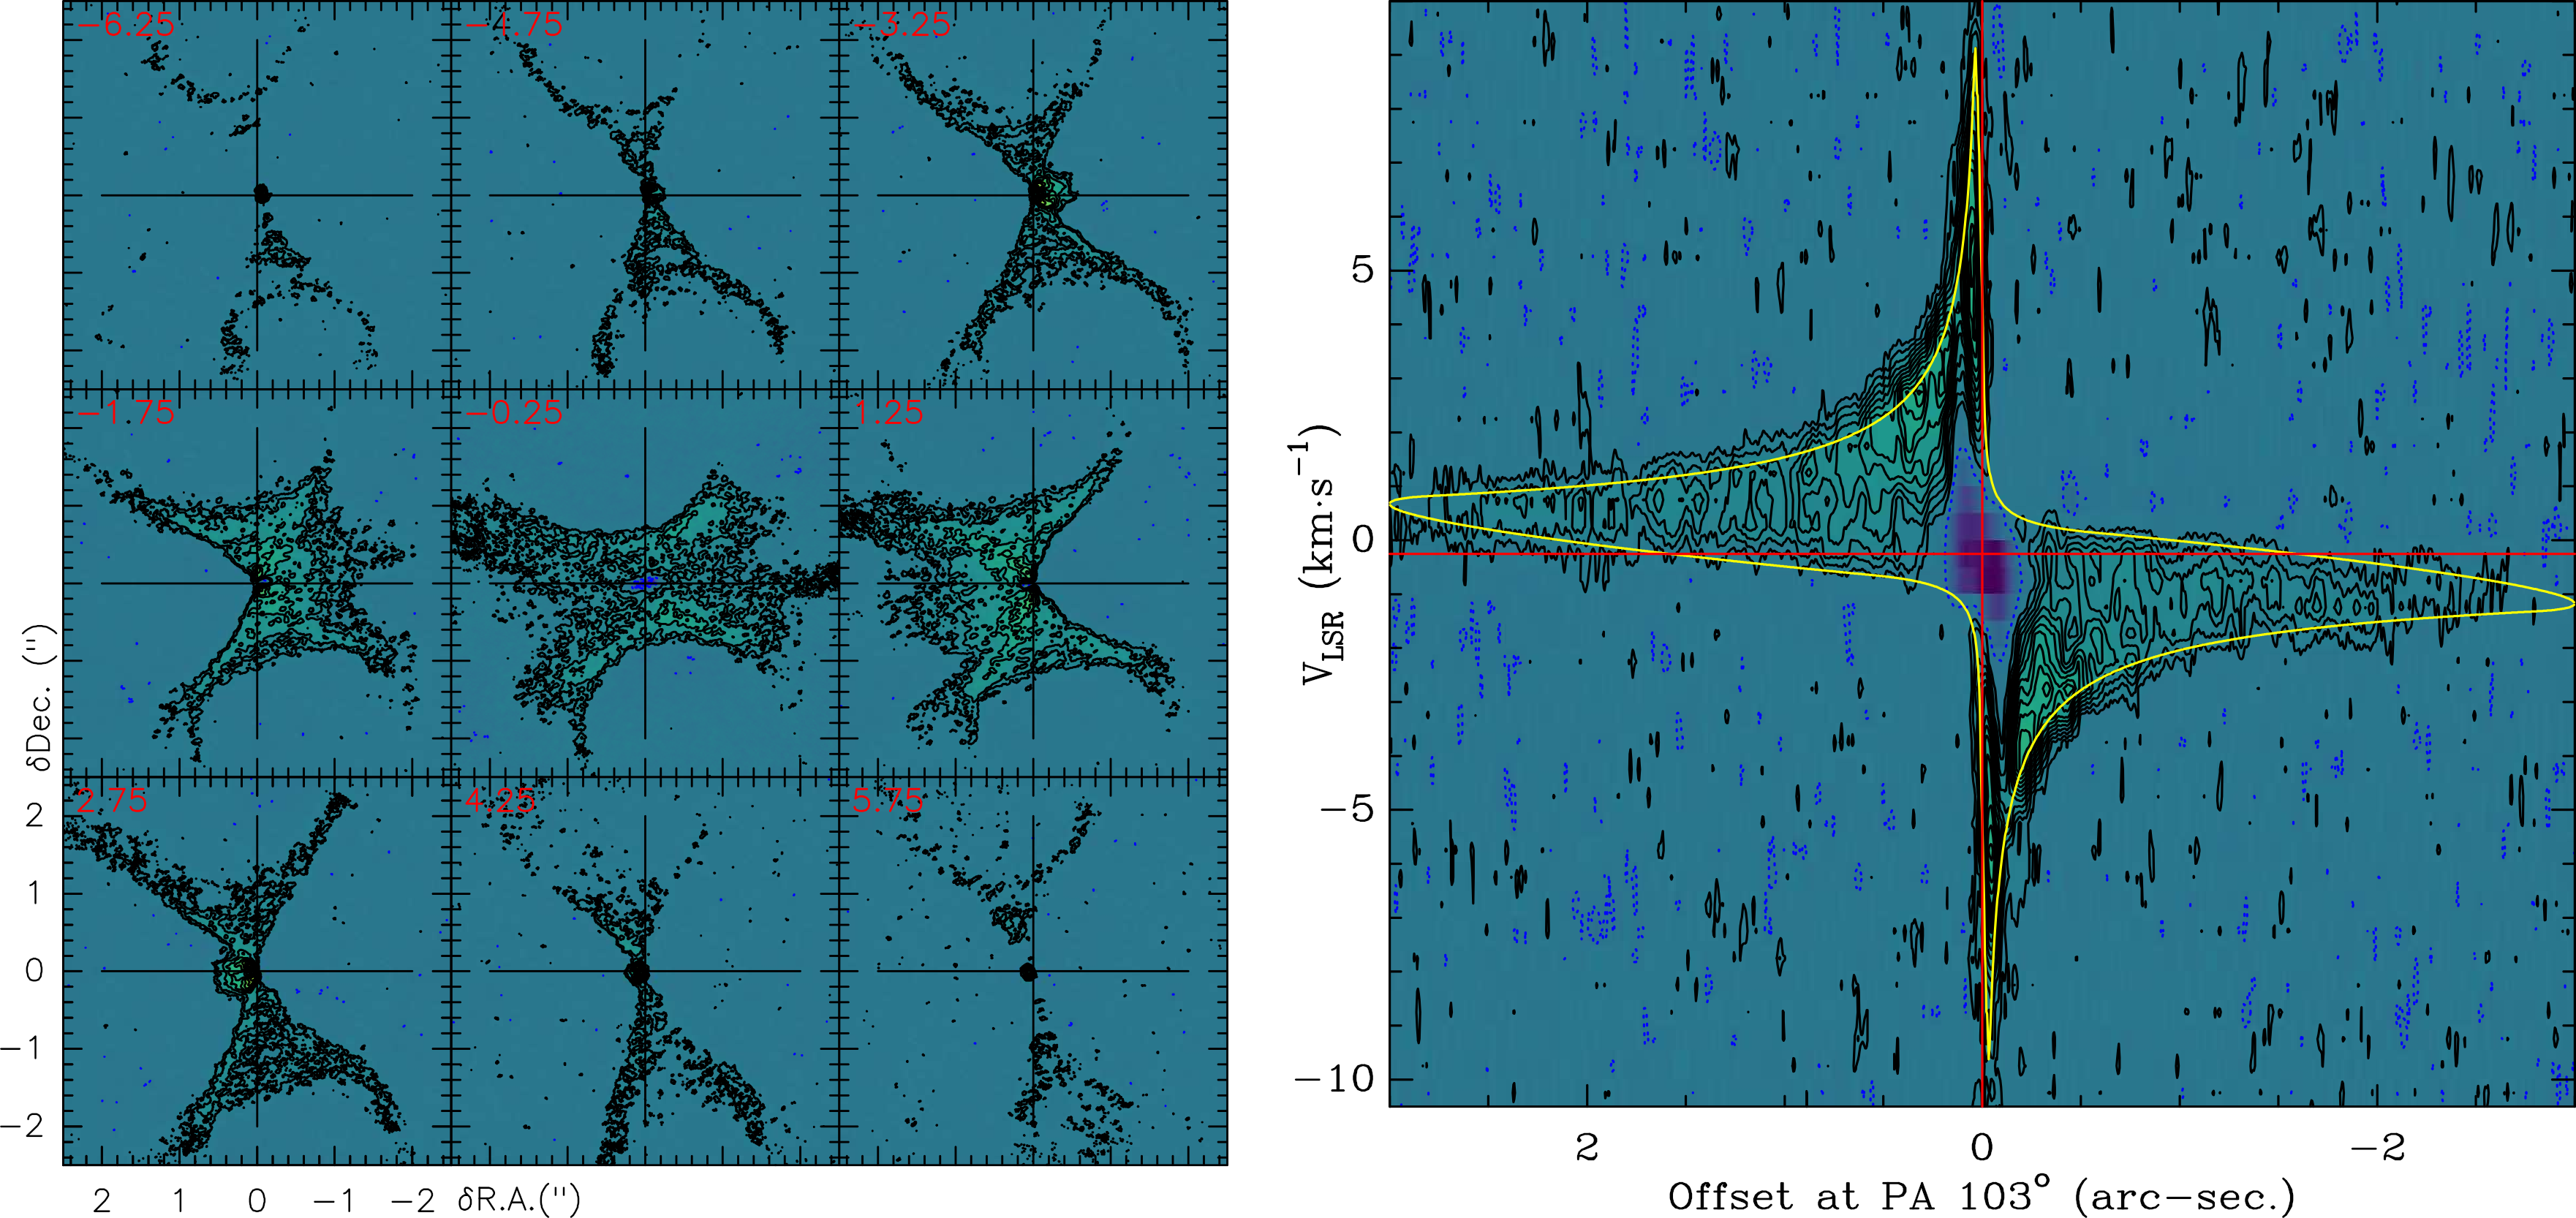
Although the flux filtered out in these new high-resolution observations is low or negligible, even for the most sensitive molecular gas probes like 12CO, the new observations mostly trace the rotating disk; the X-shaped wind is detected very noisily due to sensitivity limitations (see Fig. 3, left panel). On the contrary, the disk and its characteristic Keplerian-like rotation are traced with superb detail in both CO lines (see Figs. 3, right panel, and 4 respectively for 12CO and 13CO). The size of the molecular disk is much larger than that traced by the dust, 61′′ ( 4000700 UA) in 12CO (2.′′00.′′5 in the case of 13CO), i.e. up to 10 times bigger. We do not see signs of gas concentration or depletion at the equatorial plane: the negative flux seen at low velocities at the nebula’s centre is due to the removal of the continuum emission from the line maps and the presence of opaque cold gas in between the continuum source and the observer. In the disk, 12CO is mostly opaque: thus, the observed intensities provide direct information on the excitation of the gas. We derive ( for CO) up to 300 K, similar to the dust temperatures. 13CO is partially opaque in the disk: therefore the estimation of parameters such as the 12C/13C ratio and the molecular disk mass requires detailed modelling. In the disk, we detect an inner radius of the molecular gas emission, , of 0.′′04 (28 au): we are not claiming that there is a central region devoid of molecular gas, just that these central parts do not emit in any of the detected lines above our detection threshold (of about 10 K). Reconciling the observed velocities with central stellar mass requires the presence of rotation and radial expansion that decrease with the square root of the distance to the center: km·s-1 and km·s-1 (see Fig. 3, right panel).
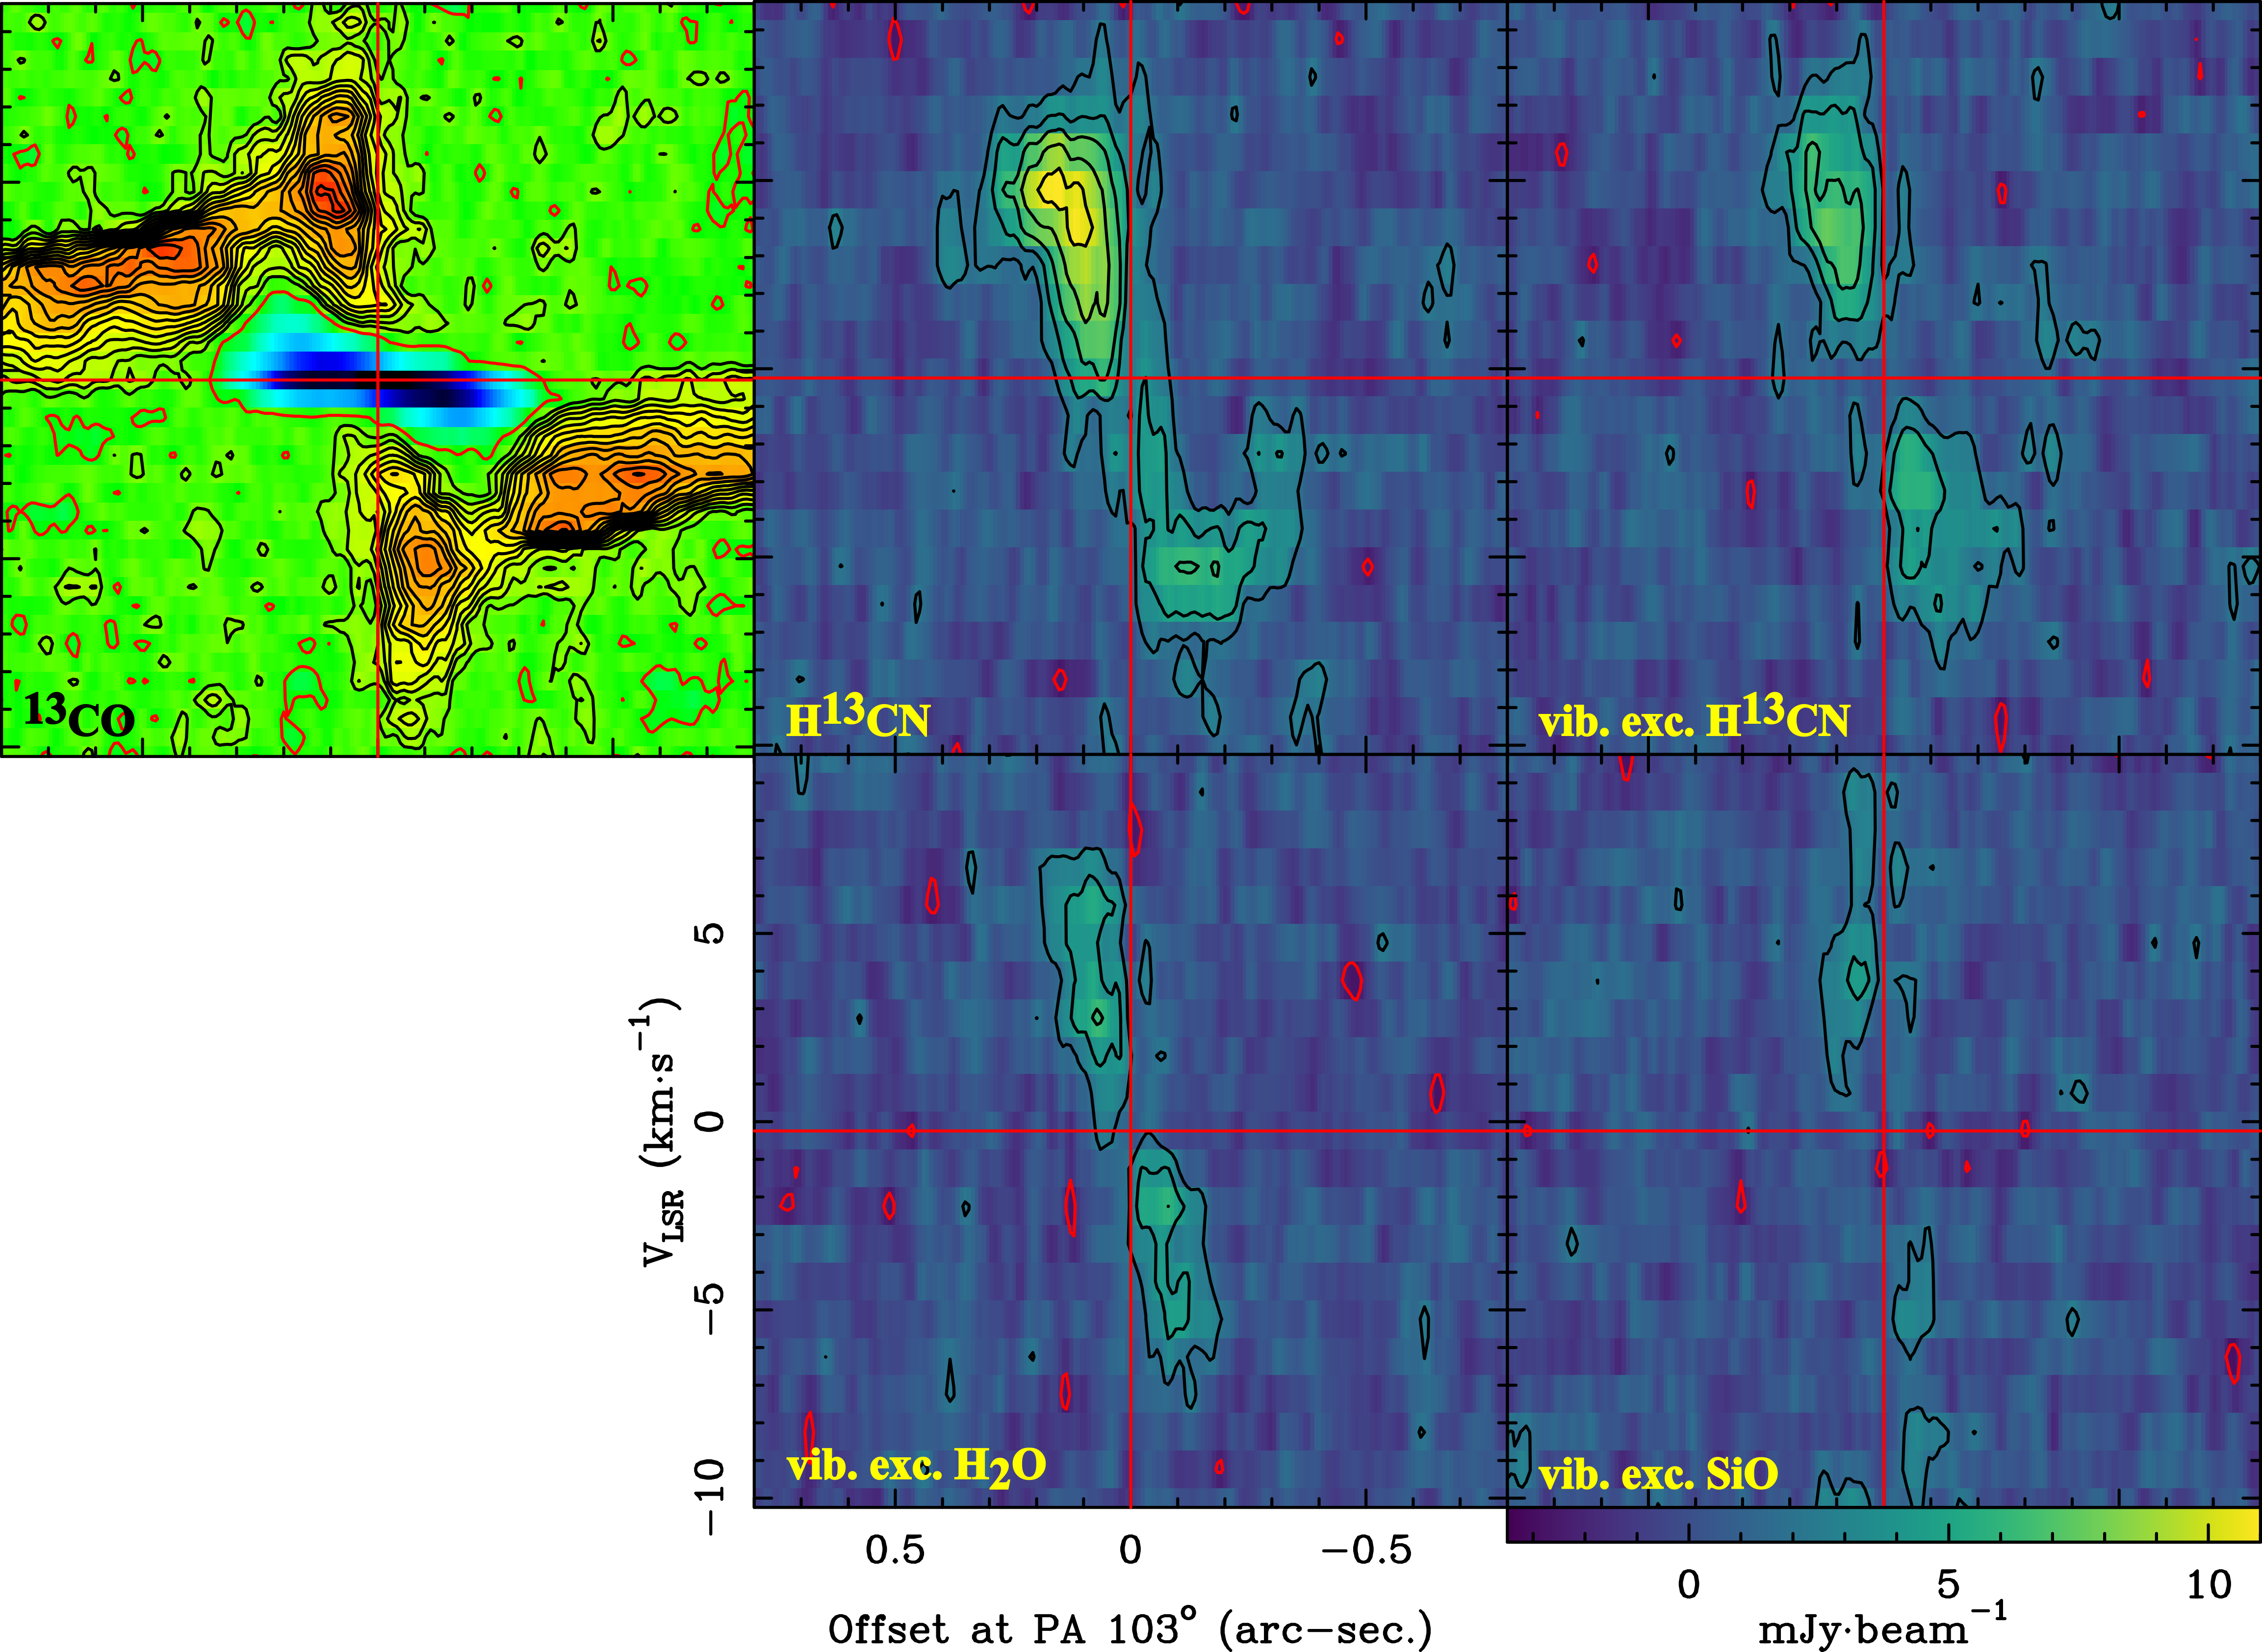
In addition to the previously mapped lines of 12CO and 13CO =3–2, and of H13CN =4–3 (Bujarrabal et al., 2013b, 2016), we have also detected vibrationally excited lines of H13CN, H2O and SiO, with upper-level excitation energies over 1000 K (see Table 1). The emission of these three vibrationally excited lines is very similar (see Fig. 4): they show a very compact central emission, just tracing the inner regions of the rotating disk, from a very narrow range of distances from the centre, 150 mas (100 au). This is probably related to the presence of the central PDR (Bujarrabal et al., 2016), and/or strong IR-pumping due to the dense warm dust at these locations. In the case of H13CN =4–3 from the ground vibrationally state, we observe a slightly more extended emission, up to 250 au from the centre. The detection of both C-rich (H13CN) and O-rich species (H2O), together with the detection of CI, CII, and PAHs strongly support the existence of a PDR at the centre of the nebula (Bujarrabal et al., 2016). ALMA mapping of CI is mandatory to confirm the presence of this PDR and derive its main properties.
Acknowledgements.
This work is supported by the I+D+i coordinated project Nebulae Web, PID2019-105203GB-C21 EVENTs (JA, VB, ACC) and PID2019-105203GB-C22 Genesis (CSC), funded by the Spanish MCIN/AEI grant 10.13039/501100011033. The results presented in this contribution were obtained at the ALMA project 2019.1.00177.S (PI V. Bujarrbal). ALMA is a partnership of ESO (representing its member states), NSF (USA) and NINS (Japan), together with NRC (Canada) and NSC and ASIAA (Taiwan), in cooperation with the Republic of Chile. The Joint ALMA Observatory is operated by ESO, AUI/NRAO and NAOJ.References
- Bujarrabal et al. (2013a) Bujarrabal V., Alcolea J., Van Winckel H., et al., 2013a, A&A, 557, A104
- Bujarrabal et al. (2013b) Bujarrabal V., Castro-Carrizo A., Alcolea J., et al., 2013b, A&A, 557, L11
- Bujarrabal et al. (2015) Bujarrabal V., Castro-Carrizo A., Alcolea J., & Van Winckel, H., 2015, A&A, 575, L7
- Bujarrabal et al. (2016) Bujarrabal V., Alcolea J., Van Winckel H., et al., 2016, A&A, 557, L11
- Bujarrabal et al. (2023) Bujarrabal V., Alcolea J., Castro-Carrizo, A., et al., 2023, A&A, 677, L18
- Cohen et al. (2004) Cohen M., Van Winckel H., Bond H. E., & Gull T. R., 2004, AJ, 127, 2362
- Deroo et al. (2006) Deroo P., Van Winckel H., Min M., et al., 2006, A&A, 450, 181
- Gallardo Cava et al. (2022) Gallardo Cava I., Bujarrabal V., Alcolea J., et al., 2022, A&A, 659, A134
- Gallardo Cava et al. (2023) Gallardo Cava I., Alcolea J., Bujarrabal V., et al., 2023, A&A, 671, A80
- Jura et al. (1995) Jura M., Balm S. P., & Kahane C., 1995, ApJ, 453, 721
- Jura et al. (1997) Jura M., Turner J., & Balm S. P., 1997, ApJ, 474, 741
- Kluska et al. (2019) Kluska J., Van Winckel H., Hillen M., et al., 2019, A&A, 631, A108
- Kluska et al. (2022) Kluska J., Van Winckel H., Coppée Q., et al., 2022, A&A, 658, A36
- Men’shchikov et al. (2002) Men’shchikov A. B., Schertl D., Tuthill P. G., et al., 2002, A&A, 393, 867
- Nie et al. (2012) Nie D. J., Wood P. R., & Nicholls C. P., 2012, MNRAS, 423, 2764
- Oomen et al. (2018) Oomen G.-M., Van Winckel H., Pols O., et al., 2018, A&A, 620, A85
- Panagia & Felli (1975) Panagia N. & Felli M., 1975, A&A, 39, 1
- Thomas et al. (2011) Thomas J. D., Witt A. N., Aufdenberg J. P., et al., 2011, MNRAS, 417, 2860
- Tielens (2005) Tielens A. G. G. M., 2005, The Physics and Chemistry of the Interstellar Medium. Cambridge Univ. Press
- Van Winckel (2003) Van Winckel H., 2003, ARAA, 41, 391
- Van Winckel (2018) Van Winckel H., 2018, arXiv:1809.00871
- Witt et al. (2009) Witt A. N., Vijh U. P., Hobbs L. M., et al., 2009, ApJ, 693, 1946