Triple Flares within Five Years in ztf18aanlzzf: An Enhanced Tidal Disruption Rate in ULIRGs?
Abstract
We present a noteworthy transient event in the optical light curves of ztf18aanlzzf (SDSS J161259.83+421940.3), identified as a Narrow Line Seyfert 1 (NLS1) exhibiting merging patterns in the optical image. The 16-year long-term archived light curve revealed that this target stays in a steady state, while three flares occurred within the past 5 years with time separations ranging from 1 year to 3.5 years. The flare patterns of rapid brightening and slow decline following the peak, coupled with distinctive spectral features with strong He ii and rare appearance of Bowen fluorescence line emissions, indicate at least two Tidal Eruption Event (TDE) flares in ztf18aanlzzf with a time separation of 3.5 years. We also apply TiDE light curve modeling and yield a Black Hole (BH) mass of , which is consistent with the BH mass measured from single-epoch spectra. Besides, the observed time lags days between the g and r bands strongly disagree with the prediction of the standard accretion disk model, highlighting the intricate interaction in the inner region related to the TDE. The reoccurrence gap of these TDEs, surpassing the previously reported repeated TDEs, can be attributed to binary star tidal disruption by a binary SMBH. Notably, the frequent TDE flares observed in this ULIRG-like target align with findings in a previous report for another ULIRG, suggesting a potentially elevated TDE rate in ULIRGs. Systematic variability studies of ULIRGs may help verify whether ULIRGs indeed have higher TDE rates.
1 Introduction
Tidal disruption event (TDE) stand out as one of the most captivating and extreme phenomena in the universe, occurring when a star ventures too close to a supermassive black hole and is torn apart by the immense tidal forces (Rees, 1988; Gezari, 2012, 2021; Yao et al., 2021). The resulting tidal disruption of the star leads to the formation of an accretion disk around the black hole, releasing a bright flare of radiation that can be observed across the electromagnetic spectrum (Gezari et al., 2008; Lodato & Rossi, 2011). Due to their rarity and the challenges associated with their detection, TDEs have only recently become a subject of intense research and observation, making them an exciting and rapidly evolving field of study.
TDE were first proposed as a theoretical concept in the 1970s (Hills, 1975; Lidskii & Ozernoi, 1979), but it was not until the late 1990s and early 2000s that the first compelling observational evidence for these phenomena began to emerge (Holoien et al., 2014; van Velzen et al., 2021; Kochanek, 2016). Since then, the detection and study of TDE have become an increasingly active area of research, driven by the advent of next-generation telescopes and the growing interest in understanding the behavior of supermassive black holes.
In recent years, the discovery of TDE candidates has increased substantially, driven in part by wide-field surveys and dedicated TDE search programs (Payne et al., 2021; van Velzen et al., 2021; Yao et al., 2023a), such as Zwicky Transient Facility111https://www.ztf.caltech.edu/ (ZTF; Masci2019). These efforts have led to the identification of a growing number of TDE candidates (Halpern et al., 2004; Wevers et al., 2019a; Somalwar et al., 2023), providing a wealth of data for further analysis and investigation. As the field continues to evolve, the study of TDE holds the promise of unveiling new insights into the behavior of black holes and the processes that govern the dynamics of galactic nuclei.
Despite the success of probing black hole properties, the typical TDE rate of one SMBH is about , and contributes about to the center black hole, considering Myr SMBH active timescale (Gezari, 2021). On the other hand, a previous study has shown that Ultra Luminous Infrared Galaxy (ULIRG) may have a higher TDE rate (Trakhtenbrot et al., 2019), which also means that it is possible to detect several TDE in one ULIRG in the long-term monitoring. More importantly, multiple TDE from one target will help to constrain the TDE model parameters independently in each flare (Guillochon et al., 2018; Kovács-Stermeczky & Vinkó, 2023a), and thus can be used as a tool to improve our understanding to the basic properties such as black hole mass. The variability analyzed during the flares is also helpful in understanding the tidal disruption process. However, TDE with two flares are rare (Yao et al., 2023b), and the time separation between two peaks is usually smaller than 200 days (e.g. AT2019baf, AT2019ehz, van Velzen et al., 2021; Yao et al., 2023a). The separation of these double flares are consistent with the tidal disruption of binary stars that the center blackhole will tidally disrupt the gravitational bunding between the binary star system, and swallow the two stars one by one (see the detailed study in Wu & Yuan, 2018).
In this paper, we report a serendipitously discovered transition target ztf18aanlzzf (SDSS J161259.83+421940.3, hereafter J1612) from ZTF, with at least three flares within 5 years. The fast rise and slow drop features, steady g-r color during the flares, and at least five years of steady flux are consistent with the TDE features (van Velzen et al., 2021). The time separation between two flares is about 3.5 yr, which is much longer than the previously observed repeated TDE (Yao et al., 2023a). More interestingly, previous studies based on WISE and VLA data have shown that the SFR of this target is (Berton et al., 2018), increasing the possibility that ULIRGs may have a higher TDE rate (Trakhtenbrot et al., 2019). In this work, we report the light curve and spectrum properties of this intriguing target and discuss the possible origin of these flares. Throughout, we adopt a CDM cosmology with , , and as reported by Planck Collaboration et al. (2020).
2 J1612 data sets
2.1 Basic information
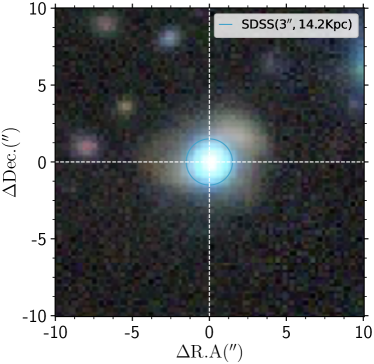
J1612 is an optically blue Narrow Line Seyfert 1 (NLS1) covered by the SDSS survey at redshift 0.234. It is also known as a radio-loud target with the star-forming rate of (Caccianiga et al., 2015; Järvelä et al., 2018; Berton et al., 2018), which is much higher than in the local universe (Kennicutt & Evans, 2012). The combination of the high star formation rate, and the tidal features revealed by Subaru/HSC images (see Fig. 1, depth of r 26 AB mag, Aihara et al., 2022), J1612 is very likely a ULIRG triggered by a galaxy merger. Moreover, the HSC i band image with a resolution of 0.66” still could not resolve the central core region, thus the two merging galaxy center distance would be less than about 2 kpc. High-resolution VLA observations at 5 GHz (beam size of ) show two radio cores within about 2 kpc, while whether the two cores are jet or two distinct radio AGN is still not clear (Berton et al., 2018).
2.2 Light curve of J1612
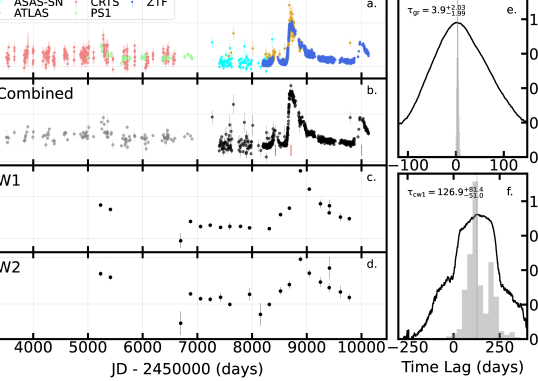
The archived light curves (Fig. 2) from the ZTF show the vigorous, repeated flare around Modified Julian Dates (MJD) 58750 days and 60000 days, appearing as consistent TDE behaviors with rapid brightening and slow power-law decline after the peaks. The latter TDE shows milder brightening, besides, there is a potential flattening or brightening feature around MJD 58900 days, while the data is not complete due to the observational gap.
In order to further investigate the light curve variation features, as well as the potential TDE in a longer time span, various archived photometry data from different telescopes are calibrated to elongate and supple the light curves (see Fig.2). The Asteroid Terrestrial-impact Last Alert System 222https://atlas.fallingstar.com/ (ATLAS; Tonry et al. 2018) and the All-Sky Automated Survey for SuperNovae333http://www.astronomy.ohio-state.edu/asassn/index.shtml (ASAS-SN; Kochanek et al. 2017) present highly consistent TDE variation towards ZTF after MJD 57000 days. The supplement from ATLAS around MJD 58450 days resolves a potential extra TDE flare. The Catalina Real-time Transient Survey444https://catalina.lpl.arizona.edu/ (CRTS; Drake et al. 2009) and Pan-STARRS1555https://outerspace.stsci.edu/display/PANSTARRS/ (PS1; Chambers et al. 2016) shows consistent light curve dips around MJD 55200 days to 57000 days, which indicates another potential flare around MJD 55200 days. The inter-band flux scaling is performed by the Bayesian package PyCALI666PyCALI is available at: https://github.com/LiyrAstroph/PyCALI (Li et al. 2014). However, due to the observation gap, we cannot accurately scale the flux variation on both sides split by MJD 57000 days (see grey points in Panel b in Fig.2), and the amplitude of the potential flare around MJD 55200 days remains blurred due to the data quality. We used the high-quality calibrated data after MJD 57000 days to do further analysis. We note that ASAS-SN g band isn’t used in the following analysis because of the low data quality and it doesn’t supplement the observational gap of ZTF.
We also explore the mid-infrared features through NEOWISE emission (see Fig. 2) with 20 binned photometry data points from the year 2010 to 2023 on W1 (3.4) and W2 (4.6) bands, which shows a broad, strong flare around MJD 59000.
2.3 Spectra of J1612
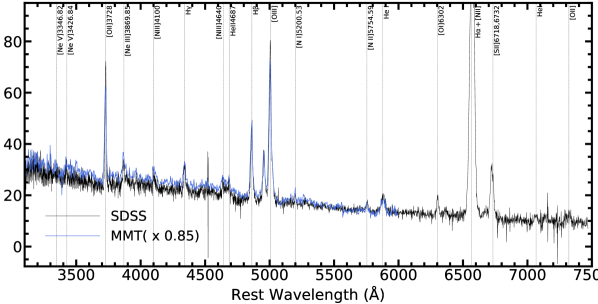
Optical spectra are observed by MMT/Hectospec spectroscopic redshift survey project HectoMAP (White et al., 2000; Fabricant et al., 2005; Sohn et al., 2023) in 1997 and by Sloan Digital Sky Survey (SDSS, see Fig. 3) in 2003 separately. We do not have light curves to verify the flare occurrence for either date. The SDSS photometry results of this target are r = 17.8 and g = 18.2, which are consistent with the ZTF light curve during the steady state. So J1612 is very likely in a low state when the SDSS spectrum was taken. MMT/Hectospec spectrum shows no obvious different emission feature towards the SDSS spectrum, except the flux which may caused by the flux calibration and aperture difference (MMT/Hectospec fibre aperture is 1.5”). Thus we conclude that both spectra are not in the flare stage.
3 Data Analyze and Result
3.1 Spectral Features
We applied the software DASpec777DASpec is available at https://github.com/PuDu-Astro/DASpec on the archived spectra to do the multi-component fitting. The line width of bright emission lines, such as [O ii], H, [O iii] and H reaches which can be explained by the outflows. The strong He emission lines as typical Wolf–Rayet stars feature indicate a recent starburst in nuclear region (Armus et al., 1988; Perna et al., 2021). The existence of high ionization lines such as [Ne V] emission strongly suggests the active galactic nucleus in the galaxy center (e.g., Negus et al., 2023). Therefore, AGN and starburst coexist in the central region of J1612. To understand the ionization origin of J1612, we also present the “Baldwin, Phillips & Terlevich” (BPT) diagrams using line ratios between [O iii] and H, [N ii] and H, [S ii] and H, [O i]6300 and H. It should be noted that the broad components of H and H are difficult to decompose from spectral fitting, and here we take the whole emission line strength as the upper limit constraints. Our results show that J1612 falls on the composite area of the star-forming galaxy towards Seyfert and LINERS, which is consistent with the analysis in Shirazi & Brinchmann (2012). So we conclude that AGN in J1612 is not very strong compared with the central star formation, which is also consistent with the flat light curve when J1612 is not in the flare stage (see Fig. 2).
After spectral decomposition, we obtained 5100 Å luminosity (log). We adopted the size-luminosity (-) scaling relationship from Bentz et al. (2013) and estimated black hole mass by adopting the full width at half maximum (FWHM) as the measure of H line width () from the single-epoch spectra. The final estimated black hole mass is , which is close to the peak of the TDE balckhole mass histogram (Wevers et al., 2019b). Nevertheless, we should also note that all the emission lines in Fig. 3 are about 1000 km/s, which may caused by the strong outflow from the galaxy center. Thus the H from the broad line region may be hidden in the outflow or the low S/N continuum. The high-resolution spectrum of H is still needed to have a better estimation of the black hole mass.
3.2 Light Curve Characterization
The 16-year light curves indicate that J1612 remained in a quiescent state for about ten years. There is a tentative optical flare in the year 2010, and the WISE light curve in the year 2010 also shows a hint of a light echo in the infrared, although there are only two data points. We did not include the flare hint during 2010 in the current work because there is too little data available. In the recent five years, J1612 has become active. The flat light curve indicates the weak activity of the central SMBH, and the recent high-quality ZTF data have allowed us to characterize the variability properties during the flares. The optical light curve reveals three flares within the past 5 years, while the WISE light curve only echoes one flare with a symmetric variability feature, implying a complex dust distribution associated with the two flares around 2019. For the flares in the recent 5 years, disk instability (e.g., Pan et al. 2022) can be excluded since disk instability usually produces a different flaring shape, characterized by a slow increase and fast decrease trend, which is opposite to what we observed in J1612.
3.2.1 Time Lag Analyze
The time lag between different light curves is crucial for understanding the variability properties in different origins and scale lengths of the accretion process, especially in the compact region (Guo et al., 2022). As J1612 is identified as an AGN, we conducted measurements of the different time lags between the g and r bands, and optical and Mid-Infrared bands to distinguish between TDE and AGN flares and further constrain the accretion process. We employed the interpolated cross-correlation function (ICCF; Gaskell et al. 1986; Peterson 1993) to determine the time delays.
The time lag between optical bands is interpreted as the radiation reprocesses of the accretion disk from different distinct emitting regions (Cackett et al., 2007, 2018; Fausnaugh et al., 2018; Guo et al., 2022). Conversely, the lag is attributed to the variance in the arrival time of photons with different energies in TDE for UV and optical bands, indicating shock heating during disk formation rather than accretion processing (Piran et al., 2015; Kovács-Stermeczky & Vinkó, 2023b). Our measurements between the g and r band time lag are shown in Fig. 2. We found a significant time lag of , while the standard accretion disk model (Shakura & Sunyaev, 1973) predicts a time lag of , which is an order of magnitude shorter than the flares in J1612. Thus, the g and r band time delay is not likely to originate from the accretion disk (Fausnaugh et al., 2018; Kara et al., 2021; Guo et al., 2022). Consequently, it is more plausible that the burst of J1612 originates from shocks generated during the collision of materials in the TDE process, as shocks travel less fast than the radiation reprocesses of light (Piran et al., 2015).
The time lag between the infrared and optical bands does not seem to be much different from previously reported TDEs (Dou et al., 2017; Jiang et al., 2017; Yang et al., 2019). In the context of AGN, the time delay typically indicates the size of the dust torus (Chen et al., 2023). In TDE, such time lag is also attributed to the heating of dust by TDE. We show the time delay between the optical combined and the WISE W1 light curve (Fig. 2, panel f), and find the time delay , consistent with both the luminosity-radius of the AGN torus and the previous TDE IR echo results (Jiang et al., 2017; Yang et al., 2019; Chen et al., 2023). Thus, it is less possible to distinguish TDE events from AGN flares in J1612. Therefore, the flares of J1612 are more likely to be TDEs from the aspect of optical time lag. Furthermore, if the flares were caused by a TDE, we would expect to see Fe ii emission line feature in follow-up spectral observation (Jiang et al., 2017; Yao et al., 2023a).
3.2.2 TDE Model fitting
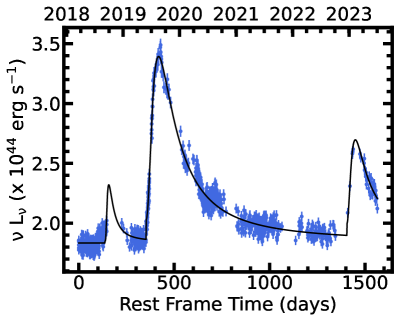
To understand the nature of the TDE features, we fit the light curve with the software TiDE888https://github.com/stermzsofi/TiDE (Kovács-Stermeczky & Vinkó, 2023b). The three flare events are fitted with independent parameters. In chronological order, fitting three flares yields black hole masses of , , and , which are consistent with the black hole mass estimated from the spectrum. The masses of the tidal disrupted stars are 1.3 , 2.0 , and 1.2 , respectively. Figure 4 illustrates the best-fitting result of the flare light curve. Although large uncertainty, we found the flares can be fitted well by the TDE model using TiDE, while the first flare lacks the observational data during the flare state, thus the model is less constrained by the data.
The black hole masses fitted from the first and the third flares are consistent, while the second flare needs a higher mass, implying that J1612 may need two black hole masses to produce the TDE. On the other hand, each flare model includes 15 free parameters. So our fitting results could show a consistent black hole mass, as well as a rough estimation of the disrupted stars, but the degeneration between parameters made it difficult to conclude if there are two SMBHs in the galaxy center. High-quality light curves of the TDE (e.g., from “Mozi” Wide Field Survey Telescope or Large Synoptic Survey Telescope) will help to constrain the black hole properties, especially for the multiple TDE.
4 Possible Physical explanations for the flares: Binary SMBHs accret Binary stars?
Based on the aforementioned analysis, taking into account the characteristics of the light curve variation shape, time duration, and luminosity (Section 2.2), the longer g and r band time lag that is inconsistent with the expected time lag from the accretion disk (Section 3.2.1), and the presence of Bowen fluorescence lines in the spectra (Section 2.3), we can confidently conclude that at least the two flares observed in 2020 and 2023 are highly likely to be two separate TDEs in the target J1612. The flare that occurred in late 2018 is also likely to be a TDE, but the crucially important data at the peak of the burst is unfortunately not available for analysis.
The occurrence of two TDEs in a single target within a span of 3 years is indeed significantly higher than the expected TDE rate, even in ULIRGs (Trakhtenbrot et al., 2019; Yao et al., 2023a). Assuming a typical TDE rate of about , the possibility that these flares are caused by several individual stars captured by the central black hole would be exceedingly small. Therefore, while it is possible to have several TDEs within a 3 5-year timescale, in this section, we will delve into the possibility and limitations of scenarios that could produce multiple flares within a timescale of years.
Although the light curve is extended to about 16 years, in light of the temporal baseline of the data and an insufficient sampling rate of the early data (before MJD 58000), it is hard to determine whether or not these flares occur periodically. Therefore, we cannot support or rule out scenarios such as repeating collisions of a star with the accretion disk (Karas & Vokrouhlicky 1994), Partial TDE of a star (Miles et al. 2020), and other models with periodical expectation.
Binary stars disrupted by a single SMBH (e.g., Mandel & Levin 2015) are also ruled out since the binary star rotating system will be tidally destroyed by the SMBH, then the dynamics of the two stars will be gravitationally dominated by the central black hole. Wu & Yuan (2018) studied the flare separation caused by the binary star system disrupted by single and binary SMBHs, and found that if the two stars are swallowed by one SMBH, the two flares would have a time separation of roughly less than 150 days. This timescale is a strong constraint about the TDE from binary stars. In contrast, the gravitational potential of a black hole binary is relatively complex, which provides conditions for the occurrence of various situations. For example, after the separation of the two stars, they can be disrupted by the same BH; they also can be disrupted by the two BHs severally; or one star of the star binary can be disrupted in the second orbital circle. These complexities lead to a time separation ranging from minutes to ten thousand years. The time separations between the flares in J1612 is about 1 to 3.5 years, which is not consistent with the typical time separation of the binary star TDE in a single SMBH.
While we lack additional evidence to support the existence of a binary SMBH in this ULIRG, or binary star accretion, the model proposed by Wu & Yuan (2018) offers a reasonable timescale that aligns with the lightcurve of J1612. Furthermore, the dense starburst environment in the ULIRG center could potentially provide more stars to be tidally disrupted. Therefore, the TDE in J1612 may serve as an indication of the presence of a binary SMBH in the galaxy center.
5 Discussion
5.1 Similarity of J1612 and F01004
TDE in ULIRGs has been reported in Tadhunter et al. (2017). Due to the sample selection method, the TDE detected in F01004 strongly suggests a higher TDE event rate () about in ULIRGs than the typical value of . The high naturally suggests a repeatable TDE feature on a timescale of 10 years, which is consistent with the several TDE features in Fig. 2.
The emission line features in Fig. 3 are highly similar to the spectrum of F01004 in the quiescent state (Tadhunter et al., 2017). The spectra of J1612 and the low state of F01004 both have HeII between 4000-5000Å, indicating a recent starburst from Wolf-Rayet stars, and both have clear N iii lines, implying a dense, high-velocity gas in the vicinity of the accreting SMBH. More strikingly, both J1612 and F01004 have blue spectrum shapes, rather than the red slope in most ULIRGs (Perna et al., 2021), thus the dust distinction along the line of sight is weak.
The evolutionary scenario of ULIRGs suggests that galaxy mergers trigger a starburst as well as an AGN that is obscured by the dust produced by the stellar process, manifesting as a type II AGN (e.g., Hopkins et al., 2006). Subsequently, the strong AGN outflow clears the dust, revealing the blue spectrum of the AGN (Liu & Zhang, 2011). However, most ULIRGs exhibit a red spectrum slope and strong outflow, indicating that the outflow may not efficiently produce type I AGNs, and ULIRGs with blue spectrum slopes, such as J1612 and F01004, are relatively scarce. The similarity of the continuum and emission lines, as well as the presence of TDE in J1612 and F01004, may suggest a higher TDE rate in “blue” ULIRGs. Conducting a variability study of ULIRG samples from the ZTF or WISE will help to constrain the TDE rate in different types of ULIRGs and potentially identify more instances of (multiple) TDEs.
5.2 Connection between ULIRG and TDE: Co-Evolution?
The repeated TDE feature and the high SFR in J1612 are not only consistent with the high TDE rate (e.g., Tadhunter et al., 2017), but also indicate a much higher event rate of TDE in ULIRGs. Typically, is about , which corresponds to a small amount of mass of accretion to SMBH, nevertheless, if is as high as , then the total mass contribution due to TDE would be , similar to the accretion-disk contribution. Moreover, the time lag analysis of J1612 also indicates a black hole mass of , which is small and consistent with the previous statistical results that the SMBH mass of ULIRGs is under the relation (e.g., Zhuang & Ho, 2023). Higher will help ULIRGs to increase BH mass efficiently, and catch up with the coevolution relation when ULIRGs are quenched into massive red galaxies.
6 Summary
We report a rare TDE host galaxy with three flares occurring within the past 5 years. TDEs have occurred at least twice, with an approximate 3.5-year separation between events, a duration much longer than any previously reported repeated TDE. The morphology observed from Subaru/HSC indicates a merger system, and data from WISE and VLA indicate a star formation rate (SFR) of . The shapes of the flares in the light curve, the g-r time lag, and the emission line properties collectively suggest the occurrence of at least two TDEs within the last five years. Furthermore, the broad emission line and the TDE light curve model fitting both indicate a consistent black hole mass of approximately . The time separation between the TDE flares, approximately 3.5 years, is significantly longer than the theoretical expectation for binary star TDEs in a single SMBH, and is consistent with the time separations observed in binary SMBHs disrupting binary stars. The occurrence of multiple TDEs in J1612 may also suggest a higher TDE rate in local ULIRGs. Follow-up photometric and spectroscopic observations, especially X-ray and radio monitoring and UV spectrum of this target would be instrumental in unraveling the mechanism behind the multiple flares. Additionally, long-term monitoring of local ULIRGs may aid in identifying more targets with multiple TDEs.
acknowledgements
We thank Suijian Xue and Hong Wu to use of the Xinglong 2.16 m telescope to take a tentatively spectrum of J1612 and Songsheng Yu-Yang and Shiyan Zhong for valuable discussions. We acknowledge the support from the National Key R&D Program of China (2020YFC2201400, 2021YFA1600404, 2022YFA1602902), NSFC (NSFC-11991050, -11991054, -11833008, -12120101003, -12373010, -12103041, -12263003), the International Partnership Program of the Chinese Academy of Sciences (113111KYSB20200014) and the science research grants from the China Manned Space Project with NO. CMS-CSST-2021-A05. YFY is supported by the Strategic Priority Research Program of the Chinese Academy of Sciences, Grant No. XDB0550200 and National SKA Program of China No. 2020SKA0120300. YRL acknowledges financial support from the NSFC through grant No 12273041 and from the Youth Innovation Promotion Association CAS. C.C. is supported by the National Natural Science Foundation of China, No. 11803044, 11933003, 12173045. This work is sponsored (in part) by the Chinese Academy of Sciences (CAS), through a grant to the CAS South America Center for Astronomy (CASSACA).
We also acknowledge SDSS for providing extensive spectral database support. SDSS is managed by the Astrophysical Research Consortium for the Participating Institutions of the SDSS Collaboration including the Brazilian Participation Group, the Carnegie Institution for Science, Carnegie Mellon University, Center for Astrophysics — Harvard & Smithsonian, the Chilean Participation Group, the French Participation Group, Instituto de Astrofísica de Canarias, The Johns Hopkins University, Kavli Institute for the Physics and Mathematics of the Universe(IPMU)/University of Tokyo, the Korean Participation Group, Lawrence Berkeley National Laboratory, Leibniz Institut fürAstrophysik Potsdam (AIP), Max-Planck-Institut für Astronomie (MPIA Heidelberg), Max-Planck-Institut für Astrophysik (MPA Garching), Max-Planck-Institut für ExtraterrestrischePhysik (MPE), National Astronomical Observatories of China, New Mexico State University, New York University, University of Notre Dame, Observatário Nacional/MCTI, The Ohio State University, Pennsylvania State University, Shanghai Astronomical Observatory, United Kingdom Participation Group, Universidad Nacional Autónoma de México, University of Arizona, University of Colorado Boulder, University of Oxford, University of Portsmouth, University of Utah, University of Virginia, University of Washington, University of Wisconsin, Vanderbilt University, and Yale University.
We acknowledge the efforts for public data from CTRS, PS1, ASAS-SN and ZTF. The Catalina Sky Survey is funded by the National Aeronautics and Space Administration under Grant No. NNG05GF22G issued through the Science Mission Directorate Near-Earth Objects Observations Program. The CRTS survey is supported by the US National Science Foundation under grants AST-0909182 and AST-1313422. The CRTS survey is supported by the US National Science Foundation under grants AST-0909182 and AST-1313422.
The PS1 has been made possible through contributions by the Institute for Astronomy, the University of Hawaii, the Pan-STARRS Project Office, the Max-Planck Society and its participating in- stitutes, the Max Planck Institute for Astronomy, Heidelberg and the Max Planck Institute for Extraterrestrial Physics, Garching, The Johns Hopkins University, Durham University, the University of Edinburgh, Queen’s University Belfast, the Harvard-Smithsonian Center for Astrophysics, the Las Cumbres Observatory Global Telescope Network Incorporated, the National Central University of Taiwan, the Space Telescope Science Institute, the National Aeronautics and Space Administration under Grant No. NNX08AR22G issued through the Planetary Science Division of the NASA Science Mission Directorate, the National Science Foundation under Grant No. AST-1238877, the University of Maryland, and Eotvos Lorand University (ELTE).
ASAS-SN is supported by the Gordon and Betty Moore Foundation through grant GBMF5490 to the Ohio State University and NSF grant AST-1515927. Development of ASAS-SN has been supported by NSF grant AST-0908816, the Mt. Cuba Astronomical Foundation, the Center for Cosmology and Astro- Particle Physics at the Ohio State University, the Chinese Academy of Sciences South America Center for Astronomy (CASSACA), the Villum Foundation, and George Skestos.
ZTF is supported by the National Science Foundation under Grant No. AST-2034437 and a collaboration including Caltech, IPAC, the Weizmann Institute for Science, the Oskar Klein Center at Stockholm University, the University of Maryland, Deutsches Elektronen-Synchrotron and Humboldt University, the TANGO Consortium of Taiwan, the University of Wis- consin at Milwaukee, Trinity College Dublin, Lawrence Livermore National Laboratories, and IN2P3, France. Operations are conducted by COO, IPAC, and UW.
This publication makes use of data products from WISE , which is a joint project of the University of California, Los Angeles, and the Jet Propulsion Laboratory/California Institute of Technology, funded by the National Aeronautics and Space Administration. This publication also makes use of data products from NEOWISE, which is a project of the Jet Propulsion Laboratory/California Institute of Technology, funded by the Planetary Science Division of the National Aeronautics and Space Administration.
References
- Aihara et al. (2022) Aihara, H., AlSayyad, Y., Ando, M., et al. 2022, PASJ, 74, 247, doi: 10.1093/pasj/psab122
- Armus et al. (1988) Armus, L., Heckman, T. M., & Miley, G. K. 1988, ApJ, 326, L45, doi: 10.1086/185120
- Bentz et al. (2013) Bentz, M. C., Denney, K. D., Grier, C. J., et al. 2013, ApJ, 767, 149, doi: 10.1088/0004-637X/767/2/149
- Berton et al. (2018) Berton, M., Congiu, E., Järvelä, E., et al. 2018, A&A, 614, A87, doi: 10.1051/0004-6361/201832612
- Bowen (1928) Bowen, I. S. 1928, ApJ, 67, 1, doi: 10.1086/143091
- Caccianiga et al. (2015) Caccianiga, A., Antón, S., Ballo, L., et al. 2015, MNRAS, 451, 1795, doi: 10.1093/mnras/stv939
- Cackett et al. (2018) Cackett, E. M., Chiang, C.-Y., McHardy, I., et al. 2018, ApJ, 857, 53, doi: 10.3847/1538-4357/aab4f7
- Cackett et al. (2007) Cackett, E. M., Horne, K., & Winkler, H. 2007, MNRAS, 380, 669, doi: 10.1111/j.1365-2966.2007.12098.x
- Chambers et al. (2016) Chambers, K. C., Magnier, E. A., Metcalfe, N., et al. 2016, arXiv e-prints, arXiv:1612.05560, doi: 10.48550/arXiv.1612.05560
- Chen et al. (2023) Chen, Y.-J., Liu, J.-R., Zhai, S., et al. 2023, MNRAS, 522, 3439, doi: 10.1093/mnras/stad1136
- Dou et al. (2017) Dou, L., Wang, T., Yan, L., et al. 2017, ApJ, 841, L8, doi: 10.3847/2041-8213/aa7130
- Drake et al. (2009) Drake, A. J., Djorgovski, S. G., Mahabal, A., et al. 2009, ApJ, 696, 870, doi: 10.1088/0004-637X/696/1/870
- Fabricant et al. (2005) Fabricant, D., Fata, R., Roll, J., et al. 2005, PASP, 117, 1411, doi: 10.1086/497385
- Fausnaugh et al. (2018) Fausnaugh, M. M., Starkey, D. A., Horne, K., et al. 2018, ApJ, 854, 107, doi: 10.3847/1538-4357/aaaa2b
- Gaskell et al. (1986) Gaskell, C. M., Cappellaro, E., Dinerstein, H. L., et al. 1986, ApJ, 306, L77, doi: 10.1086/184709
- Gezari (2012) Gezari, S. 2012, in European Physical Journal Web of Conferences, Vol. 39, European Physical Journal Web of Conferences, 03001, doi: 10.1051/epjconf/20123903001
- Gezari (2021) Gezari, S. 2021, ARA&A, 59, 21, doi: 10.1146/annurev-astro-111720-030029
- Gezari et al. (2008) Gezari, S., Basa, S., Martin, D. C., et al. 2008, ApJ, 676, 944, doi: 10.1086/529008
- Guillochon et al. (2018) Guillochon, J., Nicholl, M., Villar, V. A., et al. 2018, ApJS, 236, 6, doi: 10.3847/1538-4365/aab761
- Guo et al. (2022) Guo, W.-J., Li, Y.-R., Zhang, Z.-X., Ho, L. C., & Wang, J.-M. 2022, ApJ, 929, 19, doi: 10.3847/1538-4357/ac4e84
- Halpern et al. (2004) Halpern, J. P., Gezari, S., & Komossa, S. 2004, ApJ, 604, 572, doi: 10.1086/381937
- Hills (1975) Hills, J. G. 1975, AJ, 80, 809, doi: 10.1086/111815
- Holoien et al. (2014) Holoien, T. W. S., Prieto, J. L., Bersier, D., et al. 2014, MNRAS, 445, 3263, doi: 10.1093/mnras/stu1922
- Hopkins et al. (2006) Hopkins, P. F., Hernquist, L., Cox, T. J., et al. 2006, ApJS, 163, 1, doi: 10.1086/499298
- Järvelä et al. (2018) Järvelä, E., Lähteenmäki, A., & Berton, M. 2018, A&A, 619, A69, doi: 10.1051/0004-6361/201832876
- Jiang et al. (2017) Jiang, N., Wang, T., Yan, L., et al. 2017, ApJ, 850, 63, doi: 10.3847/1538-4357/aa93f5
- Kara et al. (2021) Kara, E., Mehdipour, M., Kriss, G. A., et al. 2021, arXiv e-prints, arXiv:2105.05840. https://arxiv.org/abs/2105.05840
- Karas & Vokrouhlicky (1994) Karas, V., & Vokrouhlicky, D. 1994, ApJ, 422, 208, doi: 10.1086/173719
- Kennicutt & Evans (2012) Kennicutt, R. C., & Evans, N. J. 2012, ARA&A, 50, 531, doi: 10.1146/annurev-astro-081811-125610
- Kochanek (2016) Kochanek, C. S. 2016, MNRAS, 461, 371, doi: 10.1093/mnras/stw1290
- Kochanek et al. (2017) Kochanek, C. S., Shappee, B. J., Stanek, K. Z., et al. 2017, PASP, 129, 104502, doi: 10.1088/1538-3873/aa80d9
- Kovács-Stermeczky & Vinkó (2023a) Kovács-Stermeczky, Z. V., & Vinkó, J. 2023a, PASP, 135, 034102, doi: 10.1088/1538-3873/acb9bb
- Kovács-Stermeczky & Vinkó (2023b) —. 2023b, PASP, 135, 104102, doi: 10.1088/1538-3873/acf8f8
- Li et al. (2014) Li, Y.-R., Wang, J.-M., Hu, C., Du, P., & Bai, J.-M. 2014, ApJ, 786, L6, doi: 10.1088/2041-8205/786/1/L6
- Lidskii & Ozernoi (1979) Lidskii, V. V., & Ozernoi, L. M. 1979, Soviet Astronomy Letters, 5, 16
- Liu & Zhang (2011) Liu, Y., & Zhang, S. N. 2011, ApJ, 728, L44, doi: 10.1088/2041-8205/728/2/L44
- Lodato & Rossi (2011) Lodato, G., & Rossi, E. M. 2011, MNRAS, 410, 359, doi: 10.1111/j.1365-2966.2010.17448.x
- Mandel & Levin (2015) Mandel, I., & Levin, Y. 2015, ApJ, 805, L4, doi: 10.1088/2041-8205/805/1/L4
- Miles et al. (2020) Miles, P. R., Coughlin, E. R., & Nixon, C. J. 2020, ApJ, 899, 36, doi: 10.3847/1538-4357/ab9c9f
- Negus et al. (2023) Negus, J., Comerford, J. M., Sánchez, F. M., et al. 2023, ApJ, 945, 127, doi: 10.3847/1538-4357/acb772
- Netzer et al. (1985) Netzer, H., Elitzur, M., & Ferland, G. J. 1985, ApJ, 299, 752, doi: 10.1086/163741
- Pan et al. (2022) Pan, X., Li, S.-L., Cao, X., Miniutti, G., & Gu, M. 2022, ApJ, 928, L18, doi: 10.3847/2041-8213/ac5faf
- Payne et al. (2021) Payne, A. V., Shappee, B. J., Hinkle, J. T., et al. 2021, ApJ, 910, 125, doi: 10.3847/1538-4357/abe38d
- Perna et al. (2021) Perna, M., Arribas, S., Pereira Santaella, M., et al. 2021, A&A, 646, A101, doi: 10.1051/0004-6361/202039702
- Peterson (1993) Peterson, B. M. 1993, PASP, 105, 247, doi: 10.1086/133140
- Piran et al. (2015) Piran, T., Svirski, G., Krolik, J., Cheng, R. M., & Shiokawa, H. 2015, ApJ, 806, 164, doi: 10.1088/0004-637X/806/2/164
- Planck Collaboration et al. (2020) Planck Collaboration, Aghanim, N., Akrami, Y., et al. 2020, A&A, 641, A6, doi: 10.1051/0004-6361/201833910
- Rees (1988) Rees, M. J. 1988, Nature, 333, 523, doi: 10.1038/333523a0
- Shakura & Sunyaev (1973) Shakura, N. I., & Sunyaev, R. A. 1973, A&A, 500, 33
- Shirazi & Brinchmann (2012) Shirazi, M., & Brinchmann, J. 2012, MNRAS, 421, 1043, doi: 10.1111/j.1365-2966.2012.20439.x
- Sohn et al. (2023) Sohn, J., Geller, M. J., Hwang, H. S., et al. 2023, ApJ, 945, 94, doi: 10.3847/1538-4357/acb925
- Somalwar et al. (2023) Somalwar, J. J., Ravi, V., Dong, D. Z., et al. 2023, ApJ, 945, 142, doi: 10.3847/1538-4357/acbafc
- Tadhunter et al. (2017) Tadhunter, C., Spence, R., Rose, M., Mullaney, J., & Crowther, P. 2017, Nature Astronomy, 1, 0061, doi: 10.1038/s41550-017-0061
- Tonry et al. (2018) Tonry, J. L., Denneau, L., Heinze, A. N., et al. 2018, PASP, 130, 064505, doi: 10.1088/1538-3873/aabadf
- Trakhtenbrot et al. (2019) Trakhtenbrot, B., Arcavi, I., Ricci, C., et al. 2019, Nature Astronomy, 3, 242, doi: 10.1038/s41550-018-0661-3
- van Velzen et al. (2021) van Velzen, S., Gezari, S., Hammerstein, E., et al. 2021, ApJ, 908, 4, doi: 10.3847/1538-4357/abc258
- Wevers et al. (2019a) Wevers, T., Pasham, D. R., van Velzen, S., et al. 2019a, MNRAS, 488, 4816, doi: 10.1093/mnras/stz1976
- Wevers et al. (2019b) Wevers, T., Stone, N. C., van Velzen, S., et al. 2019b, MNRAS, 487, 4136, doi: 10.1093/mnras/stz1602
- White et al. (2000) White, R. L., Becker, R. H., Gregg, M. D., et al. 2000, ApJS, 126, 133, doi: 10.1086/313300
- Wu & Yuan (2018) Wu, X.-J., & Yuan, Y.-F. 2018, MNRAS, 479, 1569, doi: 10.1093/mnras/sty1423
- Yang et al. (2019) Yang, Q., Shen, Y., Liu, X., et al. 2019, ApJ, 885, 110, doi: 10.3847/1538-4357/ab481a
- Yao et al. (2021) Yao, Y., Kulkarni, S. R., Burdge, K. B., et al. 2021, ApJ, 920, 120, doi: 10.3847/1538-4357/ac15f9
- Yao et al. (2023a) Yao, Y., Ravi, V., Gezari, S., et al. 2023a, ApJ, 955, L6, doi: 10.3847/2041-8213/acf216
- Yao et al. (2023b) —. 2023b, ApJ, 955, L6, doi: 10.3847/2041-8213/acf216
- Zhuang & Ho (2023) Zhuang, M.-Y., & Ho, L. C. 2023, Nature Astronomy, doi: 10.1038/s41550-023-02051-4