22institutetext: State Key Laboratory of Space Weather, Chinese Academy of Sciences, Beijing 100190, PR China
33institutetext: School of Astronomy and Space Science, University of Science and Technology of China, Hefei, 230026, PR China
44institutetext: School of Astronomy and Space Science, Nanjing University, Nanjing 210023, China
55institutetext: Key Laboratory of Modern Astronomy and Astrophysics (Nanjing University), Ministry of Education, Nanjing 210023, China
Observational signature of continuously operating drivers of decayless kink oscillation
Abstract
Context. Decayless kink oscillations, which are nearly omnipresent in the solar corona, are believed to be driven by continuously operating energy supply.
Aims. In this letter, we investigate an external continuous excitation of an apparent decayless oscillation during an X1.1 flare on June 20, 2023 (SOL2023-06-20T16:42).
Methods. The decayless kink oscillation was identified in the coronal loop at extreme ultraviolet (EUV) wavelengths and the associated flare quasi-periodic pulsations (QPPs) were simultaneously observed in passbands of hard X-ray (HXR), microwave, and ultraviolet (UV) emissions.
Results. The kink oscillation is detected as a transverse oscillation of the coronal loop, which reveals five apparent cycles with an average period of about 13010 s. The oscillation amplitude does not show any significantly decay, suggesting a decayless oscillation. At the same time, the solar flare occurs in the vicinity of the oscillating loop and exhibits five main pulses in HXR, microwave, and UV emissions, which could be regarded as flare QPPs. They have similar periods of about 100-130 s, which may indicate successive and repetitive energy releases during the flare impulsive phase. The peak of each loop oscillation cycle appears to follow the pulse of the QPPs, suggesting that the transverse oscillation is closely associated with flare QPPs.
Conclusions. Our observations support the scenario where the repetitive energy released following flare QPPs could be invoked as external, continuously operating drivers of the apparent decayless kink oscillation.
Key Words.:
Sun: flares —Sun: oscillations — Sun: X-rays, gamma rays — Coronal loops — Magnetohydrodynamic (MHD)1 Introduction
Kink-mode oscillations are usually identified as transverse oscillations of loop-like structures and they are always characterized by non-axisymmetric and weakly compressive in the long-wavelength regime (see Nakariakov et al., 2021, for a recent review). Kink oscillations are well studied magnetohydrodynamic (MHD) waves, since they play a crucial role in diagnosing the solar magnetic field and measuring plasma parameters, namely, ”MHD coronal seismology” (e.g., Yuan & Van Doorsselaere, 2016; Yang et al., 2020; Chelpanov et al., 2022). They are generally manifested as one of two forms: decaying and decayless oscillations, which are usually dependent on their oscillation amplitudes. The decaying oscillation always reveals a large displacement amplitude, namely, at 1 Mm, it decays fast and only persists for several oscillatory cycles. (Nakariakov et al., 1999; Su et al., 2018; Kumar et al., 2022; Li et al., 2023a, b; Zhang et al., 2023). For the large-amplitude oscillation, the decay time is about 1.79 times larger than the oscillation period on average (Nechaeva et al., 2019). Conversely, the decayless oscillation usually shows small but weakly-decay displacement amplitude, which is less than the minor radius of the oscillating loop (Wang et al., 2012; Anfinogentov et al., 2013; Duckenfield et al., 2018; Mandal et al., 2022). The oscillation periods of standing kink waves are measured from sub-minute to dozens of minutes, and they are linearly increasing with the loop lengths (e.g., Anfinogentov et al., 2015; Nechaeva et al., 2019; Zhang et al., 2022; Petrova et al., 2023; Zhong et al., 2023).
It is well accepted that the kink oscillation should be associated with some external eruptions on the Sun (Nakariakov et al., 2021). The decaying kink oscillation is easily found to be driven by an impulsive driver, for instance, an extreme-ultraviolet (EUV) wave, a solar flare, a flux rope, and a coronal jet (e.g., Zimovets & Nakariakov, 2015; Shen et al., 2018, 2019a, 2019b; Reeves et al., 2020). However, the decayless kink oscillation appears to show no apparent association with the solar transient (e.g., Gao et al., 2022; Zhong et al., 2022a; Li & Long, 2023). On the other hand, the decayless kink oscillation is nearly omnipresent in the solar atmosphere (Tian et al., 2012; Li et al., 2022a), namely, they are frequently observed in the coronal loop (e.g., Li et al., 2020; Safna Banu et al., 2022), the prominence thread (e.g., Arregui et al., 2018; Li et al., 2018a), the hot flare loop (e.g., Li et al., 2018b; Shi et al., 2023), and the coronal bright point (e.g., Gao et al., 2022). Therefore, they could provide ongoing energy to support the energy loss of the solar corona, which are believed to be crucial for the coronal heating (Van Doorsselaere et al., 2020; Yuan et al., 2023). Obviously, the decayless kink oscillation should also have continuous external drivers to supply that counteracts damping (Zhong et al., 2022a; Nakariakov et al., 2021). In order to answer this issue, several models or mechanisms have been proposed, such as the self-oscillatory model (Nakariakov et al., 2016; Karampelas & Van Doorsselaere, 2020), random-motion excitation (Ruderman & Petrukhin, 2021), or p-modes exciter (Gao et al., 2023). A series of magnetohydrodynamic (MHD) simulations and theoretical calculations have demonstrated that these models can lead to decayless kink oscillations (Nakariakov et al., 2016; Karampelas & Van Doorsselaere, 2020; Ruderman & Petrukhin, 2021; Gao et al., 2023). However, capturing observational evidence of continuously operating drivers of decayless kink oscillations is still rare.
Quasi-periodic pulsations (QPPs) are frequently observed in the light curves of solar flares and often associated with MHD waves in solar atmospheres (see Zimovets et al., 2021a, for a recent review). These phenomena could correspond to the quasi-periodic energy release process (e.g., Zimovets et al., 2021b; Li & Chen, 2022). A typical QPP is generally characterized by a series of regular and repeated pulses and it could be observed in multiple wavelengths, such as radio, H, Ly, extreme-ultraviolet (EUV), soft and hard X-rays (SXR/HXR), and even -rays. The quasi-periods are measured from sub-seconds to several hundreds seconds (e.g., Nakariakov et al., 2010; Kolotkov et al., 2018; Kashapova et al., 2020; Li et al., 2021; Li, 2022; Karlický et al., 2022; Kou et al., 2022; Zhao et al., 2023). The kink oscillation is often observed as the spatial displacement disturbance of loop-like structures, while the QPP refers to the periodic variation of light curves during a solar eruption. Therefore, the kink-mode wave is commonly used to interpret the observed QPP (e.g., Nakariakov et al., 2010; Li et al., 2022b). However, the loop oscillation that is strongly associated with flare QPPs is rarely reported. In this letter, we investigate the decayless kink oscillation of a coronal loop, which could be excited by the repetitive energy releases behind flare QPPs.
2 Observation
We analyzed a coronal loop that was associated with a solar flare occurred on 2023 June 20, which lied in the active region of NOAA 13234 near the solar east limb, namely, S17E73. They were simultaneously measured by the Hard X-ray Imager (HXI; Su et al., 2019; Zhang et al., 2019) on board the Advanced Space-based Solar Observatory111http://aso-s.pmo.ac.cn/sodc/dataArchive.jsp (ASO-S; Gan et al., 2023), Konus-Wind (KW; Lysenko et al., 2022), Geostationary Operational Environmental Satellite (GOES), Expanded Owens Valley Solar Array (EOVSA; Gary et al., 2011), STEREO/WAVES (SWAVES), Atmospheric Imaging Assembly (AIA; Lemen et al., 2012) on board the Solar Dynamics Observatory (SDO), and the Chinese H Solar Explorer222https://ssdc.nju.edu.cn (CHASE; Li et al., 2022; Qiu et al., 2022). Figure 1 shows the light curves in multiple wavelengths during the solar flare. The SXR fluxes at 1-8 Å (red) and 0.5-4 Å (blue) are recorded by GOES-18, which has a time cadence of 1 s.
ASO-S/HXI is designed to image solar flares in the HXR energy range of about 15-300 keV. Its time cadence is 4 s in regular observation mode and can be as high as 0.125 s in burst mode. In this study, we use the full-disk light curve of three total flux monitors (D92, D93, D94) in the range of 20-80 keV interpolated at a time cadence of 1 s from the full cadence light curve, as shown by the magenta line in Figure 1 (b). KW is used for investigating -ray bursts and solar flares, which works in two modes: waiting and triggered modes. The count rate light curve has an accumulation time of 2.944 s in the waiting mode, while it has a varying time resolution (e.g., 2-256 ms) in the triggered mode. Therefore, we interpolate the KW flux at 20-80 keV into an uniform cadence of 2.944 s, as indicated by the green line in Figure 1 (b). We also use the radio dynamic spectra measured by EOVSA and SWAVES, as shown by the background images in Figure 1. SWAVES acquires the radio spectrum with a time cadence of 60 s, and it covers a frequency range of roughly 0.05-16.025 MHz. EOVSA is a microwave radioheliograph, which provides the solar spectrum at frequencies of 1-18 GHz, and the time cadence could be as high as 1 s. We note that some data gaps appear in the EOVSA spectrum.
SDO/AIA takes full-disk solar maps in multiple EUV/UV passbands, and the time cadence of seven EUV passbands is 12 s, while that of two UV passbands is 24 s (Lemen et al., 2012). In this study, we analyze AIA maps in seven passbands of 131 Å (10 MK), 94 Å (6.3 MK), 193 Å (20 MK & 1.6 MK), 211 Å (2.0 MK), 171 Å (0.63 MK), 1600 Å (0.1 MK), and 1700 Å (0.005 MK), as shown in Figure 2. All the AIA maps are pre-processed by aia_prep.pro, and have a same spatial resolution of 1.2″. CHASE provides the spectroscopic observation of the full Sun in wavebands of H and Fe I (Li et al., 2022). Here, we use the spectral images at channels of H 6562.8 Å and Fe I 6569.2 Å, which mainly form in the solar chromosphere and photosphere, respectively. Each spatial pixel corresponds to 1.04″, and the time cadence is about 71 s.
3 Results
Figure 1 presents the solar flare observed in passbands of SXR, HXR and radio and microwave emissions. Panel (a) shows full-disk light curves at GOES 1-8 Å (red) and 0.5-4.0 Å (blue) from 16:41 UT to 17:30 UT. The GOES flux indicates an X1.1-class flare, which begins at 16:42 UT, and reach its maximum at 17:09 UT. The orange line represents the local EUV flux in the wavelength of AIA 131 Å, which is integrated over the flare region. Figure 1 (b) shows HXR and microwave fluxes during 16:56-17:15 UT measured by ASO-S/HXI (magenta), KW (green), and EOVSA (cyan), respectively. Those light curves match well with each other, and they all reveal at least five pulses, which could be regarded as flare QPPs. The background images are radio dynamic spectra observed by SWAVES (a) and EOVSA (b), which show type III radio bursts at the lower and higher frequency ranges, suggesting that nonthermal electrons are accelerated via magnetic reconnections during the flare impulsive phase.
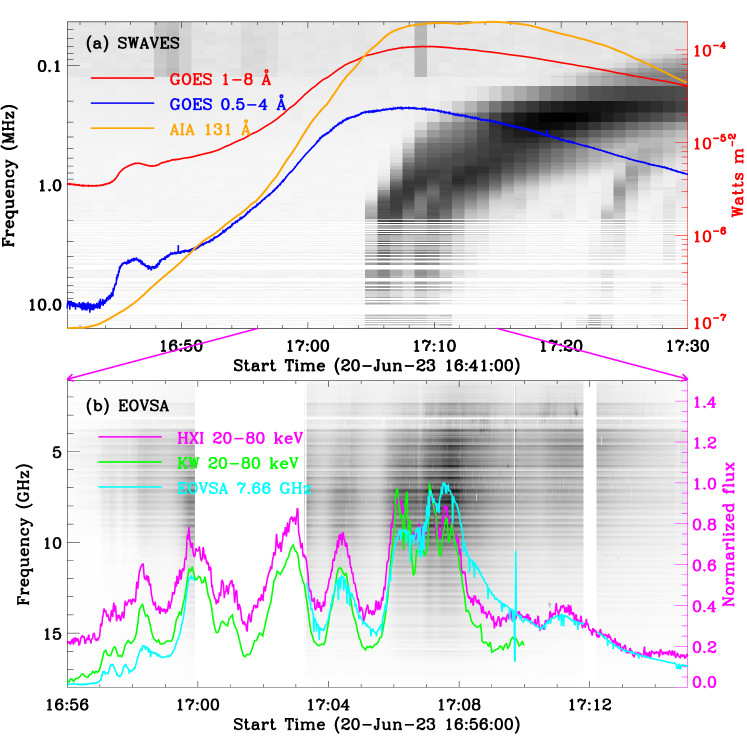
Figure 2 shows the multi-wavelength images with a field of view (FOV) of 240″240″. Panels (a)-(c) plot EUV maps in high-temperature wavelengths of AIA 131 Å, 94 Å, and 193 Å, which display some hot flare loops. The gold rectangle outlines the flare region used to integrate the local flux at AIA 131 Å in Figure 1 (a). While panels d-h illustrate the EUV/UV and H maps in passbands of AIA 171 Å, 211 Å, 1600 Å, 1700 Å, and CHASE 6562.8 Å, they all exhibit double flare ribbons and are spatially correlated with two footpoints seen in the HXR emission, as outlined by the green and magenta contours. The HXR map during 17:04:07-17:04:37 UT is reconstructed by the HXI_CLEAN method (pattern-based CLEAN algorithm for HXI), utilizing the detectors from D19 to D91, namely, the subcollimator group G3 to G10, with a spatial resolution of about 6.5″. We exclude the fine grids of G1 and G2 since they are not calibrated yet and the fine structures are not the focus of this study. It should be pointed out that ASO-S was in calibration mode for other payloads during this flare and was therefore pointing away from the solar disk center. The HXI pointing data was regenerated using a machine-learning method. Panel i presents the CHASE map in the wavelength of Fe I 6569.2 Å, and we can see a sunspot, but no signature of the flare radiation. It is interesting that a bunch of coronal loops can be found in passbands of AIA 171 Å, 211 Å, and 193 Å, as indicated by the cyan arrow.
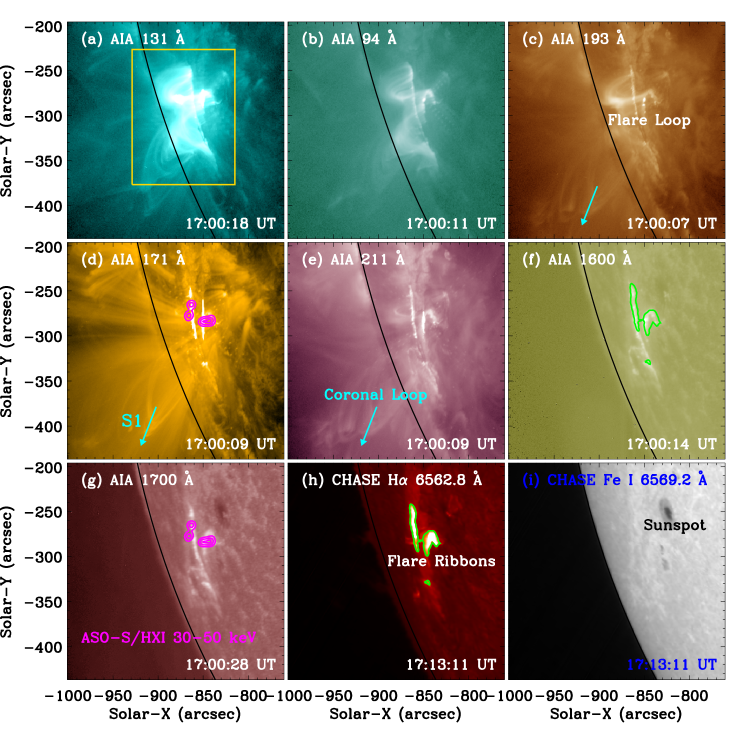
The online animation (anim.mp4) shows the evolution of the solar flare and the associated coronal loops. It can be seen that the coronal loops appear transverse oscillations follow the flare eruption. In order to capture the appearance of transverse oscillations, one artificial straight slit (S1), which is nearly perpendicular to the loop axis, is selected to generate the time-distance (TD) maps. The cut slit is chosen at the position that is close to the apparent loop apex, where is less overlapping with the neighboring loops, as marked by the cyan arrow in Figure 2. Figure 3 presents the TD maps at slit S1 in passbands of AIA 171 Å, 193 Å, and 211 Å. We can immediately notice that several transverse oscillations appear in these TD maps. Herein, there is only one transverse oscillation that shows five apparent peaks analyzed, since it can be clearly seen in three AIA passbands. Here, the peak of loop oscillation refers to the maximum displacement of transverse oscillations in the TD map. Similarly to previous studies (e.g., Mandal et al., 2021; Zhong et al., 2022b), the oscillation positions are determined from the bright centers of the coronal loop at AIA 171 Å by using the Gaussian fitting method, as marked by the black pluses (‘+’) in panel (a). The transverse oscillation does not show any apparent decay, but it drifts nonlinearly in the plane-of-sky. Therefore, the combination of a sine function and a nonlinear trend is applied to fit the loop oscillation (e.g., Anfinogentov et al., 2015; Li et al., 2020; Gao et al., 2022; Li & Long, 2023), as shown by Equation 1:
| (1) |
Here, represents the displacement amplitude, is the oscillation period, and refers to the initial phase, while stands for the second-order polynomial approximation. Next, the velocity amplitude () is obtained by the derivative of the displacement amplitude (cf. Li et al., 2022a, 2023a; Petrova et al., 2023). The overplotted magenta curve in Figure 3 is the best-fitting result with Equation 1 and it appears to agree with the oscillation positions (‘+’). The green line in panel a represents a nonlinear trend of the oscillating loop, which is derived from a second-order polynomial approximation. We want to state that the magenta curve in panels b and c is exactly the same as that in panel a and it seems to be not a good fit in passbands of AIA 193 Å and 211 Å. On the other hand, they appear to match with each other when we consider the fitting uncertainty, as shown by the cyan error bars.
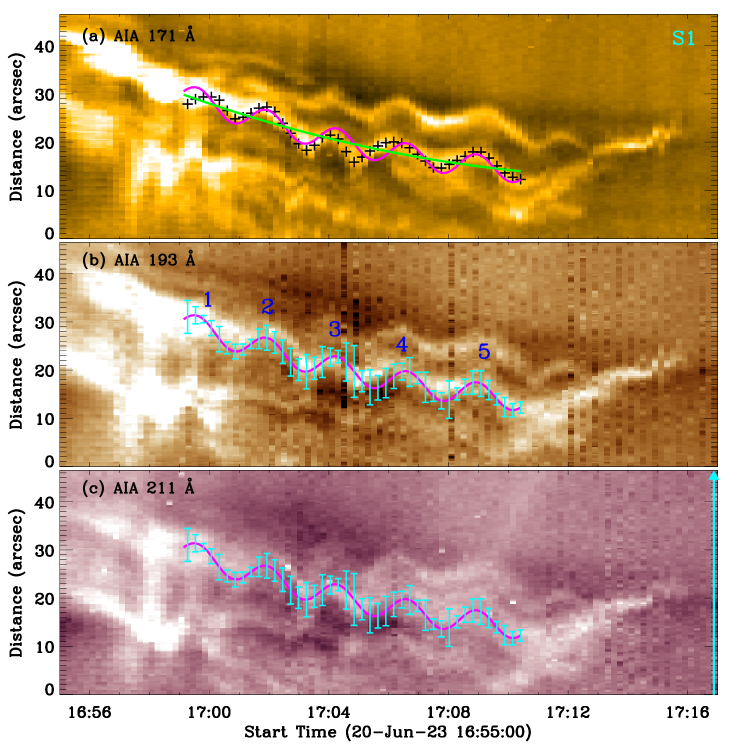
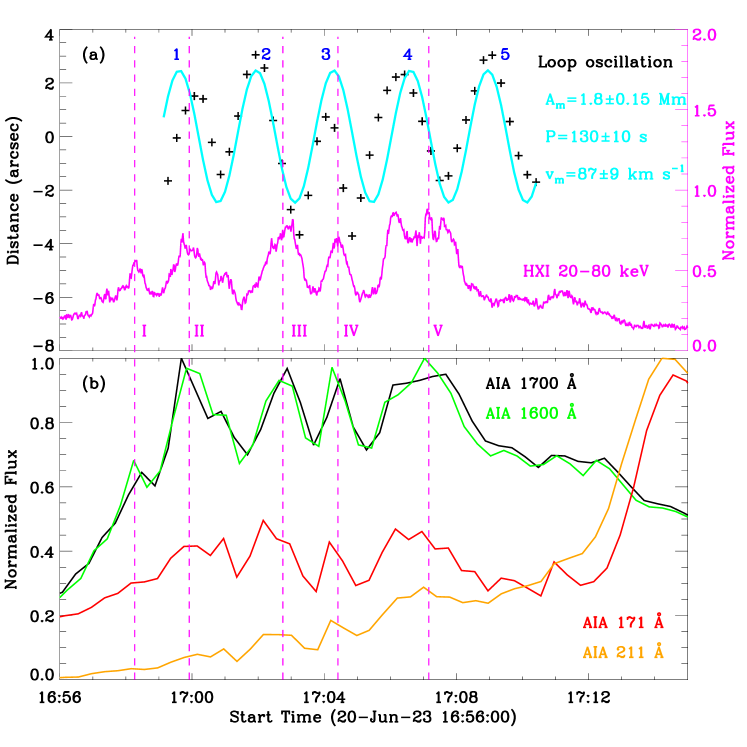
Figure 4 (a) presents the oscillating positions (‘+’) of the coronal loop and the best-fitting result (cyan) after removing the nonlinear trend (), the fitting parameters and their uncertainties such as the oscillation period, displacement and velocity amplitudes are also labeled. The normalized HXR flux at HXI 20-80 keV is also drawn, as shown by the magenta curve. One can immediately notice that both the loop oscillation and the HXR flux reveal at least 5 cycles, as marked by the Arabic and English numbers. The cycle of each HXR pulse appears earlier than that of the loop oscillation, and a time difference of about 110 s was estimated via cross correlation. Those observational facts imply that the transverse oscillation of the coronal loop could be strongly associated with the flare QPP in the HXR channel. We also notice that the HXR flux appears much more small sub-peaks, for instance, the HXR pulse ”V” contains three sub-peaks, which might be due to the high time resolution of ASO-S/HXI. We then plot local light curves integrated over the flare region (gold rectangle in Figure 2), as shown in Figure 4 (b). Obviously, the light curves in passbands of AIA 1700 Å (black) and 1600 Å (green) display five apparent peaks, which are almost synchronous with the HXR pulses, as indicated by the dashed vertical lines. On the other hand, the light curves at AIA 171 Å (black) and 211 Å (green) also show five main peaks, while some main peaks also contain sub-peaks, similarly to what has observed in the HXR flux; this suggests the coexistence of multiple periodicities in the flare emission.
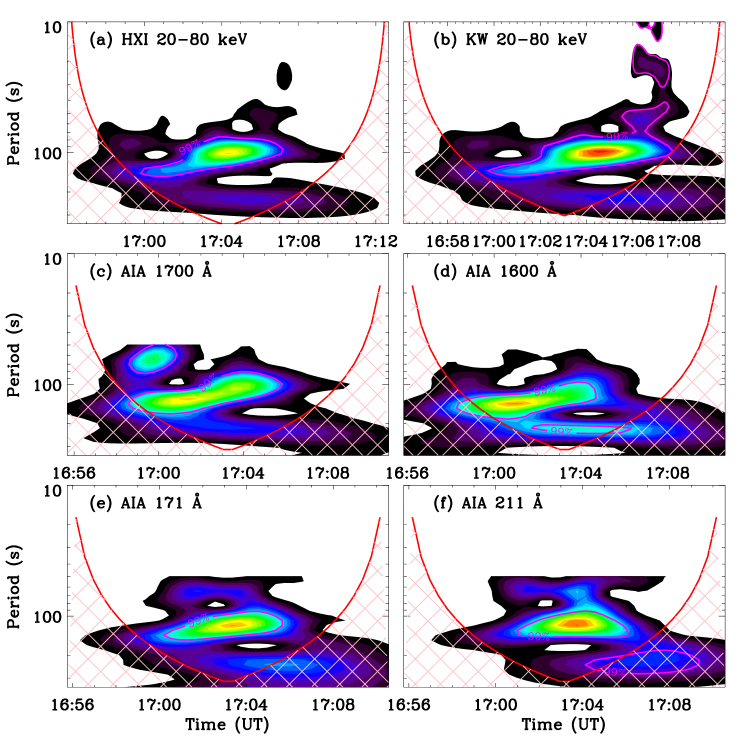
In order to identify the quasi-period of flare QPPs, the wavelet transform with the ”Morlet” mother function (Torrence & Compo, 1998) was applied for the detrended light curves after removing a 180 s running average (Tian et al., 2012; Li et al., 2018b), since we want to enhance the short-period oscillation and suppress the long-period trend. Figure 5 shows the Morlet wavelet power spectra in passbands of HXI 20-80 keV (a), KW 20-80 keV (b), AIA 1700 Å (c), 1600 Å (d), 171 Å (e), and 211 Å (f). They all show an enhanced power over a broad range of quasi-periods, namely, a periodicity range of about 100-130 s. We want to state that the quasi-periods refer to the enhanced power range inside the 99% significance level. The quasi-periods agree with the average period (i.e., 13010 s) of the loop oscillation, confirming that the transverse oscillation of the coronal loop could be strongly associated the flare QPPs. We did not perform the wavelet transform for the radio data measured by EOVSA because it has some data gaps, resulting into a discontinuous microwave flux.
4 Discussion
Transverse oscillations are commonly detected in loop-like structures, such as coronal and flare loops, prominence or filament threads, and even umbral fibrils (e.g., Anfinogentov et al., 2015; Nechaeva et al., 2019; Li et al., 2020, 2022a; Zhang et al., 2022; Yuan et al., 2023). In this letter, we study the transverse oscillation of a coronal loop, which is perpendicular to the loop axis at the apparent loop apex. It shows five significant cycles and reveals no apparent decay in the displacement amplitude, which could be regarded as the decayless kink oscillation (Tian et al., 2012; Anfinogentov et al., 2015; Li & Long, 2023). The observed kink oscillation shows an average period of 13010 s, which is consistent with previous observations that were in the range of tens to hundreds of seconds (Anfinogentov et al., 2015; Li et al., 2020; Mandal et al., 2021; Shi et al., 2022; Zhong et al., 2023). While it has a large displacement amplitude, which is measured to be about 1.80.15 Mm. Such a large displacement amplitude is rarely reported in decayless oscillations. Previous observations found that their displacement amplitude have mostly been less than 0.5 Mm (Anfinogentov et al., 2015; Gao et al., 2022) and the maximal displacement amplitude of 1.16 Mm was detected in decayless kink oscillations induced by a solar flare (cf. Mandal et al., 2021). Li et al. (2020) also reported a decayless kink oscillation with an amplitude of 0.8 Mm. On the other hand, our velocity amplitude is estimated to be 87 km s-1 and it is much larger than previous statistical studies for decayless oscillations within longer periods, namely, 1-8 km s-1 (Tian et al., 2012; Gao et al., 2022). Our velocity amplitude is similar to those of decayless oscillations with shorter periods (e.g., Petrova et al., 2023; Li & Long, 2023).
A solar flare occurs near the footpoint of the oscillating loop. It shows five repetitive and successive pulses at HXR 20-80 keV measured by ASO-S/HXI and KW, which could be regarded as the signature of flare QPPs. It has a broad range of quasi-periods, such as about 100-130 s. The flare QPPs within similar quasi-periods are also observed in EUV/UV passbands of AIA 1700 Å, 1600 Å, 171 Å, and 211 Å, and these AIA channels show double flare ribbons, which superposed on two HXR footpoints. While those AIA channels at AIA 131 Å, 94 Å and 193 Å do not show the similar QPP feature, since they reveal flare loops. Moreover, some HXR/UV pulses appear to match well with the radio peaks observed by EOVSA, implying the presence of QPP in the microwave emission. Our observations suggest that the flare QPPs are probably caused by repetitive magnetic reconnections (e.g., Kupriyanova et al., 2020; Zimovets et al., 2021a), which could periodically accelerate nonthermal electrons that precipitate into flare footpoints or ribbons. The repeated magnetic reconnections will lead to quasi-periodic energy release processes, namely, five energy releases during the X1.1 flare.
It is interesting that the same periodicity is found between the decayless oscillation and flare QPPs. Moreover, each cycle of the flare QPPs appears earlier than that of the decayless oscillation. Thus, the repetitive energy releases of the X1.1 flare could be considered as continuously operating drivers of the decayless kink oscillation. The large displacement amplitude could be attributed to the X1.1 flare, which could release a large amount of energies. This is different from previous observations of large-amplitude decayless oscillations that were triggered by small flares (Mandal et al., 2021) or small reconnection events (Li et al., 2020). Mandal et al. (2021) found that the solar flare could only increase oscillation amplitudes but did not change the oscillation nature (see also Shi et al., 2022). However, these studies did not show a distinct one-to-one correspondence over time. In our case, the energy flow appears as ”an external driver” induced by a single flare energy release, leading to a large-amplitude kink oscillation of the coronal loop, followed by plasma heating caused by rapid damping (i.e., one oscillation cycle). This process is repeated five times, since the solar flare shows five energy releases via repetitive magnetic reconnections. This model could also explain the small-amplitude decayless oscillation, supposing that the external drivers are continuously existing. However, those external drivers are difficult to observe, mainly because of their fine scales.
Here, we assume the similar damping mechanism in decayless oscillations with the decaying oscillations and it is compensated with continuous energy supply from the ongoing flare energy releases. Then, we can construct an equation like:
| (2) |
where represents the energy (kinetic + magnetic) density averaged over the oscillation cycle, is the decaying time measured for the displacement amplitude, while , , and are the velocity amplitude, plasma density and magnetic field perturbation, respectively. Then, its derivative at t=0 will give us an estimation for the oscillation energy losses ():
| (3) |
In this study, we know that the decayless oscillation has five oscillation cycles, which correspond to five-cycle energy releases from the flare. If the oscillating loop is affected by a periodic force with the oscillation period, the effect of the resonance must take place and the oscillation amplitude would grow over time (Nakariakov et al., 2009). However, the observed amplitude remains constant, suggesting that the wave energy of each oscillation cycle could completely dissipate at a time scale shorter than or approximately equal to one oscillation period, namely, . According to the resonant absorption theory (Goossens et al., 2002), such a short decay time indicates an abnormal ratio of the loop radius and thickness of the transition layer or an abnormal density ratio inside and outside the loop, either too dense or too rarified. Possible supporting observational evidence to this interpretation is the half-cycle transverse perturbation of the outer loop in Ning et al. (2022). In this work, measuring the loop density may answer this concern but out of the scope of this work. Nevertheless, additional observations and numerical simulations in this direction are necessary for further investigation in the future.
5 Summary
Using the observations from SDO/AIA, ASO-S/HXI, KW, CHASE, EOVSA, SWAVES, and GOES, we investigated an apparent decayless kink oscillation and the associated flare QPPs. Our main conclusions are summarized as follows:
(1) The apparent decayless kink oscillation can be simultaneously seen in passbands of AIA 171 Å, 193 Å, and 211 Å, indicating that the oscillating loop is multi-thermal in nature. The oscillation period is measured to be about 13010 s and the displacement amplitude is as large as 1.80.15 Mm.
(2) The flare QPPs are simultaneously detected in passbands of HXI 20-80 keV, KW 20-80 keV, AIA 1700 Å, 1600 Å, 171 Å, and 211 Å during the flare impulsive phase, which might be caused by repetitive magnetic reconnections. The quasi-period is estimated to be 100-130 s. The large period range implies the co-existence of multiple periodicities.
(3) The apparent decayless kink oscillation and flare QPPs share the same quasi-period and a significant time difference of about 110 s can be seen between them. Those observational facts provide sufficient evidences that the decayless kink oscillation could be driven by continuously operating energies released from the X1.1 flare.
(4) We propose that the repetitive energy releases behind the flare QPPs could trigger the kink oscillation intermittently for five times, making it apparent decayless. In this interpretation, each cycle of the kink oscillation is assumed to decay rapidly in less than one oscillation period.
Acknowledgements.
The authors would like to thank the referee for valuable comments and suggestions. This work is funded by the National Key R&D Program of China 2022YFF0503002 (2022YFF0503000), NSFC under grants 11973092, 12073081, 12333009, 12333010, 11820101002. D. Li is supported by the Surface Project of Jiangsu Province (BK20211402) and the Specialized Research Fund for State Key Laboratories. Z. T. Li is supported by the Prominent Postdoctoral Project of Jiangsu Province. This work is also supported by the Strategic Priority Research Program of the Chinese Academy of Sciences, Grant No. XDB0560000. ASO-S mission is supported by the Strategic Priority Research Program on Space Science, the Chinese Academy of Sciences, Grant No. XDA15320000. The CHASE mission is supported by China National Space Administration (CNSA).References
- Anfinogentov et al. (2013) Anfinogentov, S., Nisticò, G., & Nakariakov, V. M. 2013, A&A, 560, A107. doi:10.1051/0004-6361/201322094
- Anfinogentov et al. (2015) Anfinogentov, S. A., Nakariakov, V. M., & Nisticò, G. 2015, A&A, 583, A136. doi:10.1051/0004-6361/201526195
- Arregui et al. (2018) Arregui, I., Oliver, R., & Ballester, J. L. 2018, Living Reviews in Solar Physics, 15, 3. doi:10.1007/s41116-018-0012-6
- Chelpanov et al. (2022) Chelpanov, M., Anfinogentov, S., Kostarev, D., et al. 2022, Solar-Terrestrial Physics, 8, 3. doi:10.12737/stp-84202201
- Duckenfield et al. (2018) Duckenfield, T., Anfinogentov, S. A., Pascoe, D. J., et al. 2018, ApJ, 854, L5. doi:10.3847/2041-8213/aaaaeb
- Gan et al. (2023) Gan, W., Zhu, C., Deng, Y., et al. 2023, Sol. Phys., 298, 68. doi:10.1007/s11207-023-02166-x
- Gao et al. (2022) Gao, Y., Tian, H., Van Doorsselaere, T., et al. 2022, ApJ, 930, 55. doi:10.3847/1538-4357/ac62cf
- Gao et al. (2023) Gao, Y., Guo, M., Van Doorsselaere, T., et al. 2023, arXiv:2308.13813. doi:10.48550/arXiv.2308.13813
- Goossens et al. (2002) Goossens, M., Andries, J., & Aschwanden, M. J. 2002, A&A, 394, L39. doi:10.1051/0004-6361:20021378
- Gary et al. (2011) Gary, D. E., Hurford, G. J., Nita, G. M., et al. 2011, AAS/Solar Physics Division Abstracts 42
- Karampelas & Van Doorsselaere (2020) Karampelas, K. & Van Doorsselaere, T. 2020, ApJ, 897, L35. doi:10.3847/2041-8213/ab9f38
- Kashapova et al. (2020) Kashapova, L. K., Kupriyanova, E. G., Xu, Z., et al. 2020, A&A, 642, A195. doi:10.1051/0004-6361/201833947
- Karlický et al. (2022) Karlický, M., Rybák, J., Benáček, J., et al. 2022, Sol. Phys., 297, 54. doi:10.1007/s11207-022-01989-4
- Kolotkov et al. (2018) Kolotkov, D. Y., Pugh, C. E., Broomhall, A.-M., et al. 2018, ApJ, 858, L3. doi:10.3847/2041-8213/aabde9
- Kou et al. (2022) Kou, Y., Cheng, X., Wang, Y., et al. 2022, Nature Communications, 13, 7680. doi:10.1038/s41467-022-35377-0
- Kumar et al. (2022) Kumar, P., Nakariakov, V. M., Karpen, J. T., et al. 2022, ApJ, 932, L9. doi:10.3847/2041-8213/ac6e3e
- Kupriyanova et al. (2020) Kupriyanova, E., Kolotkov, D., Nakariakov, V., et al. 2020, Solar-Terrestrial Physics, 6, 3. doi:10.12737/stp-61202001
- Lemen et al. (2012) Lemen, J. R., Title, A. M., Akin, D. J., et al. 2012, Sol. Phys., 275, 17. doi:10.1007/s11207-011-9776-8
- Li et al. (2022) Li, C., Fang, C., Li, Z., et al. 2022, Science China Physics, Mechanics, and Astronomy, 65, 289602. doi:10.1007/s11433-022-1893-3
- Li et al. (2018a) Li, D., Shen, Y., Ning, Z., et al. 2018a, ApJ, 863, 192. doi:10.3847/1538-4357/aad33f
- Li et al. (2018b) Li, D., Yuan, D., Su, Y. N., et al. 2018b, A&A, 617, A86. doi:10.1051/0004-6361/201832991
- Li et al. (2020) Li, D., Li, Y., Lu, L., et al. 2020, ApJ, 893, L17. doi:10.3847/2041-8213/ab830c
- Li et al. (2021) Li, D., Ge, M., Dominique, M., et al. 2021, ApJ, 921, 179. doi:10.3847/1538-4357/ac1c05
- Li et al. (2022a) Li, D., Xue, J., Yuan, D., et al. 2022a, Science China Physics, Mechanics, and Astronomy, 65, 239611. doi:10.1007/s11433-021-1836-y
- Li et al. (2022b) Li, D., Shi, F., Zhao, H., et al. 2022b, Frontiers in Astronomy and Space Sciences, 9, 1032099. doi:10.3389/fspas.2022.1032099
- Li (2022) Li, D. 2022, Science in China E: Technological Sciences, 65, 139. doi:10.1007/s11431-020-1771-7
- Li & Chen (2022) Li, D. & Chen, W. 2022, ApJ, 931, L28. doi:10.3847/2041-8213/ac6fd2
- Li & Long (2023) Li, D. & Long, D. M. 2023, ApJ, 944, 8. doi:10.3847/1538-4357/acacf4
- Li et al. (2023a) Li, D., Bai, X., Tian, H., et al. 2023a, A&A, 675, A169. doi:10.1051/0004-6361/202245812
- Li et al. (2023b) Li, D., Hou, Z., Bai, X., et al. 2023, arXiv:2311.08767. doi:10.48550/arXiv.2311.08767
- Lysenko et al. (2022) Lysenko, A. L., Ulanov, M. V., Kuznetsov, A. A., et al. 2022, ApJS, 262, 32. doi:10.3847/1538-4365/ac8b87
- Mandal et al. (2021) Mandal, S., Tian, H., & Peter, H. 2021, A&A, 652, L3. doi:10.1051/0004-6361/20214154
- Mandal et al. (2022) Mandal, S., Chitta, L. P., Antolin, P., et al. 2022, A&A, 666, L2. doi:10.1051/0004-6361/202244403
- Nakariakov et al. (1999) Nakariakov, V. M., Ofman, L., Deluca, E. E., et al. 1999, Science, 285, 862. doi:10.1126/science.285.5429.862
- Nakariakov et al. (2009) Nakariakov, V. M., Aschwanden, M. J., & van Doorsselaere, T. 2009, A&A, 502, 661. doi:10.1051/0004-6361/200810847
- Nakariakov et al. (2010) Nakariakov, V. M., Foullon, C., Myagkova, I. N., et al. 2010, ApJ, 708, L47. doi:10.1088/2041-8205/708/1/L47
- Nakariakov et al. (2016) Nakariakov, V. M., Anfinogentov, S. A., Nisticò, G., et al. 2016, A&A, 591, L5. doi:10.1051/0004-6361/201628850
- Nakariakov et al. (2021) Nakariakov, V. M., Anfinogentov, S. A., Antolin, P., et al. 2021, Space Sci. Rev., 217, 73. doi:10.1007/s11214-021-00847-2
- Nechaeva et al. (2019) Nechaeva, A., Zimovets, I. V., Nakariakov, V. M., et al. 2019, ApJS, 241, 31. doi:10.3847/1538-4365/ab0e86
- Ning et al. (2022) Ning, Z., Wang, Y., Hong, Z., et al. 2022, Sol. Phys., 297, 2. doi:10.1007/s11207-021-01935-w
- Petrova et al. (2023) Petrova, E., Magyar, N., Van Doorsselaere, T., et al. 2023, ApJ, 946, 36. doi:10.3847/1538-4357/acb26a
- Qiu et al. (2022) Qiu, Y., Rao, S., Li, C., et al. 2022, Science China Physics, Mechanics, and Astronomy, 65, 289603. doi:10.1007/s11433-022-1900-5
- Ruderman & Petrukhin (2021) Ruderman, M. S. & Petrukhin, N. S. 2021, MNRAS, 501, 3017. doi:10.1093/mnras/staa3816
- Reeves et al. (2020) Reeves, K. K., Polito, V., Chen, B., et al. 2020, ApJ, 905, 165. doi:10.3847/1538-4357/abc4e0
- Safna Banu et al. (2022) Safna Banu, K., Maurya, R. A., & Jain Jacob, P. T. 2022, Sol. Phys., 297, 134. doi:10.1007/s11207-022-02065-7
- Shen et al. (2018) Shen, Y., Tang, Z., Li, H., et al. 2018, MNRAS, 480, L63. doi:10.1093/mnrasl/sly127
- Shen et al. (2019a) Shen, Y., Qu, Z., Yuan, D., et al. 2019a, ApJ, 883, 104. doi:10.3847/1538-4357/ab3a4d
- Shen et al. (2019b) Shen, Y., Qu, Z., Zhou, C., et al. 2019b, ApJ, 885, L11. doi:10.3847/2041-8213/ab4cf3
- Shi et al. (2022) Shi, F., Ning, Z., & Li, D. 2022, Research in Astronomy and Astrophysics, 22, 105017. doi:10.1088/1674-4527/ac8f8a
- Shi et al. (2023) Shi, M., Li, B., Chen, S.-X., et al. 2023, ApJ, 943, L19. doi:10.3847/2041-8213/acb3c6
- Su et al. (2018) Su, W., Guo, Y., Erdélyi, R., et al. 2018, Scientific Reports, 8, 4471. doi:10.1038/s41598-018-22796-7
- Su et al. (2019) Su, Y., Liu, W., Li, Y.-P., et al. 2019, Research in Astronomy and Astrophysics, 19, 163. doi:10.1088/1674-4527/19/11/163
- Tian et al. (2012) Tian, H., McIntosh, S. W., Wang, T., et al. 2012, ApJ, 759, 144. doi:10.1088/0004-637X/759/2/144
- Torrence & Compo (1998) Torrence, C. & Compo, G. P. 1998, Bulletin of the American Meteorological Society, 79, 61. doi:10.1175/1520-0477(1998)079<0061:APGTWA>2.0.CO;2
- Van Doorsselaere et al. (2020) Van Doorsselaere, T., Srivastava, A. K., Antolin, P., et al. 2020, Space Sci. Rev., 216, 140. doi:10.1007/s11214-020-00770-y
- Wang et al. (2012) Wang, T., Ofman, L., Davila, J. M., et al. 2012, ApJ, 751, L27. doi:10.1088/2041-8205/751/2/L27
- Yang et al. (2020) Yang, Z., Tian, H., Tomczyk, S., et al. 2020, Science in China E: Technological Sciences, 63, 2357. doi:10.1007/s11431-020-1706-9
- Yuan & Van Doorsselaere (2016) Yuan, D. & Van Doorsselaere, T. 2016, ApJS, 223, 23. doi:10.3847/0067-0049/223/2/23
- Yuan et al. (2023) Yuan, D., Fu, L., Cao, W., et al. 2023, Nature Astronomy. doi:10.1038/s41550-023-01973-3
- Zhang et al. (2022) Zhang, Q., Li, C., Li, D., et al. 2022, ApJ, 937, L21. doi:10.3847/2041-8213/ac8e01
- Zhang et al. (2023) Zhang, Q., Zhou, Y., Li, C., et al. 2023, ApJ, 951, 126. doi:10.3847/1538-4357/acd5cf
- Zhang et al. (2019) Zhang, Z., Chen, D.-Y., Wu, J., et al. 2019, Research in Astronomy and Astrophysics, 19, 160. doi:10.1088/1674-4527/19/11/160
- Zhao et al. (2023) Zhao, H.-S., Li, D., Xiong, S.-L., et al. 2023, Science China Physics, Mechanics, and Astronomy, 66, 259611. doi:10.1007/s11433-022-2064-6
- Zhong et al. (2022a) Zhong, S., Nakariakov, V. M., Kolotkov, D. Y., et al. 2022a, MNRAS, 513, 1834. doi:10.1093/mnras/stac1014
- Zhong et al. (2022b) Zhong, S., Nakariakov, V. M., Kolotkov, D. Y., et al. 2022b, MNRAS, 516, 5989. doi:10.1093/mnras/stac2545
- Zhong et al. (2023) Zhong, S., Nakariakov, V. M., Miao, Y., et al. 2023, Scientific Reports, 13, 12963. doi:10.1038/s41598-023-40063-2
- Zimovets & Nakariakov (2015) Zimovets, I. V. & Nakariakov, V. M. 2015, A&A, 577, A4. doi:10.1051/0004-6361/201424960
- Zimovets et al. (2021a) Zimovets, I. V., McLaughlin, J. A., Srivastava, A. K., et al. 2021a, Space Sci. Rev., 217, 66. doi:10.1007/s11214-021-00840-9
- Zimovets et al. (2021b) Zimovets, I., Sharykin, I., & Myshyakov, I. 2021b, Sol. Phys., 296, 188. doi:10.1007/s11207-021-01936-9