Identification of Blue Horizontal-Branch Stars From LAMOST DR5
Abstract
We construct a new catalog of the blue horizontal-branch (BHB) stars from the Large Sky Area Multi-Object Fiber Spectroscopic Telescope (LAMOST) DR5 dataset, which contains 5355+81 BHB stars at high Galactic latitude (). We combine the spectral line indices with a set of Balmer line profile selection criteria to identify the BHB stars. During the selection process, we use the line index of Ca II K to exclude the metal-rich A-type dwarfs. We obtain their atmospheric parameters by cross-matching our BHB stars with the catalog provided by Xiang et al. (2022). The results show that our sample is consistent with the theoretical -log evolutionary tracks of the BHB stars, indicating that our method is robust for identifying BHB stars from the LAMOST spectra. Their spatial distribution indicates that most of our BHB stars are located in the inner halo or the disk of the Milky Way. Combined with other BHB samples from the literature, the BHB stars can cover a large Galactic volume, which makes it a better probe for studying the kinematics, dynamics, and structural characteristics of the Milky Way.
1 Introduction
The blue horizontal-branch (BHB) stars are old, metal-poor Population II stars with mass less than 1.0 , which are often found in the Galactic halo. They are first clearly detected present day and well-defined in Galactic globular clusters (Arp et al., 1952). BHB stars generally rotate slowly, with 20 km s-1, but some stars are found to be rotating as high as 40 km s-1 (Cohen et al., 1997). BHB stars are located on the blue side of RR Lyrae variables on the Hertzsprung-Russell (H-R hereafter) diagram. It now burns helium in its core and hydrogen in shells outside the core (Ruhland et al., 2011). The majority of the BHB stars are A-type stars ( 12,000 K, Catelan et al., 2009).
BHB stars are luminous and have a nearly constant absolute magnitude within a restricted color range, allowing them to be identified even at large distances. Historically, BHB stars and RR Lyrae stars as the standard candle for tracing the distance are usually used to constrain the kinematics of the local halo (Pier et al., 1984; Layden et al., 1996). Considering that the number of BHB stars is more than ten times that of RR Lyrae stars, it is more likely to use BHB stars to study Galactic halo (Pier et al., 1983; Sommer et al., 1986; Flynn et al., 1988; Sommer et al., 1989; Preston et al., 1991; Arnold et al., 1992; Kinman et al., 1994; Beers et al., 1996, 2007; Christlieb et al., 2007; Thom et al., 2005; Sommer et al., 1997; Preston et al., 1991; York et al., 2000; Santucci et al., 2011; Deason et al., 2011; Clewley et al., 2006), and they are the most favorable for estimating the mass distribution of the halo. Based on the sample of BHB stars from the Sloan Digital Sky Survey (SDSS, York et al., 2000), Xue et al. (2011) accurately determined the Galactic mass, i.e., about 100 billion solar masses.
Early catalogs (Pier et al., 1983; Beers et al., 1988) relied mostly on the data obtained by the narrow-band objective-prism surveys, where two main features of strong and weak or absent Ca II K were used. Two main methods have been used to identify BHB stars from the data gathered by large-scale sky surveys, one of which uses photometric methods. Beers et al. (2007) used the coordinates and photometric data () to identify 12,056 field horizontal-branch stars from the Two Micron All Sky Survey (2MASS, Skrutskie et al., 2006). Brown et al. (2008) selected 2,414 BHB candidates from 2MASS catalog using , and with 67% purity. Montenegro et al. (2019) discovered 12,554 BHB stars using the globular cluster M22 as a reference standard and constructing color–magnitude, and color–color diagrams with precise cuts in the ZYJHK from the Vía Láctea (VVV) ESO Public Survey data. Culpan et al. (2021) selected 57,377 BHB stars using the color and absolute magnitude () from Gaia early data release 3 (EDR3, Gaia Collaboration, 2020), and the purity is about 70%. But the effect of extinction is inevitable, which can usually lead to serious contamination. Another approach is to base not only on photometry but also on spectral features. Xue et al. (2011) got 4,985 BHB stars from SDSS DR8 through color cuts and selection criteria for Balmer line profiles. In addition to the above two methods, Vickers et al. (2021) generated a catalog of 13,693 BHB stars from the LAMOST DR5 through a machine-learning algorithm with the training data from Brown et al. (2008) and Xue et al. (2008), respectively.
The major difficulty in selecting BHB stars is distinguishing them from A-type dwarfs and blue stragglers (BS). A-type dwarfs have high surface gravity, while BHB stars have lower surface gravity and show solid and sharp in the Stark pressure-broadened Balmer line profiles (Pier et al., 1983; Kinman et al., 1994; Wilhelm et al., 1999a; Clewley et al., 2002, 2006; Brown et al., 2008). BS has similar effective temperatures but is dimmer and also has higher gravity than BHB stars. Photometric methods cannot accurately obtain these features, and spectroscopic methods are necessary. Additionally, BHB stars are metal-poor stars. To avoid the contamination of metal-rich stars, it is able to acquire BHB stars by cutting metallicity.
This work aims to use LAMOST DR5 to construct a new BHB star catalog with a low contamination rate and extensive coverage of the sky area. This paper is structured as follows: In Section 2, we present the primary data of LAMOST DR5 and describe the details of the approach to identifying BHB stars. In Section 3, we investigate the reliability of our sample and discuss our results. The summary and conclusions are in Section 4.
2 DATA
To identify BHB stars, we adopt the method used by Sirko et al. (2004) and Xue et al. (2008) with partial modification. Here, we use the spectral indices cuts instead of their color cuts. The advantage of the spectral indices over colors is that the effect of Galactic extinction can be avoided.
2.1 The LAMOST data
LAMOST is a 4 m reflective Schmidt telescope with a wavelength coverage of 370 - 900 nm and (Cui et al., 2012; Zhao et al., 2012; Luo et al., 2012). Due to its unique design, LAMOST can take about 4,000 spectra with a limiting magnitude of (Deng et al., 2012). More than 10 million low-resolution spectra have been obtained. With such a large amount of spectra, many interesting but relatively rare stellar objects have been identified, such as carbon stars with strong CH, CN, and C2 absorption bands (Ji et al., 2016; Li et al., 2018), Mira variables with high excitation emission lines which vary with the pulsation cycle (Yao et al., 2016), and OB-type stars with strong neutral or ionized He lines and slightly weak Balmer lines (Liu et al., 2019), etc. The large stellar spectra sample is also suitable for identifying BHB stars.
2.2 Line indices
As shown by Liu et al. (2015), some spectral line indices are sensitive to the atmospheric parameters of stars, e.g., the effective temperature, surface gravity, etc. This means that we can use spectral line features to identify the stars with different spectral types and luminosity classes. Using the criteria of the spectral line indices, carbon stars (Ji et al., 2016) and OB-type stars (Liu et al., 2019) have been successfully identified from the LAMSOT DR2 and DR5 data, respectively.
| Name | Index Bandpass (Å) | Pseudo-continua (Å) |
|---|---|---|
| Ca II K | 3927.70–3939.70 | 3903.00–3923.00 4000.00–4020.00 |
| 4300 | 4282.62-4317.62 | 4267.62-4283.87 4320.12-4336.37 |
| 4319.75–4363.50 | 4283.50–4319.75 4367.25–4419.75 |
The line indices in terms of equivalent width () are defined by the following equation:
| (1) |
where and are the fluxes of the spectral line and the pseudo-continuum, respectively (Worthey et al., 1994; Liu et al., 2015). is estimated via linear interpolation of the fluxes located in the “shoulder” region on either side of the line bandpass. The unit of line indices under this definition is in Å.
3 Identification of BHB stars
We first exclude the spectra with a signal-to-noise ratio less than ten at the band (S/N)g from LAMOST DR5, then 5,807,771 stellar spectra left. Typically the BHB stars have low metallicities and are usually found in the Galactic halo region. To avoid contamination by large numbers of young Galactic disk stars, we select the stars with absolute values of the Galactic latitude (hereafter ) larger than and obtain 3,490,485 stellar spectra. It should be noted that there are some stars which are been observed multiple times. Of course, with the cuts, we will miss some BHB stars in low Galactic latitude.
3.1 cuts of H and G4300
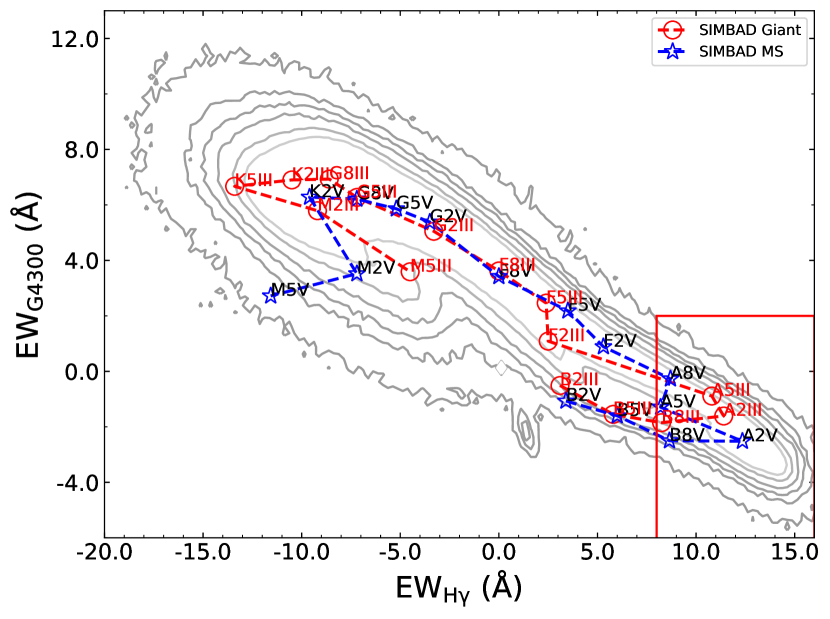
on the vs. plane. The blue dashed line with the asterisks and the red dashed line with the unfilled circles represent the loci of the main sequence and giant stars provided by Liu et al. (2015), respectively. The red solid lines are the line indices’ cuts of at 4341 Å and around 4300 Å for the selection of BHB candidates (mainly A-type stars).
Here, we mainly focus on the BHB stars with the spectral type of A. Their spectra are characterized by strong hydrogen lines and weak or no molecular bands, which could help to remove the contaminants hotter or cooler than the A-type stars. We plot the above 3,490,485 stars with on vs. plane (see Figure 1). Based on the loci of the A-type main sequence (MS, hereafter) and giant stars provided by Liu et al. (2015), we find that A-type stars are mostly located in the area with smaller values of G4300 but larger values of . Therefore, we empirically choose the region enclosed by the red solid line to cover almost all of the A-type stars, especially the stars brighter than the A-type giants. The line indices cuts adopted are as follows:
| (2) |
With this cut, we obtain 39,997 spectra as the BHB candidates, in which the contaminants are mainly BS, A-type MS stars, and a few late B- and early F-type stars (see Figure 1).
3.2 Metallicity cuts
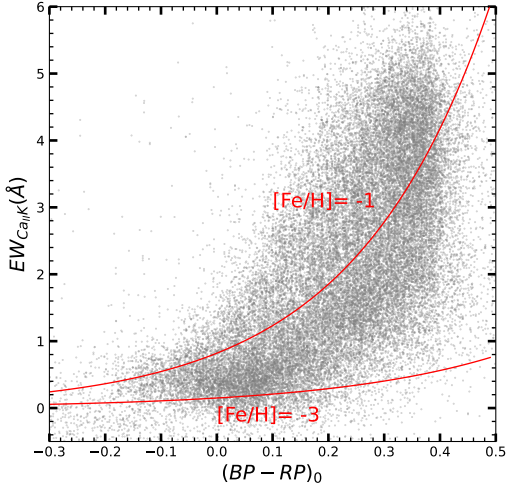
For the 39,997 BHB candidates, we have removed most of the young and metal-rich disk stars with cuts of . The Ca II K absorption lines, which are also prominent features in the LAMOST spectra, are often used as an ideal indicator of the stellar metallicity for the low resolution and low S/N spectra (Pier et al., 1983; Beers et al., 1992; Clewley et al., 2002).
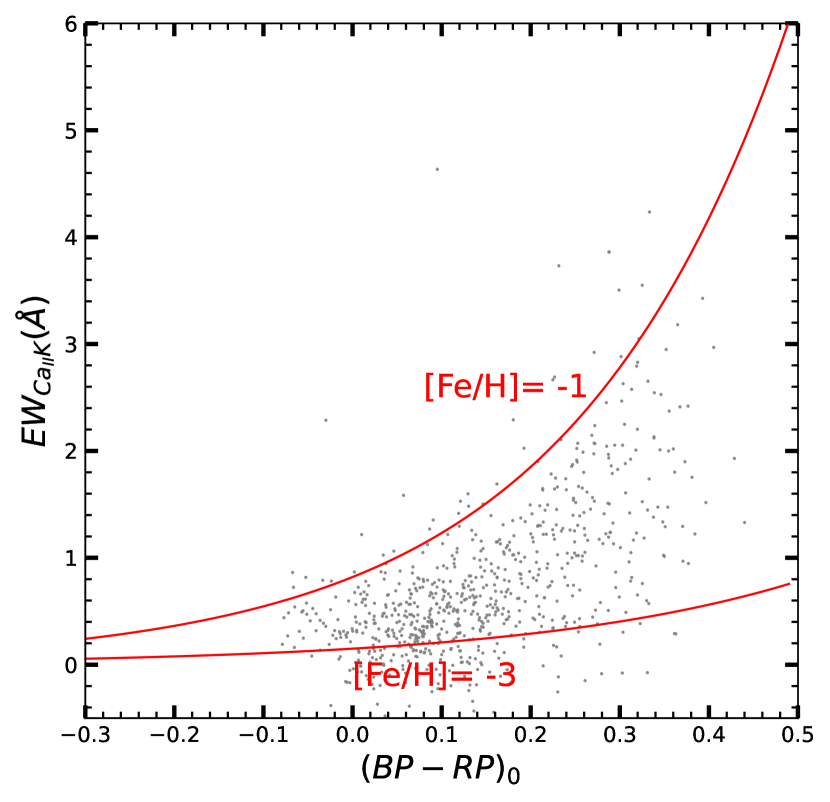
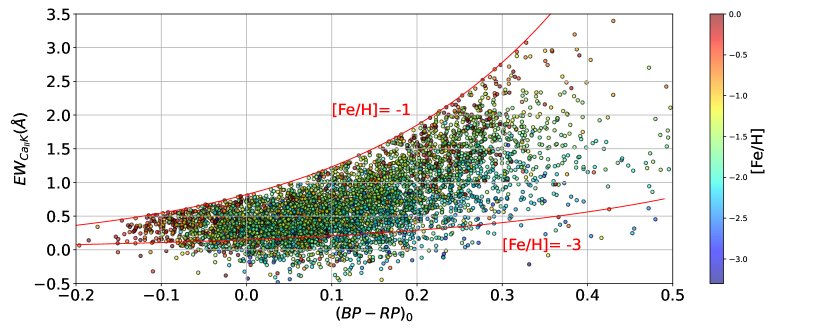
To further remove the contaminants with metallicities larger than those of BHB stars, we calculate the of the Ca II K line according to equation (1). We cross-match our 39,997 BHB candidates with the Gaia EDR3 catalog (Gaia Collaboration, 2020) and obtain their and magnitudes, except for 552 candidates. There are three reasons why these stars do not match with Gaia. One is that some stars are too bright so that the fiber of LAMOST will not target the center of stars. The second one is that there are two stars so close together that it is indistinguishable from each other. The last one is that maybe the star is too faint or located in a crowded area, some stars are not found in Gaia. Figure 2 shows the versus for our 39,445 BHB candidates, where adopt the extinction law of Wang et al. (2019). The reddening values are obtained from Schlegel et al. (1998). It is generally accepted that the metallicity of most BHB stars is less than -1 (Kinman et al., 2000). In Figure 2, We also plot the theoretical and relations (red solid lines) calculated from the synthetic spectra with a resolution close to that of LAMOST spectra and the atmospheric parameters log , [Fe/H] and (Wilhelm et al., 1999a). Based on the red solid line with [Fe/H], we select the sample with [Fe/H] and obtain 23,528+552 BHB candidates.
3.3 Balmer line profile cuts
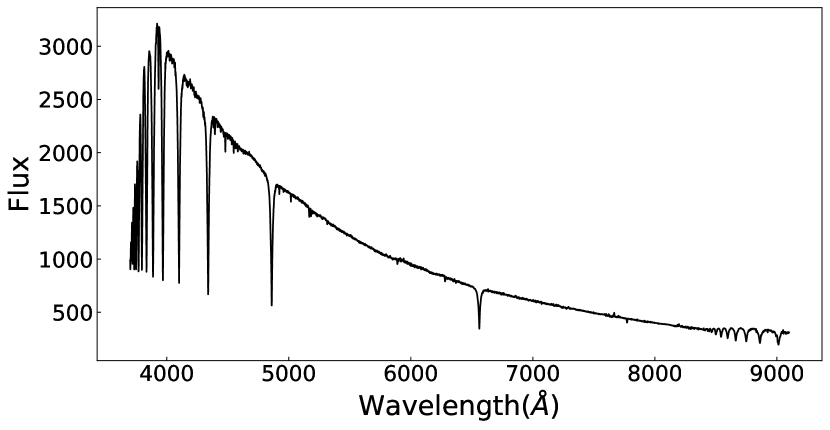
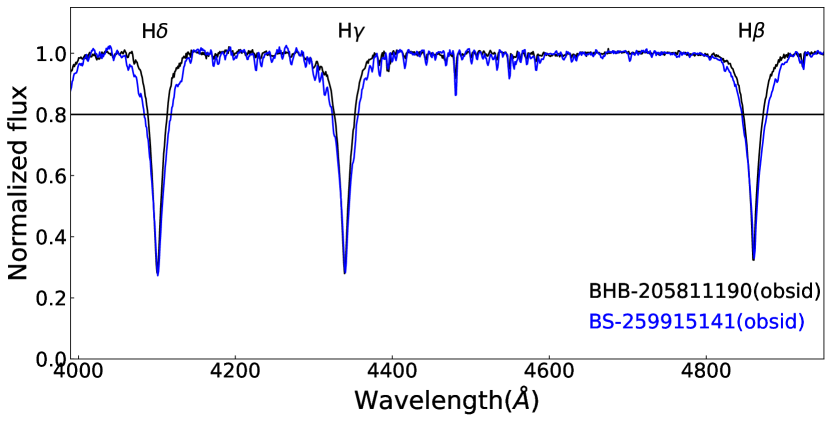
A typical BHB spectrum is illustrated in Figure 3. The Balmer lines are strong and sharp and their line profiles are sensitive to both surface gravity and temperature. Usually, BHB stars have lower surface gravities than BS stars (see Figure 4), A- and some late B-type MS, and higher temperatures than old halo/thick disk MS stars. This has been used to distinguish BHB stars from BS, old MS stars, and 1,170 and 2,401 high Galactic latitude BHB stars are selected by Sirko et al. (2004) and Xue et al. (2008), respectively. The way to do that is to combine two independent methods, i.e., the method (Pier et al., 1983; Sommer et al., 1986; Arnold et al., 1992; Flynn et al., 1988; Kinman et al., 1994; Wilhelm et al., 1999a) and the scale width-shape method (Clewley et al., 2002), which will be described in details below.
For the method, the BHB stars can be distinguished from the BS stars with a similar temperature by measuring the values, i.e., the width of the Balmer line at 20% under the normalized continuum (Yanny et al., 2000). A comparison of the Balmer line profiles for a BHB star and a BS star with similar temperature from the LAMOST DR5 is illustrated in Figure 4. In fact, the A-type MS stars can also be distinguished from the BHB stars with similar temperatures by the values, which have similar line profiles with the BS stars (see bottom panel of Figure 8 of Yanny et al.2000). Furthermore, the cooler MS stars can be eliminated by determining the value of , i.e., the flux relative to the normalized continuum at the line core (Sirko et al., 2004; Xue et al., 2008), as they have shallower Balmer lines.
The scale width-shape method (Clewley et al., 2002) is based on Sersic et al. (1968) to fit the Balmer lines. Sersic et al. (1968) argues that the strong Balmer lines in the spectra of hot stars, e.g., B- and A-type stars, are no longer a Gaussian profile, but a Sérsic profile
| (3) |
where is the normalized flux, is the wavelength, and is the nominal wavelength of a fixed Balmer line. Based on the fitting of the Balmer line profile using equation (3), Clewley et al. (2002) has proposed the scale width-shape method to identify BHB stars. Because the small uncertainties in corrections for radial velocity and normalization of spectral flux are unavoidable, Xue et al. (2008) uses five free parameters: , , and to fit the Sérsic profile of Balmer lines after normalizing the spectrum, which is
| (4) |
During the identification process, Xue et al. (2008) only adopts the line, while Sirko et al. (2004) uses both and lines. In order to select more precise and more BHB stars, we calculate the five parameters, i.e. of three Ballmer lines , and of the 23,528+552 BHB candidates through fitting their line profiles using equation (4).
3.4 Identification of BHB stars with the method and the scale width-shape method
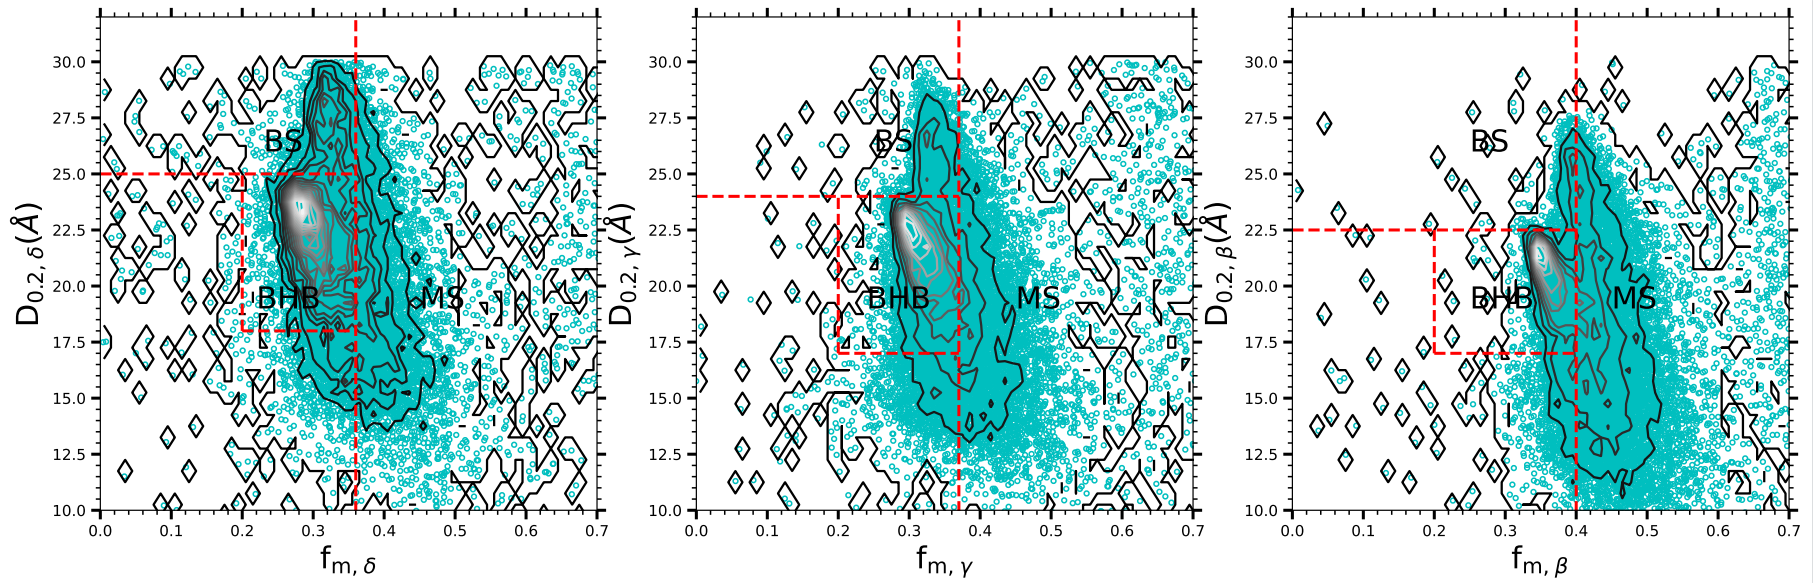
Firstly we map the 23,528+552 BHB candidates on the vs. plane from left to right for the , and lines, respectively (see Figure 5). Compared to Figure 4 of Xue et al. (2008), the areas of the location of BHB, BS, and MS stars are labeled, respectively. The contours show that the BHB stars accumulate on the left middle area of each panel of Figure 5. The concentration of stars centered at , , and represents the BHB stars and the stars with larger are BS stars and the stars with smaller and are cooler giants, but with larger are late A-type MS stars. For the concentration site of BHB stars, our results have slightly different with the results from the literature, i.e., at ( presented by Sirko et al. (2004) and (0.23, 25 Å) by Xue et al. (2008), which should be due to the difference between the resolution of the spectra used and the fitting program adopted. Based on the criteria of Xue et al. (2008), we select BHB stars with the following empirical criteria:
| (5) |
After applying these cuts, we obtain 7,955+143, 8,955+163, and 4,283+23 BHB candidates for the criterion of , and , respectively.
Then we use the scale width-shape method to further remove the contamination from the BS and cooler MS stars. Here is an effective indicator of the surface gravity, i.e., higher corresponds to larger surface gravity at fixed , and represents the temperature, in which the cooler stars with lower at fixed .
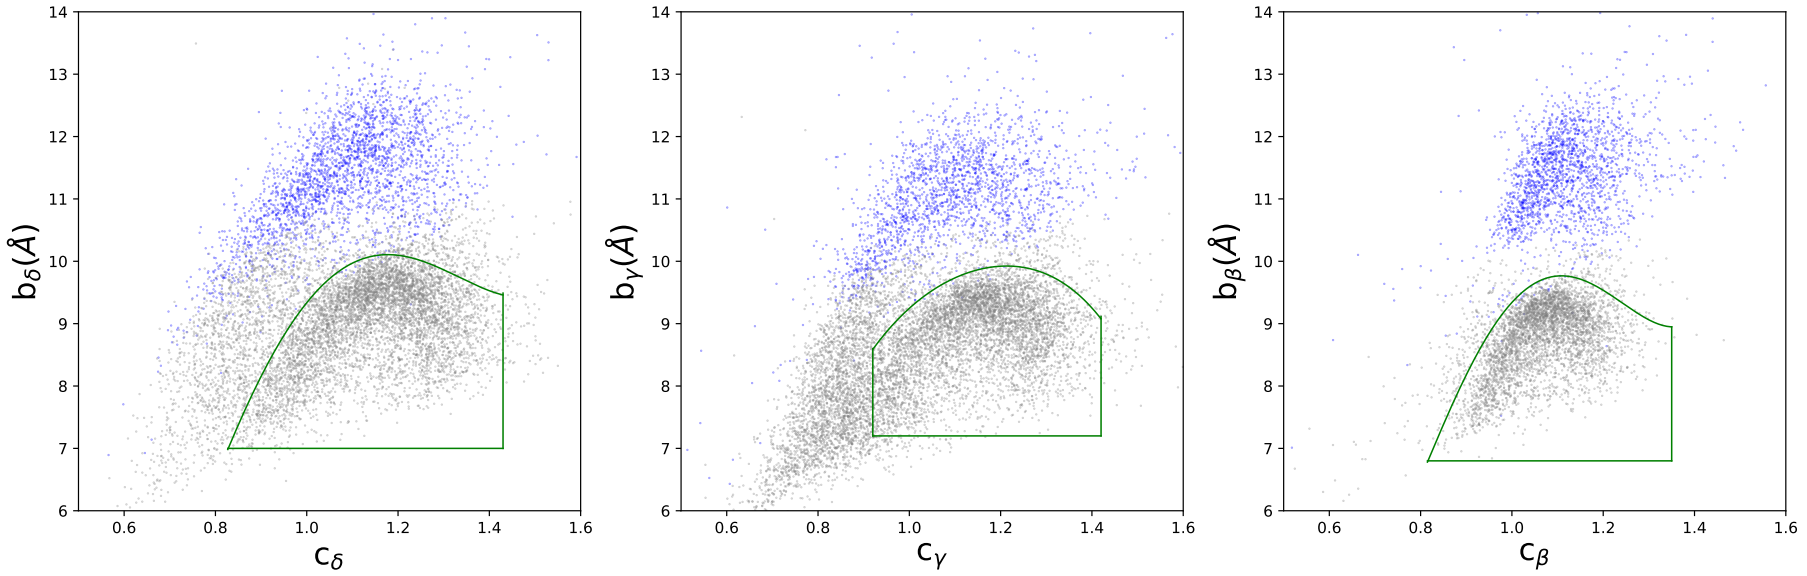
Figure 6 shows the distributions of 7,955+143, 8,955+163, and 4,283+23 BHB candidates in the versus plane from left to right for , and , respectively. We also select 3,367, 2,417, and 2,239 BS stars for , and , respectively, based on their distributions, and plot them in Figure 6 for comparison.
Figure 6 displays bimodal distributions up and down when is larger than 0.8, 0.9, and 0.8 from left to right in the three panels. is an effective indicator of the surface gravity and represents the temperature. The reason is that the BS stars are larger than those of BHB stars with a similar temperature. It helps us to remove further the BS stars that still remain in our BHB candidates. The stars located in the left lower region with small values are the cooler MS stars. Based on the distributions of BHB stars in Figure 6, we cleanly select BHB stars with the following criteria:
| (6) |
| obsid | RA | Dec | S/N | log | [Fe/H] | E(B-V) | ||
|---|---|---|---|---|---|---|---|---|
| (∘) | (∘) | (-band) | (K) | (Gaia EDR3) | ||||
| 66604134 | 0.040234 | 11.892757 | 62.24 | 10228.93 | 3.13 | -1.55 | 0.122512 | 0.09693 |
| 83814139 | 0.127198 | 32.134235 | 159.08 | 8160.17 | 3.20 | -1.71 | 0.234762 | 0.04944 |
| 250504090 | 0.184691 | 37.842845 | 181.02 | 7369.15 | 3.07 | -0.84 | 0.516507 | 0.09709 |
| 87514160 | 0.254373 | 37.285919 | 21.17 | 10198.65 | 3.71 | -1.82 | 0.1724 | 0.09495 |
| 14812243 | 0.2615792 | 33.3272278 | 36.63 | 9201.36 | 3.09 | -1.56 | 0.124019 | 0.04829 |
| 8614049 | 0.266271 | 5.169305 | 35.08 | 8370.94 | 3.63 | -1.38 | 0.264092 | 0.03958 |
| 55001071 | 0.371612 | 16.030824 | 16.46 | 7534.25 | 2.91 | -1.43 | 0.334815 | 0.03706 |
| 385811162 | 0.387119 | 22.974005 | 28.11 | 8849.76 | 3.32 | -1.94 | 0.213063 | 0.07867 |
| 281910151 | 0.5106794 | 35.836533 | 35.65 | 8349.24 | 4.18 | -1.13 | 0.384477 | 0.09779 |
| 250509157 | 0.5265322 | 39.183206 | 127.71 | 10211.44 | 3.80 | -1.00 | 0.107694 | 0.11994 |
| 281903228 | 0.5786953 | 36.286141 | 41.57 | 9351.78 | 3.26 | -1.23 | 0.17907 | 0.10611 |
| 496108188 | 0.5861244 | 6.7466514 | 83.7 | 10279.50 | 3.70 | -1.52 | 0.099919 | 0.04314 |
| 66111030 | 0.594877 | 4.922824 | 30.42 | 7656.46 | 3.08 | -1.71 | 0.263664 | 0.02419 |
| 492104104 | 0.606479 | 25.600805 | 27.35 | 9294.287 | 2.95 | -1.65 | 0.119936 | 0.03575 |
| 385804175 | 0.730444 | 20.560251 | 67.13 | 10263.31 | 3.53 | -0.85 | 0.072537 | 0.0538 |
| 181316089 | 0.874317 | 5.999652 | 67.25 | 9016.02 | 2.97 | -2.20 | 0.155702 | 0.05402 |
| 66608022 | 0.877783 | 11.732231 | 55.68 | 8666.09 | 3.15 | -1.64 | 0.149648 | 0.06578 |
| 472911205 | 0.9361385 | 19.7528826 | 18.14 | 9634.15 | 3.80 | -0.98 | 0.155636 | 0.04098 |
| 369207168 | 0.945362 | 0.635879 | 30.28 | 9026.94 | 3.52 | -1.94 | 0.159239 | 0.02984 |
| … | … | … | … | … | … | … | … |
After selecting BHB stars with the above method, we obtain 5,578+ 85 BHB spectra by merging the groups of , , and . After removing duplicate sources, we finally obtain 5,355 BHB stars and 81 BHB candidates, which are listed in Table 1. It should be noted again that there may be non-BHB stars with [Fe/H] -1 in the 81 BHB candidates, which have similar Balmer line profiles with the BHB stars.
3.5 Completeness
The BHB star catalogs of Xue et al. (2011) and Vickers et al. (2021) are used as reference catalogs to verify the completeness and reliability of our sample by using the selection method adopted by this work. Xue et al. (2011) obtained 4,985 BHB stars from SDSS DR8 by using the color cuts and the cuts based on fitting the profile of Balmer line . The BHB catalog constructed by Vickers et al. (2021) contains 13,693 spectra of 11,046 BHB stars selected through a machine-learning algorithm based on LAMOST DR5.
We first cross-match the two catalogs with that of LAMOST DR5 and obtain 1,055 and 12,075 spectra, respectively. Secondly, we eliminate the spectra with (S/N) and , then 779 and 5,310 BHB stars left, respectively.
Through the cuts of equation (2), 765 and 5,198 BHB stars are obtained from the 779 and 5,310 samples, respectively. Figure 7 shows the distributions of 765 (Xue et al., 2011) (the top panel) and 5,198 BHB stars (Vickers et al., 2021) (the bottom panel) on the versus plane. Applying the cuts of metallicity, i.e., , 730 and 4,826 BHB stars are obtained from the 765 and 5,198 samples, respectively. Then applying the cuts of equations (LABEL:d02) and( LABEL:b-c), 492, 426, and 264 BHB stars are left based on the fitting results of , and lines for the Xue et al. (2011) sample, and 3,866, 3,633 and 2,616 BHB stars left for the Vickers et al. (2021) sample, respectively. After merging and removing duplicated sources, 501 and 3,963 BHB stars are finally obtained from the 779 and 5,310 samples, respectively. It indicates that about 64.3% of BHB stars of Xue et al. (2011) and 74.6% of BHB stars of Vickers et al. (2021) are selected using the criteria adopted by this work. If the metal-rich stars were not excluded, the fractions should be slightly larger.
4 Discussion
4.1 Atmospheric Parameters of BHB stars
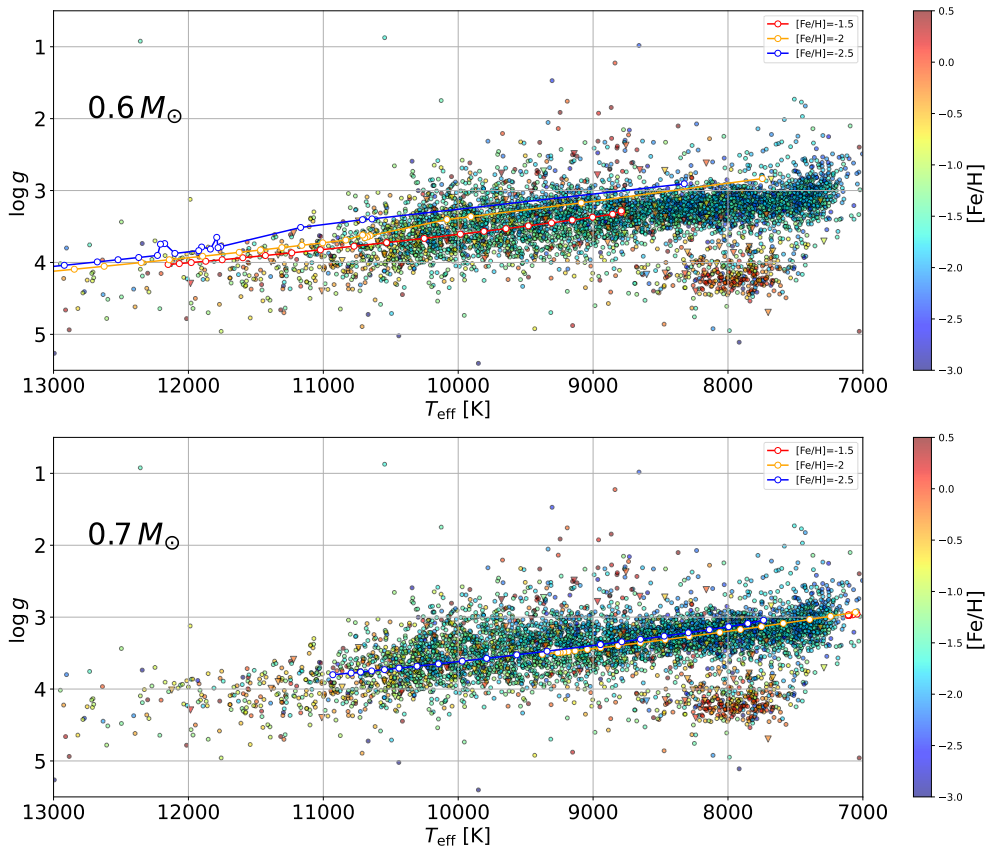
Xiang et al. (2022) has estimated the atmospheric parameters of OBA-type stars from LAMOST DR6 through HotPayne Methods. We cross-match our BHB stars and Xue et al. (2011) sample with it and get the atmospheric parameters for 5,330 + 81 and 1,030 BHB stars, respectively. About 25 of our BHB stars have no atmospheric parameters, which are marked in Table 2. We show the distribution of these BHB stars on the log vs. plane in Figure 8, and the colorbar represents the metallicities. For comparison, the evolutionary tracks of BHB stars with the masses 0.6, 0.7 , and the metallicities [Fe/H] are also presented in this figure, which is calculated by Fu et al. (2018).
Catelan et al. (2009) pointed out that the effective temperatures of the BHB stars generally range from 7,000 to 20,000 K, and from 2.5 to 4.5, for the surface gravities, respectively. From Figure 8, we can see that the variation trend of the log with for most of the BHB stars is well consistent with the theoretical tracks. In addition, most of our BHB stars are located in the range of around 7,200-11,000 K for the and 2.8-4.2, for the log , which confirms the fact that our sample is mainly the A-type BHB stars, and also old and low mass objects. In other words, it indicates that most of our selected BHB stars are reliable. It is noted that there are about 350 BHB stars with log about 4.5, which is larger than most of the BHB stars with similar around 7,000-8,000 K. Moreover, Xiang et al. (2022) shows that most of these 350 BHB stars also have large metallicities, even close to 0.5 of [Fe/H]. The possible reasons are that our samples may still have some contamination from the metal-rich dwarfs or some bias in the estimated atmospheric parameters for these BHB stars. In fact, nearly half of the spectra of these larger log stars have (S/N)g 30, which may affect the estimation of their atmospheric parameters.
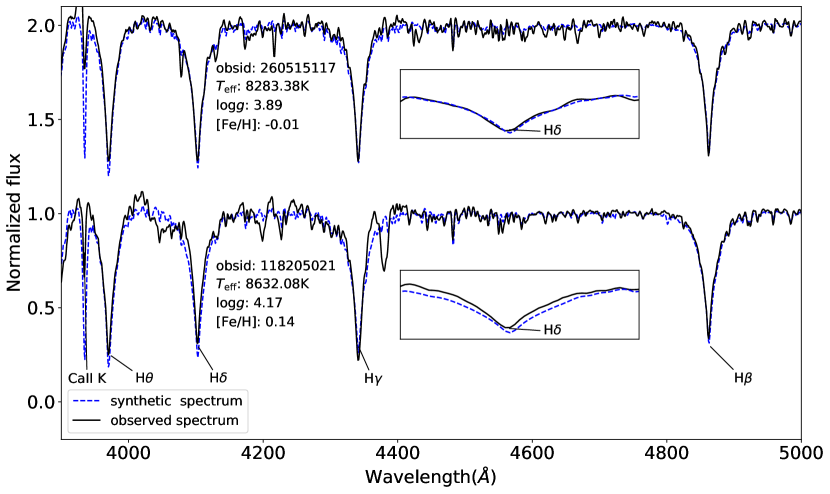
To further check the reliability of our BHB sample, we select two spectra of the above 350 BHB candidates with (S/N) 220.05 and 237.13, respectively. Their corresponding synthetic spectra (Allende et al., 2018) are calculated using the atmospheric parameters estimated by Xiang et al. (2022), which are also shown in Figure 9 for comparison. From Figure 9, we can see that the synthetic spectra have strong Ca II K absorption and wider H line profile than those in the observed stellar spectra. This means that these stars should have lower metallicity than the synthetic counterpart or they may suffer from mismatched temperature and surface gravity.
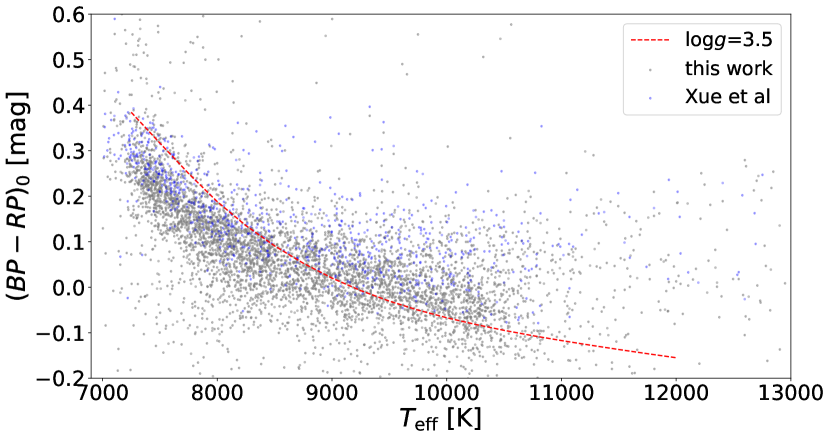
We display of our BHB stars as a function of estimated by Xiang et al. (2022) in Figure 10, and Xue et al. (2011) sample is also presented for comparison. The prediction of the PARSEC for vs. is also presented (Chen et al., 2019; Paxton et al., 2011; Choiet et al., 2016). For most of our and Xue et al. (2011) BHB stars, we can see that their vs. follow a similar anti-correlation, which is consistent with the prediction of the PARSEC stellar model with [Fe/H] and log (Chen et al., 2019), although there are a few BHB stars in Figure 10 whose colors and are inconsistent.
To sum up, most of these stars are BHB stars, and a few contaminated stars which may be due to the bias in the parameters estimation. It requires further verification using high-resolution spectra.
4.2 Comparison with previous work
Vickers et al. (2021) claimed that they obtained 13,693 spectra of 11,045 BHB stars also from LAMOST DR5, which is a little more than double of our BHB stars. They gather a stellar sample with colors indicating 7,000 K, which is observed by both LAMOST and Gaia. Then they use the LAMOST spectral data with labeled stellar classifications and metallicities which are from -3 to -0.31 to train a machine learning algorithm. The machine finally produces a catalog of BHB stars with their metallicity information. The Balmer-line profiles in the spectra of the BHB stars and the metal-rich A-type main sequence stars are very similar, which is not easy to distinguish. We first remove the metal-rich disk stars and the stellar spectra with low signal-to-noise using the criteria and (S/N), respectively. After using these two criteria, only 5,310 of 11,045 BHB stars from Vickers et al. (2021) are left, which indicates that more than half of their BHB stars are metal-rich disk stars or those with (S/N). This may be due to the different selection methods.
We compared the atmospheric parameters of , log , and [Fe/H] from Xiang et al. (2022) of BHB stars with (S/N) in these two samples. According to the metal-poor nature ([Fe/H]) of BHB stars (Kinman et al., 2000), our pollution rate is only 16.6% significantly lower than 47.4% of Vickers et al. (2021). Figure 11 shows the vs. [Fe/H] plane for our sample (top) and that of Vickers et al. (2021) (bottom). It can be seen that the metallicity of our samples is basically less than -1 in addition to a little with [Fe/H] near 8,000 K (discussed above) and 10,000 K, which is due to the Ca II K absorption lines are relatively weak at the high temperatures, and can only be roughly estimated. The sample of Vickers et al. (2021) is clearly divided into two parts by the metallicity, of which 5,172 stars have [Fe/H] larger than -1. Our samples show higher purity, which confirms the reliability of our method.
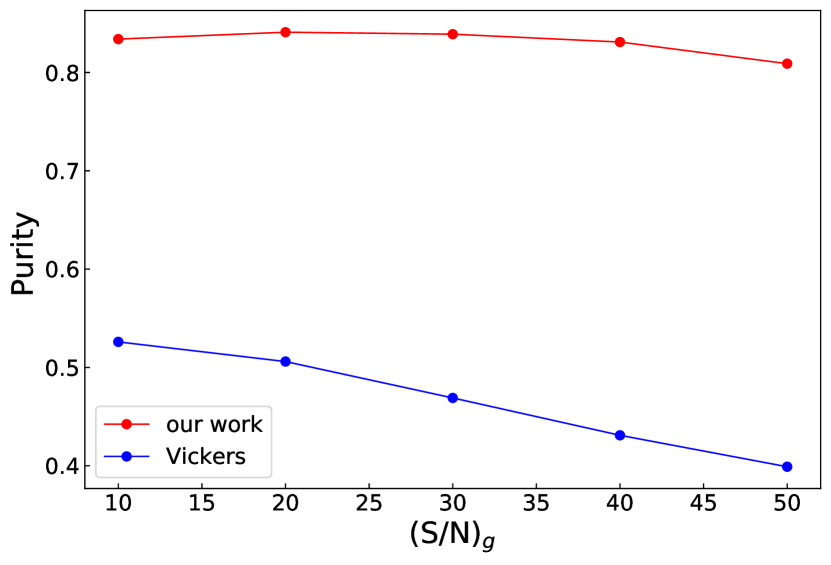
We also carried out a comparison of the effect of (S/N)g on the two samples (see Figure 13). The red solid line represents our sample, and the blue solid line represents the sample of Vickers et al. (2021). The purity is assessed as a function of (S/N)g based on the atmospheric parameters estimated by Xiang et al. (2022). Purity here refers to the number of the BHB sample stars with [Fe/H] and a fixed (S/N)g value is divided by the total number of BHB sample stars with the same (S/N)g value. The purity of our sample is consistently surpassing 80% with the (S/N)g increasing. However, the purity of Vickers et al. (2021) initially starts at 52.6% when (S/N) and shows a decreasing trend with the (S/N)g increasing. At the (S/N)g of 50, the purity of Vickers et al. (2021) drops to only 39.9%. These findings suggest that increasing the (S/N)g does not necessarily guarantee higher purity.
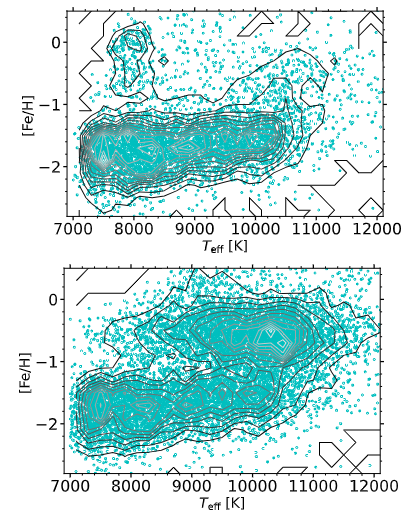
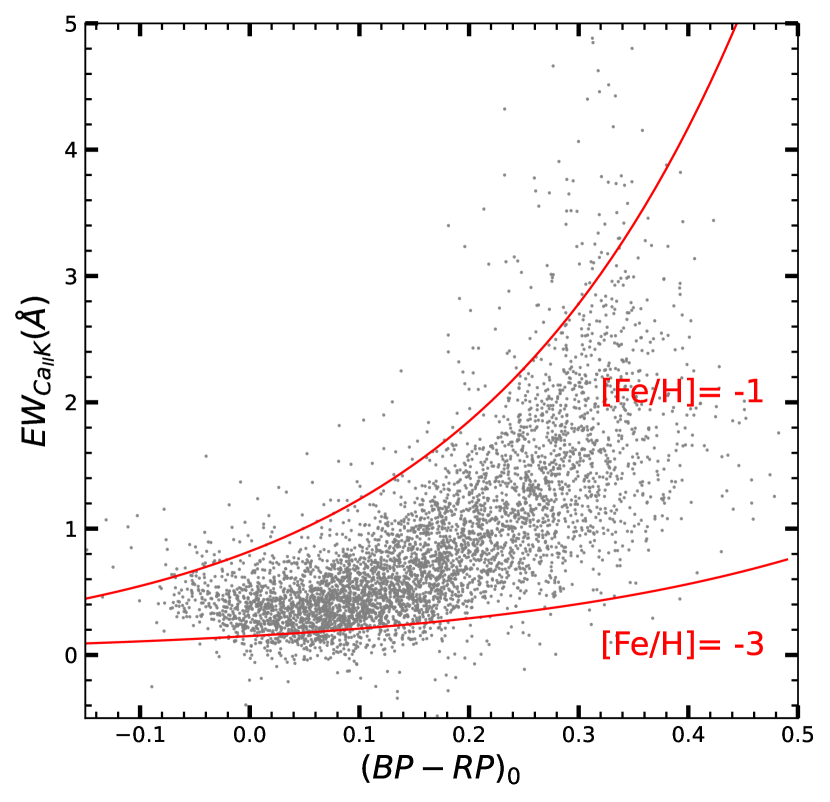
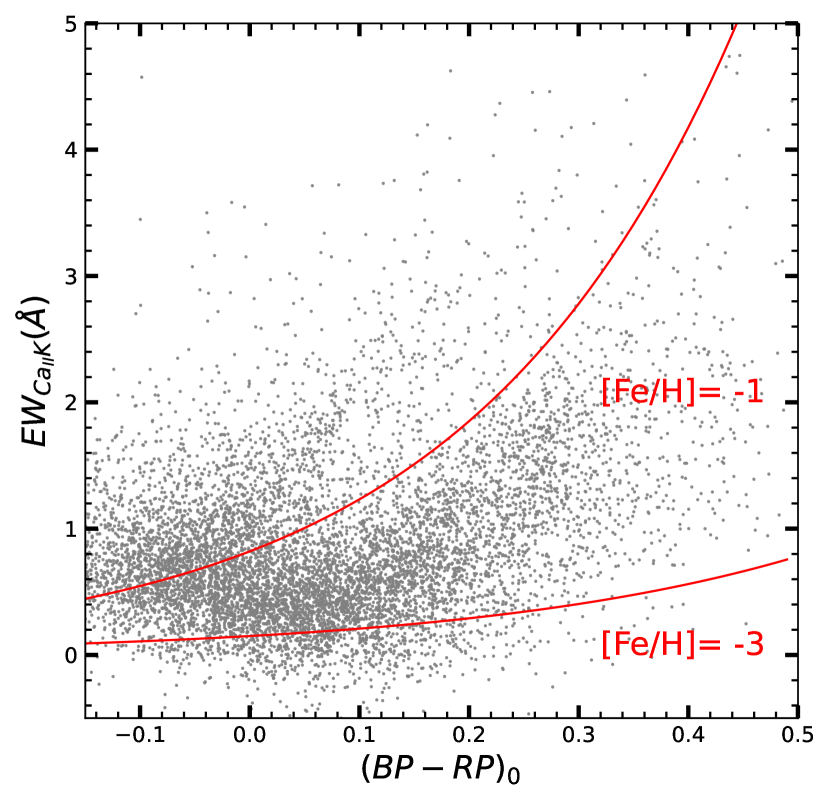
Figure 12 shows the vs. for the BHB stars of Xue et al. (2011) and Vickers et al. (2021) . The of most of the Xue et al. (2011) BHB stars range from -3 to -1, which also indicates the reliability of the method of metallicity cuts. It is noted that there are 4,367 BHB stars with [Fe/H] from Vickers et al. (2021) and the contamination rate is 42.5% which is estimated according to the theoretical criteria of .
Among the 5,355+81 BHB stars in our work, only 548 stars have already been listed by Xue et al. (2011). The main reason is that the LAMOST sources are bright, while the SDSS survey mainly observes the stars located in the Galactic halo, which is usually dim.
4.3 Effect of (S/N)g on the selection of the BHB stars
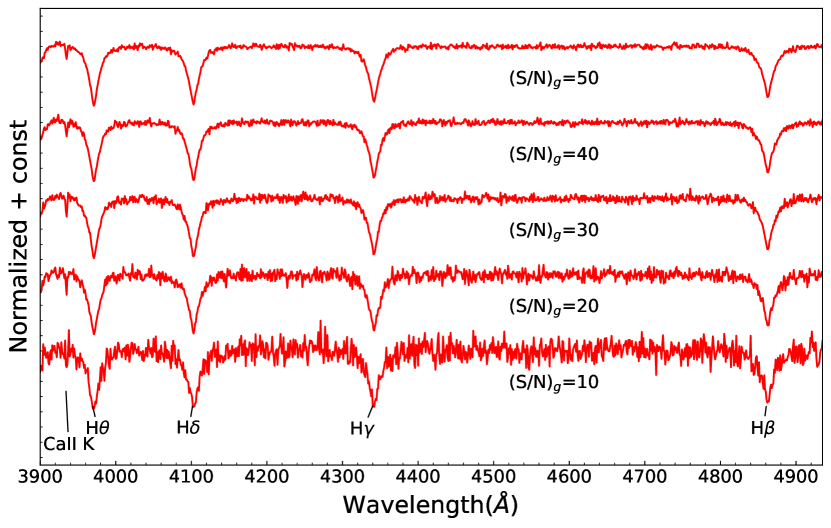
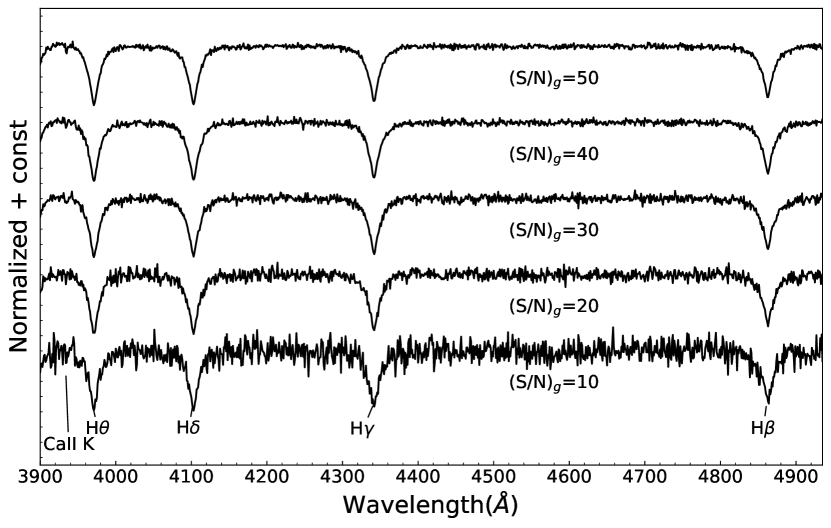
During the process of selecting the BHB stars, the primary absorption lines utilized are Ca II K line, , and , which are notably strong in A-type stars. However, the noise and absorption line may degenerate together in cases where the (S/N)g is low. To illustrate this, the synthetic spectra calculated by Allende et al. (2018) with log and [Fe/H] from globular cluster BHB stars(Wilhelm et al., 1999a) under various (S/N)g from 10 to 50 with the step of 10 are shown in Figure 14. The S/N is added using a Gaussian function. For the panels from top to bottom, the spectra represent , and , respectively. It can be seen that the Ca II K line gradually weakens with the increase in temperature. At , the line is still relatively strong, and the (S/N)g has minimal impact. However, as the temperature continues increasing, the Ca II K line begins to weaken. At and (S/N), noise has a more significant impact on the Ca II K line, which could lead to superimposing of noise and the Ca II K line, resulting uncertainties to the value of the calculated equivalent width.
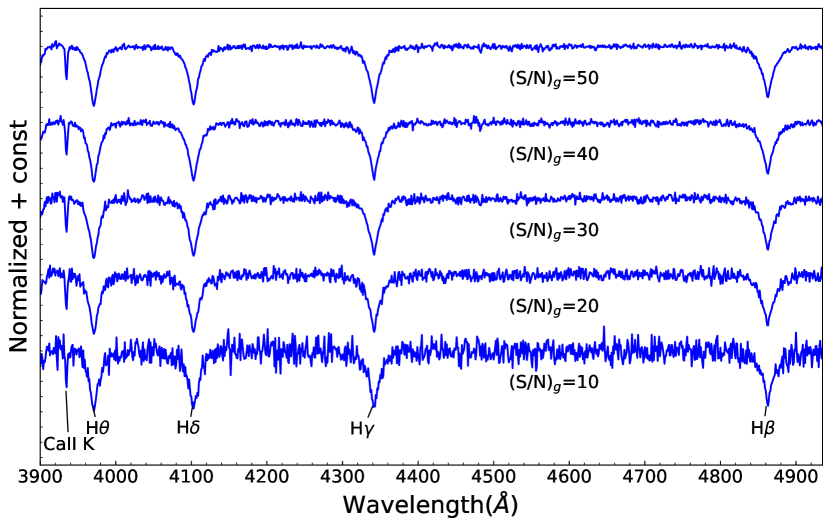
Figure 15 shows the synthetic spectra (Allende et al., 2018) with K, log and [Fe/H] = -1, -2, and -3 (from top to bottom) under various (S/N)g. The Ca II K line is an important indicator of metallicities for BHB stars as under such temperatures the other meal lines are generally very weak or absent. With the reduction of (S/N)g, noise and Ca II K line are also superimposed, leading to large uncertainties of calculation in the spectra with (S/N), especially for BHB stars with low metallicity, which usually have very weak lines. Based on Figure 2 and combining Figure 14,15, we can see that the low (S/N)g may bring some uncertainties on the selection of BHB stars with high and low [Fe/H], but little or negligible impact on that for BHB stars with low temperatures or high [Fe/H], which usually have stronger Ca II K lines than above cases. However, for the effect of low signal-to-noise on the selection of BHB stars, a quantitative analysis is complicated due to the observational selection effect of LAMOST and the variation of the stellar formation rate (SFR) with different metallicities.
The stellar atmospheric parameters of Xiang et al. (2022) are determined by fitting the synthetic spectra with the observation one. Here, we use the and [Fe/H] estimated by Xiang et al. (2022) to simply estimate the purity of our BHB samples. From Figure 13, our purity is about 83.4% even at (S/N), which indicates that when using the Ca II K line cuts the (S/N)g has a certain impact, but it is relatively small.
4.4 Spatial distribution of our BHB stars
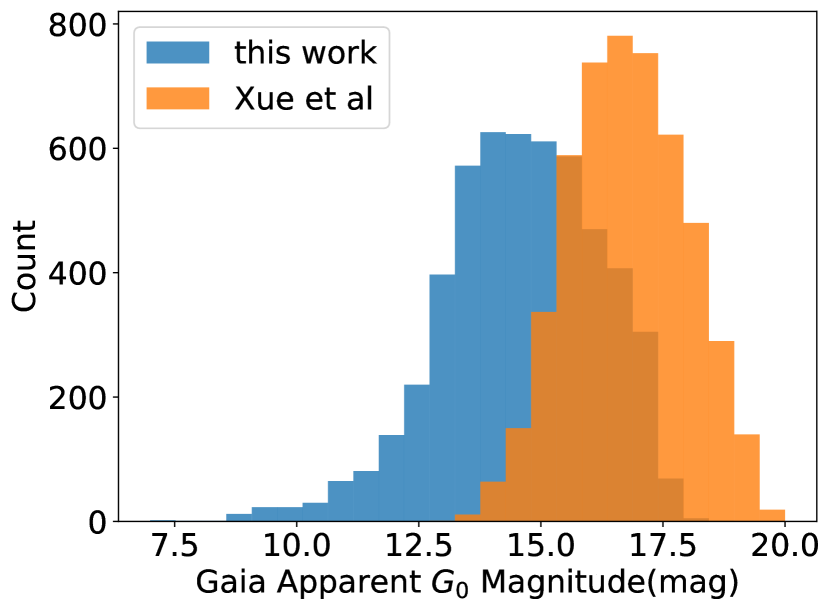
BHB stars are deemed to have an almost constant absolute magnitude. Thus, their apparent magnitudes can be used as a distance indicator, that is, more distant BHB stars correlated with larger apparent magnitudes. Figure 17 compares the Gaia DR3 magnitude of BHB stars from this work and Xue et al. (2011), for which the extinction is corrected using Schlegel et al. (1998). The peak value of magnitude of our sample and Xue et al. (2011) are about 14.6 mag and 16.8 mag, respectively. Compared to Xue et al. (2011) sample, our BHB stars are indeed brighter and thus should be closer.
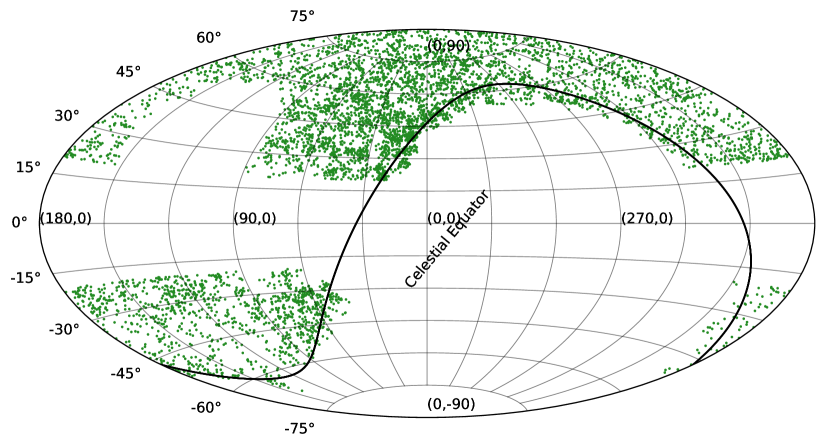
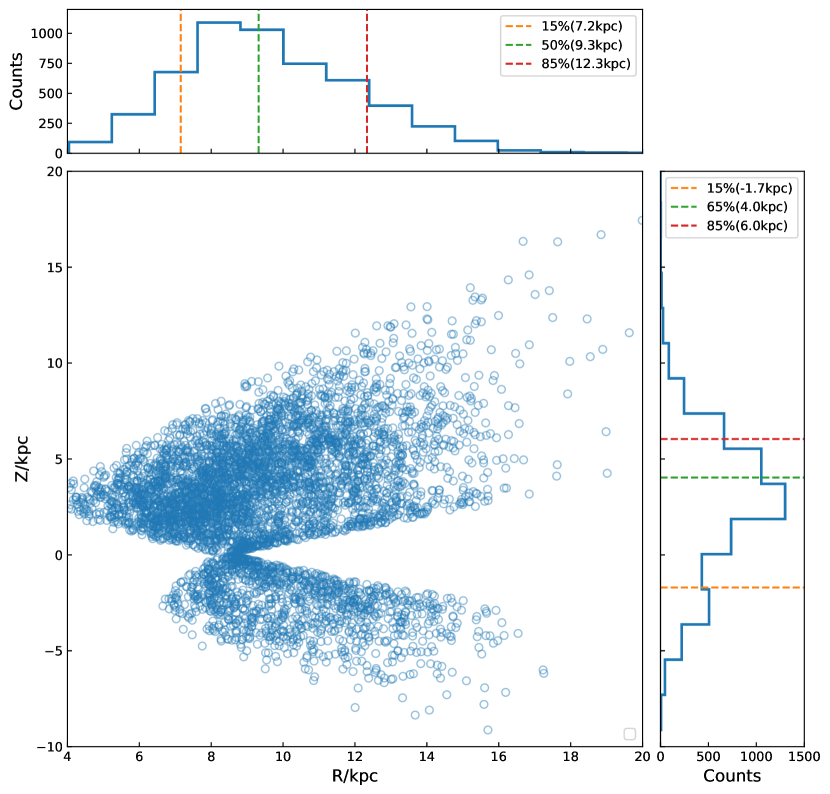
Figure 18 displays the Galactic sky coverage and spatial distribution of our BHB stars. It shows that most of our BHB stars are located within kpc. From the right histogram, we can see that the peak value of the of our BHB stars is from 2 to 3 kpc, where kpc is generally used to divide the locations of the halo and the thick disk for the Milky Way (Norris et al., 1985; Beers et al., 2002). In addition, there are about 35% of our BHB stars with kpc, but about 85% of them with kpc, which indicates that most of our BHB stars are located in the inner halo or overlap with the disk location in the Milky Way. It is worth pointing out that many BHB stars with a small (the vertical distance to the Galactic middle disk) are also successfully selected out. Our sample not only complements the known BHB stars but also covers the volume closer to the Sun than the other known sample. Such a sample is essential for the BHB stars as a probe to study the properties of the Galactic halo, especially in the solar neighborhood.
5 Conclusions
In this work, we successfully identify 5,355+81 BHB stars with and (S/N) from the LAMOST DR5. To get a clean sample of BHB stars, we combine the line indices cut, the method with the scale width-shape method, and the cuts are also adopted to remove the metal-rich contaminations.
Based on the atmospheric parameters obtained by Xiang et al. (2022), most of our BHB stars are in agreement with the range of BHB atmospheric parameters and the theoretical -log evolutionary tracks of the BHB stars. It indicates the reliability of our BHB sample. But within 7,000-8,000 K, there are about 350 BHB stars with large log around . We also noted that these stars usually have overestimated metallicities, which will result in large uncertainties to the estimations of and log .
Our BHB samples are mainly concentrated in the inner halo or around the disk of the Milky Way. By applying the line indices of Ca II K as the metallicity cuts, we successfully select out the rare halo BHB stars which are located in the Galactic disk region ( kpc). Combined with Xue et al. (2011) samples, BHB stars can be used as a better probe to study the kinematics and structural characteristics of the Milky Way.
References
- Allende et al. (2018) Allende, P. C., Koesterke, L., Hubeny, I., et al. 2018, A&A, 618, A25
- Arp et al. (1952) Arp, H. C., Baum, W. A., Sandage, A. R., 1952, AJ, 57, 4
- Arnold et al. (1992) Arnold, R. A., Gilmore, G., 1992, MNRAS, 257, 225
- Astropy Collaboration et al. (2013) Astropy, C., Robitaille, T. P., Tollerud, E. J., et al. 2013, A&A, 558, A33
- Beers et al. (1988) Beers, T. C., Preston, G. W., Shectman, S. A., 1988, ApJS, 67, 461
- Beers et al. (1992) Beers, T. C., Doinidis, S. P., Griffin, K. E., et al. 1992, AJ, 103, 267
- Beers et al. (1996) Beers, T. C., Preston, G. W., Shectman, S. A., et al. 1996, ApJS, 103, 433
- Beers et al. (2002) Beers, T. C., Drilling, J. S., Rossi, S., et al. 2002, AJ, 124, 931
- Beers et al. (2007) Beers, T. C., Rossi, S., Wilhelm, R. J., et al. 2007, ApJS, 168, 277
- Brown et al. (2008) Brown, W., Beers, T. C., Wilhelm, R., et al. 2008, AJ, 135, 564
- Catelan et al. (2009) Catelan, M., 2009, Ap&SS, 320, 261
- Chen et al. (2019) Chen, Y., Léo Girardi, Fu, X. T., et al. 2019, A&A, 632, 13
- Choiet et al. (2016) Choiet, J., Dotter, A., Conroy, C., et al. 2016, ApJ, 823, 102
- Christlieb et al. (2007) Christlieb, N., Beers, T. C., Thom, C., et al. 2005, A&A, 431, 143
- Clewley et al. (2002) Clewley, L., Warren, S. J., Hewett, P. C., et al. 2002, MNRAS, 337, 87
- Clewley et al. (2006) Clewley, L., Jarvis, M. J., 2006, MNRAS, 368, 310
- Cohen et al. (1997) Cohen, J. G., McCarthy, J. K., 1997, AJ, 113, 1353
- Cui et al. (2012) Cui, X., Zhao, Y. H., Chu, Y. Q., et al. 2012, RAA, 12, 1197
- Culpan et al. (2021) Culpan, R., Pelisoli, I., Geier, S., 2021, A&A,654, A107
- Deason et al. (2011) Deason, A. J., Belokurov, V., Evans, N. W., 2011, MNRAS, 416, 2903
- Deng et al. (2012) Deng, L., Newberg, H. J., Liu, C., et al. 2012, RAA, 12, 735
- Flynn et al. (1988) Flynn, C., Sommer-Larsen, J., 1988, MNRAS, 235, 175
- Fu et al. (2018) Fu, X. T., Bressan, A., Marigo, P., et al. 2018, MNRAS, 476, 496
- Gaia Collaboration (2020) Gaia Collaboration 2020, A&A, 650, C3
- Gray & Corbally (2009) Gray, R.O., Corbally, C.J., 2009, Stellar spectral classification (Princeton, US: Princeton University Press)
- Ji et al. (2016) Ji, W., Cui, W. Y., Liu, C., et al. 2016, ApJS, 226, 1
- Kinman et al. (1994) Kinman, T. D., Suntzeffff, N. B., Kraft, R. P., 1994, AJ, 108, 1722
- Kinman et al. (2000) Kinman, T. , Castelli, F., Cacciari, C., et al. 2000, A&A, 364, 102
- Layden et al. (1996) Layden, A. C., Hanson, R. B., Hawley, S. L., et al. 1996, AJ, 112, 2110
- Li et al. (2018) Li, Y. B., Luo, A. L., Du, C. D., et al. 2018, ApJS, 234, 31
- Liu et al. (2015) Liu, C., Cui, W. Y., Zhang B., et al. 2015, A&A, 15, 1137
- Liu et al. (2019) Liu, Z. C., Cui, W. Y., Liu, C., et al. 2019, ApJS, 241, 32
- Luo et al. (2012) Luo, A. L., Zhang, H. T., Zhao, Y. H., et al. 2012, A&A, 12, 1243
- Montenegro et al. (2019) Montenegro K., Minniti, D., Alonso-García, J., et al. 2019, ApJ, 872, 206
- Norris et al. (1985) Norris, J., Bessell, M. S., Pickles, A. J., 1985, ApJS, 58, 463
- Paxton et al. (2011) Paxton, B., Bildsten, L., Dotter, A., et al. 2011, ApJS, 192, 3
- Pier et al. (1983) Pier, J. R., 1983, ApJS, 53, 791
- Pier et al. (1984) Pier, J. R., 1984, ApJ, 281, 260
- Preston et al. (1991) Preston, G. W., Shectman, S. A., Beers, T. C., 1991, ApJ, 375, 121
- Ruhland et al. (2011) Ruhland, C., Bell, E. F., Rix, H. W., et al. 2011, ApJ, 731, 119
- Santucci et al. (2011) Santucci, R. M., Beers, T. C., Placco, V. M., et al. 2015, ApJL, 813, L16
- Schlegel et al. (1998) Schlegel, D. J., Finkbeiner, D. P. , Davis, M., 1998, AJ, 500, 525
- Sersic et al. (1968) Sérsic, J. L., 1968, Atlas de Galaxias Australes (Cordoba: Obs. Astron.)
- Sirko et al. (2004) Sirko, E., Goodman, J., Knapp, G. R., et al. 2004a, AJ, 127, 899
- Skrutskie et al. (2006) Skrutskie, M. F., Cutri, R. M., Stiening, R., et al. 2006, AJ, 131, 1163
- Sommer et al. (1986) Sommer-Larsen, J., Christensen, P. R., 1986, MNRAS, 219, 537
- Sommer et al. (1989) Sommer-Larsen, J., Christensen, P. R., Carter D., 1989, MNRAS, 238, 225
- Sommer et al. (1997) Sommer-Larsen J., Beers, T. C., Flynn, C., et al. 1997, ApJ, 481, 775
- Thom et al. (2005) Thom, C., Flynn, C., Bessell, M., et al. 2005, MNRAS, 360, 354
- Vickers et al. (2021) Vickers, J. J., Li, Z. Y., Smith, M. C., et al. 2021, APJ, 912, 32
- Wang et al. (2019) Wang, S., Chen, X., 2019, ApJ, 877, 116
- Wilhelm et al. (1999a) Wilhelm, R., Beers, T. C., Gray, R. O., 1999a, AJ, 117, 2308
- Wilhelm et al. (1999b) Wilhelm, R., Beers, T. C., Sommer-Larsen, J., et al. 1999b, AJ, 117, 2329
- Worthey et al. (1994) Worthey, G. A., 1994, ApJS, 95, 107
- Xiang et al. (2022) Xiang, M. S., Rix, H. W., Ting, Y. S., et al. 2022, A&A, 662, A66
- Xue et al. (2008) Xue, X. X., Rix, H. W., Zhao, G., et al. 2008, ApJ, 684, 1143
- Xue et al. (2011) Xue, X. X., Rix, H. W., Yanny, B., et al. 2011, AJ, 738, 79
- Yanny et al. (2000) Yanny, B., Newberg, H. J., Kent, S., et al. 2000, ApJ, 540, 825
- Yao et al. (2016) Yao, Y., Liu, C., Deng, L., et al. 2017, ApJS, 232, 16
- York et al. (2000) York, D. G., Adelman, J., Anderson, J. E., et al. 2000, AJ, 120, 1579
- Zhao et al. (2012) Zhao, G., Zhao, Y., Chu, Y., et al. 2012, RAA, 12, 723