Capturing Values at the Boundaries
Abstract
Novelty is not a sufficient condition for innovation. For new ideas and products to succeed, they must be integrated into the collective understanding and existing infrastructure, illustrating how the past determines the future. Here, we develop a comprehensive framework to understand how the structure of accumulated past successes curves the adjacent possible trajectory of future innovations. We observe that certain technological building blocks, upon frequent combination, coalesce into noticeable clusters manifested as well-defined domains within the exploration landscape. These clusters compress the space around them, thus bending the trajectory of exploration towards them as if exerting a gravitational pull on new ideas and actions. Our methodology quantifies this effect, mapping out the curvatures within the adjacent possible space of actions and identifying significant curvatures that define the boundaries of consensus domains. These domains, serving as knowledge repertoire, guide inventors towards proven solutions and past successes, explaining why the most commercially successful inventions often emerge at the fringes of established domains. Through a case study of Edison’s patents, we demonstrate his well-known design strategy of leveraging institutionalized domains, manifested as high curvature in this space. In contrast, Tesla’s inventions are predominantly located in low-curvature areas. Our further analysis reveals that innovations in areas of high curvature are indeed more likely to capture market values, supporting our observations. Our framework provides insights into how new ideas interact with and evolve alongside established structures in institutional frameworks and collective understanding, illustrating the complex dialogue between innovation and convention.
Introduction
Human history can be viewed as a continuous evolution of boundaries in both physical and conceptual domains. Physical boundaries—like walls, fences, and territorial lines—act as clear markers, demarcating where one jurisdiction ends and another begins. Conceptual boundaries, on the other hand, classify knowledge, culture, and social identities, often leading to dichotomies such as ‘us and them’ [1, 2]. These boundaries, whether material or imaginary, are instrumental in structuring and defining a diverse range of human endeavors, from geopolitical landscape to intellectual inquiry. As a result, these categorization mechanisms are deeply ingrained within our cognitive frameworks, wielding considerable power over how we navigate and interact in an increasingly complex world [3].
In our complex world, categorization is essential for managing its increasing complexities [4, 5]. Dividing, defining, and encapsulating complex ideas, a universally accepted lexicon not only streamlines communication within and across scientific and technological communities but also facilitates the accumulation and transfer of knowledge across generations, thereby accelerating progress and innovation. Imagine a world without the Linnean taxonomy or the periodic table. Evolutionary theory and chemistry progress would likely have taken a bit longer. The organization of knowledge into specific fields, disciplines, and domains extends beyond academic purposes. For instance, crip analytical constructs of fields, sectors, industries, and markets define distinct areas of technological activity, research, or innovation. These frameworks provide a clear basis for targeted policy-making and regulation, as well as strategic blueprints for organizations and individuals to identify competitive advantages and develop market-entry or expansion strategies [6, 7]. Ultimately, the evolution of boundaries is not just a historical footnote but a linchpin in innovation, policy, and strategy [8, 9, 10].
Yet, it’s imperative to acknowledge the fundamental limitations of categorization and classification. More specifically, boundaries around technological domains are notably elusive and highly susceptible to innovation forces [11, 12, 13]. Traditional top-down classifications (e.g., bio versus non-bio technologies or semiconductor versus non-semiconductor sectors) may offer practical, clear analytical constructs for practical purposes with high authority [14]. However, these boundaries are far from immutable due to the dynamic nature of innovation [15, 16] as technological advancements continually reshape the landscape, blurring these once-clear demarcations and rendering rule-based classifications inadequate for capturing the dynamism of innovation, thereby potentially impeding further progress [17]. This complexity underlines the dual role of categorization: it can both drive and constrain innovation [6, 8]. Narrowly defined categories might limit creative thinking [18], while also aiding in-depth problem-solving [19]. Therefore, technological domains should not be viewed in isolation but as integral components of a dynamic, constantly evolving technological ecosystem, both shaped by and shaping innovation [20].
In this study, we develop a novel, bottom-up methodology to identify and analyze the emerging boundaries within the technological landscape and examine their impact on innovation. A technological domain is characterized as an aggregation of building blocks that, through frequent and repetitive combinations, create distinct boundaries that set them apart from other domains. The rationale behind these frequent combinations varies. Clusters might emerge due to shared characteristics [2], or modules that minimize transaction costs between functionally complementary and interdependent components [4, 21, 22, 23, 24]. Alternatively, these clusters could arise in response to external incentives and as centers of attention or communication pressure in collaborations [8, 25]. Or, they may simply result from strategic top-down construction [6].
Our method remains neutral as to the origins of these domains. Instead, we focus on the persistent and measurable impacts of these routinized groupings on the space of adjacent possible [20, 26, 27]. This approach allows us to objectively analyze the effects of observed clusters and their influence on innovation trajectories. We suggest that these clusters, recognized as distinct modules of ways to express useful functions within the collective understanding, triggering heuristic search in our cognition and behaviors, exert both physical and cognitive influence over individual behaviors within and across these domains.
Our study aims to quantify the influence of these clusters as if creating curvatures in the exploration space of innovation. These clusters, formed from routinized modules that have proven successful and thus reinforced over time, become reservoirs of established solutions and past successes, containing yet encapsulating intricate connections and thus manifesting domains in the space [20, 28, 29]. Offering a dependable foundation for innovation, these processes potentially compress the space of adjacent possible around them, thus streamlining the pathway for innovative endeavors [30]. We hypothesize that such significant and distinctive clusters shape individual behaviors as if guiding them through a curved search space. Our analysis aims to measure these curvatures, especially at the peripheries of these clusters, to understand their influence on the broader technological landscape.
As such, our approach starts with the premise that technological domains are neither clear-cut nor static; they are fluid and dynamic, mirroring the nature of innovation. These domains continuously evolve, merge, or subdivide, adapting to the ongoing advancements in research, development, and innovation. Understanding this dynamic nature is crucial for comprehending the ever-evolving landscape of innovation. Correspondingly, our empirical findings indicate that inventions situated at the boundaries of these domains frequently achieve the highest market values.
Results

Curved Space at the Domain Boundary
Our bottom-up approach quantifies the structural characteristics of domain boundaries, akin to mapping the gravitational contours in space, as depicted in Figure 1a. Consider a scenario where certain building blocks, heavily utilized together in past inventions, coalesce into a dense, information-laden cluster in the space of exploration. This cluster, often indistinguishable from the outside yet rich in encapsulated information, thus folds the space around it [30]. As a result, exploration trajectories are curved towards it, as if the cluster, created from past heavy use, wields considerable power over them, as shown in the upper layer of Fig. 1a.
The curvature in our study manifested as non-trivial topological trajectories within the search space in geodesic searches between points not directly connected, say to in Fig. 1a. The area around these points is differentially folded, shaped by the aggregation of past inventions that have frequently bundled certain building blocks. For instance, if and have been frequently grouped together, more so than and , their effective distance, whether in cognitive space, organizational structure, or physical infrastructure, is significantly reduced. Similarly, if , , , and belong to a dense cluster due to their frequent past co-use, their internal distance within this setup is almost nonexistent.
Taking into account these patterns of extensive past usage reshape the actual search distance. As a result, detouring the path , which navigates through these dense networks, becomes more efficient than following a more direct path like in Fig 1 (a). This phenomenon, where paths are effectively shortened through reinforced and routinized combinations of building blocks, leads to the formation of multiple coarse-grained groups and thus creates a complex, folded search space [29]. This results in a complex, multi-layered area rich in diverse informational backgrounds, impacting focal points in both cognitive and physical dimensions.
The analysis of these detours is key to understanding the boundaries of clustered groups. We define curvature as the relative degree of separation caused by massive clusters from the past, which have shaped the search space. For example, the curvature between points and is determined to be two, indicating that the path , with four degrees of separation, deviates significantly from the more direct route , which has only two degrees of separation. This is again, as explained above, the search space around , and have been folded many times, and their distance is considerably compressed. This methodology can be operationalized as the relative degrees of separation in the shortest paths, taking into account both the frequency of use and the gravitational pull of large clusters nearby, akin to a geodesic in non-Euclidean space. As a result, their trajectories curve as if drawn by a gravitational force toward frequently used clusters, like the path toward a significant cluster in comparison to .
This curvature is analogous to how mass bends nearby space along a geodesic line in general relativity, and mass increases with accumulated past events, increasing inertia. Curvature in mathematics is defined as the degree to which a curve deviates from a straight line. In our context, a straight path is defined by the degrees of separation without accounting for accumulated co-uses in the past. The more frequently codes and have been combined in the past, the more ’familiar’ or proximate they are considered to be, potentially in proportion to their accumulated past usage [31]. Thus, their effective distance can be expressed as . However, the relevance of past events to our current landscape diminishes exponentially over time, leading to the final distance between two building blocks in the exploration space being calculated as follows,
| (1) |
where accounts for the cumulative frequency of past combinations from years ago, whose impact is exponentially reduced over time with a characteristic time , the system’s memory half-life. This half-life is typically ten years, aligning with the usual patent citation cycle [31].
Using this distance measure, we map out the curvature within the adjacent possible space. This approach is crucial for identifying unique boundaries and the extent of connections within a cluster of building blocks. Clusters with dense internal and loose external interactions, marking clear boundaries, often result in more significant spatial distortions than those in nascent or fading stages, leading to gentler distortions. Therefore, these quantities also illustrate the ’ruggedness’ of the technological landscape, shaped by the development of domains and their boundaries [26, 27] and explain the dynamics of bursting events [32, 33].
Again, we do not predefine any specific analytical constructs for sectors or technological domains, nor do we establish their boundaries a priori. Instead, we posit that when activities revolve around a repetitive, routinized, well-defined bundle of building blocks manifested in a tight network of connections, the resultant search trajectory becomes nontrivial.
Edison and Tesla at the Boundaries
To put our theoretical and conceptual framework into context, we chose Thomas Edison as an empirical case study and compared him with Nikola Tesla through our methodology. These are two prominent figures from the same era. Edison is an iconic figure who captured significant value through a unique design strategy, often characterized as a successful entrepreneur and businessman rather than an inventor [34]. Conversely, Tesla is celebrated as a respected inventor known for his innovative contributions.
By examining the curvature indexes of Edison’s patents, we gain insights into how he strategically positioned his inventions within the technological landscape. Figure 1b showcases one of his patents (US251551), titled System of electric lighting, granted in 1881. This focal patent marked the first combination of electric lamp and discharge devices with conductors and insulators, represented as orange nodes labeled 315 and 174 in Fig 1 b.
Adjacent to these building blocks, there were tightly clustered technologies related to telegraphy (codes 361, 335, 178, and 340) and gas infrastructures (codes 116, 073, 135, 285, and 403). Thus, the connection between 315 and 174 in Edison’s patent curved toward them, picking up nine bundled technologies. As a result, this curved path is five times longer, thus the curvature of five, than the simple geodesic route that would involve just one intermediary technology (code 307), which spans only two degrees of separation. Figure 2 shows the curvature index of five for this novel combination in Edison’s patent, significantly higher than the average of the late 19th century. This high curvature is a manifestation of his inventive strategy, contrasting Tesla’s approach and providing a deeper understanding of their respective impacts on the technological landscape.
At first glance, the inclusion of gas pipes and joints in the curved trajectory might seem unrelated to electric lighting systems. However, a closer look at the claims in Edison’s patent (US251551) validates our method’s identification of this hidden structural connection. The patent claims describe a combination involving a gas pipe with an insulating joint and wire conductors, none of which was immediately shown in the assigned codes. Therefore, it is remarkable how our curvature-based approach can uncover hidden building blocks within the space of exploration. It suggests that the curvature index may reflect the extent to which innovators like Edison utilized well-known institutions, such as telegraphy and gas infrastructure, leveraging their familiarity while retaining the flexibility to eventually replace them. Indeed, the high curvature index of Edison’s patents is consistent with his renowned design strategy, which facilitated his organization’s ability to introduce and establish innovations that would ultimately challenge and displace existing gas industry institutions [34].
Figure 2a and 2b show the average curvature around Edison’s hundred patents and Tesla’s seventeen patents in which novel combinations were made. Comparing Edison’s patents with Tesla’s presents an interesting aspect of capturing and creating value. The relatively high curvature values for the technological pairs Edison used and his patents indicate that Edison and his colleagues had successfully created patents near the massive clusters, implying that they might have been able to use the existing infrastructures and conventions [34]. On the contrary, Tesla’s curvature indexes are lower than the average of his time, let alone Edison’s. Given that Tesla was not as successful as Edison, albeit highly respected, these findings suggest that creating values may not always yield to capture the created values. These comparison results in the historical context suggest that the curvature may indicate an essential factor in impact and capturing values but not necessarily indicate creating values.
These historical data of Edison and Tesla’s time in the 19th century do not offer systemic evidence for impact beyond anecdotal evidence. For a systematic understanding of how curvature in the search space interplays with impact, such as citations and market values, we now turn to a more recent dataset with those datasets to evaluate the findings in the next section.
Capturing Values at the Boundaries
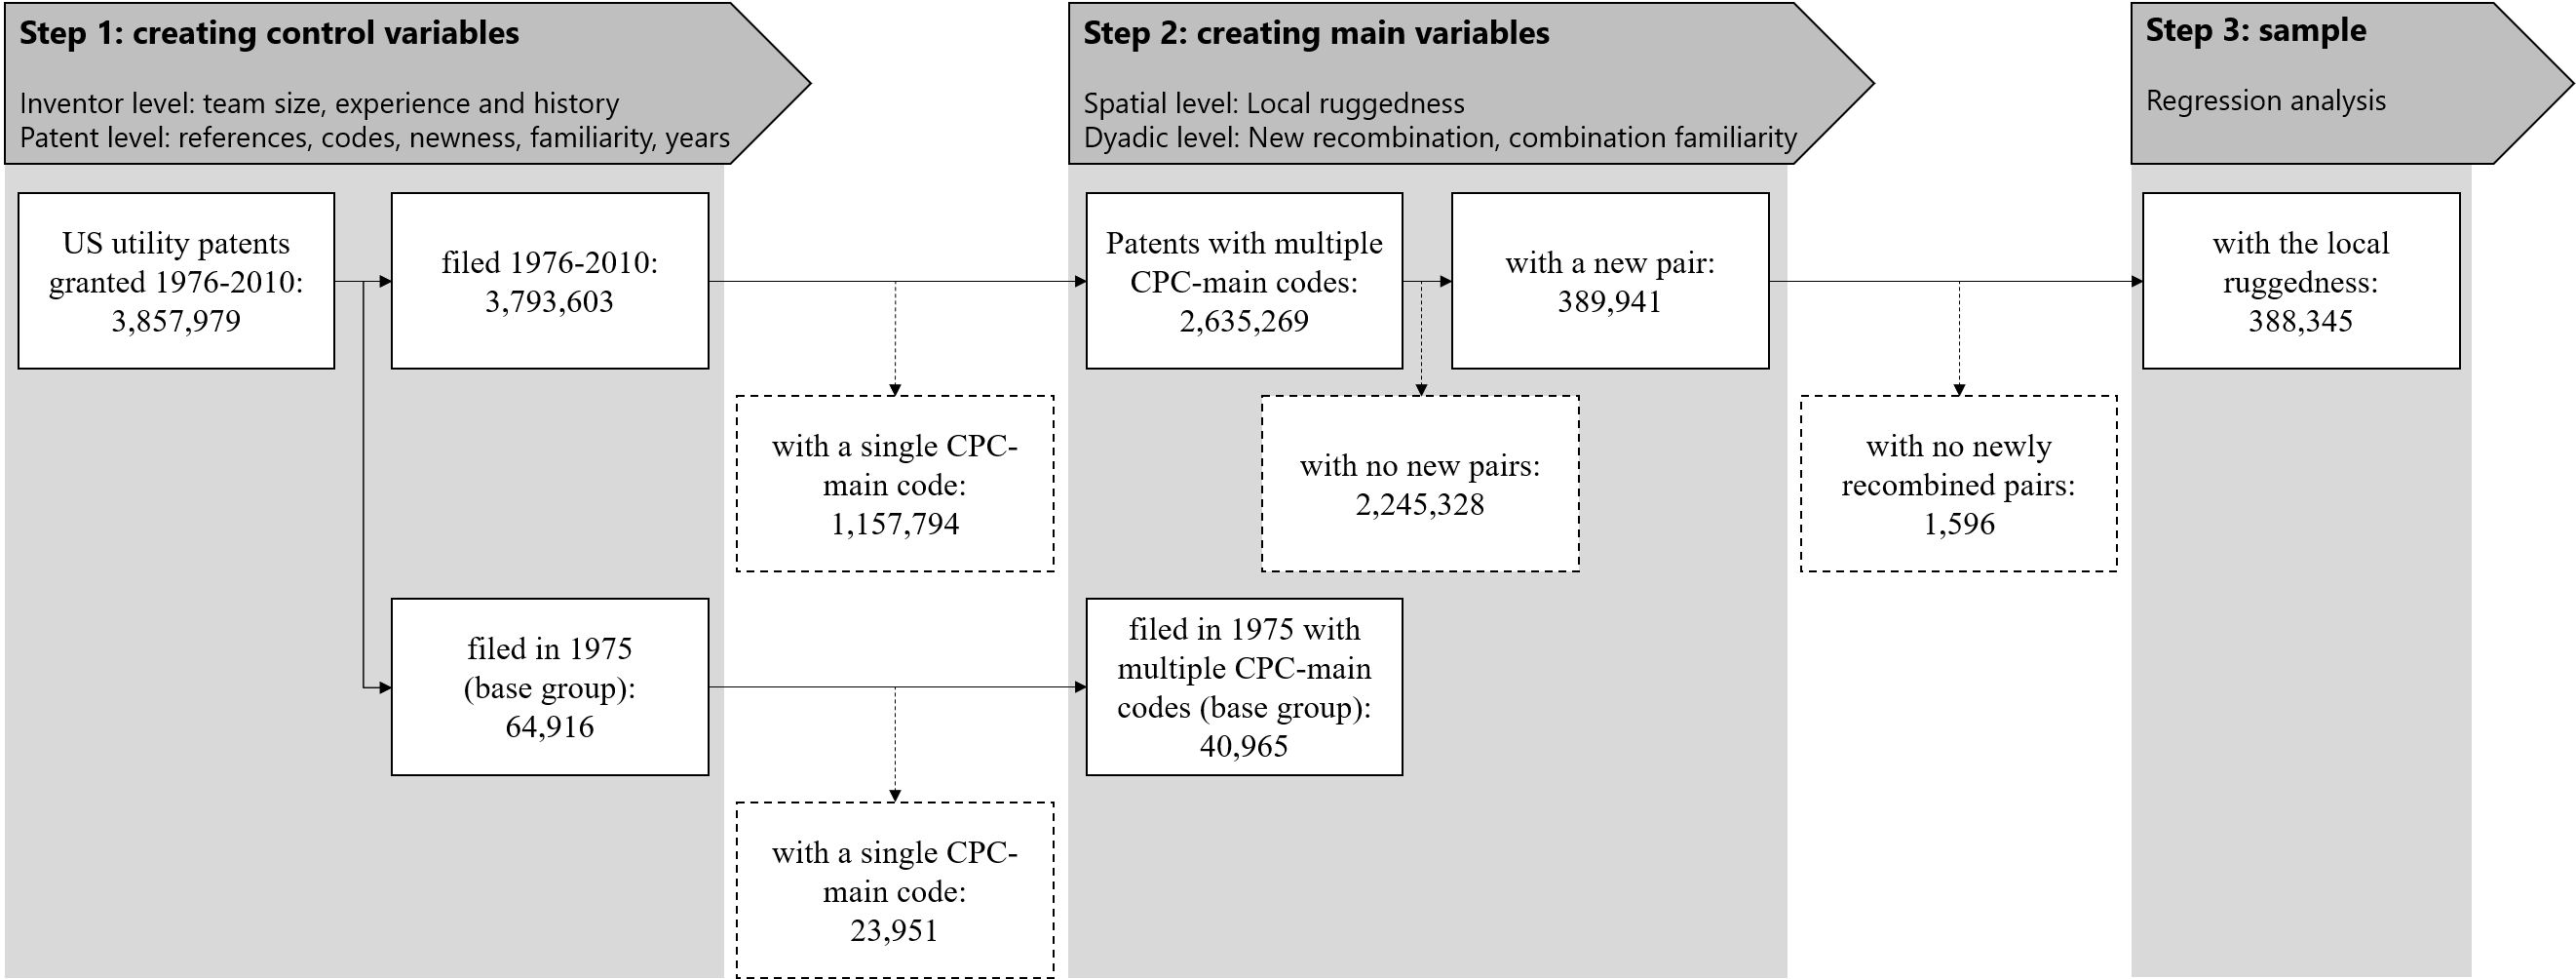
We analyze 2.6 million US-granted utility patents between 1975 and 2010 to construct the exploration space, and map out the curvature around novel combinations of CPC at the main-group level in 388,345 patents using the new pairs (see Figure S1).
Figure 2c presents a rising trend in curvature index over time around newly created pairs. This increase is primarily driven by the emergence of dense clusters, folding distances within the adjacent possible space, taking into account both historical and current usage. It is noted that while most new pairs are separated by a mere two degrees (left inset), their exploration trajectories show a significantly higher degree of bending (right inset), with curvature two to three times greater, likely due to the presence of substantial clusters in the vicinity of the exploration path. Over time, this phenomenon of space folding becomes more pronounced, influenced by the prevailing role of recombination in established successful combinations, indicating the increasing modularity within the technology landscape.

Shifting the focus from technology pairs to inventions, we calculated the curvature index average per patent and investigated its effect on the invention value, especially in terms of usefulness and market value. Figures 3a and 3b show the correlation between the curvature index average and the invention value. We employ regression models to examine whether the curvature index affects the invention value. Of these, we examine 113,256 patents with the market value operationalized as the KPSS index [35], which measures the private value of patented inventions by estimating stock market reactions invoked by them. Additionally, we test our conjecture in evaluating disruption, using 360,537 of our sampled patents with the consolidation and destabilization (CD) index [36] (see Methods and SI Section 2 for details). We classified the curvature index average into four groups of their quantile, thereby finding their associations with the invention values. Figure 3a describes that inventions in a higher quantile group have a greater probability of being top 5% cited (a hit patent) within a ten-year window. The positive direction also holds for the market value measured as the KPSS index, as shown in Figure 3b.

Figures 3c and 3d illustrate the predicted values for the hit probability and the market value based on the results of regression models, which tested the association between the curvature index average and the invention values. Similar to the correlation results, the average curvature positively predicted the invention values. As the results for usefulness, a one-unit increase in a patent’s average curvature was associated with a 23% () increase in the odds of being a hit patent within a ten-year window (see Model 4 Table S3). For the market value analysis, a one-unit change in a patent’s average curvature brought a 1.243 unit increase in the market value, measured as the KPSS index in millions of nominal dollars (see Model 2 in Table S5).
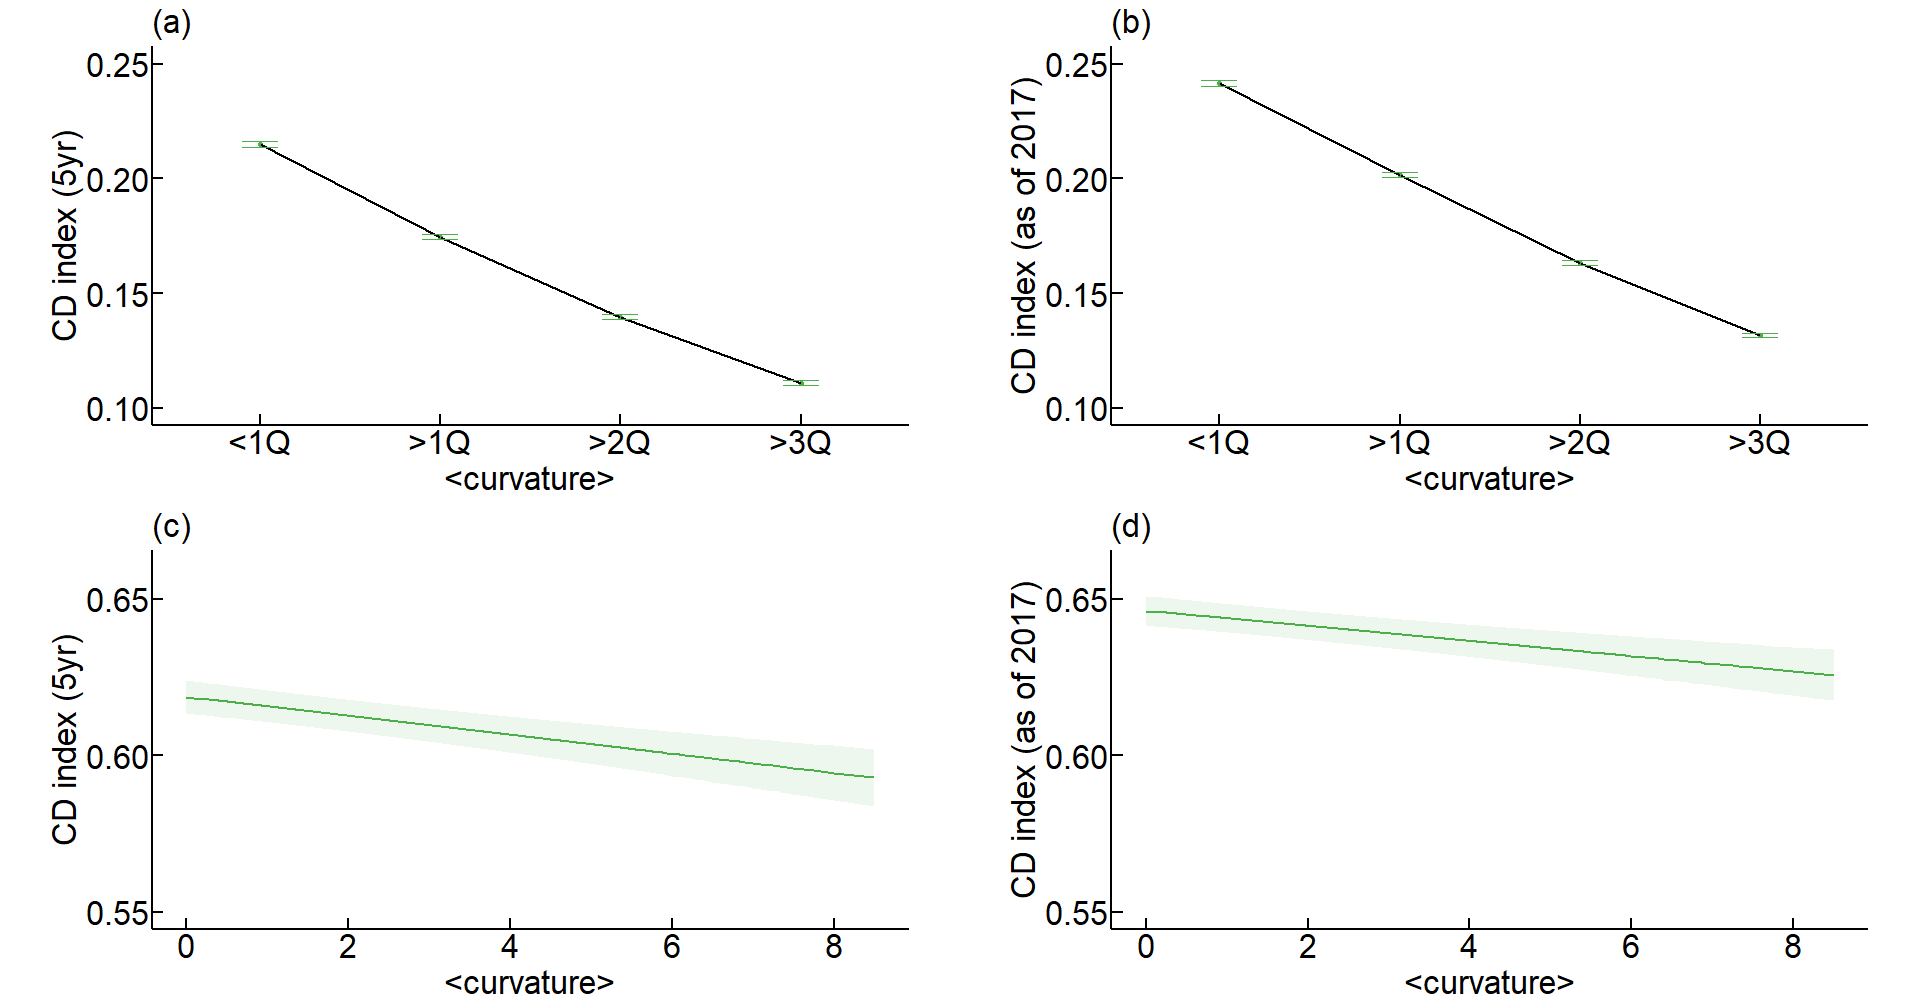
We additionally tested the relationship between the curvature index and the disruptiveness of inventions, using the CD index [36], indicating the degree of how radical an invention is against existing technologies. In contrast to our main findings on the usefulness and market value, a negative relationship between the curvature index average and the CD index held for the results of correlation and prediction (see Figures S8 and S9; Table S6). These findings support that our metric has an advantage in capturing the value of whether an invention originating from a new experiment results in practical use and commercialization, especially in the estimation of an invention’s potential for success in the market.
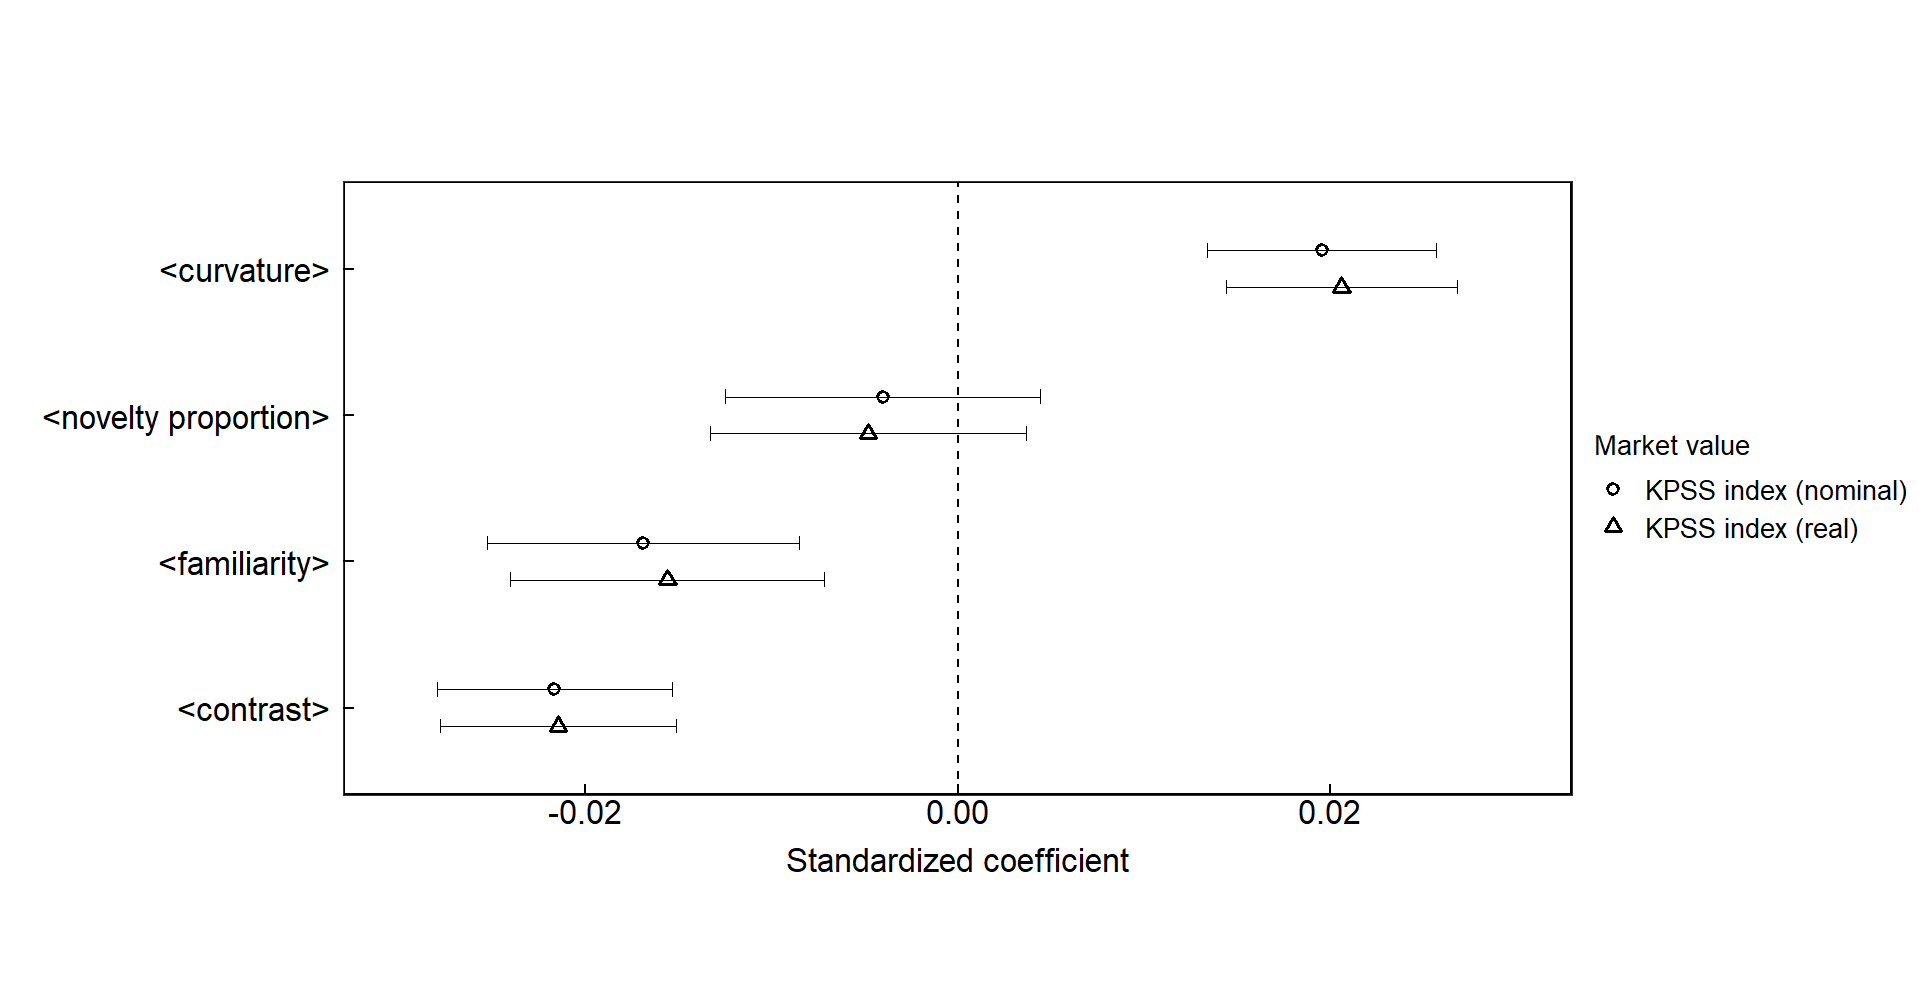
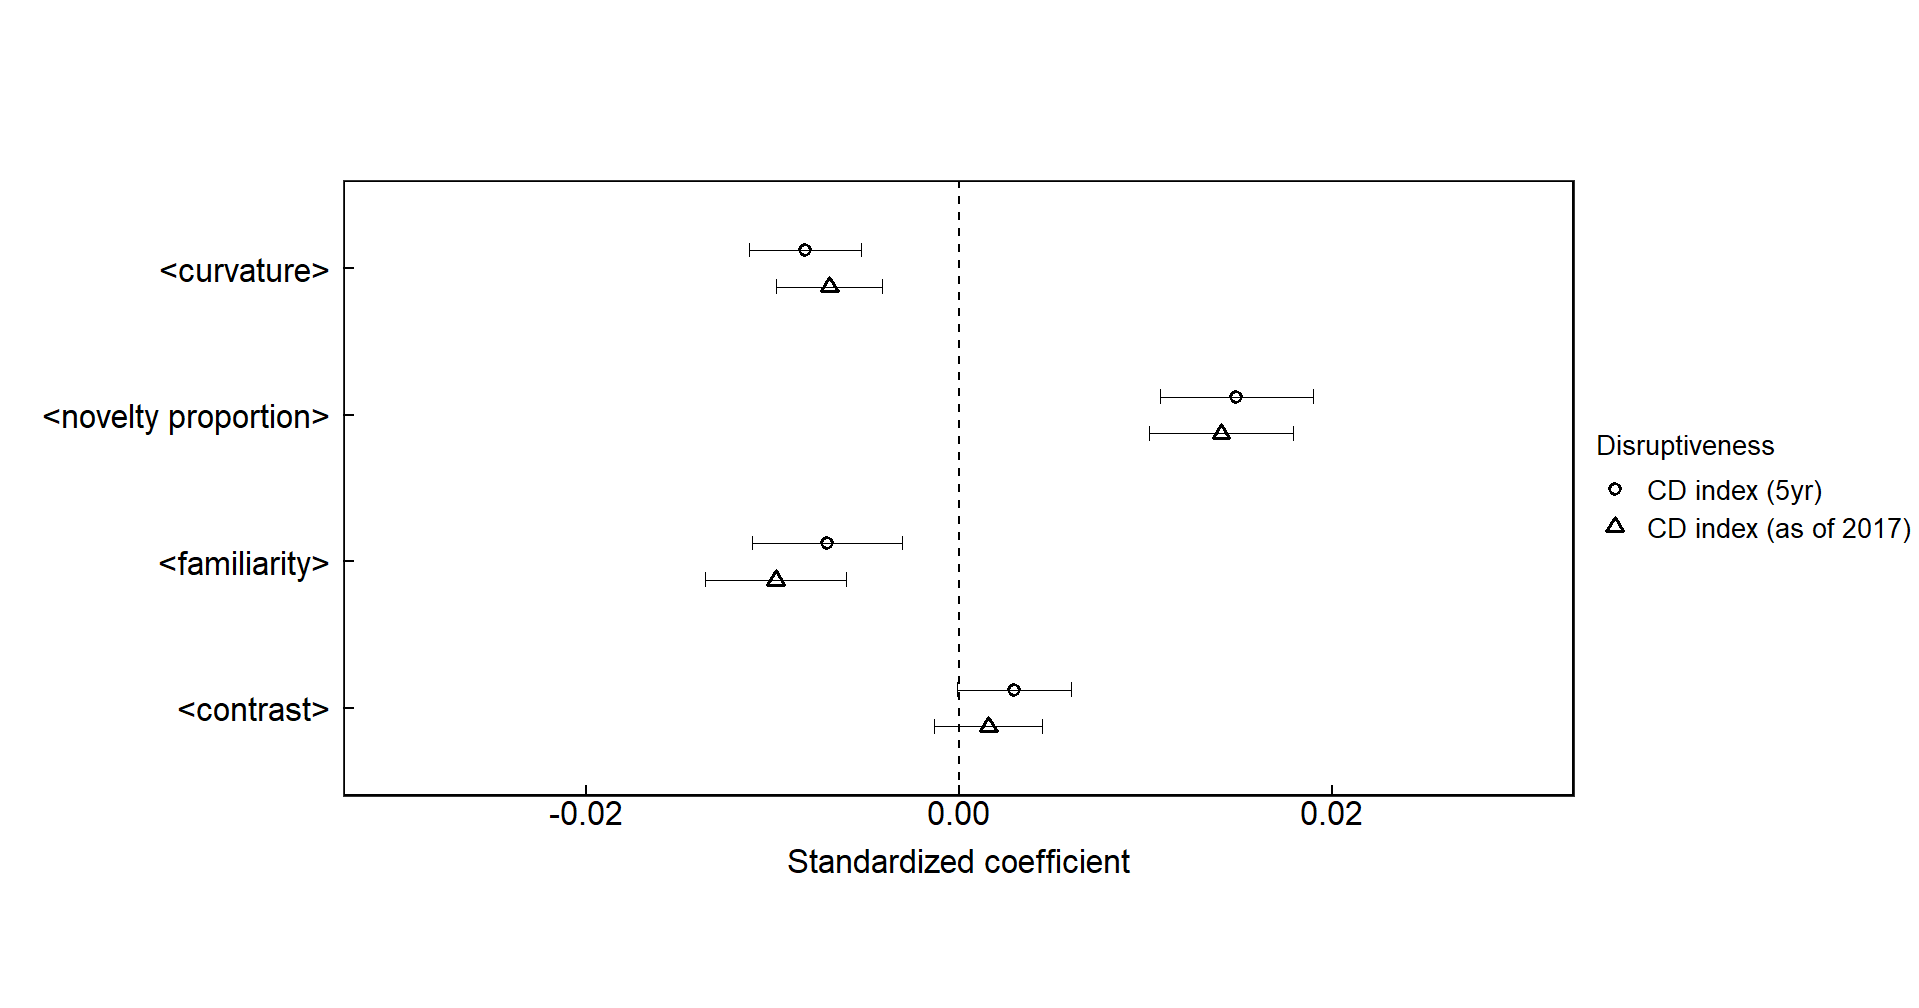
It is remarkable that our curvature index is the only statistically significant indicator for market values. To see the detail, Fig. 4. shows the standardized coefficients for market value based on several variables: the average curvature index, the ratio of new recombination, the average of combination familiarity [31], and contrast [8].
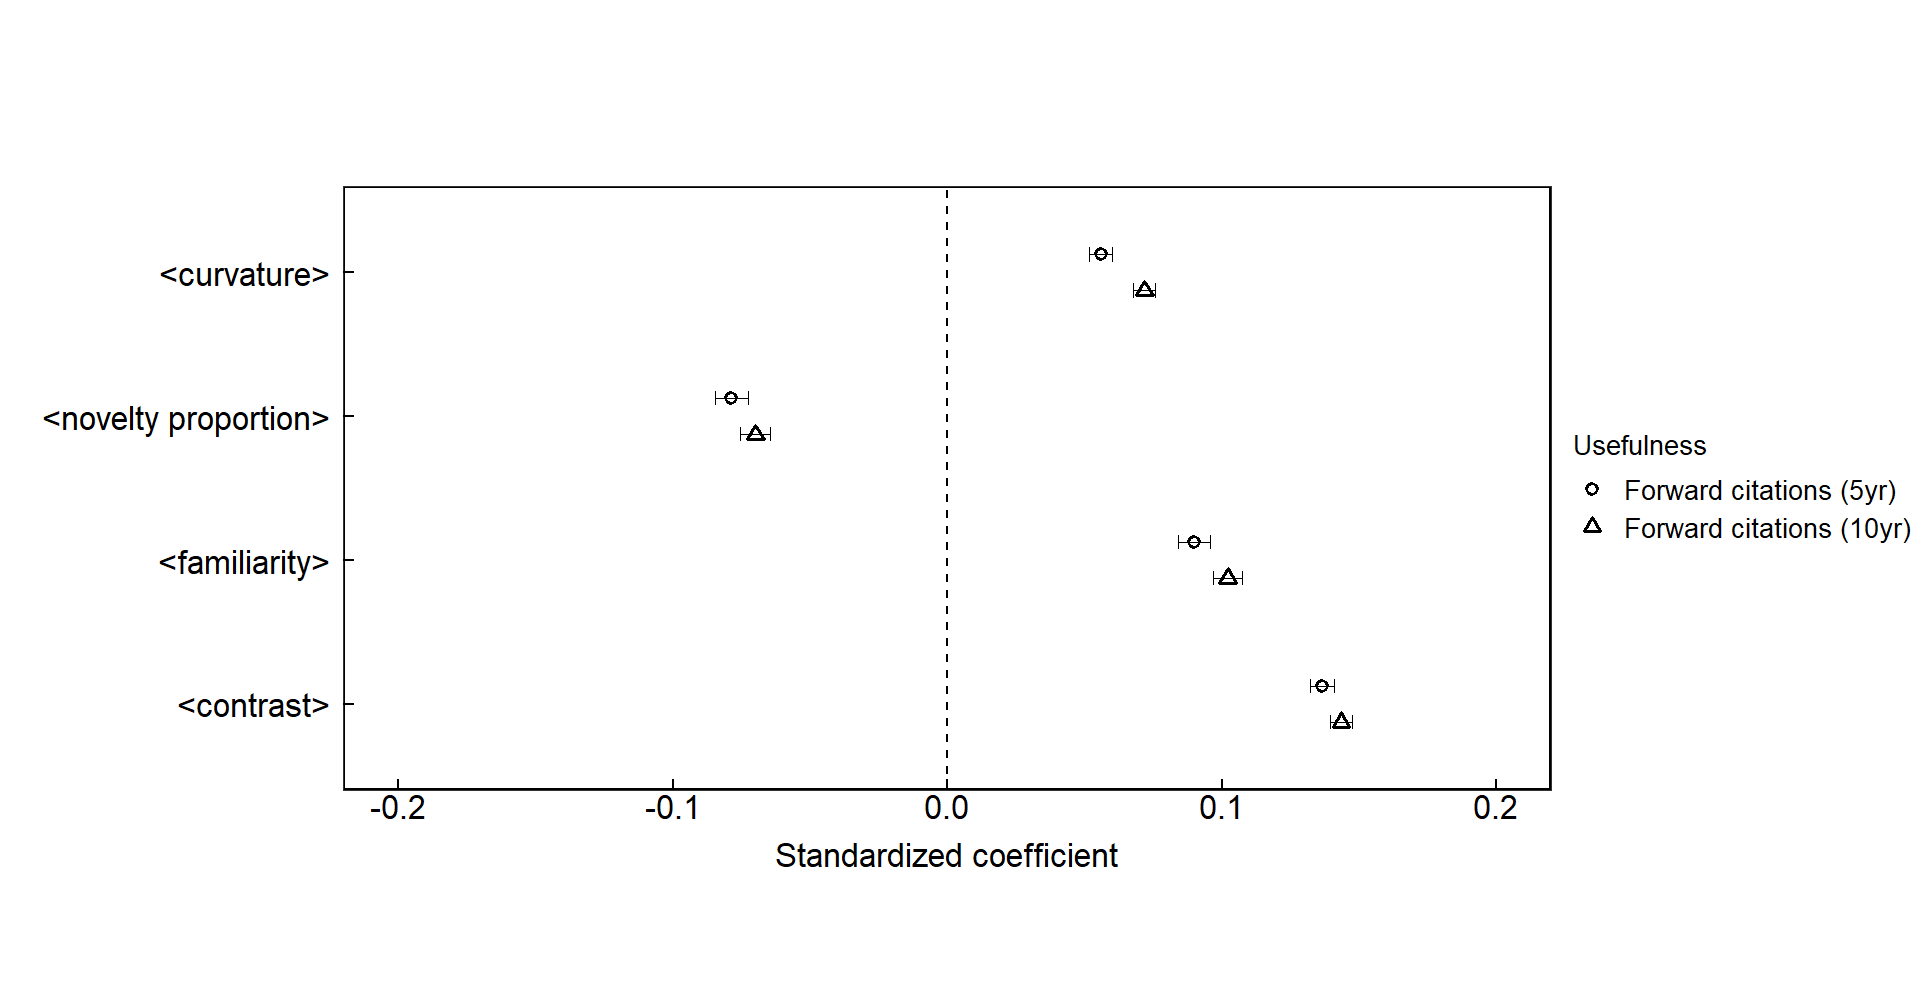
The proportion of novelty, an exploration-oriented measure, quantifies the extent to which an invention connects previously unconnected domains and a negative correlation with no significant [7, 37]. The average of combination familiarity, an exploitation-focused metric, measures the extent of reutilization of existing domain combinations [31], and it again exhibited a significantly negative correlation with market value, although they are positively correlated with our value creation measures such as hit probability (see Figure S3; Table S3 and forward citations (see Figure S5; Table S4). This predictor has a significantly negative coefficient with the market value. Contrast, which assesses how distinctively technological categories within a patent are recognized [9, 35], also showed a negative correlation with market value, although they have created many values; for example, positive effects on hit probability (see Figure S3; Table S3) and forward citations (see Figure S5; Table S4 and partially positive significant association with CD index (see Figure S9; Table S6).
These findings resonate with established insights in several ways. First, building on a reliable foundation for innovation can decrease the risk of failure by avoiding high-risk and uncertain scenarios. This factor is essential, especially considering that inventions introducing entirely new combinations often face technological uncertainties, adversely affecting their probability of success[38, 39, 40]. On the flip side, inventions that overly rely on familiar combinations or conventions typically face challenges in creating substantial future private value. Moreover, patents marked by high-contrast codes, indicative of well-defined combinations within their domains, tend to be viewed as traditional in the market. This perception often limits their potential to be perceived as highly profitable ventures, as elaborated in SI section Descriptive Analyses on the Inventive Process.

Nested Boundaries

The emergence of boundaries often heralds a wave of innovative opportunities [41]. A domain, characterized as a collection of aggregated knowledge, acts as a broad category encompassing smaller sub-categories, as seen in various taxonomy and classification systems, where additional, more nuanced boundaries are nested within larger domains.
Let’s return to Edison’s case previously discussed in Fig. 1b, featuring a prominent domain area. Within this domain, a large clustered group that significantly bends search trajectories around it, we observe smaller clusters like telegraphy, gas infrastructure, and electric systems, which are interconnected yet less distinct. These connection structures indicate nested boundaries between such smaller clusters, arising from the recursive nature of combinatorial innovation processes [42, 20].
As such, these nested boundaries typically display lower curvature, reflecting their nested characteristics. Figure 5 shows calculated curvatures around combinatorial events within the focal domain following Edison’s patent (US251551) in 1881. For instance, electric lamp systems (315) and telegraphy (178) were first put together in an invention of transmitting electrical signals (US586193) in 1897 with a curvature index of 1.5, which is way lower than that of Edison’s earlier combination. This is because the curvature of the exploration trajectory wouldn’t change much within the cluster as alternative paths are comparable. In fact, most of the newly combined pairs that followed exhibit a lower curvature index than the average index of that period, let alone Edison’s pair in 1881. This trend showcases Edison strategically targeting less explored, high-curvature areas, resulting long streak of entrepreneurial ventures, where [34].
Edison’s example demonstrates how pronounced boundaries, characterized by steep curvature, emerge around a large domain, masking intricate connections within. Within this large cluster, however, there exist smaller, nested clusters, each defined by its own boundaries, offering new inventive opportunities. Nevertheless, as part of the broader structure of the overarching cluster, these nested clusters exhibit lower curvature indices than the overarching clusters, not to mention below the average curvature of the time, as depicted in Fig. 5. This finding suggests that creating novel combinations within these massive clusters does not necessarily guarantee high-value capture. Additionally, the value created from these combinations isn’t just a result of the extensive growth of the larger clusters. Indeed, value capture is most likely to occur not within the cluster’s core or far from it but at the domain’s edge, where high curvature marks the exploration space.
Why Higher Curvature Makes Higher Impacts
High curvature in technological domains indicates the presence of significant clusters with distinct boundaries as manifestations of well-established, institutionalized technologies, which routinize these bundles of building blocks as if they were a well-packaged module. These technologies not only foster technical and social structures but also signal emerging contexts [43], akin to paradigms that shape our heuristics about practical usage and behaviors [44, 45]. Progress within such established domains is typically incremental, building on and refining existing institutionalized knowledge rather than through sudden, groundbreaking discoveries.
In contrast, novel experiments that venture into unexplored territories often break away from these established paradigms [46], displaying non-paradigmatic characteristics [47]. These innovations contribute uniquely to the field but face the challenge of gaining consensus on their use within the existing paradigmatic system. For instance, Edison’s initial introduction of the phonograph was not immediately successful, as it did not align with practical applications and failed to convince the public of its utility [34, 48]. By strategically placing novel ideas near the distinct boundaries of large, institutionalized technological clusters, inventors can reduce the risks associated with introducing new concepts and lower the barriers to market entry [41].
Additionally, high-curvature spaces, marked by large clusters, serve as breeding grounds for new innovations, arising from the interactions of local elements [49]. The extensive nature of these clusters increases the likelihood of new technological combinations, thanks to the combinatorial possibilities among adjacent components [26, 27, 32]. As such, this environment is where the ‘hot-streak’ phenomenon in individual impact could occur, as individuals find themselves within these vibrant spaces [50]. Such clusters, embodying institutionalized knowledge, act as dense repositories of successful technologies.
A high curvature index indicates a densely packed structure filled with established, routinized components. This concentration points to a modular configuration that not only accelerates the rate of innovation [51] but also allows inventors to navigate numerous possibilities within a framework of redundant information [21, 52, 53, 54]. This setting leads to various combinatorial patterns in adjacent possibilities [26, 27, 32]. As a result, the defined boundaries of these domains highlight the subtle effects of exploration, especially how new endeavors indirectly connect to existing domains.
Capturing Created Values
Our findings demonstrate that inventions with a high curvature index, such as those by Edison, are potent in both creating values for future innovations and capturing market values. The curvature index appears to strike an optimal balance in boundary-spanning search, well-portioned the exploration for groundbreaking discoveries with the exploitation for practical applicability in new technological ventures. While highly exploratory experiments pave the way for radical inventions, they also come with risks tied to untested and unproven technological aspects. Frequently bundled building blocks within a cluster, indicative of repeated testing and usage, signal their established success and potential for institutionalization. Being close to these established boundaries often ensures a balance, avoiding domains that are either too familiar or too novel, thus enhancing the likelihood of value capture [17, 28, 55, 56]. For novel ideas, leveraging established practices is key to capturing value, with moderate novelty being particularly significant.
Taken together, we present evidence that the curvature index is a strong indicator of new ideas and products’ future success. When evaluating an invention’s value, it is essential to recognize the difference between value creation and value capture. Innovations can act as catalysts for new ideas, leading to the formation of new industries and offering innovative solutions to existing challenges, thereby generating value where it previously did not exist. We evaluate value creation based on an invention’s impact on future innovations, using metrics like citation impacts (forward citations and hit probability) and the degree of disruption it incurs [36]. However, the realization of this value often experiences delays due to a variety of factors, meaning not all value-creating innovations successfully capture their value in the market. Our approach also assesses an invention’s immediate economic impact to gauge its market value.
Furthermore, our method illuminates the structural characteristics that delineate the boundaries of a domain cluster, particularly highlighting the concentration of adjacent domains. This is essential in evaluating how an exploratory experiment relates to existing technologies and determining whether a new challenge is manageable or overly ambitious. We explore these advantages further in our discussion section.
Robustness Check
Our findings of value creation and value capture are robust to alternative measures for the dependent variables. First, our results on the value creation index (hit probability) in Fig. 3c do not change with a hit probability of five years instead of ten years for the probability of a hit patent (see Figures S2 and S3; Table S3); but also robust to the different measure of value creation such as the total forward citations within five- and ten-year windows (see Figures S4 and S5; Table S4). As to the disruption index (CD index), our findings are robust to either the CD index within five years or the CD index calculated as of 2017, provided by Funk [57] (see Figures S8 and S9; Table S6). Finally, the market value in Fig. 4 is robust against deflated to 1982 million dollars using the Consumer Price Index (CPI) [35] (see Figures S6 and S7; Table S5). In all instances, the results consistently supported our conclusions drawn from our primary analysis. The detailed results with these alternative, dependent variables are presented in the SI section 2.
Discussion and Conclusion
Technological domains are dynamic, complex, and multifaceted. Our bottom-up approach provides a comprehensive framework for understanding these domains as clusters of technologies that are frequently combined, serving as a valuable tool for inventors and acknowledging the ever-changing landscape of technological innovation [58]. In a broader perspective, the recent surge in machine learning leverages context embedding through the co-occurrence of vocabularies often referred to as a continuous bag of words, the same input of the co-occurrences of codes in inventions. Fundamentally, our data input mirrors this approach as discussed in [59], and the emergence of the context in [43]. As embeddings are constructed to capture the meaning of singular words or phrases, the network structure we created are a good first approximation for embedding space that predicts prescient idea, emerging the periphery [41], and the likelihood of innovative connections [59]. The interconnectivity within this realm is further elucidated in [60].
Our study contributed to revisiting the combinatorial possibilities and landscape view. The conventional approaches have solely identified new combinations at the dyadic level [7, 28, 31, 37] or the landscape theoretically conceptualized a combinatorial phase space with constrained parameters [26, 61, 62, 63, 64]. We reimagined the landscape as the outcome of inventors’ inventing activities. In this landscape, domains were identified as significantly curved areas. Such curvatures reveal the boundaries where inventors have never attempted to combine incumbent technologies inside and outside the domain. Our measurement depicted the structural characteristics of these boundaries through the existing adjacent domain configurations. By adopting the degree of separation [65, 66], we observed different indirect connections between existing domains tied to the newly recombined pairs, such as non-trivial paths. Comparing these indirect paths bundled at the boundaries, we empirically clarified that the technological spectrum of explorative combinations differed by existing technologies relevant to their combinatorial events.
We found that inventions emerging from uneven boundaries put more into practical use and commercialization. These boundaries are the very spots of demarcating between distinct domain areas. This can translate into a modular configuration with the tension between exploration and exploitation. Crossing the boundaries enables inventors to explore new ideas by combining disparate technologies while learning from many existing technological adjacent elements [47]. It enhances the feasibility of the explorative experiment in practical use and consumption. Our findings support that the curvature index positively predicts the invention’s usefulness and market value, especially demonstrating that it had an advantage over other search-related explanatory variables in the prediction. Our study provided empirical evidence on the spatial pattern of the domain boundaries in the landscape, thereby elaborating why boundary-spanning searches disproportionately lead to future technological impact in view of the technology landscape.
We also provided a practical implication that can enhance the effectiveness of boundary-spanning searches by reducing their risks. Given the increasing complexity of the inventive process, inventors need to consider a strategy for expanding their search horizons in the technology landscape. Most inventors will first refine already-known knowledge because exploration is costly and time-consuming [31, 67]. While exploring unknown areas, however, inventors should avoid overly familiar or entirely novel experiments to enhance value capture in terms of future success. Our measurement enables inventors to seek a particular new opportunity based on rich bodies of institutionalized knowledge. Accordingly, the strategy of uncovering the domain boundaries would be helpful to inventors striving for successful innovation in technological breakthroughs.
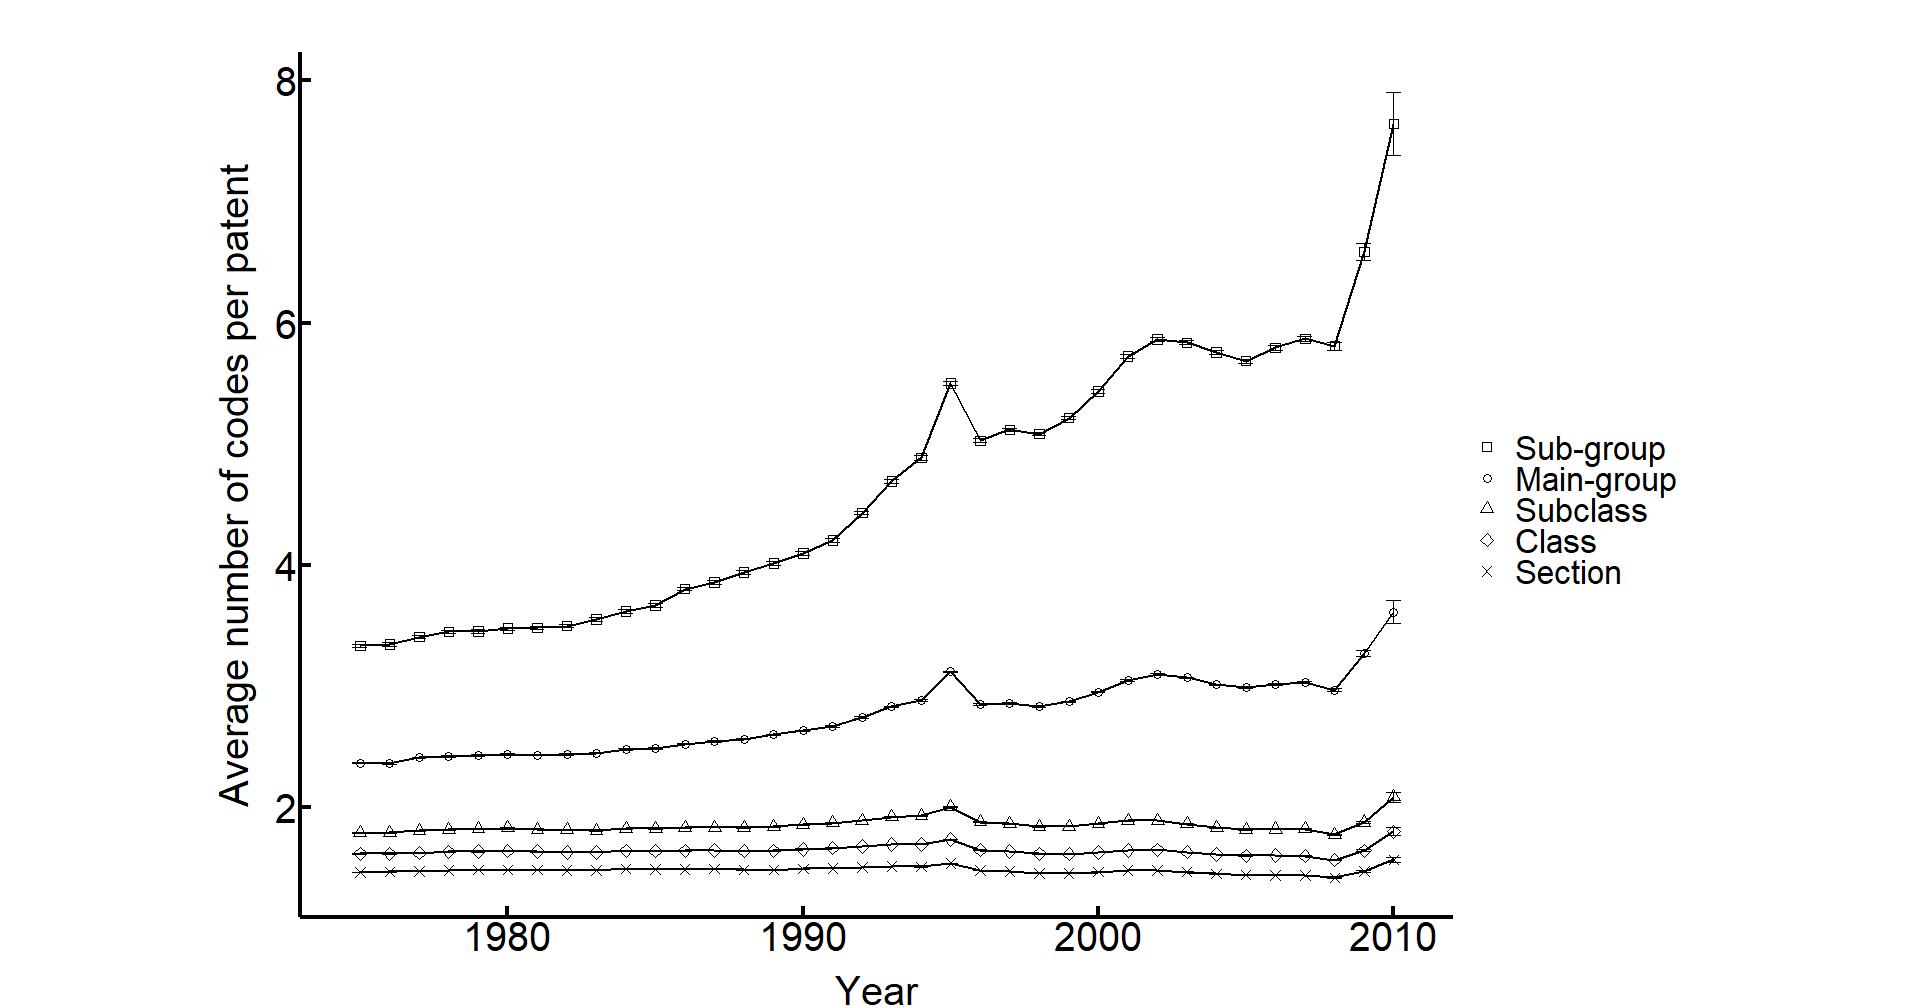
Some limitations should be acknowledged, which also suggests future research directions. First, the technology codes of patented inventions were truncated into the CPC main-group codes to conduct our analysis. Due to the time complexity of the algorithm [68], we assumed that the CPC main-group codes are the minimum weight for identifying the variation of hierarchical domains in a patented invention. While the truncated classification allowed us to map the technological landscape easily, it may need cautious interpretation because the finest-grained level codes were not entirely identified. In addition, our analysis was limited to the patented inventions with newly recombined pairs at the CPC main-group classification. Figure S11 shows similar trends in the annual average number of each technology code per patent. However, future research could describe the landscape in more detail with the finest-grained classification. Second, our analysis was limited to the information documented in patents. The relationship should be theorized with other dimensions that may also affect the boundary-spanning search: the firm’s characteristics and its R&D capacity. We did not fully reflect the inventive process, relying exclusively on patent data. Nevertheless, our findings were consistent across different variables in terms of the invention’s usefulness and market value.
Despite these limitations, this study enriches our understanding of boundary-spanning searches. Inventors can explore inventive opportunities by linking previously unlinked domains. However, every explorative experiment cannot always succeed. The likelihood of its success can increase when the experiment is balanced between exploration and exploitation. Our proposed measurement would provide inventors with a milestone of searching in the landscape, enabling them to find a balanced boundary between familiar yet new domains.
Methods
Data and Sample
We use utility patent records in the United States Patent and Trademark Office (USPTO), accessed through the Google Patent Dataset and PatentsView. The Google Patent Dataset offers a comprehensive historical record, spanning from the inaugural patent in 1791 to 2015, albeit without citation data or market value information. Considering Edison’s and Tesla’s inventing activities, we use this historical record from 1836 to 1933 to measure the curvature index to compare their patents to average patents of the time. Unfortunately, this historical data does not provide citation or market-value information. Therefore, we instead rely on anecdotal narratives about these iconic figures. The result is included in Fig. 2 inset.
On the other hand, PatentsView offers more detailed information on patents granted since 1976, including details such as application and grant dates, inventor information, citations, and technology classifications. Therefore, this dataset offers comprehensive results utilizing the detailed patent information from PatentsView for a more nuanced examination of citations, distruptiveness, and market values. We collected from this database 3,857,979 utility patents granted between 1976 and 2010, from which we calculate control variables. Among them, 2,676,234 patents include more than one code to build a network of technology codes. Of these, our analysis focused on 388,345 patents that used entirely novel technology pairs considered as the outcome of boundary-spanning searches in the Cooperative Patent Classification (CPC) main-group classification. In our sampled patents, 360,537 patents include the invention’s disruptiveness provided by Funk and Owen-Smith [36]; and 113,256 patents include their market value (the KPSS index), estimated by Kogan et al. [35] (See SI Section 1 for details).
Measures
Dependent Variables
We measured the invention’s usefulness as the probability of a hit patent, defined as being in the top 5th percentile by citations among the grant year cohort. It was a dummy that took the value 1 for a hit patent. The citations were measured as the number a patent has received from subsequent patents within five- and ten-year windows after the granted year of the patent. We also used the number of forward citations within each time window for a robustness check. The underlying assumption of the measure is that patent citations are highly associated with their technological value [69, 70, 71]. For the market value, we used the KPSS index constructed by Kogan et al. [35], which measures the private value of patented inventions by estimating stock market reactions to them. As a proxy for the disruptiveness of an invention, we adopted the CD index [36], indicating how popular a patented invention is to the later work and how much it challenges existing technology streams.
Explanatory Variables
Curvature index. Curvature in mathematics is defined as the degree to which a curve deviates from a straight line. In our case, the straight path is defined as the number of degrees of separation without accounting for previous co-uses. When codes have been bundled so often, we consider them close to each other, proportional to their frequent use. For example, an effective distance between and , where is the number of patents that have put together codes and . Employing familiarity measure in [62], effects of the distant past events on our current landscape are exponentially depreciating with their time, that is,
| (2) |
where counts patents that have and in years in the application date (when analyzing Edison’s and Tesla’s patents, we drew on the grant date), whose impact is exponentially depreciated with characteristic time . The longer is, the longer memory the system has. In our case, we followed the convention that is five years, meaning that the events five years ago will impact less than half of the current event’s impact (basically, 1/e). Considering the typical patent citation cycle spans approximately ten years, we estimate this characteristic length as five years [31].
We measure how much the space of possible is curved by the massive interactions by calculating the degree of separation. It was measured through the following four steps. In the first step, the landscape of existing technologies was treated as a network of technology codes. Thus, we built the co-occurrence network as a matrix for a given year , where denotes the unique CPC codes issued from 1975 up to year . In the second step, we weighted the network links by the inverse of the combination familiarity [31] of each pair, measured in year , using Eq. (1). In the third step, we found the shortest paths of the newly recombined components at year . Assuming that the components exist in the cumulative landscape, we retrieved new pairwise combinations from the networks accumulated from 1976 up to year ; the base network was one constructed by patents filed in 1975. We then observed the unweighted and weighted shortest paths of the first-ever recombined pairs, corresponding respectively to the trivial and nontrivial paths, using 34 weighted networks of patented technologies by moving year from 1976 to 2010. Dijkstra’s [68] algorithm was used to find the shortest path between the retrieved components, which is an iterative algorithm that selects a neighboring node with the minimum cost to move on to the next one in every step. At the technology pair level, the boundary index was calculated by the ratio of the weighted and unweighted shortest path distances. We defined its value as 0 when a newly recombined pair has no indirect path. Finally, our regression models included the average curvature of the focal patent, which we term curvature index.
Combination familiarity. It indicates how recently and frequently existing technologies have been combined [31]. We count the number of prior patents that use a particular combination of technologies retrieved from a focal patent field in year . This number denotes the cumulative usage of each technological combination used in the focal patent. Then, we multiplied the cumulative combination usage and an exponentially decaying component that indicates the difference between the application year of the focal patent and that of the prior patents. The latter reflects the loss of knowledge over time. The sum of the multiplied values was defined as the combination familiarity of a given technological combination. In sum, the following equation denotes combination familiarity:
| (3) |
, where () denotes how frequently the technology codes were used years ago. The impact of use frequency to the familiarity measure is exponentially depreciating at the rate of , the characteristic time for memory loss (or knowledge loss). Considering the typical patent citation cycle spans approximately ten years, we estimate this characteristic length as five years [31]. We calculated its patent-level measure by taking the average value of combination familiarity for a patent. Our analysis used the logarithm of the combination familiarity average.
Proportion of novelty measure. For each patent, we identify all unique technology code pairs at the CPC main-group level. We then identified which pairs were newly created each year. The ratio of new recombination was calculated by dividing the count of these novel pairings by the total pairs in the focal patent.
Contrast measure. Following [8, 9], we calculate the category contrast for each main-group code in the CPC classification. The contrast measure quantifies the extent to which a primary code (the first-listed CPC code on a patent) is exclusively associated with its sub-categories in various inventions. The underlying principle is that the more often sub-group codes align with its primary code within patents, the more distinctly this primary code emerges as a representative symbol of the invention. Accordingly, a code’s contrast is calculated in two steps. Initially, we compute the proportion of sub-group codes that are part of the primary code. Subsequently, this proportion is averaged across all patents for each year to determine the contrast level.
Control Variables
We considered the inventor-level characteristics of each patent. When including the control variables especially relevant to the inventor’s characteristics, we used all the collected 3,857,979 utility patents to observe the history of inventors’ patenting activities. The number of inventors was included because the inventor team size is related to collective problem-solving behaviors [72]. The diversity of technological experience for the focal patent’s inventors was measured as the number of CPC main-group codes at least one of the inventors has used in their prior patents, which was logarithm-transformed with offset 1.
We accounted for several characteristics of patent information. The patent’s application year was a set of dummy variables to distinguish the cohort of patents to estimate the invention’s value by year. The number of patent references was included to indicate the range of subject matter a given patent covers [73]; it was logarithm-transformed with offset 1. For the non-patent references, we created a dummy with 1 when an invention relied on them and 0 otherwise. The number of CPC main-group codes in a patent was controlled because it has been studied as a predictor of patent citation impact [74]. The number of CPC subclass codes was also included, which explains the domain differences of technologies at the coarse-grained level. We also controlled for non-retrieved code as a dummy, which took a value of 1 when an invention combined at least one new CPC main-group code that was not retrieved from the cumulative technology landscape and 0 otherwise.
Analysis Strategy
Considering the characteristics of the dependent variables, we used the binary logistic regression model for the probability of a hit patent, the negative binomial regression model for the number of forward citations, and the OLS regression model for the KPSS index and the CD index.
Acknowledgement
H.Y would like to acknowledge the support of the National Science Foundation Grant Award Number 2133863. S.Y and H.Y thank Brian Uzzi and Hyun Ju Jung for their valuable feedback.
Supplementary Information
1 Data and Sample
We collected utility patent records in the United States Patent and Trademark Office (USPTO) from the Google Patent Dataset and PatentsView. On the one hand, the Google Patent Dataset covers patents from 1791 to 2015, including the inaugural patent, but lacks citation and market value data. Relying on this dataset’s historical records from 1836 to 1933, we compared the curvature indexes of Edison’s and Tesla’s patents and their pairs. On the other hand, PatentsView offers more detailed information on patents granted since 1976, including details such as application and grant dates, inventor information, citations, and technology classifications. From PatentsView, we collected 3,857,979 utility patents granted between 1976 and 2010. Of these, 2,676,234 patents were assigned to more than one code to build a network of technology codes. Among them, our analysis focused on 388,345 patents that used entirely novel technology pairs considered as the outcome of boundary-spanning searches in the Cooperative Patent Classification (CPC) main-group classification. As a subset of our sample, 360,537 patents include the invention’s disruptiveness introduced by Funk and Owen-Smith [36]; and 113,256 patents include their market value (the KPSS index), estimated by Kogan et al. [35].
We drew on the CPC main-group classification, which is the second finest-grained in the technology code system. As the analysis of the finest-grained CPC classifications needs extremely high costs and resources to compute a network modeling, we broke down the finest-grained codes into the second finest-grained ones. The CPC code system consists of five parts from the coarsest- to finest-grained codes: section, class, subclass, main group, and subgroup. The first capital letter of the CPC codes represents a section, followed by a class symbol denoted as a two-digit number. The subclass symbol includes the section and class symbols followed by a letter. The main-group symbol is represented as a one-digit to a four-digit number; the subgroup symbol is added up to six digits. There are approximately 250,000 CPC classification entries, including the subgroup part, at the finest-grained level.
However, a large-scale network might not be suitable for the current analysis because the operational time of a network algorithm (i.e., Dijkstra’s algorithm) increases remarkably proportional to the maximum number of links possible in a network. In other words, it is determined by the squared value of the number of nodes [68]. As such, we employed the second finest-grained classification, the CPC main-group codes, assuming that the properties of lower-level classifications belong to higher-level ones. For example, the CPC full code C07D 203/02 was truncated into C07D 203 at the main-group classification. Consequently, our analysis used 10,160 CPC main-group classification entries.
Our main explanatory variable, the curvature index, was measured in the networks of technology codes based on 2,676,234 patents with multiple codes in the CPC main-group classification. The control variables relevant to the inventor- and patent-level characteristics were created from all the collected 3,857,979 patents.
Using our sampled 388,345 patents, we tested the impact of the curvature index on the invention’s usefulness. After merging our sample and data from Kogan et al. [35], we used 113,256 patents with the KPSS index to analyze the relationship between the curvature index and the invention’s market value. For the additional analysis of the invention’s disruptiveness, we used 360,537 patents with the CD index, which overlapped with data from Funk and Owen-Smith [36].
2 Results
We first assessed the possibility of multicollinearity. The generalized variance inflation factor (GVIF) was calculated because there were multi-level categorical variables in our study variables. was also calculated to compare GVIFs across dimensions, where df denotes the degree of freedom of the variable [75]. As a rule of thumb for testing multicollinearity, should be less than 2. This value is comparable to a variance inflation factor (VIF) threshold value of 4 as a recommended VIF value for multicollinearity [76]. The values of all variables in this study ranged from 1.007 to 1.534, indicating no multicollinearity issues. Table S1 shows the descriptive statistics and a correlation matrix for the study variables.
Curvature Index and the Invention’s Usefulness
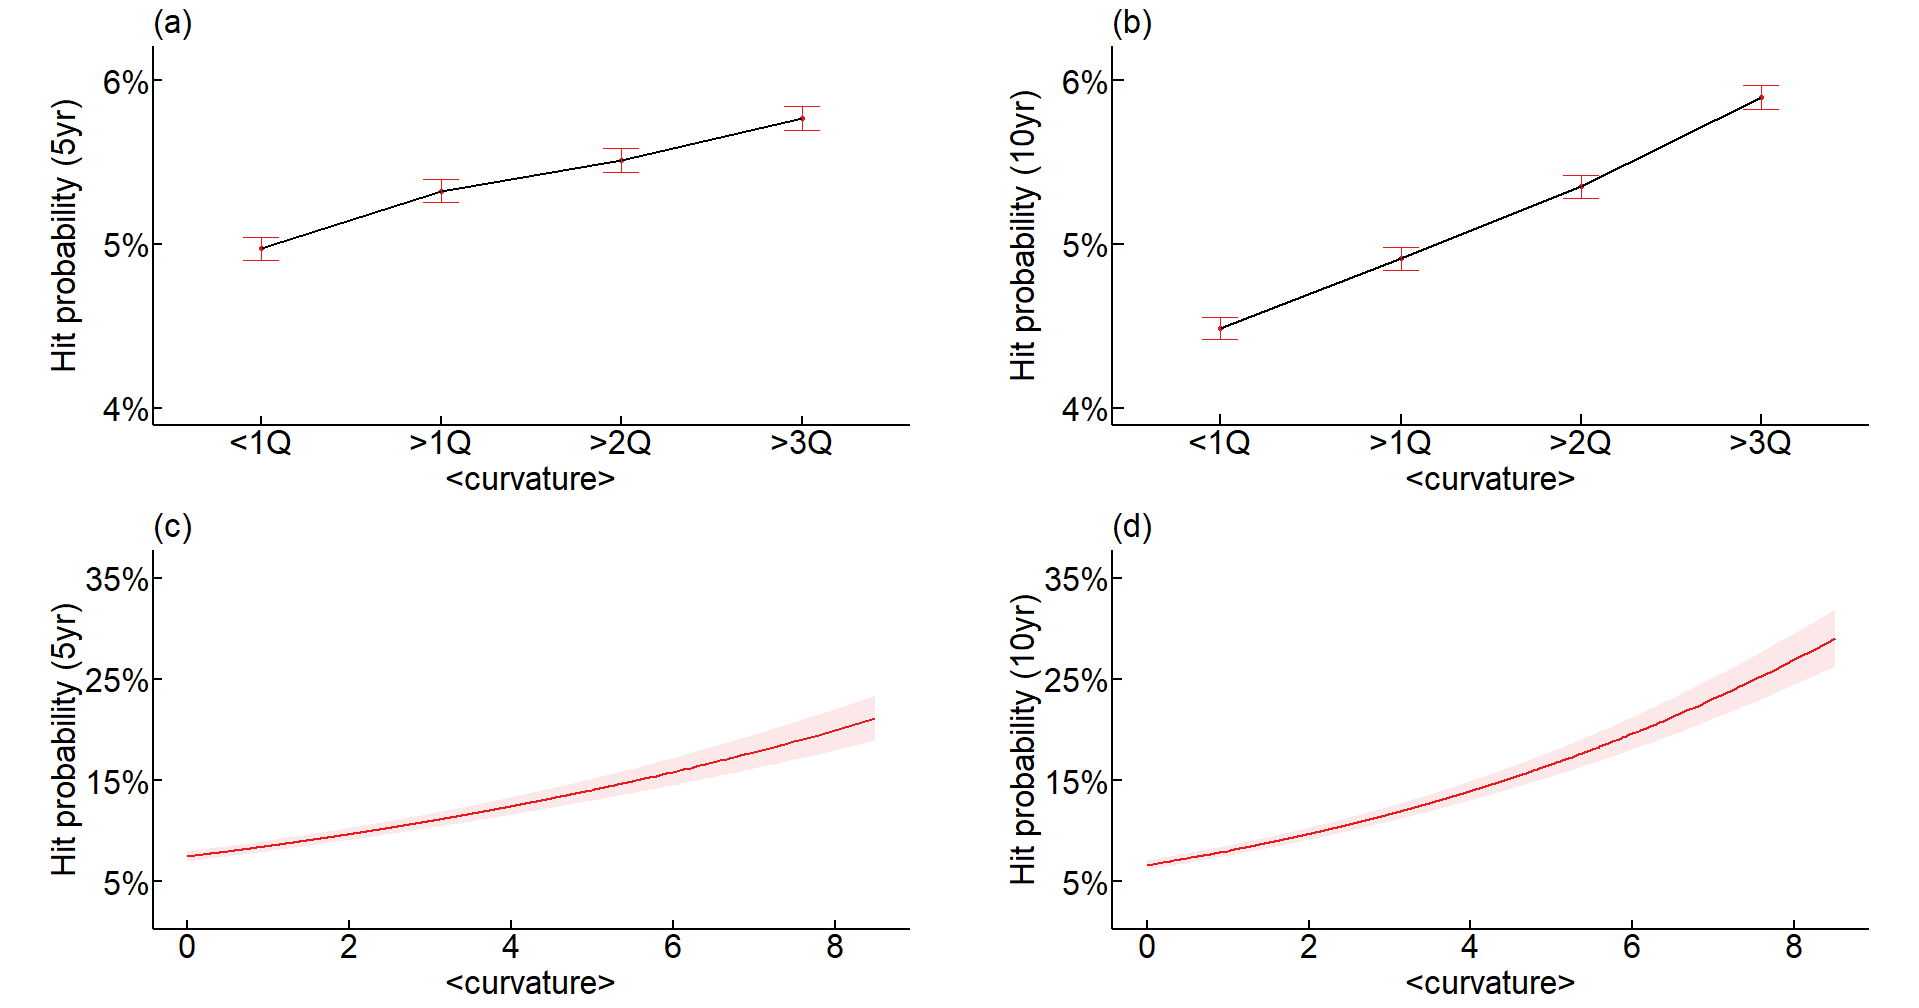
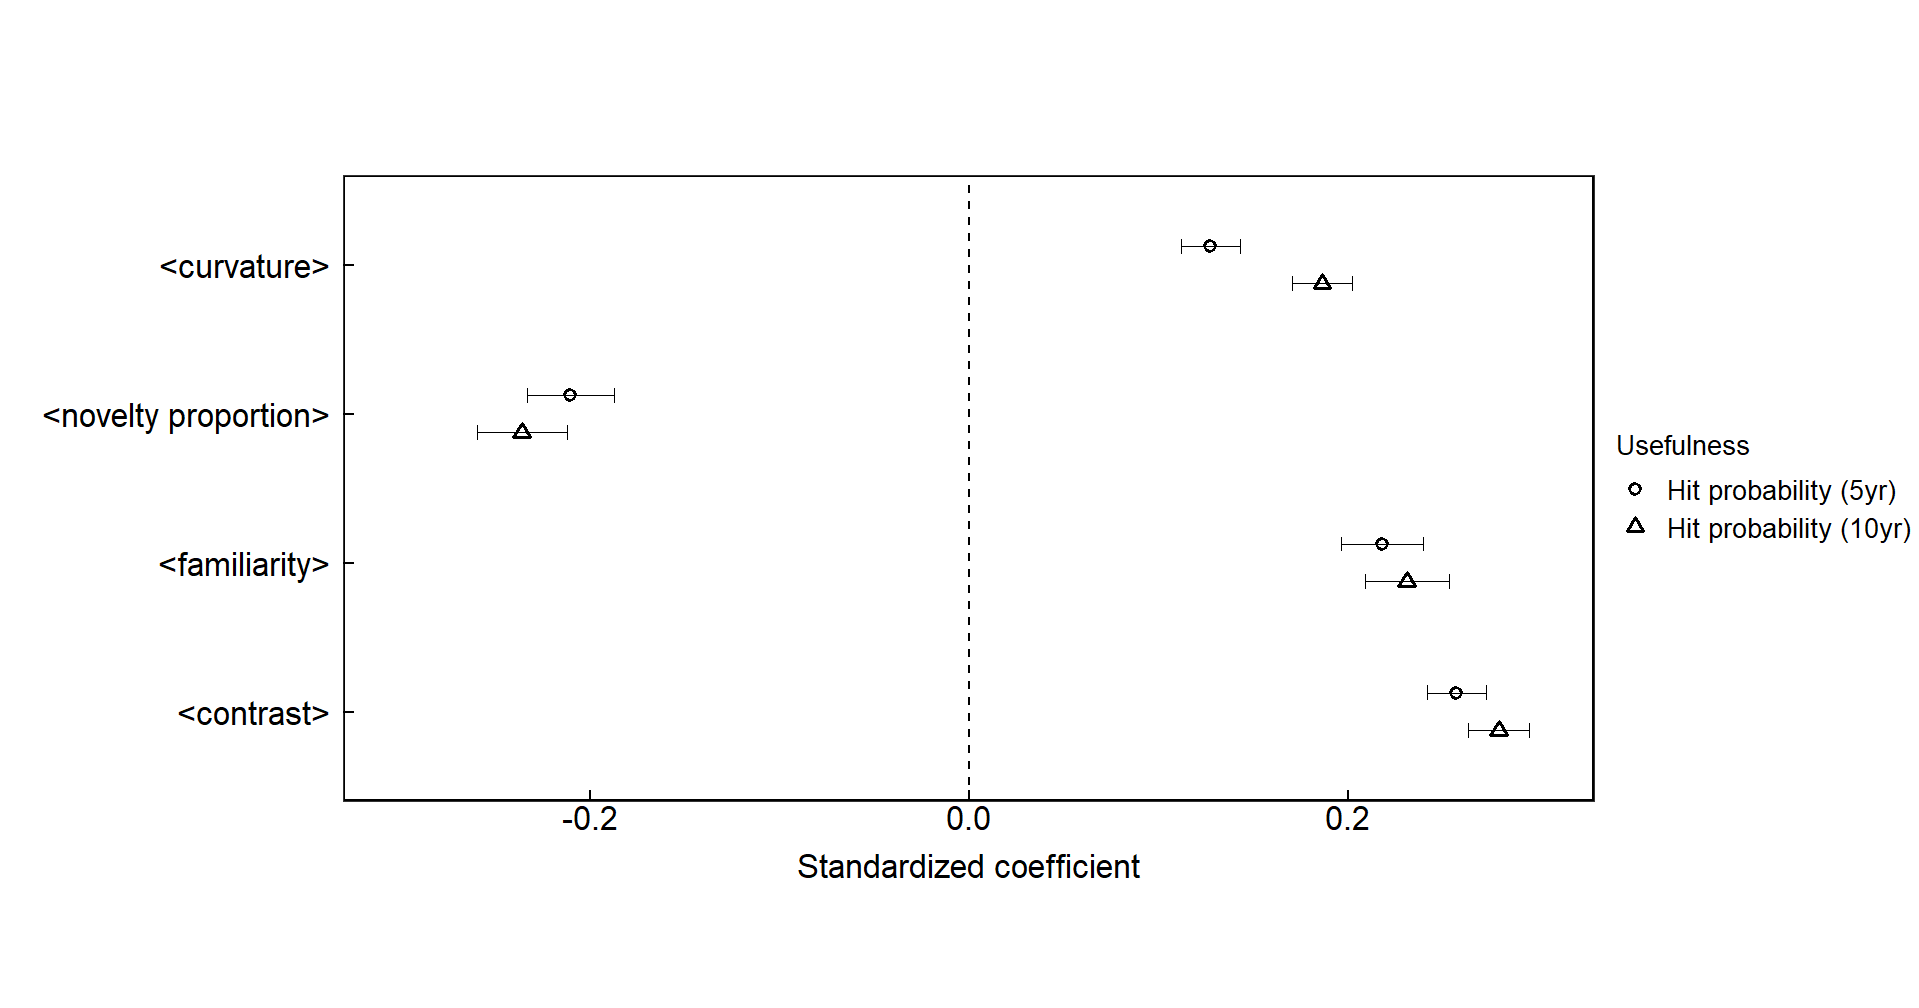
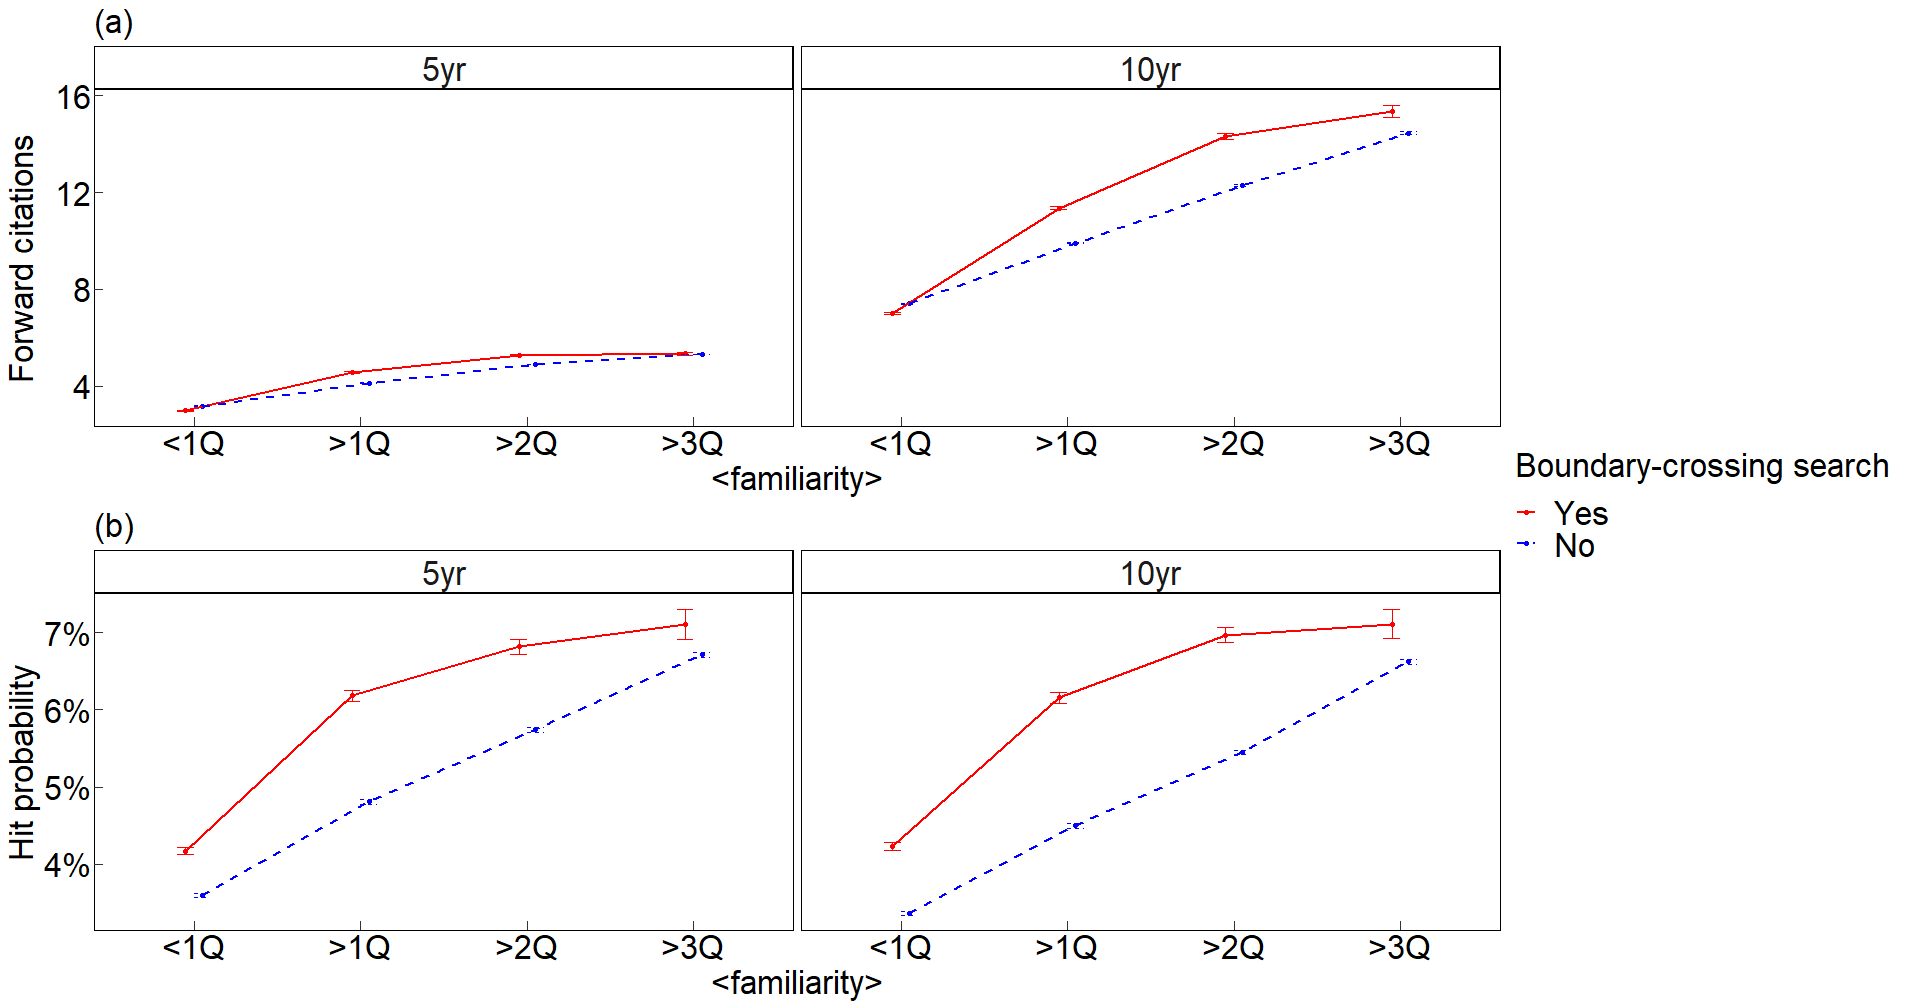
We found a positive correlation between the quantile group of curvature index average and the hit probability, as shown in Figures S2a and S2b. We also ran the binary logistic regression model to estimate the probability of a hit patent because it was coded as a dummy. Table S3 presents the regression results for predicting the variable. In Table S3, Model 1 presents the effects of the control variables on the probability of a hit patent within a five-year window. Our results in this model were consistent with what previous studies found: for example, there was a positive coefficient for the number of inventors (, ). Model 2 added the search-related explanatory variables, including the curvature index average. We found a positive coefficient for the curvature index average (, ), indicating that a one-unit increase in the curvature index average is associated with a 15% () increase in the odds of being a hit patent within a five-year window. In the same way, Models 3 and 4 were tested for the probability of a hit patent within a ten-year window, whose findings were reported as our main analysis results. The magnitude of the coefficients increased as the time window expanded. For example, in Model 4, the curvature index average has a positive coefficient (, ), which means that a one-unit increase in the ruggedness average changes a 23% () increase in the odds of being a hit patent within a ten-year window. Figures S2c and S2d display the impact of the curvature index average for predicting the hit patent probabilities for each time window. All results for Models 2 and 4 show positive relationships. Figure S3 shows the standardized coefficients for the search-related explanatory variables in predicting the probability of a hit patent within each time window based on the results for Models 2 and 4 in Table S3.
When testing the robustness check for predicting the number of forward citations, we employed the negative binomial regression model to appropriately estimate an over-dispersed parameter [77, 78]. The forward citations in our patent data exhibited overdispersion with a variance greater than the mean. The forward citations were a count variable of zero or a positive number. This is consistent with previous findings that patent citations are not normally distributed [79, 80]. Such a non-negative count variable violates the assumptions of linear regression models with biased coefficient estimates [78]. Poisson models are generally used to account for this problem. However, the Poisson distribution needs a prerequisite that the mean and variance should be equal. Following Fleming [31], we used the negative binomial model because the forward citations were over-dispersed and followed a negative binomial distribution.
Table S4 reports the results of regressions that predict the forward citations in the same manner as the regression models for the probability of a hit patent in Table S3. In Table S4, Model 1 included the control variables. Model 2 added the explanatory variables. We found that the curvature index average had a positive coefficient for the forward citations within a five-year window (, ). This means that for each one-unit increase in the curvature index average, the expected log count of forward citations within a five-year window increases by 0.062. We found that the magnitude of the coefficients increased for the forward citations within a ten-year window in Model 4 (, ). While the most powerful one of the search-related explanatory variables was the proportion of novelty, its effect magnitude decreased more in the longer-term citations, as shown in Model 2 (, ) and Model 4 (, ).
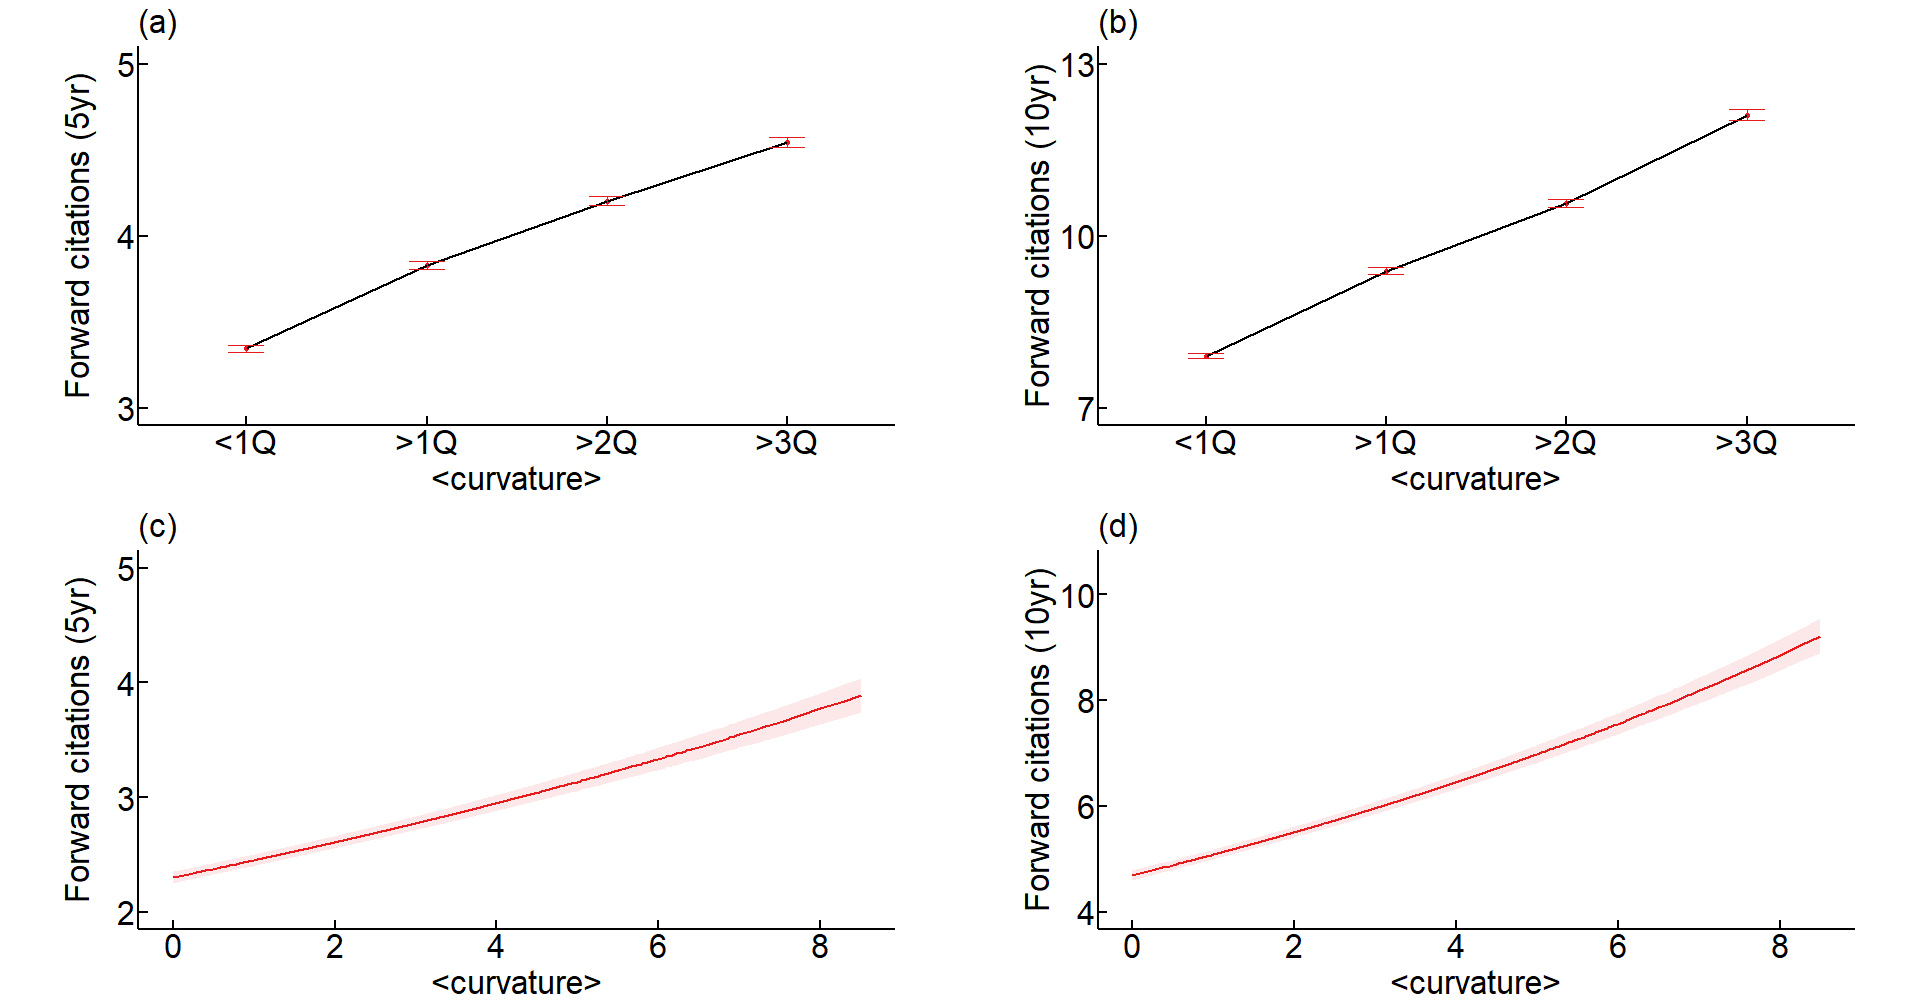
We plotted the effects of the curvature index average on the forward citations. Figures S4a and S4b show positive correlations between the quantile group of the curvature index average and the forward citations for each time window. Figures S4c and S4d also display positive relationships between the curvature index average and the predicted values of the forward citations for each time window based on the negative binomial regression in Models 2 and 4 in Table S4. Figure S5 shows the standardized coefficients for the search-related explanatory variables in predicting the number of forward citations within each time window based on the results for the same models mentioned above. All our findings of the curvature index impact were robust for the invention’s usefulness.
Curvature Index and the Invention’s Market Value
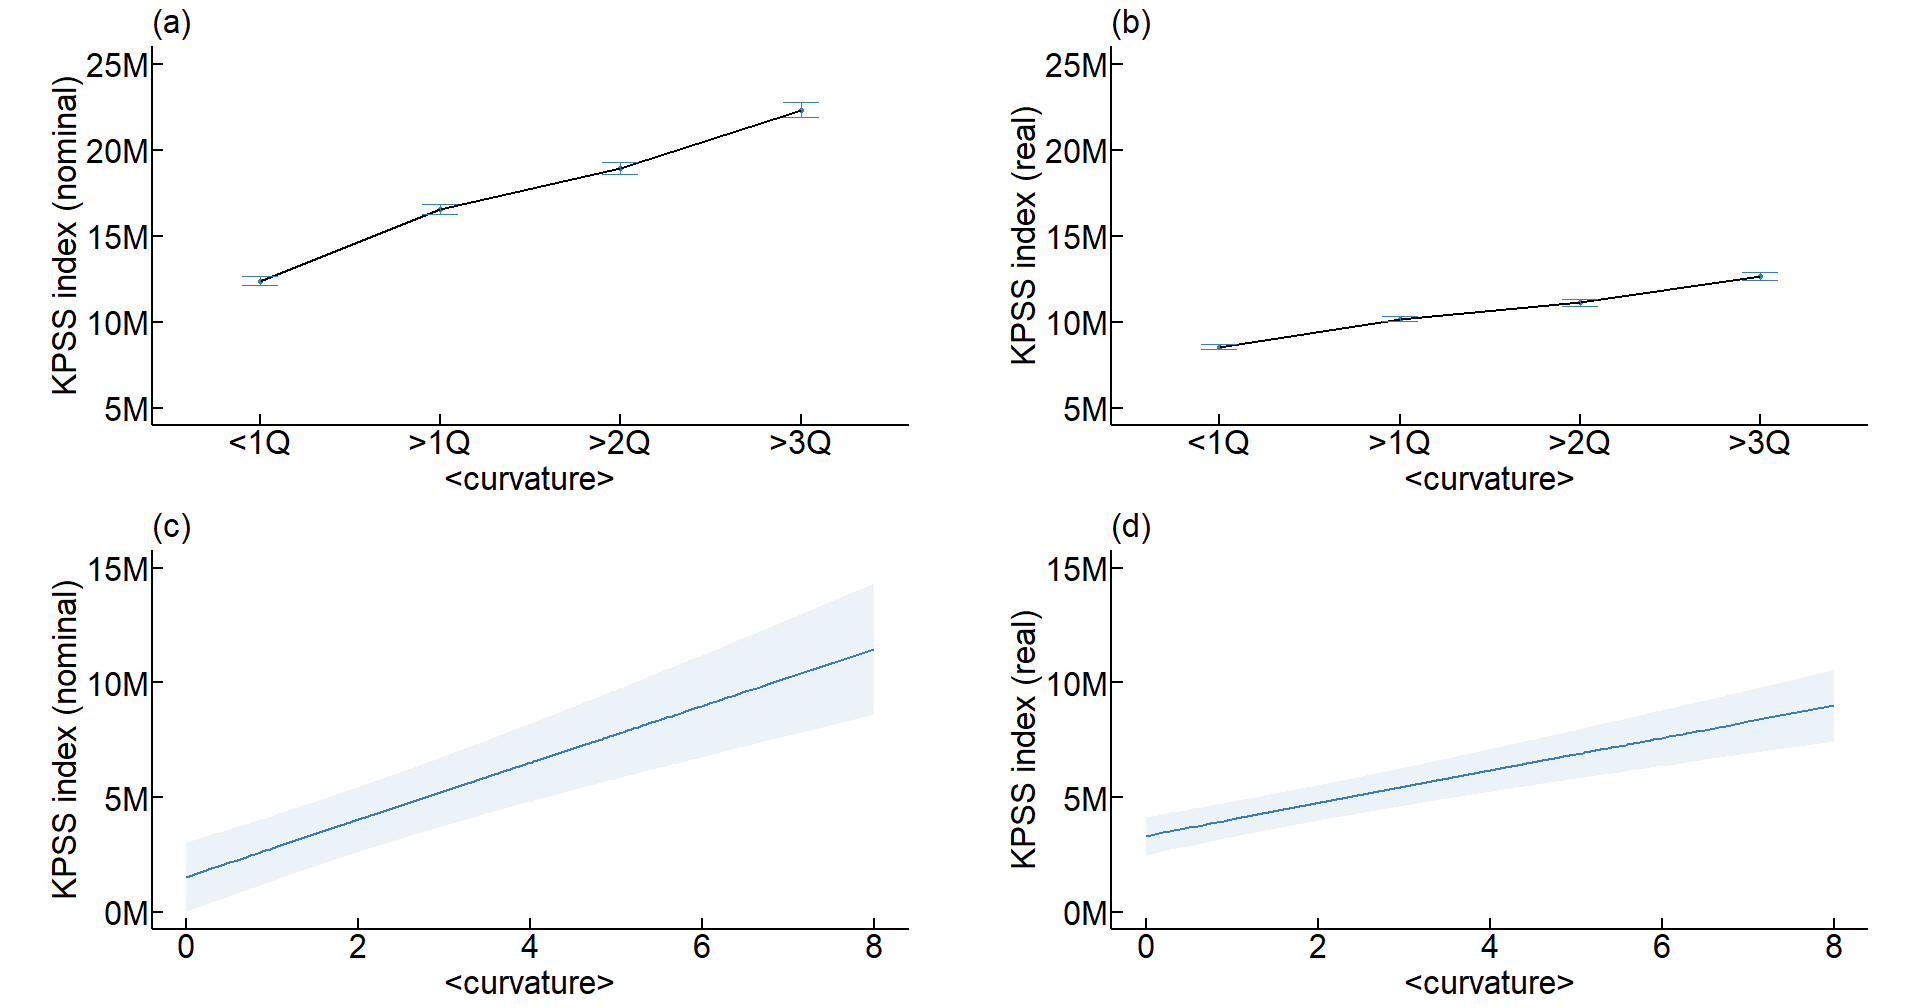
Among our sampled patents, 113,256 patents overlapped with data of Kogan et al. [35] were tested for our conjecture with the OLS regression models. We used two types of the KPSS indexes: one for the value of innovation in millions of nominal dollars and the other deflated to 1982 (million) dollars using the CPI. As shown in Table S5, the former index was predicted by Model 1 with control variables and Model 2 adding the explanatory variables. In the same manner, Models 3 and 4 estimated the latter index. All results are robust to both KPSS indices. The curvature index average had a positive effect on the KPSS index in nominal dollars (see Table S5 Model 2; , ), which indicates that the KPSS index in nominal dollars increases by 1.243 for every one unit increase in the curvature index average. Similarly, the relationship between the curvature index and the KPSS index in real dollars was positive (see Table S5 Model 4; , ), meaning that the KPSS index in real dollars increases by 0.711 for a one-unit increase in the curvature index average.
We plotted these findings regarding the impact of the curvature index average on the KPSS indexes. Figures S6a and S6b show positive correlations between the quantile group of the curvature index average and the KPSS indices in nominal and real dollars, respectively. Figures S6c and S6d exhibit that the curvature index average positively predicts both KPSS indices based on the OLS regression in Models 2 and 4 in Table S5. The curvature index average had a positive and significant coefficient, but other search-related explanatory variables, such as the ratio of new recombination and combination familiarity average, did not. Figure S7 displays the standardized coefficients for the search-related explanatory variables in predicting the KPSS indexes in the same models.
Curvature Index and the Invention’s Disruptiveness
We examined the relationship between the curvature index and the invention’s disruptiveness. Merging our sample and data provided by Funk and Owen-Smith [36], we used 360,537 patents to run the OLS regression models reported in Table S6. As the CD index is calculated based on the flow of citations, it differs by the time window of citations. We used the CD index within a five-year window and one calculated as of 2017, provided by Funk [57]. Table S6 represents the results of regressions that predict the CD indices. In Table S6, Models 1 and 2 estimate the CD index within a five-year window. The former model included the control variables. The latter model added the explanatory variables. We found a negative coefficient for the curvature index average in Model 2 (, ). The findings were robust for Models 3 and 4 in terms of the CD index as of 2017.
Figures S8a and S8b plot negative correlations between the quantile group of the curvature index average and both CD indices. Similarly, Figures S8c and S8d show negative relationships between the curvature index average and the predicted values of both CD indices based on the results for Models 2 and 4 in Table S6. Among the search-related study variables, the coefficient for the combination familiarity average held the same direction as that of the curvature index average. But, the proportion of novelty had a positive coefficient for both CD indexes (see Models 2 and 4 in Table S6; , ; , , respectively). Figure S9 plots the standardized coefficients for the search-related explanatory variables in predicting the CD indices in the same models.
The size of inventors in patents has been a longstanding inquiry, viewed as a crucial factor shaping innovation. For example, Wu et al. [81] found that a large team does not disrupt science and technology, though it produces highly cited research. In our initial findings, we observed a negative correlation between the inventor size and both CD indexes (with Pearson correlation coefficients of -0.065 for the CD index within a five-year window and -0.069 for the CD index as of 2017), aligning with the results of Wu et al. However, our subsequent analysis, as presented in Models 1 and 3 in Table S6, revealed a positive relationship between the inventor size and both CD indexes when accounting for control variables, such as the application year and the diversity of the inventor’s technological experiences. While these results may appear inconsistent with the findings of Wu et al. [81], they imply that the size of inventors may exert influence across various dimensions crucial to the inventive process. Wu et al. [81] proposed an explanation for why a large team does not disrupt science and technology: the necessity for consensus-building among a large number of members may incur additional costs for a large team. Considering the mixed findings our study has presented regarding the effects of inventor size, future research could delve into unpacking the underlying mechanisms mediating the relationship between size and disruption.
Curvature Index and Contrast
Our measurement employs a bottom-up approach to identify a domain characterized by a massive cluster, shaped by the intertwining of closely associated technologies. This cluster influences its surroundings, creating an environment conducive to successful innovation. We explain that the boundaries surrounding such a cluster signify a realm ripe for innovation. When a novel idea appears close to these boundaries, its technological uncertainties diminish, leveraging the well-established knowledge within the massive cluster.
Conversely, conventional approaches often arise from a top-down categorization system in the hierarchical taxonomy and classification, such as nanotechnologies under the USPC code 977. If a category includes more subordinate technologies not belonging to it, it is more distinct from other categories. Such a high-contrast category offers prominent information, capturing inventors’ attention and influencing invention values. This categorization also affects shaping the search for new inventive opportunities and subsequently impacts invention values.
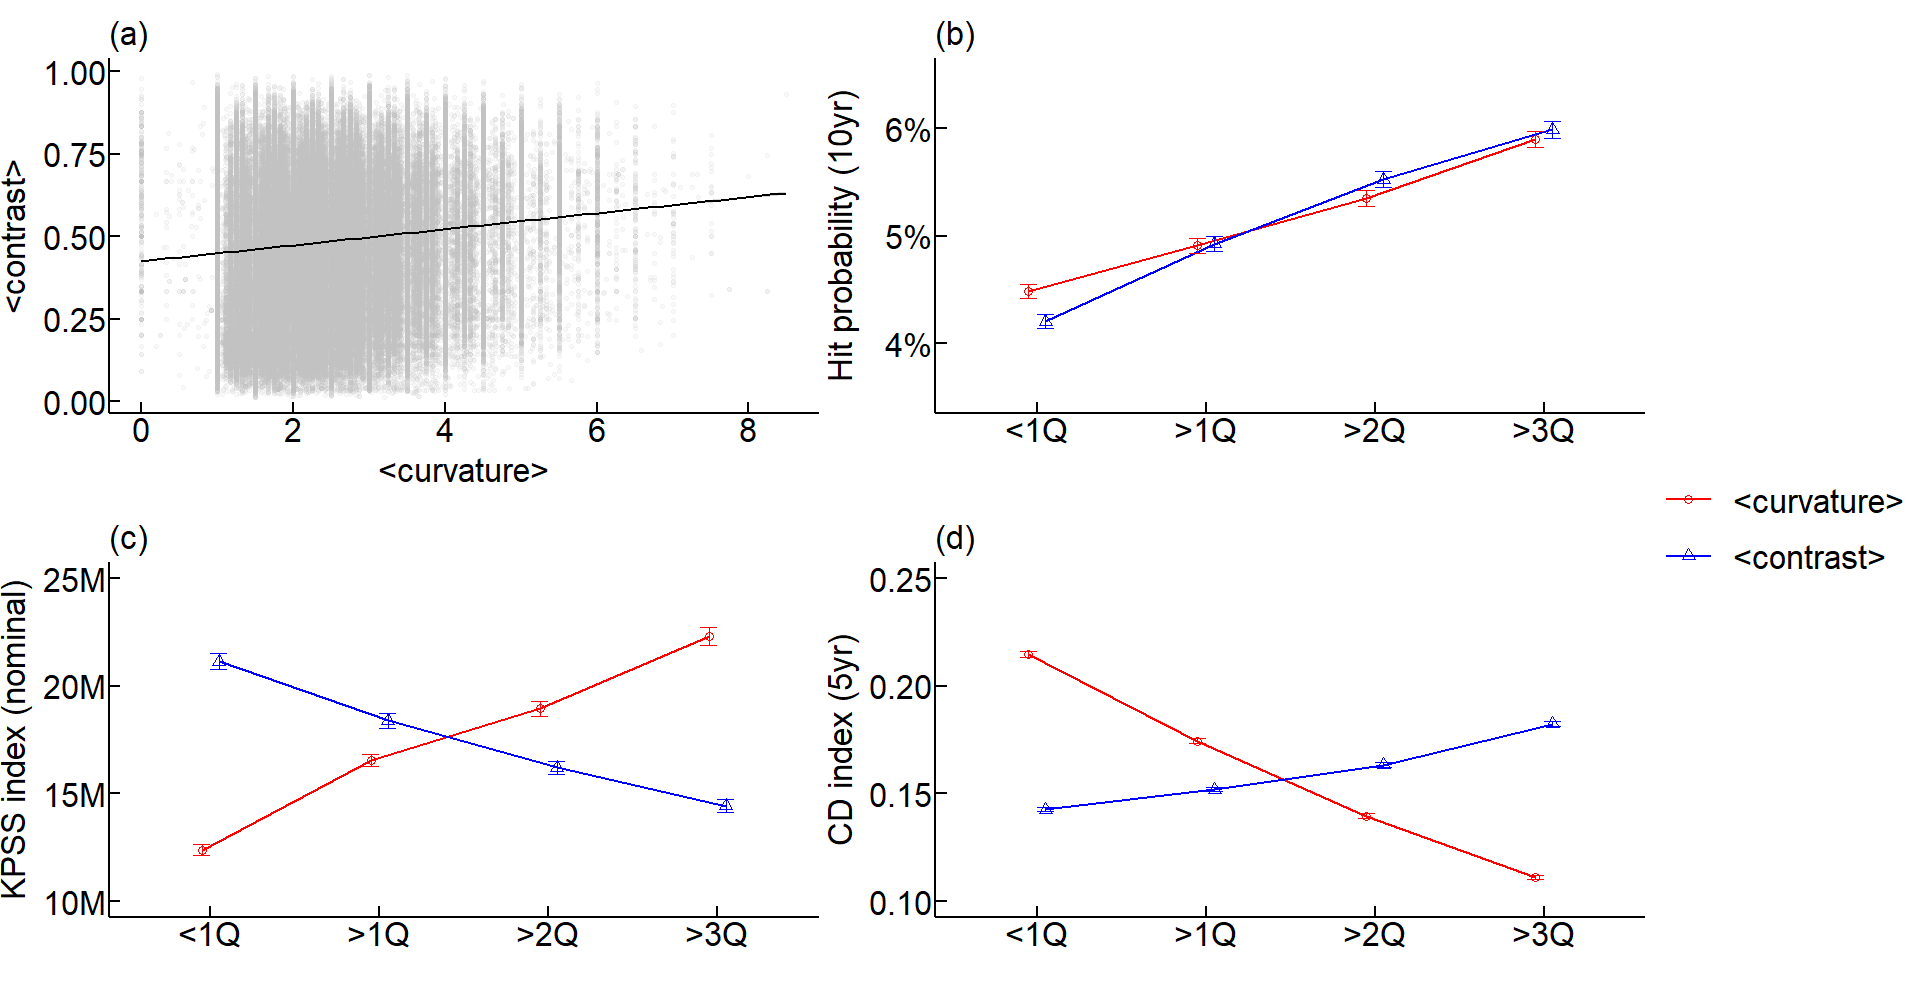
We compared the curvature index and the contrast, representing bottom-up and top-down perspectives, respectively. Despite a positive correlation between these measures, as shown in Figure S10a, it turned out that these measures showed different results in terms of value creation and capture. We categorized these measures into four groups based on quantiles, finding a positive relationship with hit probability (see Fig. S10b) but opposite relationships with the KPSS and CD indexes. Figs. S10c and S10d show that our measure positively correlates with the KPSS index but negatively with the CD index, while the contrast exhibits an inverse relationship with these two indexes.
These findings suggest that high-contrast codes are commonly perceived as conventional in the market, even though they can create substantial value through citation impact and disruption. On the contrary, an invention with a high curvature index correlates with heightened profitability and practical use, even without disruptive effects on technological progress.
Descriptive Analyses on the Inventive Process
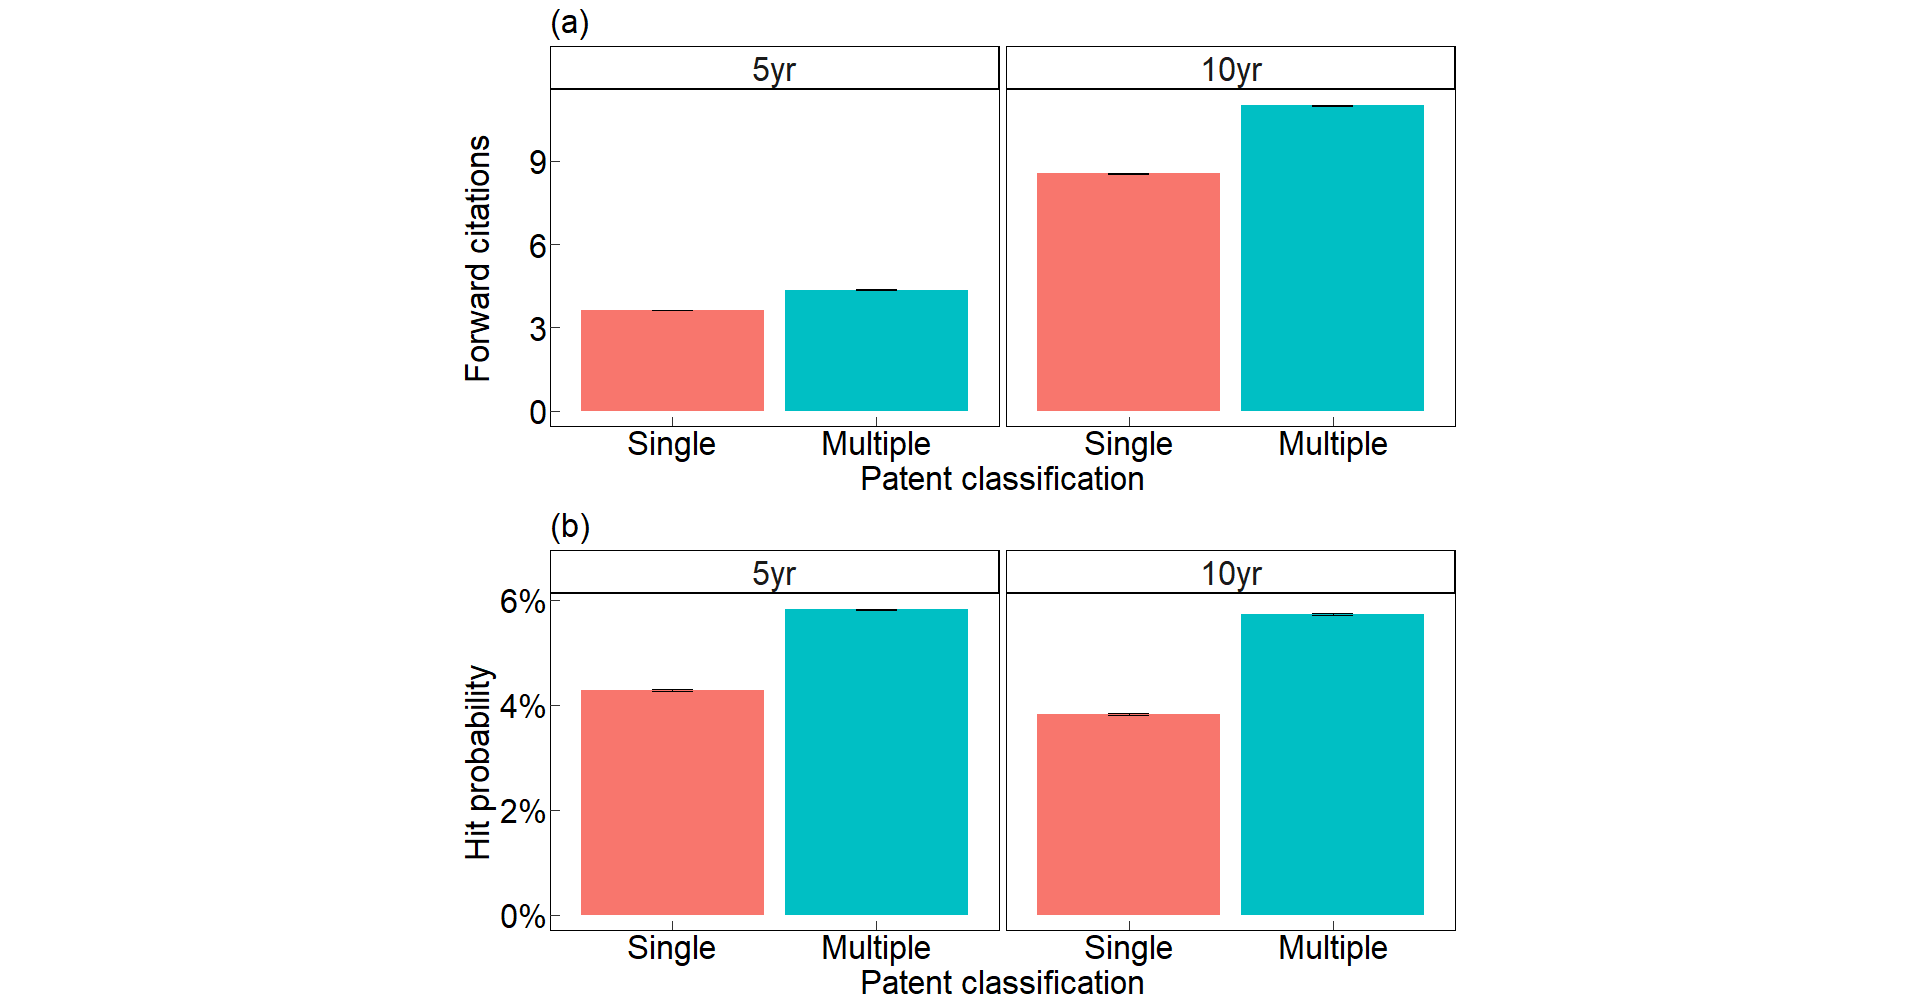
Additionally, we conducted further descriptive analyses to deepen our contextual understanding of the invention process. These additional findings reinforced the following three assumptions in our study. First, the combinatorial process is prone to produce better outcomes than the monotonic process. We found that USPTO-patented inventions with multiple technology codes were more useful than those with only one code (see Figure S12). Second, the boundary-spanning search can elevate the value of local search. We found that inventions with the boundary-spanning search were more useful than those without it for each quantile group of the combination familiarity average (see Figure S13). The explorative experiment contains uncertainty, whether it brings success or failure, but it discovers a peak of opportunity that can lead to breakthroughs with which to solve technological problems [55, 67, 82]. It can complement the lack of local search that reuses already-known combinations.
| Mean | SD | Min | Max | |
|---|---|---|---|---|
| Hit probability (5yr) | 0.05 | 0.23 | 0.00 | 1.00 |
| Hit probability (10yr) | 0.05 | 0.22 | 0.00 | 1.00 |
| Forward citations (5yr) | 3.98 | 7.65 | 0.00 | 518.00 |
| Forward citations (10yr) | 9.99 | 21.66 | 0.00 | 1514.00 |
| KPSS index (nominal) a | 17.56 | 55.46 | 0.00 | 4242.41 |
| KPSS index (real) a | 10.63 | 30.07 | 0.00 | 2379.65 |
| CD index (5yr) b | 0.16 | 0.33 | -1.00 | 1.00 |
| CD index (as of 2017) b | 0.18 | 0.32 | -1.00 | 1.00 |
| Inventor size | 2.18 | 1.61 | 1.00 | 32.00 |
| Technological experience (ln) | 1.90 | 1.54 | 0.00 | 7.41 |
| # patent references (ln) | 2.18 | 0.85 | 0.00 | 7.52 |
| Non-patent references | 0.31 | 0.46 | 0.00 | 1.00 |
| # CPC subclass | 3.24 | 1.43 | 1.00 | 29.00 |
| # CPC main group | 5.19 | 3.16 | 2.00 | 80.00 |
| New CPC main group | 0.00 | 0.06 | 0.00 | 1.00 |
| contrast | 0.48 | 0.19 | 0.01 | 0.99 |
| familiarity | 2.91 | 1.71 | 0.00 | 9.64 |
| novelty proportion | 0.38 | 0.30 | 0.00 | 1.00 |
| curvature | 2.31 | 0.91 | 0.00 | 8.50 |
-
Note: The number of our sampled patents was 388,345.
a = 113,256 as a subset of our sampled patents.
b = 360,537 as a subset of our sampled patents.
| Inventor size | ||||||||||
|---|---|---|---|---|---|---|---|---|---|---|
| Technological experience (ln) | ||||||||||
| # patent references (ln) | ||||||||||
| Non-patent references | ||||||||||
| # CPC subclass | ||||||||||
| # CPC main group | ||||||||||
| New CPC main group | ||||||||||
| contrast | ||||||||||
| familiarity | ||||||||||
| novelty proportion | ||||||||||
| curvature |
-
Note: The number of our sampled patents was 388,345. The application year dummy variables were omitted.
†p0.10; ∗p0.05; ∗∗p0.01; ∗∗∗p0.001
| Hit patent prob. (5yr) | Hit patent prob. (10yr) | |||
| Model 1 | Model 2 | Model 3 | Model 4 | |
| Constant | ||||
| Inventor size | ||||
| Technological experience (ln) | ||||
| # patent references (ln) | ||||
| Non-patent references | ||||
| # CPC subclass | ||||
| # CPC main group | ||||
| New CPC main group | ||||
| contrast | ||||
| familiarity | ||||
| novelty proportion | ||||
| curvature | ||||
| Application Year | ||||
| McFadden’s pseudo | ||||
| Observations | 388,345 | 388,345 | 388,345 | 388,345 |
| Akaike Inf. Crit. | 151,838.0 | 149,519.0 | 146,541.8 | 143,722.4 |
-
Note: The binary logistic regression model was used to estimate the probability of a hit patent.
†p0.10; ∗p0.05; ∗∗p0.01; ∗∗∗p0.001
| Forward citations (5yr) | Forward citations (10yr) | |||
| Model 1 | Model 2 | Model 3 | Model 4 | |
| Constant | ||||
| Inventor size | ||||
| Technological experience (ln) | ||||
| # patent references (ln) | ||||
| Non-patent references | ||||
| # CPC subclass | ||||
| # CPC main group | ||||
| New CPC main group | ||||
| contrast | ||||
| familiarity | ||||
| proportion of novetly | ||||
| curvature | ||||
| Application Year | ||||
| McFadden’s pseudo | ||||
| Observations | 388,345 | 388,345 | 388,345 | 388,345 |
| Akaike Inf. Crit. | 1,849,409 | 1,842,371 | 2,475,382 | 2,465,918 |
-
Note: The negative binomial regression model was used to estimate the number of forward citations.
†p0.10; ∗p0.05; ∗∗p0.01; ∗∗∗p0.001
| KPSS index (nominal) | KPSS index (real) | |||
| Model 1 | Model 2 | Model 3 | Model 4 | |
| Constant | ||||
| Inventor size | ||||
| Technological experience (ln) | ||||
| # patent references (ln) | ||||
| Non-patent references | ||||
| # CPC subclass | ||||
| # CPC main group | ||||
| New CPC main group | ||||
| contrast | ||||
| familiarity | ||||
| novelty proportion | ||||
| curvature | ||||
| Application Year | ||||
| Observations | 113,256 | 113,256 | 113,256 | 113,256 |
| 0.059 | 0.060 | 0.046 | 0.046 | |
| Adjusted | 0.059 | 0.060 | 0.045 | 0.046 |
| F Statistic | 174.139∗∗∗ | 160.943∗∗∗ | 132.204∗∗∗ | 122.676∗∗∗ |
-
Note: The OLS regression model was used to estimate the KPSS index.
†p0.10; ∗p0.05; ∗∗p0.01; ∗∗∗p0.001
| CD index (5yr) | CD index (as of 2017) | |||
| Model 1 | Model 2 | Model 3 | Model 4 | |
| Constant | ||||
| Inventor size | ||||
| Technological experience (ln) | ||||
| # patent references (ln) | ||||
| Non-patent references | ||||
| # CPC subclass | ||||
| # CPC main group | ||||
| New CPC main group | ||||
| contrast | ||||
| familiarity | ||||
| novelty proportion | ||||
| curvature | ||||
| Application Year | ||||
| Observations | 360,537 | 360,537 | 360,537 | 360,537 |
| 0.287 | 0.287 | 0.362 | 0.363 | |
| Adjusted | 0.287 | 0.287 | 0.362 | 0.362 |
| F Statistic | 3,535.313∗∗∗ | 3,225.731∗∗∗ | 4,994.515∗∗∗ | 4,556.776∗∗∗ |
-
Note: The OLS regression model was used to estimate the CD index.
†p0.10; ∗p0.05; ∗∗p0.01; ∗∗∗p0.001
References
- [1] Jenkins, R. Categorization: identity, social process and epistemology. Current Sociology 48, 7–25 (2000).
- [2] Hannan, M. T., Pólos, L. & Carroll, G. R. Logics of Organization Theory: Audiences, Codes, and Ecologies (Princeton University Press, 2012).
- [3] Sapolsky, R. M. Behave: The Biology Of Humans At Our Best And Worst (Penguin, 2017).
- [4] Hidalgo, C. A. Economic complexity theory and applications. Nature Reviews Physics 3, 92–113 (2021).
- [5] Mitchell, M. Complexity : a guided tour (Oxford University Press, Oxford [England] ;, 2009).
- [6] Jung, H. J. & Lee, J. J. The impacts of science and technology policy interventions on university research: Evidence from the U.S. National Nanotechnology Initiative. Research Policy 43, 74–91 (2014).
- [7] Jung, H. J. & Lee, J. J. The quest for originality: A new typology of knowledge search and breakthrough inventions. Academy of Management Journal 59, 1725–1753 (2016).
- [8] Kovács, B., Carnabuci, G. & Wezel, F. C. Categories, attention, and the impact of inventions. Strategic Management Journal 42, 992–1023 (2021).
- [9] Carnabuci, G., Operti, E. & Kovács, B. The categorical imperative and structural reproduction: Dynamics of technological entry in the semiconductor industry. Organization Science 26, 1734–1751 (2015).
- [10] Ahmadpoor, M. & Jones, B. F. The dual frontier: Patented inventions and prior scientific advance. Science 357, 583–587 (2017).
- [11] Park, J., Frank, M. R., Sun, L. & Youn, H. Industrial topics in urban labor system. arXiv preprint arXiv:2009.09799 (2020).
- [12] Andrews, M. J., Chatterji, A. K., Lerner, J. & Stern, S. The Role of Innovation and Entrepreneurship in Economic Growth. National Bureau of Economic Research Conference Report (University of Chicago Press, 2022).
- [13] Painter, D. T., Daniels, B. C. & Laubichler, M. D. Innovations are disproportionately likely in the periphery of a scientific network. Theory in Biosciences 140, 391–399 (2021).
- [14] Rosenkopf, L. & Nerker, A. Beyond local search: Boundary-spanning, exploration, and impact in the optical disk industry. Strategic Management Journal 22, 287–306 (2001).
- [15] Youn, H. et al. Scaling and universality in urban economic diversification. Journal of The Royal Society Interface 13, 20150937 (2016).
- [16] Youn, H. How Does Innovation Push Its Boundaries? In Thurner, S. (ed.) 43 Visions for Complexity, 85–86 (World Scientific, 2017).
- [17] Kuhn, T. S. The essential tension: Tradition and innovation in scientific research. In Taylor, C. W. & Barron, F. (eds.) Scientific creativity: Its recognition and development, 341–354 (Wiley, New York, 1963).
- [18] Amabile, T. M. The social psychology of creativity: A componential conceptualization. Journal of Personality and Social Psychology 45, 357–376 (1983).
- [19] Ward, T. B. Structured imagination: The role of category structure in exemplar generation. Cognitive Psychology 27, 1–40 (1994).
- [20] Arthur, W. B. The Nature of Technology: What It is and How It Evolves (Free Press, New York, 2009).
- [21] Baldwin, C. Y. & Clark, K. B. Design Rules: The Power of Modularity (MIT Press, Cambridge, MA, 2000).
- [22] Delgado, M., Porter, M. E. & Stern, S. Defining clusters of related industries. Journal of Economic Geography 16, 1–38 (2015).
- [23] Delgado, M., Porter, M. E. & Stern, S. Clusters, convergence, and economic performance. Research Policy 43, 1785–1799 (2014).
- [24] Hosseinioun, M., Neffke, F., Letian, Zhang & Youn, H. Nested skills in labor ecosystems: A hidden dimension of human capital. arXiv preprint arXiv:2303.15629 (2023).
- [25] Guilbeault, D., Baronchelli, A. & Centola, D. Experimental evidence for scale-induced category convergence across populations. Nature Communications 12, 327 (2021).
- [26] Kauffman, S. The Origins of Order (Oxford University Press, New York, 1993).
- [27] Kauffman, S., Lobo, J. & Macready, W. G. Optimal search on a technology landscape. Journal of Economic Behavior and Organization 43, 141–166 (2000).
- [28] Uzzi, B., Mukherjee, S., Stringer, M. & Jones, B. Atypical combinations and scientific impact. Science 342, 468–472 (2013).
- [29] Miller, J. H. A Crude Look at the Whole The Science of Complex Systems in Business, Life, and Society (Basic Books, 2016).
- [30] Rosvall, M. & Bergstrom, C. T. Maps of random walks on complex networks reveal community structure. Proceedings of the National Academy of Sciences of the United States of America 105, 1118–1123 (2008).
- [31] Fleming, L. Recombinant uncertainty in technological search. Management Science 47, 117–132 (2001).
- [32] Tria, F., Loreto, V., Servedio, V. D. & Strogatz, S. H. The dynamics of correlated novelties. Scientific Reports 4, 5890 (2014).
- [33] Cui, X.-M. et al. Dynamic burstiness of word-occurrence and network modularity in textbook systems. Physica A: Statistical Mechanics and its Applications 487, 103–110 (2017).
- [34] Hargadon, A. B. & Douglas, Y. When innovations meet institutions: Edison and the design of the electric light. Administrative Science Quarterly 46, 476–501 (2001).
- [35] Kogan, L., Papanikolaou, D., Seru, A. & Stoffman, N. Technological innovation, resource allocation, and growth. Quarterly Journal of Economics 132, 665–712 (2017).
- [36] Funk, R. J. & Owen-Smith, J. A dynamic network measure of technological change. Management Science 63, 791–817 (2017).
- [37] Arts, S. & Veugelers, R. Technology familiarity, recombinant novelty, and breakthrough invention. Industrial and Corporate Change 24, 1215–1246 (2015).
- [38] Utterback, J. M. The Process of Technological Innovation Within the Firm. Academy of Management Journal 14, 75–88 (1971).
- [39] Klepper, S. Industry life cycles. Industrial and Corporate Change 6, 145–181 (1997).
- [40] Simonton, D. K. Creativity in Science: Chance, Logic, Genius, and Zeitgeist (Cambridge University Press, Cambridge, 2004).
- [41] Vicinanza, P., Goldberg, A. & Srivastava, S. B. A deep-learning model of prescient ideas demonstrates that they emerge from the periphery. PNAS Nexus 2, pgac275 (2022).
- [42] Fink, T. M. A. & Teimouri, A. The mathematical structure of innovation. arXiv preprint arXiv:1912.03281 (2019).
- [43] Shi, F. & Evans, J. Surprising combinations of research contents and contexts are related to impact and emerge with scientific outsiders from distant disciplines. Nature Communications 14, 1641 (2023).
- [44] Kuhn, T. S. The Structure of Scientific Revolutions (University of Chicago Press, Chicago, 1962).
- [45] Kahneman, D. Thinking, Fast and Slow (Farrar, Straus and Giroux, 2013).
- [46] Ferguson, J. P. & Carnabuci, G. Risky recombinations: Institutional gatekeeping in the innovation process. Organization Science 28, 133–151 (2017).
- [47] Wang, D. J., Rao, H. & Soule, S. A. Crossing Categorical Boundaries: A Study of Diversification by Social Movement Organizations. American Sociological Review 84, 420–458 (2019).
- [48] Conot, R. E. A Streak of Luck: The Life and Legend of Thomas Alva Edison (Seaview Books, New York, 1979).
- [49] Iacopini, I., Milojević, S. & Latora, V. Network dynamics of innovation processes. Physical Review Letters 120, 1–6 (2018).
- [50] Liu, L. et al. Hot streaks in artistic, cultural, and scientific careers. Nature 559 (2018).
- [51] McNerney, J., Doyne Farmer, J., Redner, S. & Trancik, J. E. Role of design complexity in technology improvement. Proceedings of the National Academy of Sciences of the United States of America 108, 9008–9013 (2011).
- [52] Simon, H. A. The architecture of complexity. Proceedings of the American Philosophical Society 106, 467–482 (1962).
- [53] Coleman, J. S. Social capital in the creation of human capital. American Journal of Sociology 94, S95–S120 (1988).
- [54] Granovetter, M. S. Economic action and social structure: The problem of embeddedness. American Journal of Sociology 91, 481–510 (1985).
- [55] March, J. G. Exploration and exploitation in organizational learning. Organization Science 2, 71–87 (1991).
- [56] Kim, D., Cerigo, D., Jeong, H. & Youn, H. Technological novelty profile and invention’s future impact. EPJ Data Sci. 6 (2016).
- [57] Funk, R. J. Pre-computed index values for U.S. patents (2019). Accessed on July 25, 2023. http://russellfunk.org/cdindex/data.html.
- [58] Mikolov, T., Sutskever, I., Chen, K., Corrado, G. & Dean, J. Distributed representations of words and phrases and their compositionality. arXiv preprint arXiv:1310.4546 (2013).
- [59] Tacchella, A., Napoletano, A. & Pietronero, L. The language of innovation. PLoS ONE 15, e0230107 (2020).
- [60] Murray, D. et al. Unsupervised embedding of trajectories captures the latent structure of mobility. arXiv preprint arXiv:2012.02785 (2020).
- [61] Levinthal, D. A. Adaptation on rugged landscapes. Management Science 43, 934–950 (1997).
- [62] Fleming, L. & Sorenson, O. Technology as a complex adaptive system: Evidence from patent data. Research Policy 30, 1019–1039 (2001).
- [63] Fleming, L. & Sorenson, O. Science as a map in technological search. Strategic Management Journal 25, 909–928 (2004).
- [64] Ganco, M. NK model as a representation of innovative search. Research Policy 46, 1783–1800 (2017).
- [65] Milgram, S. The small-world problem. Psychology Today 2, 60–67 (1967).
- [66] Watts, D. J. & Strogatz, S. H. Collective dynamics of ’small-world’ networks. Nature 393, 440–442 (1998).
- [67] Kneeland, M. K., Schilling, M. A. & Aharonson, B. S. Exploring uncharted territory: Knowledge search processes in the origination of outlier innovation. Organization Science 31, 535–557 (2020).
- [68] Dijkstra, E. W. A note on two problems in connexion with graphs. Numerishe Mathematik 1, 269–271 (1959).
- [69] Ahuja, G. & Lampert, C. M. Entrepreneurship in the large corporation: A longitudinal study of how established firms create breakthrough inventions. Strategic Management Journal 22, 521–543 (2001).
- [70] Albert, M. B., Avery, D., Narin, F. & McAllister, P. Direct validation of citation counts as indicators of industrially important patents. Research Policy 20, 251–259 (1991).
- [71] Trajtenberg, M. A penny for your quotes: Patent citations and the value of innovations. The RAND Journal of Economics 21, 172–187 (1990).
- [72] Breitzman, A. & Thomas, P. Inventor team size as a predictor of the future citation impact of patents. Scientometrics 103, 631–647 (2015).
- [73] Harhoff, D., Scherer, F. M. & Vopel, K. Citations, family size, opposition and the value of patent rights. Research Policy 32, 1343–1363 (2003).
- [74] Lerner, J. The importance of patent scope: an empirical analysis. The RAND Journal of Economics 25, 319–333 (1994).
- [75] Fox, J. & Monette, G. Generalized collinearity diagnostics. Journal of the American Statistical Association 87, 178–183 (1992).
- [76] Hair, J. F., Babin, B. J., Anderson, R. E. & Black, W. C. Multivariate Data Analysis (Cengage Learning EMEA, Hampshire, United Kingdom, 2018), 8th edn.
- [77] Hilbe, J. M. Negative Binomial Regression (Cambridge University Press, New York, NY, 2007).
- [78] Long, J. S. Regression Models for Categorical and Limited Dependent Variables (Sage, London, U.K, 1997).
- [79] Katz, J. S. What is a complex innovation system? PLoS ONE 11, e0156150 (2016).
- [80] O’Neale, D. R. & Hendy, S. C. Power Law Distributions of Patents as Indicators of Innovation. PLoS ONE 7, e49501 (2012).
- [81] Wu, L., Wang, D. & Evans, J. A. Large teams develop and small teams disrupt science and technology. Nature 566, 378–382 (2019).
- [82] Schilling, M. A. A ”small-world” network model of cognitive insight. Creativity Research Journal 17, 131–154 (2005).