Emission Redshift in DCM2-Doped Alq3 Caused by Non-Linear Stark Shifts and Förster-Mediated Exciton Diffusion
Abstract
Organic light-emitting diodes (OLEDs) devices in the archetype small molecule fluorescent guest-host system tris(8-hydroxyquinolinato) aluminum (Alq3) doped with 4-(dicyanomethylene)-2-methyl-6-julolidyl-9-enyl-4H-pyran (DCM2) displays a redshift in light-emission frequency which is extremely sensitive to the dopant concentration. This effect can be used to tune the emission frequency in this particular class of OLEDs. In this work, a model is proposed to describe this effect using a combination of density functional theory (DFT) quantum-chemical calculations and stochastic simulations of exciton diffusion via a Förster mechanism. The results show that the permanent dipole moments of the Alq3 molecules generate random electric fields that are large enough to cause a non-linear Stark shift in the band gap of neighboring DCM2 molecules. As a consequence of these non-linear shifts, a non-Gaussian probability distribution of highest-occupied molecular orbital to lowest-unoccupied molecular orbital (HOMO-LUMO) gaps for the DCM2 molecules in the Alq3 matrix is observed, with long exponential tails to the low-energy side. Surprisingly, this probability distribution of DCM2 HOMO-LUMO gaps is virtually independent of DCM2 concentration into Alq3 matrix, at least up to a fraction of 10%. This study shows that this distribution of gaps, combined with out-of-equilibrium exciton diffusion among DCM2 molecules, are sufficient to explain the experimentally observed emission redshift.
I Introduction
Organic light emitting diodes (OLEDs) are a relatively new class of devices already used for display technologies brad+93sm ; sheats+96 (TV, computer, cell phones, palmtop computer screens etc.)(ma2019, ; nuesch2005, ; soman2020, ) and other applications as illumination sourcekamte+10am , lasersbulovic1998weak ; vcehovski2020 ; zhang2011existence and medical devices chin2005medical . The great interest in this technology is related to the low cost of organic materials, simplicity of organic thin film growth, ease of integrability with conventional technology, versatility of carbon chemistry, among other advantages. However, this technology has some drawbacks, as the device lifetime still needs to be improved and OLEDs show generally a broad electroluminescent (EL) resulting in unsaturated emission colors.
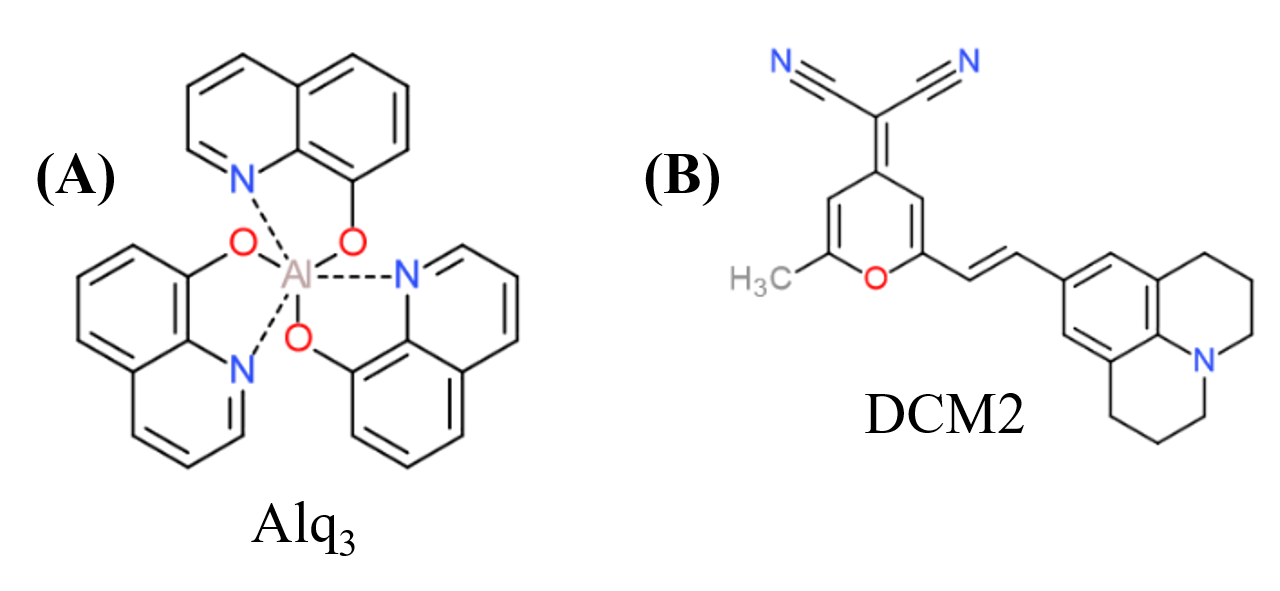
In order to overcome the latter problem, Bulović et al.bulovic+98cpl ; madi+03prl developed OLED devices by doping a ”host” material aluminum tris(8-hydroxy quinoline) (Alq3) (Fig. 1 (A)) with ”guest” molecules [2-methyl-6-[2-(2,3,6,7-tetrahydro-1H, 5H-benzo [i,j] quinolizin-9-yl)-ethenyl]-4H-pyran-4-ylidene] propane-dinitrile (DCM2) (Fig. 1(B)), hereafter referred to as Alq3:DCM2. In these devices, excitons are generated in the Alq3 molecules and efficiently transferred by Förster resonance energy transfer (FRET)forster+48ap ; medi+2014 ; vcehovski2020 to the DCM2 molecules. Moreover, these devices show saturated color emissioncheon2004electroluminescence , and the color can vary from yellow to red as the concentration of guest (DCM2) molecules is increased from 1% to 10%. This redshift amounts to roughly 50 nm, with a relatively unchanged peak width over this range of dopingbulovic+98cpl ; madi+03prl ; bulovic1998weak . Due to its interesting properties and numerous applications in the area of organic thin films, the Alq3:DCM2 system is still a relevant topic which draws the attention of the scientific communityvcehovski2020 ; liu2014temperature ; becker2017 .
Previous works suggested that the spectral shift was due to excimer formation tang+89jap ; madi+03prl or hydrogen bonds in solutionkali+94cp . Bulović et al. bulovic+98cpl ; madi+03prl challenged these interpretations, because excimer formation would not result in a rigid and continuous shift of the electroluminescence (EL) spectrum. In addition, hydrogen bonds with DCM2 molecules are not possible in solutionbulovic+98cpl ; madi+03prl . The similarity of the spectral widths, and magnitudes of the peak shifts of the spectra both in solution and in thin films suggested Bulović et al.bulovic+98cpl ; madi+03prl to attribute the redshift in energy due to the polarization induced by DCM2 molecules. In their own words: ”as the DCM2 concentration in the relatively non-polar Alq3 is increased, the distance between nearest neighbor, highly polar, DCM2 molecules decreases, thereby increasing the local polarization field. This polarization tends to redshift the DCM2 emission spectrum.” bulovic+98cpl ; madi+03prl
In a series of articlesbulovic+98cpl ; bulovic+99cpl ; madi+03prl , Bulović and collaborators called this solid-state solvation effect (SSSE), in analogy to the ”solvation effect” of organic dyes in liquid solutions, which is observed when the dye absorption and emission spectra are influenced by dipole moment of the surrounding solvent moleculesreichardt2011solvents . The ”solvation effect” results from inter-molecular solute-solvent interaction forces such as dipole-dipole or dipole-induced dipole (these interactions tend to alter the energy difference between the ground and excited state of the solute). The SSSE effect has been used for tuning the luminescent emission spectrum of dipolar molecules by adjusting the strength of intermolecular dipole-dipole interactions using a doped guest-host molecular organic thin film systembulovic+99cpl ; madi+03prl .
Bulović et al.bulovic+98cpl ; madi+03prl also made an important observation: Since the molecules in the solid solution must be randomly distributed, over a large volume, the net DCM2 dipole moment averages to zero. However, considering that the dipole field decreases as , where is the distance between dipoles, near any given radiating molecule there should be a net local electric field due to the dipole moments of neighboring DCM2 molecules which, on average, influences the spectral emission.
Other models have been suggestedbaldo+01cpl ; madi+03prl to explain the observed redshift. In 2001, Baldo et al. baldo+01cpl introduced the so-called ”local order theory”. This theory is based on the formation of aggregates of guest molecules into the host matrix. Baldo et al. argued that as the DCM2 concentration increases from 1% to 10%, the DCM2 molecules readily aggregate. The spectral shifts are then explained due to the high electric fields associated with local ordering of the polar DCM2 molecules in aggregate domains. In a following work, Madigan et al. madi+03prl developed a model of solvatochromism relating the experimentally observed changes in emission and absorption spectra of a solute to the electronic permittivity of a solvent. This model does not require the assumption of aggregation of DCM2 to explain the redshift and it was supported by experimental data madi+03prl .
Regardless of whether the spectral redshift is related to aggregation or not, all previous models relied on the fact that emission spectra would vary with changes of local electric field due to high electric dipole moment and dielectric constant of DCM2, as its concentration increases from 1% to 10%. However, the detailed mechanism for this effect was not investigated at the level of quantum-chemical calculations. In particular, it is puzzling the association of a strong emission redshift to an electric field acting on the DMC2 molecules, since changes in the electronic or optical gap under an electric field (Stark shifts) are typically linear to first order. Therefore a randomly-oriented field should in principle give rise to both positive and negative variations of the gap, with a nearly zero net effect.
In the present work, we develop a new model to explain the redshift emission in DCM2-doped Alq3, supported by a combination of DFT quantum-chemical calculations and stochastic simulations of exciton diffusion and emission. Surprisingly, the energy gap distribution of DCM2 molecules under a random distribution of DCM2 and Alq3 dipoles is rather independent of the DCM2 concentrations (for up to 10% DCM2), as just the smaller dipole moments of neighboring Alq3 molecules are sufficient to produce the necessary gap variations in DCM2 to account for the observed redshift. Moreover, the calculated Stark shifts are highly nonlinear, producing a probability distribution of DCM2 gaps with a long tail to the low-energy side. Finally, the observed concentration dependence of redshift is explained by exciton diffusion via the FRET mechanism.
The paper is organized as follows: Section II describes quantum-chemical calculations of the HOMO-LUMO gap variations of DCM2 under electric fields (Stark shift). Section III presents simulations of the local electric field on DCM2 and the determination of the gap distribution using random Alq3 and DCM2 dipoles distribution. Section IV, describes the kinetic Monte-Carlo (kMC) simulations of exciton diffusion and emission via Föster energy transfer. Finally, Section V presents the main conclusions of the present work.
II Stark shift
II.1 Methodology
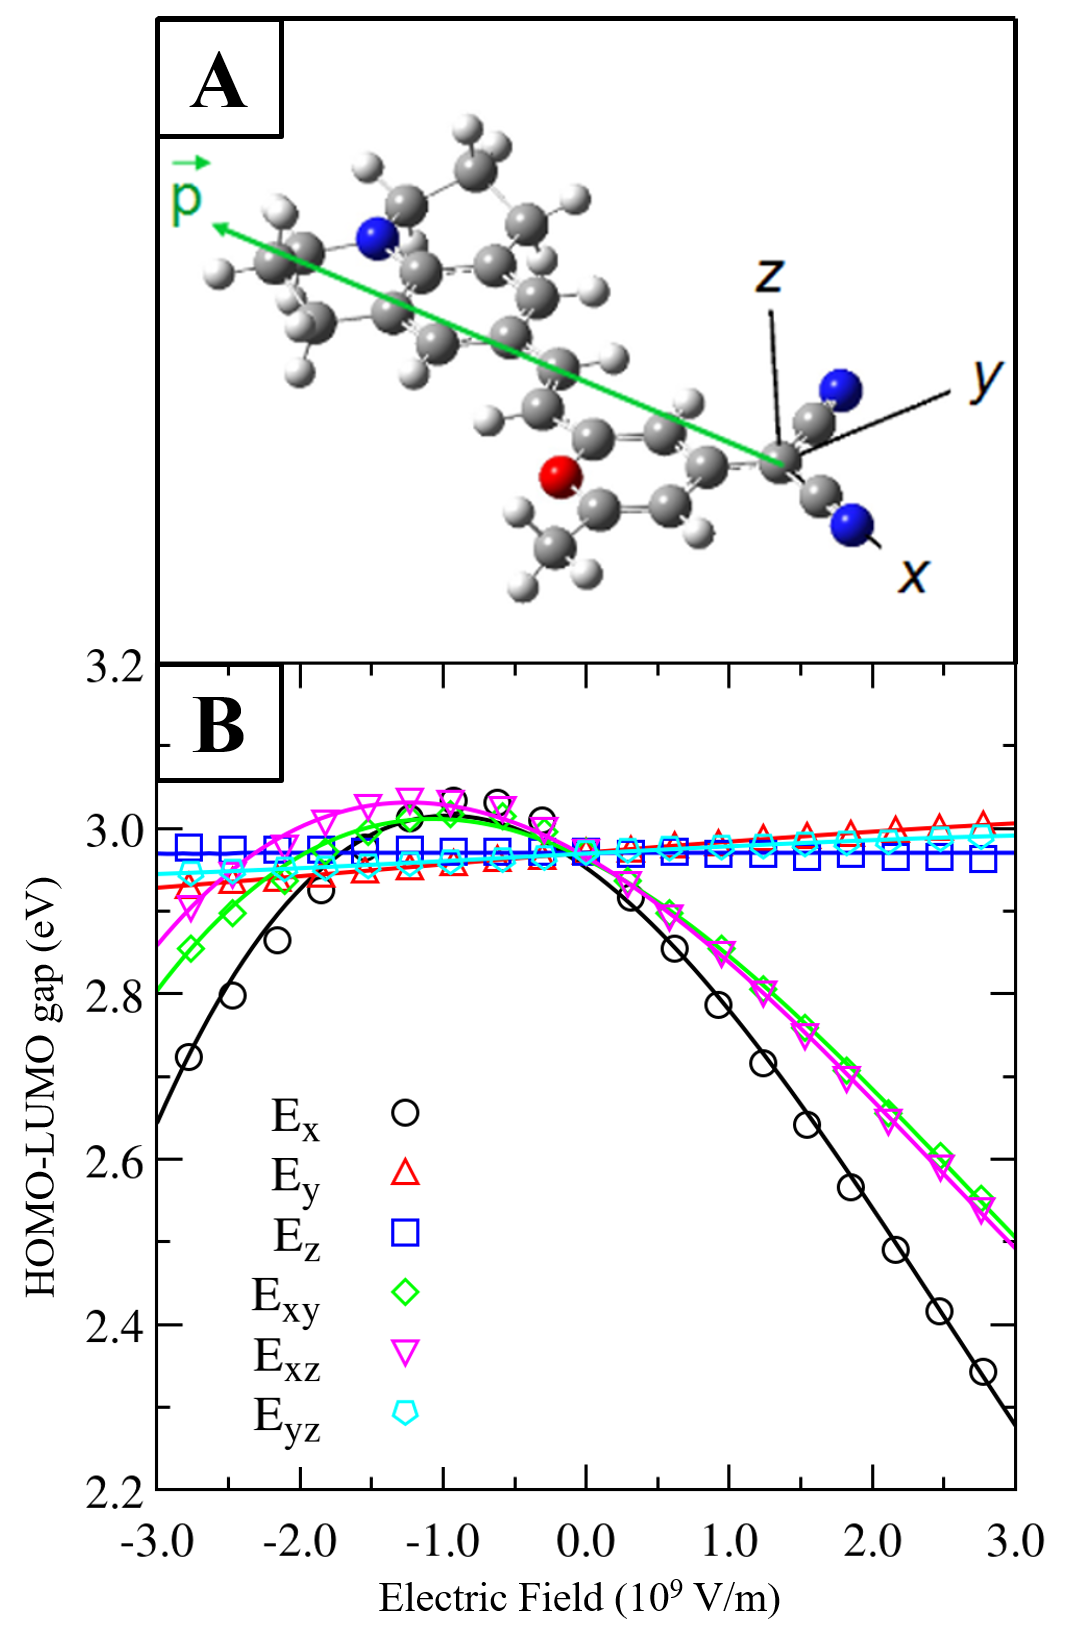
Since the random distribution of dipole moments of Alq3 and DCM2 molecules results in an effective electric field acting on the DCM2 dopant molecules, initially we established the dependence of the DCM2 HOMO-LUMO gap as a function of the intensity and orientation of this field, i.e., the Stark shift is evaluated. To establish this dependence and at the same time ensure that our approach has quantitative and predictive capabilities, the molecular geometry, dipole moment, polarizability tensor, and HOMO-LUMO gap must be calculated using ab initio methods. The quantum-chemical calculations were performed using the Gaussian03 program gaussian . For the optimization of the geometry, dipole moment and polarizability tensor of DCM2 and Alq3 molecules, the hybrid functional PBE1PBE(perdew+96prl, ; perdew+97prl, ; adamo+99jcp, ) was used, along with the 6-31G(d,p)ditch+71jcp basis set.
Once the geometry of the DCM2 molecular structure was optimized (see Fig. 2(A)), electric fields of various intensities were applied in different orientations with respect to DCM2 molecules (see Fig. 2(B)). For these calculations, six different directions were chosen (, , , , and respectively): Parallel to , and axes, and at 45∘ with respect to -axis in the plane, at 45∘ with respect to -axis in the plane, and finally at 45∘ with respect to -axis in the plane. For this study, we performed SCF calculations using Gaussian03gaussian within DFT. In this case the B3LYPB3 ; LYP ; b3lyp-1 ; b3lyp-2 hybrid functional was used for the exchange-correlation term in DFT, with the same base set as in geometry optimization. The self-consistent field (SCF) calculations for this case is justified because it is expected that, in solid state film, DCM2 molecules in the Alq3 matrix do not have enough space to accommodate geometry relaxation.
II.2 Results
Based on the ab initio DFT approach described previously, we first calculate the dipole moment and the polarizability tensor of Alq3 and DCM2 molecules. These properties will be used in Section III. As expected, DCM2 molecules are highly polar, with a ground state dipole moment of 14.4 D, as compared to the Alq3 dipole moment of 4.4 D. These values are in good agreement with those reported in the literature bulovic+99cpl ; curioni+98cpl . In Fig. 2(A) we show the optimized DCM2 geometry and the dipole moment vector. As one can see, the dipole moment is oriented from the two carbon-nitrogen groups towards the oxygen atom. This is due to the the balance of electronic charge between oxygen (negative) and the two carbon-nitrogen groups (positive) at the ends of the DCM2 molecule.
.
Fig. 2 (B) shows the dependence of DCM2 HOMO-LUMO gap as a function of the electric field (Stark effect). The Stark effect is stronger when the electric field is applied parallel to the direction ( - electric field in direction). In this case, this effect has a nonlinear dependence. We also show the dependence of DCM2 gap regarding to variations of the applied electric field in other directions. For , and directions there is almost no variation of DCM2 gaps with respect to the electric field, but for and directions a similar behavior is observed as in direction.
Due to the nonlinear behavior shown in Fig. 2(B), an analytical expression for the HOMO-LUMO gap of DMC2 as function of the electric field needs to consider up to the quadratic terms:
| (1) |
where = 2.96 eV is the HOMO-LUMO gap for the ground state at zero electric field. The coefficients and are obtained by fitting the DCM2 HOMO-LUMO gap dependence for each direction of the applied electric field shown in Fig. 2 (B) by quadratic polynomials. The resulting the values of and are shown in Table 1.
III ELECTRIC FIELD AND ENERGY GAP DISTRIBUTIONS
In this Section, the resulting electric field at each DCM2 molecule caused by a random distribution of Alq3 and DCM2 dipole moments is calculated. Once obtained this electric field, the DCM2 gap shift is calculated using Eq. 1. With this procedure it is possible to obtain the histogram of DCM2 gap distribution for each concentration of DCM2 molecules into Alq3 matrix.
To calculate the resulting electric field in each of DCM2 molecules, we consider not only the permanent dipole moments of Alq3 and DCM2 molecules, but also the induced dipole moment due to polarization. The electric field calculation then follows a self-consistent iterative procedure, as illustrated in Fig. 3 (more details can be found in the Supplemental Material).
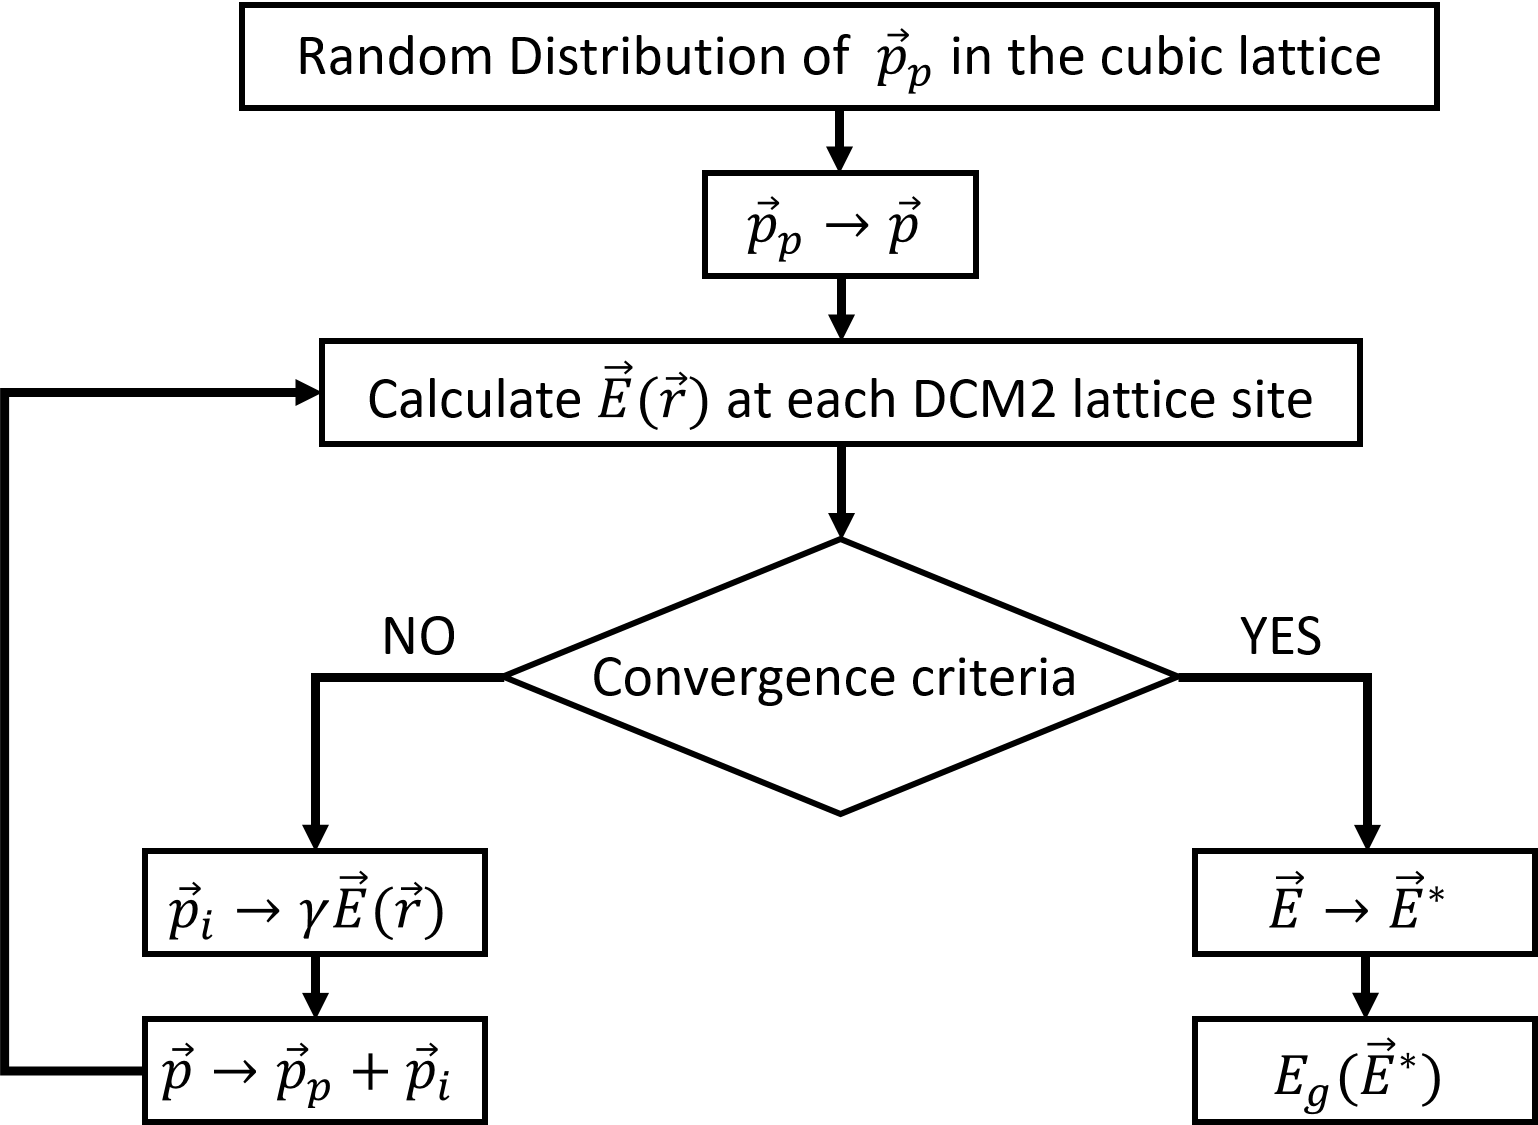
In this methodology, Alq3 and DCM2 permanent dipole moments initially are distributed in a 707070 cubic lattice, with lattice constant of 8.5 Å. This lattice constant is chosen in order to reproduce the same density as amorphous Alq3 matrix. The ratio of DCM2 and Alq3 dipoles is selected respecting the DCM2 concentration in the Alq3 host. All dipole moments are randomly oriented. In the second step, we calculated the electric field at each DCM2 and Alq3 molecules due to the random distribution of dipoles. Thus the induced dipole moment on each molecule is obtained from the calculated polarizability tensor and the total dipole moment is obtained as the sum of induced and permanent moments. Then the electric fields are recalculated and the convergence criteria are analyzed. The iterative process repeats until convergence is achieved. After convergence, the DCM2 gaps are calculated using Eq. 1.
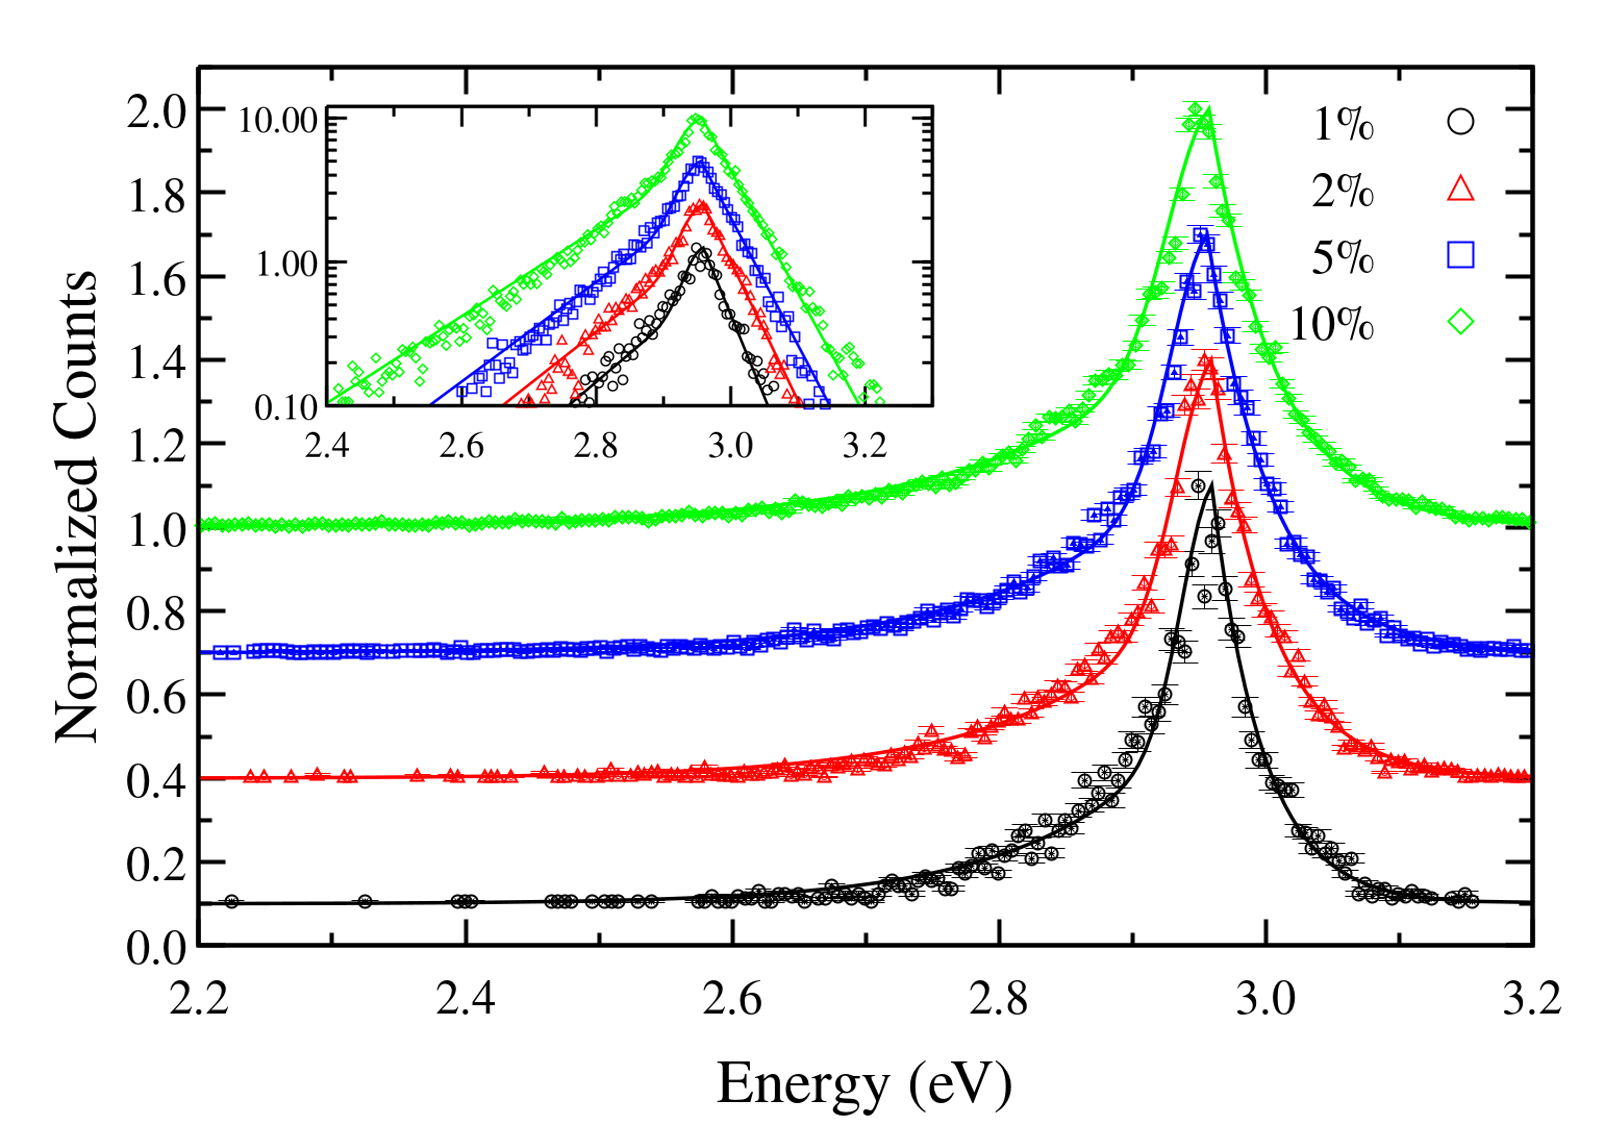
The result of this procedure is shown in Fig. 4 as a histogram showing the probability distribution of DCM2 HOMO-LUMO gaps. The DCM2 gap distribution is asymmetric, with a long tail in the low energy region. This is a direct consequence of the nonlinearity of the Stark shifts (see Fig. 2(A)). For energies lower than =2.96 eV, the gap distribution shows a behavior that is approximately a linear combination of a Gaussian and an exponential function. For energies higher than the behavior is approximately exponential. Based on these empirical behaviors, it is possible to write an analytical expression for the probability distribution of the DCM2 gap (to be used in Section IV). The expression for the probability distribution is:
| (2) |
where , and are normalization constants, is the DCM2 energy gap distribution and , , and are free parameters to be adjusted in order to fit the data points. Table 2 shows these parameters for various DCM2 concentrations.
| DCM2 | ||||
|---|---|---|---|---|
| concentration (%) | (eV) | (eV) | (eV) | (eV) |
| 1 | 2.95944 | 0.10934 | 0.03800 | 0.02318 |
| 2 | 2.95904 | 0.11816 | 0.04500 | 0.02733 |
| 5 | 2.95605 | 0.12564 | 0.04900 | 0.02800 |
| 10 | 2.95735 | 0.14416 | 0.05100 | 0.03200 |
.
Fig. 4 shows that, surprisingly, for low DCM2 concentration the gap distribution does not depend significantly on the DCM2 concentration. Therefore, we conclude that the gap distribution is mostly determined by the random electric field produced by Alq3 dipoles, differently from the usual understanding. Although Alq3 molecules have a smaller dipole moment, they are found more frequently near a given DCM2, thus explaining this behavior.
However, if this is the case, how can we understand the redshift due to increasing the DCM2 concentration? In Section IV, we present kinetic Monte-Carlo simulations of exciton dynamicsfennel2012forster ; madigan2006modeling performed with the purpose of answering this question.
IV Kinetic Monte-Carlo
We propose that the emission redshift in Alq3:DCM2 upon increasing DCM2 concentration is caused by diffusion and partial thermalization of excitons (limited by exciton lifetimeherz2004time ). We propose that exciton diffusion in our system is described by FRET, which is a non-radiative energy transfer mechanism based on dipole-dipole coupling, where a donor molecule in an electronically excited state transfers its excitation energy to a nearby acceptor molecule lunz2011 . For efficient energy transfer, it is necessary that the emission spectrum of donor molecules overlaps the absorption spectrum of the acceptor molecules, and the separation distance between the donor and acceptor centers have to be much less than the wavelength Ren2016 .
In our model, the exciton dynamics occur through two steps:
-
1.
After exciton formation on a Alq3 molecule (either by electric or photo-excitation), the excitation is quickly transferred to the nearest DCM2 molecule. This non-radiative energy transfer by Förster mechanism is very efficient due to good spectral overlap between the donor (Alq3) emission and acceptor (DCM2) absorption spectra, shown by the yellow region in Fig. 5 (a).
-
2.
When excitons reach DCM2 molecules, or if they are initially formed directly on DCM2 molecules due to charge trapping, they can thermalize by hopping between DCM2 molecules also via Förster process, since there is a smaller but non-negligible overlap between DCM2 emission and absorption spectra (Fig. 5 (b)). Under energetic disorder, excitons move preferentially to lower energy sites. The thermalization process lasts until they finally decay radiatively (i.e, after the exciton lifetime is reached, in average).
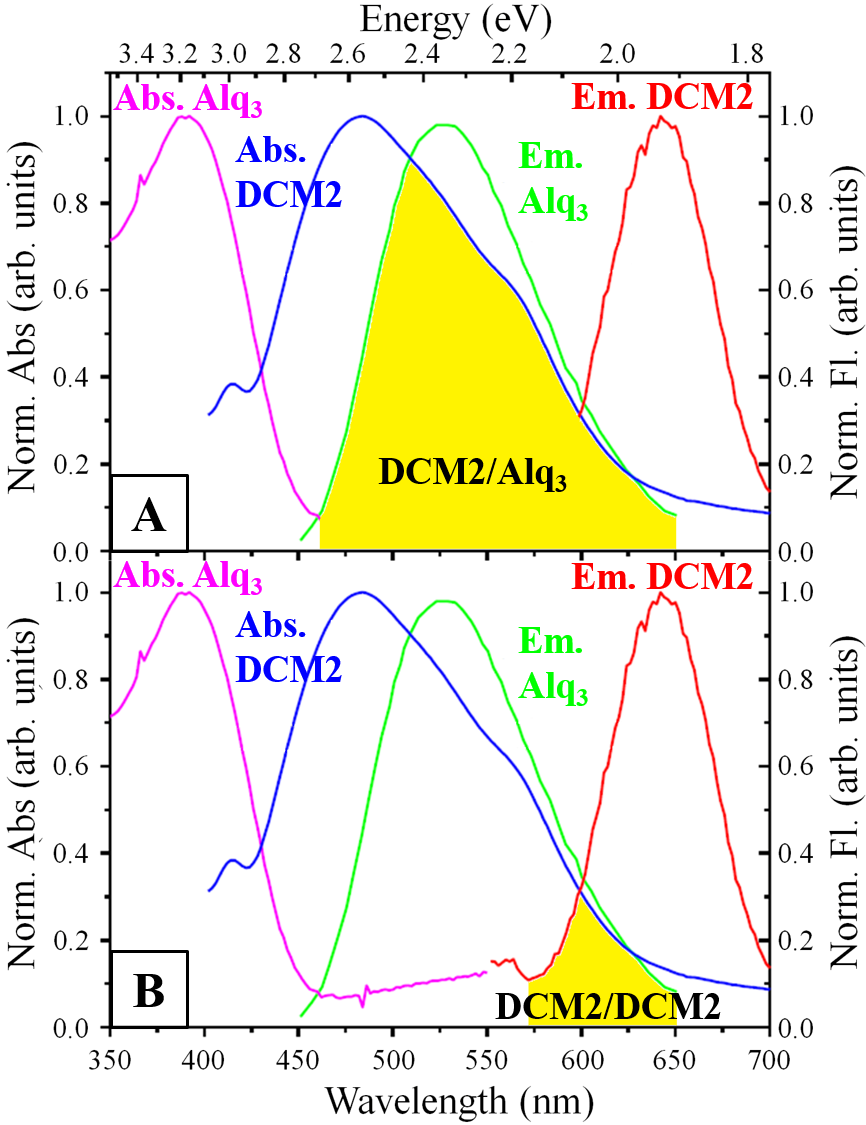
As stated above, the magnitude of spectral overlap between emission and absorption of donor and acceptor molecules is a key ingredient of the Förster mechanism. We measure these quantities and the results are displayed in Fig. 5, which shows the experimental data for absorption and photoluminescence of an Alq3:DCM2 matrix with concentration of guest material (DCM2) of 5% into of host material (Alq3). Both molecules were purchased from Lumtec (Luminescence Technology Corporation) and used without additional purification. The organic film was deposited in high vacuum environment (10-6 Torr) by thermal evaporation onto quartz substrate and with a thickness of 50 nm. The quartz substrates were cleaned by ultrasonification using a detergent solution followed by ultrasonification with deionized water, followed by pure acetone, then pure isopropyl alcohol. For the organic layers the deposition rate was 0.5 Å/s. UV-visible absorption spectra of the thin films were recorded using a Perkin-Elmer Lambda 950 dual-beam spectrometer with spectral correction. Thin film photoluminescence spectra were measured using a PTI fluorimeter model QuantaMaster 40 at room temperature and pressure conditions. The results in Fig. 5 show clearly the larger overlap for Alq3-DCM2 with respect to DCM2-DCM2, thus justifying the larger Förster radius used in simulations (see below) for the first case.
Due to the stochastic nature of the exciton hopping process, the exciton diffusion process is modeled by a kinetic Monte-Carlo method (kMC) based on the Förster energy transfer (FRET), within the first-reaction method (FRM) approximation.madigan2006modeling ; feron+12jap The sample is modeled as a cubic lattice of 100100100 sites, with a certain proportion of DCM2 and Alq3 sites given by the dopant concentration. The lattice constant is set to 1 nm. Then, excitons are randomly distributed in the cubic lattice and exciton dynamics simulation using the FRET process starts.
In the FRET model, the hopping time between any two sites and is given by:
| (3) |
where is the exciton lifetime, the Förster radius, and is a function accounting for energetic disorder. The exciton lifetime is 1.0 ns. The Förster radius is proportional on the overlap integral of the donor emission spectrum (Alq3) with the acceptor absorption spectrum (DCM2) (see Fig 5 (a)). As there is a smaller overlap between DCM2 emission and absorption spectra (see Fig 5 (b)), in the simulations we use two distinct : One to account the jumps between Alq3 and DCM2 (=39 Å), and another between DCM2-DCM2 molecules (=6 Å). The value for Alq3/DCM2 energy transfer was taken from the literature deshpande1999white , whereas the DCM2/DCM2 value was calculated using the ratio between the two yellow areas in Fig. 5.
The function introduces the preferential hopping of excitons to lower energy sites and accounts for energetic disorder:
| (4) |
The energies of all Alq3 sites are randomly assigned according to a Gaussian distribution with a standard deviation, , extracted from Gaussians fitted to the Alq3 absorption spectrum as described in Scheidler et al. scheider+96prb For DCM2 sites, the energies are randomly assigned according to the gap probability distribution function from Eq. 2, obtained in Section III.
In the first reaction method (FRM), a random number between 0 and 1 is selected for each process and a ”jump time” is calculated:
| (5) |
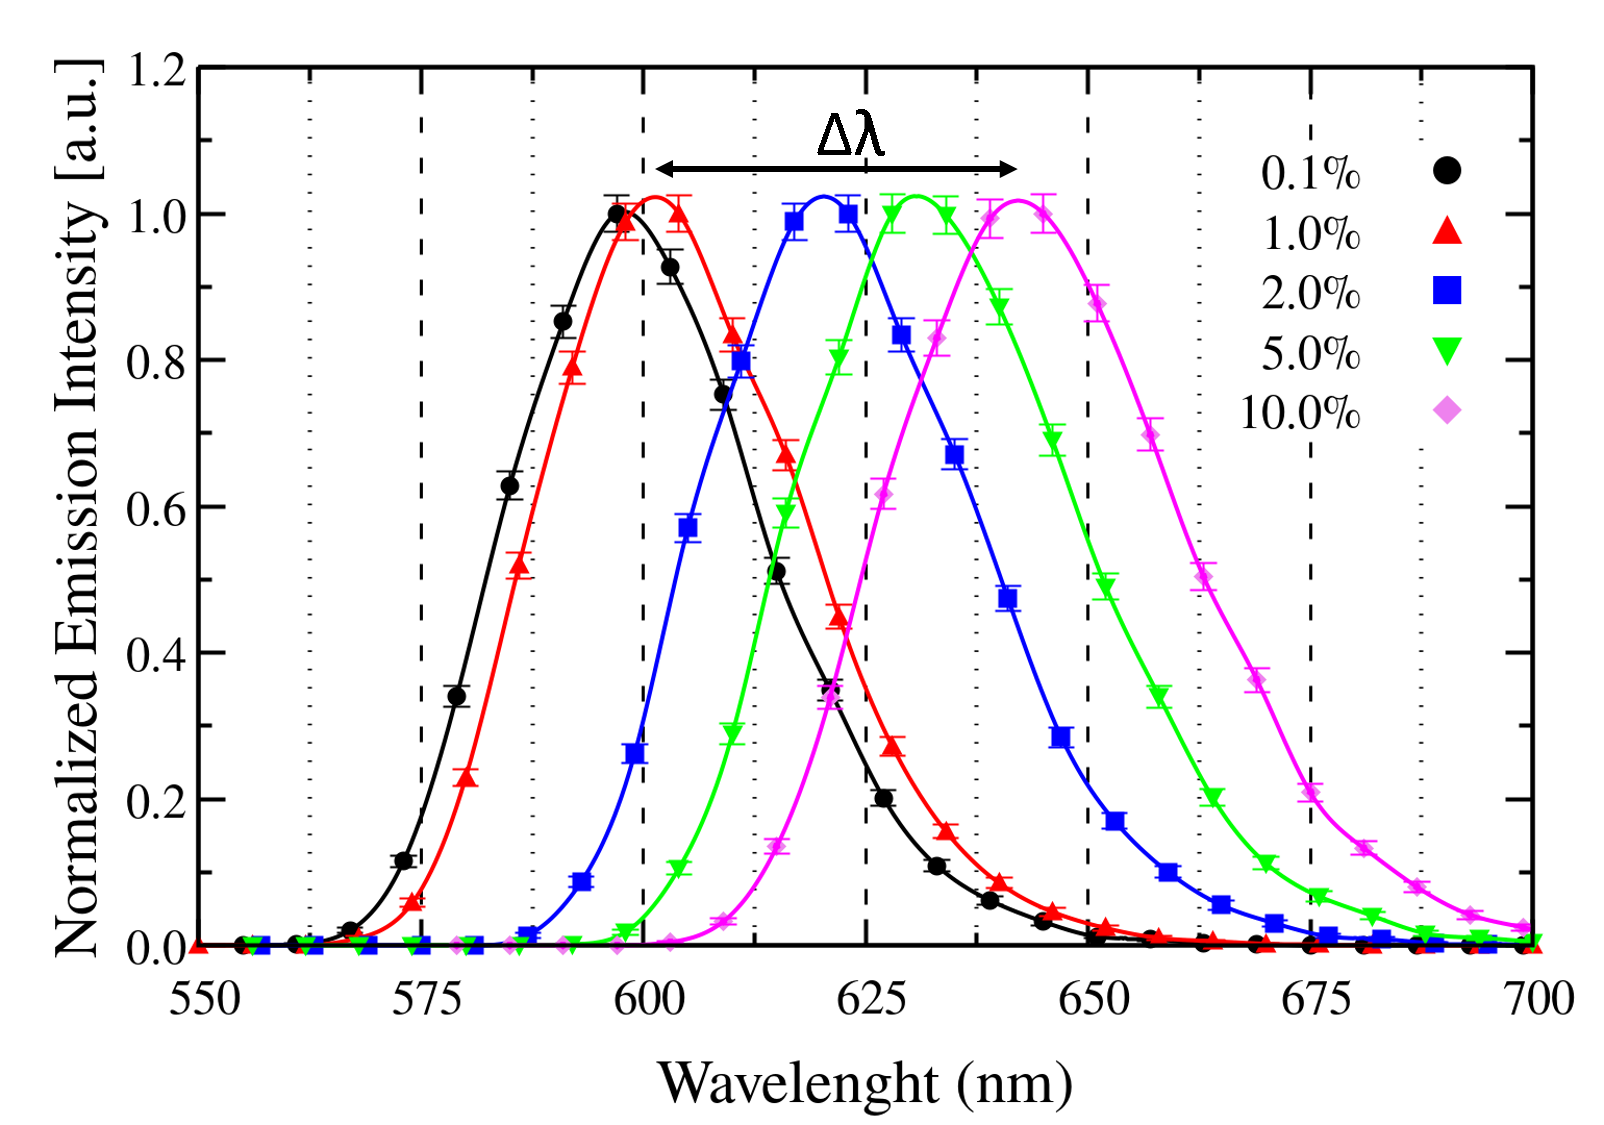
The process with lowest jump time is then selected to be next destination of the exciton. The jump times for each exciton are summed and this process happens until the total event time reaches the exciton lifetime of 1 ns. When this occurs, we assume that the exciton is annihilated by emitting a photon. Then, the gap energy at the emission site is collected in a histogram (see Fig.6). For all DCM2 molecules, the HOMO-LUMO gap energy at zero field is empirically redshifted by 0.25 eV to reproduce emission energy of the Alq3:DCM2 system at very low DCM2 concentrations. In order to ensure the homogeneity of the DCM2 distribution, and to reduce the effects of the initial location of excitons, a total of 100 independent simulations were carried out for each concentration. Then, the final emission spectra is obtained as the average of all spectra obtained for a given concentration of DCM2.
All this theoretical effort culminates in the emission spectra shown in Fig. 6, as a function of DCM2 concentration. As the DCM2 concentration increases, the redshift in the emission spectra is observed. Experimental 50 nm shift from 1% to 10% DCM2 concentration is reproduced bulovic+98cpl ; madi+03prl . In addition, the band width remains practically unchanged, as in experiments.
This is a very interesting result, since no assumption of local aggregation of DCM2 was needed and, as shown in the previous Section, the DCM2 gap distribution does not change considerably with concentration (in this low-concentration regime). Physically, we can understand the emission redshift as a consequence of the higher mobility of excitons when the DCM2 concentration increases: Within the exciton lifetime, for higher DCM2 concentrations, exciton DCM2-DCM2 jumps occur more frequently and therefore excitons have a better chance to thermalize to molecules with smaller gaps, thus causing an overall redshift of the average emission frequency.
V Conclusions
In conclusion, using a combination of different theoretical methods and techniques, we propose a novel mechanism for the concentration-dependent emission redshift Alq3:DCM2, based on exciton dynamics. Our theoretical modeling was composed of several important ingredients, that we now summarize: (1) DCM2 molecules suffer a nonlinear Stark shift of the electronic gap upon external electric fields, with a negative curvature (tendency to smaller gaps); (2) when DCM2 molecules are placed in an Alq3 matrix, the random dipole moments of neighboring molecules produce local electric fields that generate a distribution probability of DCM2 with a long tail towards low energies. For low DCM2 concentrations, these local fields are caused primarily by Alq3 molecules, differently from the usual understanding. (3) Exciton hopping from Alq3 to DCM2 and specially between DCM2 molecules allow thermalization of excitations towards lower energies and explain the redshift. For larger concentrations of DMC2, exciton mobility is larger and therefore the redshift is more substantial. Our model agrees quantitatively with experiments and we believe it describes a very general mechanism that should occur in similar systems.
VI Acknowledgements
The authors acknowledge financial support from Brazilian agencies CNPq, FAPERJ, Finep, INCT - Nanomateriais de Carbono and INCT-INEO for financial support. Ronaldo Giro wish to thank Dr. Ulisses Mello, director of IBM Research - Brazil, for partial support of this project and to his colleagues in the Smarter Devices team for many stimulating discussions. Graziâni Candiotto gratefully acknowledge FAPERJ Processo E-26/200.008/2020 for financial support. The authors wish to thanks Dr. Juan H. S. Restrepo from Universidad Pontificia Bolivariana, Medellin, Colombia for providing the experimental data. The authors also acknowledge the support of Núcleo Avançado de Computação de Alto Desempenho (NACAD/COPPE/UFRJ), and Sistema Nacional de Processamento de Alto Desempenho (SINAPAD).
References
- (1) D. D. C. Bradley, Synth. Met. 54, 401 (1993).
- (2) J. R. Sheats et al., Science 273, 884 (1996).
- (3) H. Ma et al., Materials Chemistry Frontiers 3, 2448 (2019).
- (4) F. Nüesch et al., Advanced functional materials 15, 323 (2005).
- (5) A. Soman, A. K. Sajeev, K. Rajeev, and N. U. KN, ACS Omega (2020).
- (6) K. T. Kamtekar, A. P. Monkman, and M. R. Bryce, Advanced Materials 22, 572 (2010).
- (7) V. Bulović et al., Physical Review B 58, 3730 (1998).
- (8) M. Čehovski et al., Applied Sciences 10, 2805 (2020).
- (9) Y. Zhang and S. R. Forrest, Physical Review B 84, 241301 (2011).
- (10) Y. Chin and L. Barbato, Medical device with OLED illumination light source, 2005, uS Patent App. 10/737,980.
- (11) V. Bulović et al., Chem. Phys. Lett. 287, 455 (1998).
- (12) C. F. Madigan and V. Bulović, Phys. Rev. Lett. 91, 247403 (2003).
- (13) V. T. Förster, Annalen der Physik 437, 55 (1948).
- (14) FRET - Förster Resonance Energy Transfer: From Theory to Applications, edited by I. Medintz and N. Hildebrandt (Wiley-VCH Verlag GmbH & Co, Weinheim, Germany, 2014).
- (15) K. Cheon and J. Shinar, Physical Review B 69, 201306 (2004).
- (16) X. Liu, Y. Zhang, and S. R. Forrest, Physical Review B 90, 085201 (2014).
- (17) J. Becker et al., Microelectronic Engineering 181, 29 (2017).
- (18) C. W. Tang, S. A. VanSlyke, and C. H. Chen, J. Appl. Phys. 65, 3610 (1989).
- (19) J. Kalinowski, W. Stampor, P. D. Marco, and V. Fattori, Chem. Phys. 182, 341 (1994).
- (20) V. Bulović, R. Deshpande, M. E. Thompson, and S. R. Forrest, Chem. Phys. Lett. 308, 317 (1999).
- (21) C. Reichardt and T. Welton, Solvents and solvent effects in organic chemistry (John Wiley & Sons, ADDRESS, 2011).
- (22) M. A. Baldo, Z. G. Soos, and S. R. Forrest, Chem. Phys. Lett. 347, 297 (2001).
- (23) M. J. Frisch et al., GAUSSIAN 03 Revision D.01, Gaussian, Inc., Wallingford, CT, 2004.
- (24) J. P. Perdew, K. Burke, and M. Ernzerhof, Phys. Rev. Lett. 77, 3865 (1996).
- (25) J. P. Perdew, K. Burke, and M. Ernzerhof, Phys. Rev. Lett. 78, 1396 (1997).
- (26) C. Adamo and V. Barone, J. Chem. Phys. 110, 6158 (1999).
- (27) R. Ditchfield, W. J. Hehre, and J. A. Pople, J. Chem. Phys. 54, 724 (1971).
- (28) A. D. Becke, Phys. Rev. A 38, 3098 (1988).
- (29) C. Lee, W. Yang, and R. G. Parr, Phys. Rev. B 37, 785 (1988).
- (30) K. Kim and K. Jordan, The Journal of Physical Chemistry 98, 10089 (1994).
- (31) P. J. Stephens, F. Devlin, C. Chabalowski, and M. J. Frisch, The Journal of physical chemistry 98, 11623 (1994).
- (32) A. Curioni, M. Boero, and W. Andreoni, Chem. Phys. Lett. 294, 263 (1998).
- (33) F. Fennel and S. Lochbrunner, Physical Review B 85, 094203 (2012).
- (34) C. Madigan and V. Bulović, Physical review letters 96, 046404 (2006).
- (35) L. Herz et al., Physical Review B 70, 165207 (2004).
- (36) M. Lunz et al., Phys. Rev. B 83, 115423 (2011).
- (37) J. Ren, T. Wu, B. Yang, and X. Zhang, Phys. Rev. B 94, 125416 (2016).
- (38) K. Feron, X. Zhou, W. J. Belcher, and P. C. Dastoor, J. Appl. Phys. 111, 044510 (2012).
- (39) R. Deshpande, V. Bulović, and S. Forrest, Applied Physics Letters 75, 888 (1999).
- (40) M. Scheidler et al., Phys. Rev. B 54, 5536 (1996).