The Heavy Metal Survey: Star Formation Constraints and Dynamical Masses of 21 Massive Quiescent Galaxies at
Abstract
In this paper, we present the Heavy Metal Survey, which obtained ultra-deep medium-resolution spectra of 21 massive quiescent galaxies at with Keck/LRIS and MOSFIRE. With integration times of up to 16 hrs per band per galaxy, we observe numerous Balmer and metal absorption lines in atmospheric windows. We successfully derive spectroscopic redshifts for all 21 galaxies and for 19 we also measure stellar velocity dispersions (), ages, and elemental abundances, as detailed in an accompanying paper. Except for one emission-line AGN, all galaxies are confirmed as quiescent through their faint or absent H emission and evolved stellar spectra. For most galaxies exhibiting faint H, elevated [N ii]/H suggests a non-star-forming origin. We calculate dynamical masses () by combining with structural parameters obtained from HST/COSMOS(-DASH), and compare them with stellar masses () derived using spectrophotometric modeling, considering various assumptions. For a fixed initial mass function (IMF), we observe a strong correlation between / and . This correlation may suggest that a varying IMF, with high- galaxies being more bottom-heavy, was already in place at . When implementing the -dependent IMF found in the cores of nearby early-type galaxies and correcting for biases in our stellar mass and size measurements, we find a low scatter in / of 0.14 dex. However, these assumptions result in unphysical stellar masses, which exceed the dynamical masses by 34%. This tension suggests that distant quiescent galaxies do not simply grow inside-out into today’s massive early-type galaxies and the evolution is more complicated.
1 INTRODUCTION
The majority of stars in today’s universe live in early-type galaxies with quiescent stellar populations (e.g., Muzzin et al., 2013a). These galaxies are massive, large, exhibit little to no rotation, and are thought to have formed the majority of their stars at high redshifts (e.g., Thomas et al., 2005; McDermid et al., 2015). Nonetheless, despite the wealth of information from low-redshift studies, the formation histories of massive early-type galaxies are still poorly understood.
To quantify the growth of massive galaxies and understand the physical processes driving this evolution, it is imperative to directly observe them during their early stages. Such studies find that massive galaxies with quiescent stellar populations already exist when the universe was only a fraction of its current age. These distant quiescent galaxies were first identified almost two decades ago (e.g., Franx et al., 2003; Cimatti et al., 2004; Glazebrook et al., 2004) and have been found to dominate the massive end of the galaxy distribution out to (e.g., Muzzin et al., 2013a; Tomczak et al., 2014; McLeod et al., 2021). Galaxy formation models originally failed to predict this quiescent galaxy population and – almost two decades later – are still struggling to explain their presence.
Our poor understanding of this galaxy population is primarily due to the difficulty of obtaining high-quality spectra. Quiescent galaxies typically do not have bright emission lines and thus, we rely on faint stellar absorption features to measure redshifts and learn about their stellar, chemical, and kinematic properties. Obtaining such spectra is even more challenging at , as the bulk of the stellar spectrum is shifted to near-IR wavelengths.
A few years after their initial discovery, the first spectra for quiescent galaxies were obtained, showing broad continuum features (e.g., Daddi et al., 2005; Kriek et al., 2006). The first direct detection of Balmer and metal absorption lines took nearly 30 hours with GNIRS (Gemini-South) on one galaxy and the lines were still only marginally detected (e.g., Kriek et al., 2009; van Dokkum et al., 2009). With the advent of more efficient near-IR spectrographs like X-Shooter (VLT; Vernet et al., 2011), KMOS (VLT; Sharples et al., 2013) and MOSFIRE (Keck Observatory; McLean et al., 2012), spectroscopic redshifts, robust velocity dispersion measurements, and dynamical mass estimates became available for substantial samples or stacks of distant quiescent galaxies (e.g., van de Sande et al., 2011, 2013; Bezanson et al., 2013; Belli et al., 2014, 2017a; Lonoce et al., 2015; Onodera et al., 2015; Mendel et al., 2015; Saracco et al., 2019; Carnall et al., 2022; Zhuang et al., 2023; Park et al., 2023).
In recent years, spectroscopic studies have pushed to even higher redshifts (; e.g., Glazebrook et al., 2017; Schreiber et al., 2018; Tanaka et al., 2019; Forrest et al., 2020; Esdaile et al., 2021; Carnall et al., 2023; Antwi-Danso et al., 2023). At the same time, deeper observations have enabled the first measurements of chemical abundances and resolved stellar kinematics at . These initial studies show intriguing results and demonstrate the power of using such measurement to gain insights into the formation mechanisms of distant quiescent galaxies. First, they have old ages and extreme chemical abundance patterns (Kriek et al., 2016; Jafariyazani et al., 2020), indicating that they formed their stars in early vigorous bursts, followed by an efficient quenching process. Second, they appear to be rotationally supported (Newman et al., 2015, 2018a; Toft et al., 2017).
However, these studies are based on few very massive and/or lensed galaxies and many questions remain. We do not know how these galaxies became so massive at such early epochs, when and how fast they formed and assembled their mass, whether they are supported by rotation or random motions, which physical processes are responsible for halting their star formation, and how they evolved into the massive early-type galaxies in the today’s universe. Addressing these questions requires statistical samples of distant quiescent galaxies with ultra-deep spectra covering several Balmer and metal absorption lines, which enable stellar, chemical, and kinematic measurements.
In order to obtain such a spectroscopic galaxy sample, we have conducted the Heavy Metal Survey with MOSFIRE (McLean et al., 2012) and LRIS (Oke et al., 1995) on the Keck I Telescope. The Heavy Metal sample observes 21 “bright” quiescent galaxies over two redshift intervals, and , as well as many more star-forming and fainter quiescent galaxies at similar redshifts. With integration times of up to 16 hours per filter per mask, we observe numerous Balmer and metal absorption lines. While this distant quiescent galaxy sample is not as large as the sample by Belli et al. (2017a, 2019, 30 galaxies at ), it is unique for its wavelength coverage, and the only survey so far that obtains ultra-deep spectra at rest-frame Å for a sample of distant quiescent galaxies. This wavelength range targets the strongest -element absorption line (i.e., Mgb) in the rest-frame optical, as well as several prominent Fe lines.
In this paper we present our survey design and observational strategy, data reduction and overview (Section 2), methods to derive spectral properties (Section 3), characteristic of the galaxy sample (Section 4), and discuss the implications of our finding for galaxy evolution studies (Section 5). The primary science applications of this data-set, the chemical abundance measurements, will be presented in an accompanying paper (A. Beverage et al. in prep). The spectra and chemical abundances for the primary galaxies in first Heavy Metal mask were also presented in Kriek et al. (2019). Several other science applications including molecular gas properties and AGN outflows will be presented in future papers (K. Suess et al. in prep; Y. Ma et al in prep).
Throughout this work we assume a CDM cosmology with , , and . All magnitudes are given in the AB-magnitude system (Oke & Gunn, 1983). The wavelengths of all emission and absorption lines are given in vacuum.
2 Observations and Data
2.1 Survey Design
The Heavy Metal Survey aims to study the formation histories of massive quiescent galaxies using stellar, chemical, and kinematic measurements. Achieving this goal requires (i) a statistically significant sample of distant quiescent galaxies with (ii) ultradeep rest-frame optical spectroscopy covering several hydrogen, iron and -element absorption features, and (iii) ancillary datasets including ultradeep multi-wavelength photometry and high-resolution imaging.
| Mask | Instrument | R.A. | Decl. | P.A. | Filter | Semesters | FWHM | ||
|---|---|---|---|---|---|---|---|---|---|
| (hh:mm:ss) | (dd:mm:ss) | (deg) | (hr) | seeing | |||||
| HeavyMetal1 | LRIS | 10:00:42.61 | 02:34:43.97 | 93.0 | 19(5) | red | 2016B | 4.4 | 09 |
| (HM1, ) | MOSFIRE | 10:00:42.01 | 02:34:54.30 | 86.7 | 29(5) | J | 2017A | 11.76 | 063 |
| H | 2017A | 0.86 | 075 | ||||||
| HeavyMetal2 | LRIS | 10:00:44.88 | 01:45:14.24 | -75.0 | 18(6) | red | 2021AB | 6.25/6.5a | 09 |
| (HM2, ) | MOSFIRE | 10:00:42.59 | 01:45:17.24 | 127.3 | 22(6) | J | 2018B | 11.5 | 066 |
| H | 2018B | 0.92 | 076 | ||||||
| HeavyMetal3 | MOSFIRE | 10:00:44.70 | 02:01:35.48 | -23.1 | 20(5) | J | 2018B, 2019A, 2020B | 14.4 | 083 |
| (HM3, ) | H | 2018B, 2019A | 16.7 | ||||||
| K | 2018B, 2019A | 2.2 | 077 | ||||||
| HeavyMetal4 | MOSFIRE | 09:59:13.80 | 01:48:58.90 | 77.6 | 22(5) | J | 2019AB, 2021A | 12.4 | 073 |
| (HM4, ) | H | 2019AB, 2020B | 15.5 | 059 | |||||
| K | 2019B, 2021A | 2.6 | 089 |
aIn 2021A one of the red detectors was not working. To observe all galaxies, we used two masks, which differed by 180 degrees, and only used one of the detectors. The masks were observed for 3.5 and 3.75 hours. In 2021B a new detector had been installed, and we re-observed the original mask for 2.75 hours. Hence, the integration times varied per galaxy, depending on the location in the mask.
To that end, we executed the Heavy Metal survey in the overlapping area of the UltraVISTA (McCracken et al., 2012), COSMOS (Scoville et al., 2007), and COSMOS-DASH (Momcheva et al., 2017; Mowla et al., 2018) surveys, using the LRIS and MOSFIRE spectrometers on the Keck I Telescope. The UltraVISTA survey provides deep multi-wavelength photometry, while the F814W and F160W imaging from COSMOS and COSMOS-DASH reveals the rest-frame optical structures of distant galaxies. For our selection we used the COSMOS UltraVISTA v4.1 catalog by Muzzin et al. (2013b). Quiescent galaxies were identified by their rest-frame and colors (e.g., Wuyts et al., 2007; Williams et al., 2009). In this work, we use the criteria by Muzzin et al. (2013a).
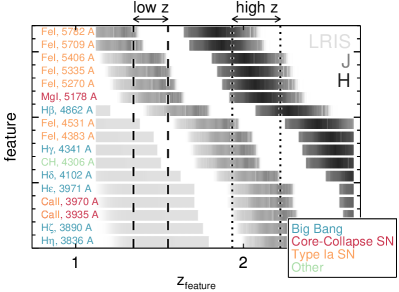
We select the targets to be at or . These specific redshift intervals are chosen such that we observe MgI at 5178 Å and several FeI and Balmer absorption lines in atmospheric windows, as illustrated in Figure 1. Furthermore, by using two redshift intervals, combined with deep spectroscopic surveys at lower redshifts, such as LEGA-C at (van der Wel et al., 2016, 2021), we can study evolutionary trends. For the galaxies we use LRIS-RED and MOSFIRE J-band to observe the 4000 Å break region and the region around MgI at 5178 Å, respectively. For the galaxies, we target these same regions with MOSFIRE in the J and H bands. We also obtained shallower spectra in the H and K band, for the low and high redshift masks, respectively, to obtain additional constraints on several emission lines (i.e., H, [NII]).
Both LRIS and MOSFIRE are among the most efficient spectrographs at their respective wavelengths. Nonetheless, even with unprecedented integration times, only the brightest galaxies are within reach. The galaxies are selected to be brighter than and the galaxies at are selected to be brighter than . These magnitudes limits, combined with the long integration times (see next section), ensure sufficient signal-to-noise ratios (S/N) to facilitate the anticipated science.
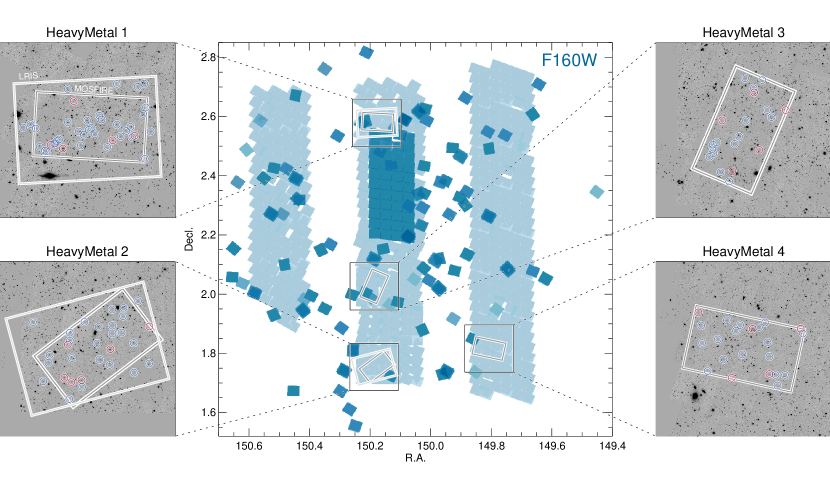
The large survey area enabled us to identify four pointings for which we observe at least bright five distant quiescent galaxies, simultaneously. Two pointings target galaxies at and the other two target galaxies at . In total, we have 21 primary targets. The four pointings are shown in Figure 2, in comparison to the photometric coverage in HST/WFC3-IR F160W. In Table 1 we list the mask parameters of all LRIS and MOSFIRE masks. This sample size is an improvement of an order of magnitude compared to the 2 galaxies at for which spectra of comparable depth and wavelength coverage were previously available (Kriek et al., 2006; Jafariyazani et al., 2020).
The remaining slits are placed on fainter quiescent and star-forming galaxies. We prioritize galaxies at similar redshift. For the Heavy Metal 3 and 4 masks, we also add quiescent galaxies at , though for these galaxies we lack of LRIS observations, which target the most prominent absorption lines for these redshifts.
2.2 Observing Strategy
The Heavy Metal survey was executed over 8 semesters, ranging from 2016B to 2021B. In total 26 nights were allocated, though half of the nights were lost due to bad weather or technical problems. The primary goal of the Heavy Metal Survey is to measure faint absorption lines, in particular around 5000 Å. This regions is targeted by MOSFIRE J-band and H-band for the and pointings, respectively. We require integration times of 12 and 16 hrs, respectively, for (J-band) and (H-band), and used our best imaging conditions for these observations. Second priority is the Balmer/4000 Å break region, which has more prominent features, and thus requires slightly shorter integration times. This region was observed for and hours, respectively, with LRIS and MOSFIRE J-band for the and pointings. Finally, for all four pointings we took shorter integrations (1-2 hours) of the wavelength regions around H, to assess whether the galaxies have any nebular line emission. This wavelength region is observed with MOSFIRE H-band and K-band for and , respectively. These observations were planned to be taken under our least favorable seeing conditions. In Table 1, we summarize the observing settings and integration times for all masks and filters.
The MOSFIRE slits were configured with a width of , and have a minimum length of 7. The LRIS slits were 1 wide, with a minimum length of 10. For all masks we used a minimum of 5 stars for the alignment. With MOSFIRE the galaxies were observed using an ABA′B′ dither pattern and with the longer LRIS slits we used an ABC dither pattern. Both dither patterns are preferred over an ABBA dither pattern as they result in better background subtraction and higher S/N (see appendix A in Kriek et al., 2016).
In all masks we observed at least one star in a slit. These “slit star” observations have three advantages. First, they enable us to monitor the seeing and possible drifts while observing. Second, the profiles and positions of the slit stars aided the data reduction, such that we could accurately register and weigh the individual science frames. Third, the slit star was used in the flux calibration, as explained in Kriek et al. (2016) and in the next section.
2.3 Data Reduction
The MOSFIRE data are reduced using a custom software package which was originally developed for the MOSDEF survey (Kriek et al., 2015). This package is all automated, working with a single parameter file input, indicating the mask and target name, directories to raw frames and mask files, filter to be reduced, and path and name of photometric catalog to be used for the flux calibration. The first step is to read in all headers and identify the science and calibration frames. Next, a master dome flat frame is made, which is used to correct all science frames for pixel-to-pixel sensitivity variations and to trace the edges of all spectra. Next, we do an initial background subtraction of all science frames, by subtracting the average of the previous and following frame. For the first and last science exposure, we only use one adjacent science frame as sky frame.
The next step is to derive the wavelength solution using bright isolated skylines. For this step we use the edge solutions from the master flat frame. This procedure is all automatic, as the position of the slit gives us a rough position of where to expect the skylines. For the -band we also use the arc lamp frames, allowing for an offset (i.e., flexure) between the skylines and the arc lines. The final ingredient for the rectification is the position of the galaxies in the spectra. The exact position is a combination of the assigned dither position and the observed drift (about 1 pixel per hour, see Kriek et al., 2015). We use the wavelength and edge solution to derive this position in all science frames for the slit star. Thus, for each frame we collapse the slit star spectrum along the wavelength direction and measure the position, full width at half maximum (FWHM) of the seeing, and throughput. This position, combined with the wavelength and edge solutions, now gives us a transformation from the raw to the reduced frame for each science exposure.
Using the transformations derived in the previous step, we now perform an additional background subtraction on the (non-rectified) science frames. We do this step before resampling, so we can better model the remaining sky. We run L.A. Cosmic (van Dokkum, 2001) on the cleaned frames and combine the cosmic ray map with the available MOSFIRE bad pixel map. The “cleaned” frames are now resampled to the final frame in a single transformation. We apply this same transformation to the sky and mask frames for each science exposure. Finally, we combine all science frames for each galaxy and filter, while weighing the frames using the throughput and seeing, and excluding all masked pixels. We also make a final weight map for each object and filter, as well as two noise frames, one based on the frame-to-frame variations and one on the sky and read-out noise. For more details on these steps, see Kriek et al. (2015).
All spectra are calibrated for the relative response using telluric standards. Instead of observing new telluric standards for each science exposure, we make use of the library collected by the MOSDEF survey. For each mask and filter we construct a response spectrum from multiple telluric standards observed at similar airmass, combined with the stellar spectrum of a star of the same spectral type. The telluric spectra are reduced using a similar procedure as the science spectra. See Kriek et al. (2015) for more information on the construction of the response spectra and the motivation for using this procedure.
Lastly, we generate one-dimensional (1D) science and error spectra for both primary and filler targets through an optimal weighing technique, as outlined by Horne (1986), followed by absolute flux calibration. Our employed MOSDEF software initially conducts absolute flux calibration for each galaxy by applying a scaling factor which is derived by comparing the 1D spectrum of a slit star to its integrated photometry. This step effectively performs a slit-loss correction for point sources. However, for all primary galaxies we detect the stellar continuum and thus we directly scale the spectra to their respective broadband photometry (see Sect. 3.1).
For the LRIS reduction we follow a similar procedure as for the MOSFIRE spectra. The only major difference is the calibration, as we do not have a library of telluric standards. To correct for atmospheric transmission features, we use the slit star spectrum combined with a theoretical sky spectrum. Furthermore, we calibrate each 1D science spectrum individually using the photometric data in the overlapping wavelength regime. See Kriek et al. (2019) for more information.
2.4 Data Overview
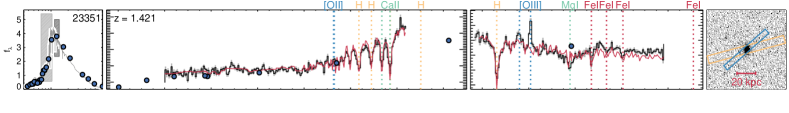
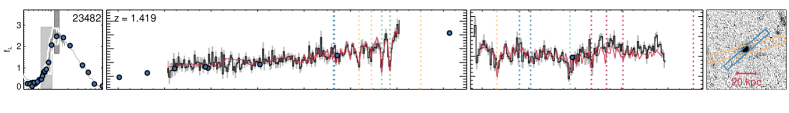
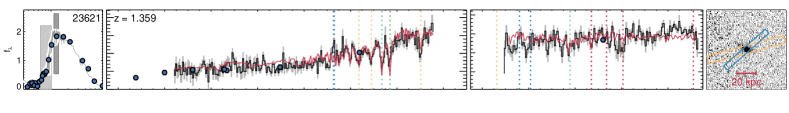
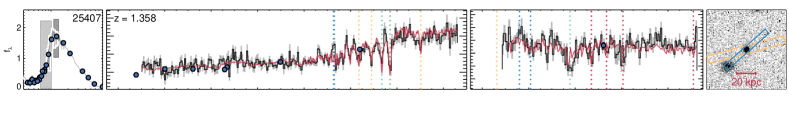
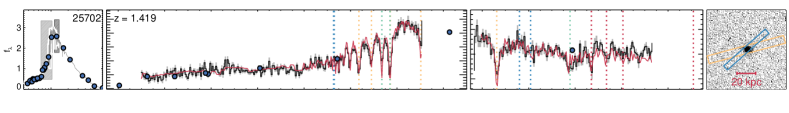
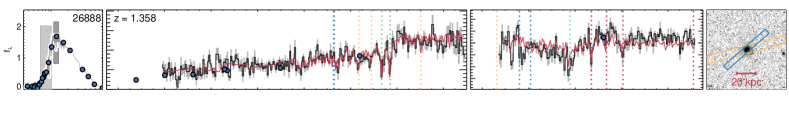
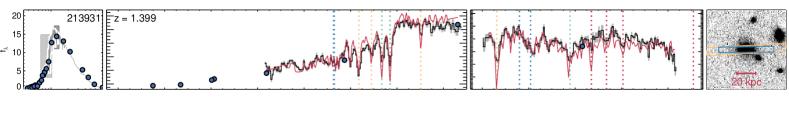
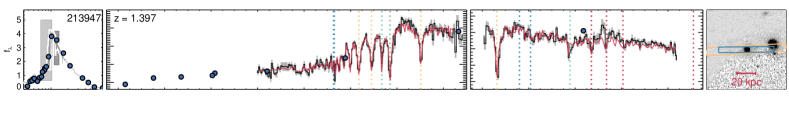
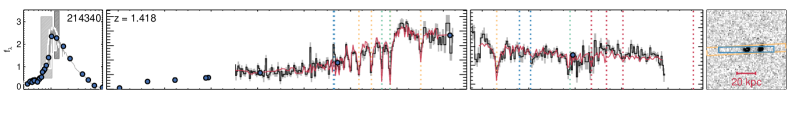
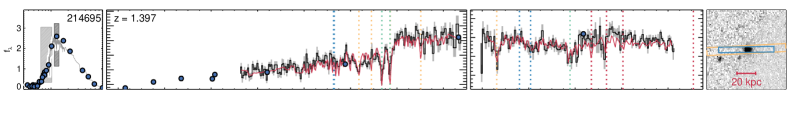
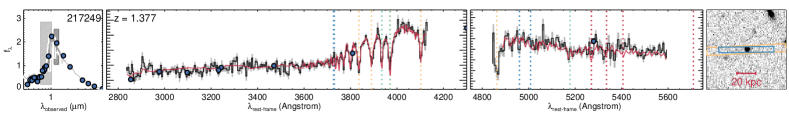
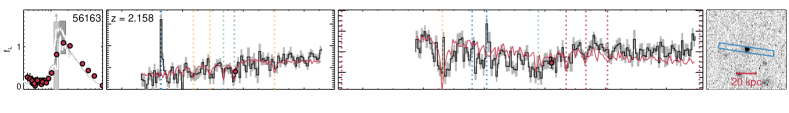
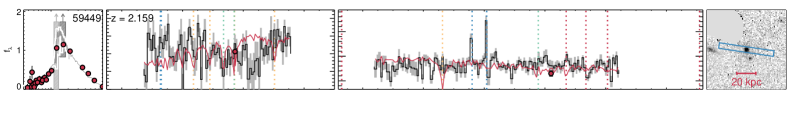
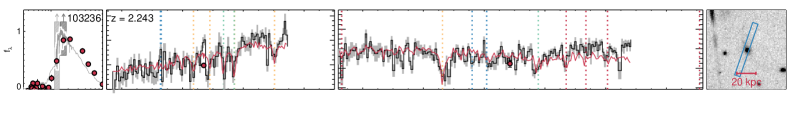
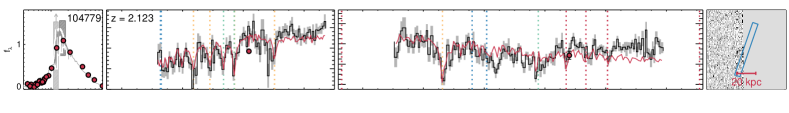
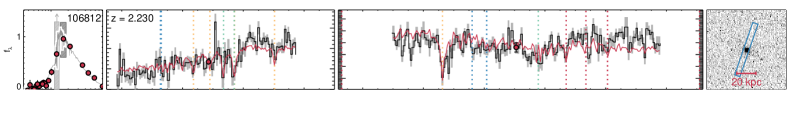
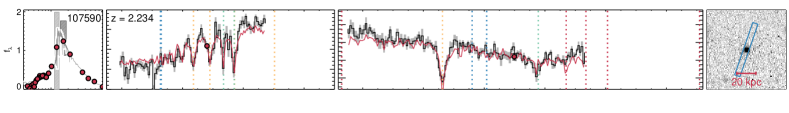
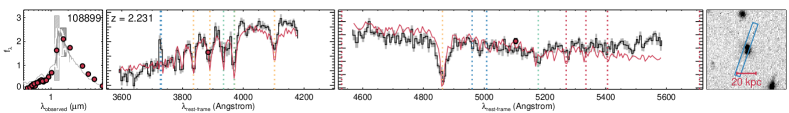
In Figures 3 and 4 we present an overview of the UltraVISTA photometric SEDs (Muzzin et al., 2013b) (left column), 1D spectra (middle two columns), and the F160W image from COSMOS-DASH (Mowla et al., 2018; Momcheva et al., 2017) for all primary targets. The position of the LRIS (yellow) and MOSFIRE (blue) slits are shown in the images as well.
Figure 3 shows the galaxies in Heavy Metal 1 and 2, targeting . For these two masks, we show the LRIS and MOSFIRE J-band spectra, all shifted (in wavelength only) to rest frame. We observe multiple Balmer absorption lines (yellow dotted lines) and the two CaII lines (green) around 4000 Å for all 11 galaxies. Most galaxies also show clear MgI and several FeI lines (red) in their MOSFIRE spectra. None of the targets show Balmer emission lines in their LRIS and MOSFIRE-J spectra. Nonetheless, three galaxies have either [O ii] or [O iii] in emission. We will further discuss these emission lines in Section 4.
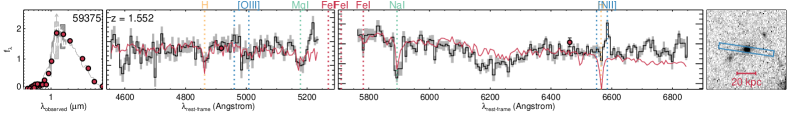
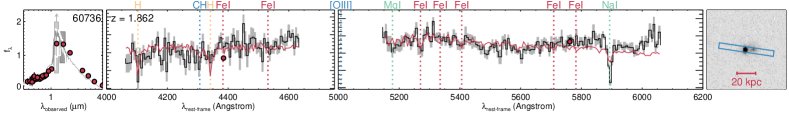
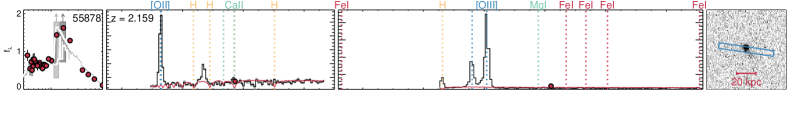
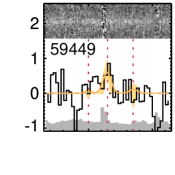
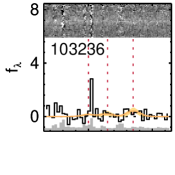
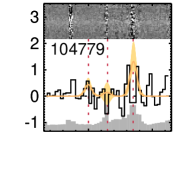
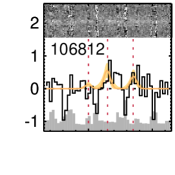
Figure 4 shows the primary quiescent galaxies at targeted by the Heavy Metal 3 and 4 masks. Instead of LRIS and MOSFIRE J-band, we now show MOSFIRE J-band and H-band in the middle two columns. Two of the primary targets (59375 and 60736) scatter out the intended redshift regime (), and thus their spectra do not cover all targeted absorption lines. Nonetheless, we detect additional absorption lines, such as Na for these galaxies.
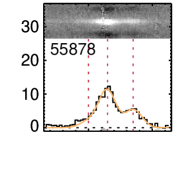
Considering the remaining eight targets, six of them show several Balmer absorption and metal lines in their spectra. Two galaxies, 55878 and 59449, do not show any clear absorption lines, but their emission lines do reveal their redshifts. Galaxy 55878 has strong asymmetric emission lines, most likely originating from an AGN, and no absorption lines are detected. This galaxy will be discussed in detail in Ma et al. (in prep). Galaxy 59449 shows two [O iii] emission lines in its spectrum, but no absorption lines are detected. We would have expected to detect some continuum features and thus, the line and continuum emission may not originate from the same galaxy. However, we could not identify a redshift solution just from the continuum emission.
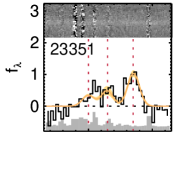
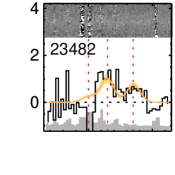
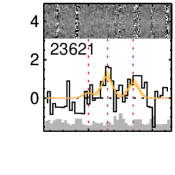
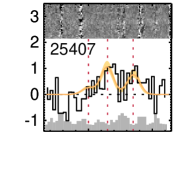
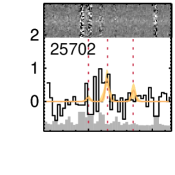
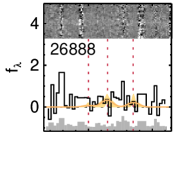
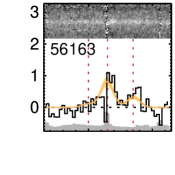
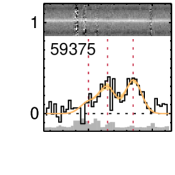
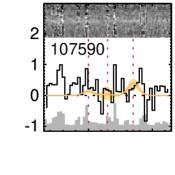
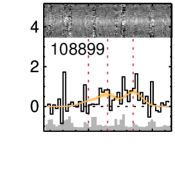
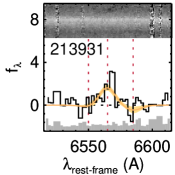
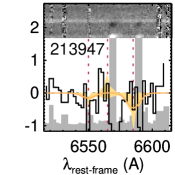
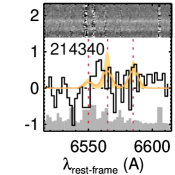
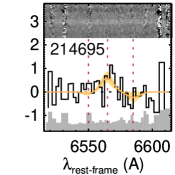
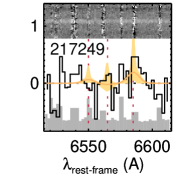
In Figure 5, we present spectra in the H region for all primary targets. To illustrate whether H is detected, we zoom in on a small wavelength region and show the continuum subtracted 1D spectra (see Sect. 3.2). This spectral range does not encompass critical absorption features; these observations were taken to assess whether the galaxies have any H emission. Hence, the spectra acquired in this band are shallower compared to the deeper spectra shown in Figures 3 and 4 (refer to Table 1 for details). It is worth noting that the spectrum of 59375 is significantly deeper, as H falls within the H-band, where ultra-deep observations were conducted, rather than the K-band. Galaxy 60736’s spectrum is not included, as there is no coverage of H.
Except for 55878 (AGN), none of the galaxies exhibits strong H emission in their 2D or 1D spectra. Nonetheless, several galaxies show very faint H and [N ii] emission lines, in particular after the continuum removal, as this step corrects for the underlying Balmer absorption feature. In Section 3.2 we describe our methodology to measure all H lines in order to derive constraints on the star formation rates (SFRs).
| ID | Coordinates | Observed | Rest-frame | SPS fitting parameters | ||||||
|---|---|---|---|---|---|---|---|---|---|---|
| R.A. | Decl. | magnitude | colors | log 111Typical uncertainty on stellar mass is 0.1 dex. | log SFRcont222Typical uncertainty on SFR is 0.2 dex. | 333Typical uncertainty on is 0.1 mag. | ||||
| (hh:mm:ss) | (dd:mm:ss) | M⊙/yr | ||||||||
| HM1-213931 | 10:00:48.02 | 02:33:42.95 | 19.2 | 1.399 | 1.78 | 0.97 | 11.63 | -1.17 | 0.0 | |
| HM1-213947 | 10:00:50.68 | 02:33:55.37 | 20.8 | 1.397 | 1.42 | 0.55 | 10.87 | -0.31 | 0.0 | |
| HM1-214340 | 10:00:37.09 | 02:34:10.28 | 21.2 | 1.418 | 1.48 | 0.78 | 10.80 | -0.47 | 0.0 | |
| HM1-214695 | 10:00:32.28 | 02:34:25.12 | 21.1 | 1.397 | 1.87 | 0.95 | 11.06 | -0.48 | 0.0 | |
| HM1-217249 | 10:00:45.62 | 02:36:19.30 | 21.4 | 1.377 | 1.40 | 0.47 | 10.61 | -0.24 | 0.0 | |
| HM2-23351 | 10:00:48.44 | 01:43:24.74 | 20.7 | 1.421 | 1.59 | 0.72 | 10.99 | -0.66 | 0.0 | |
| HM2-23482 | 10:00:46.19 | 01:43:31.31 | 21.1 | 1.419 | 1.73 | 1.16 | 11.15 | -0.07 | 0.0 | |
| HM2-23621 | 10:00:49.95 | 01:43:38.67 | 21.5 | 1.359 | 1.87 | 1.34 | 11.05 | -0.17 | 0.2 | |
| HM2-25407 | 10:00:39.85 | 01:45:12.98 | 21.5 | 1.358 | 1.62 | 0.92 | 10.70 | -0.34 | 0.0 | |
| HM2-25702 | 10:00:49.20 | 01:45:27.47 | 21.1 | 1.419 | 1.48 | 0.65 | 10.85 | -0.42 | 0.0 | |
| HM2-26888 | 10:00:31.30 | 01:46:27.80 | 21.6 | 1.358 | 1.97 | 1.03 | 10.93 | -1.09 | 0.0 | |
| HM3-103236 | 10:00:47.18 | 01:59:19.56 | 21.7 | 2.243 | 2.05 | 1.25 | 11.13 | -1.06 | 0.2 | |
| HM3-104779 | 10:00:41.29 | 02:00:30.36 | 21.4 | 2.123 | 1.48 | 0.81 | 11.01 | -0.64 | 0.0 | |
| HM3-106812 | 10:00:49.42 | 02:02:07.23 | 21.6 | 2.230 | 1.65 | 0.79 | 11.07 | -1.13 | 0.0 | |
| HM3-107590 | 10:00:35.45 | 02:02:41.24 | 21.3 | 2.234 | 1.28 | 0.54 | 11.07 | -0.11 | 0.0 | |
| HM3-108899 | 10:00:42.38 | 02:03:39.19 | 20.7 | 2.231 | 1.51 | 0.77 | 11.28 | 0.10 | 0.0 | |
| HM4-55878 | 09:59:16.40 | 01:47:23.18 | 21.0 | 2.159 | 1.29 | 0.45 | 11.16 | 1.75 | 1.0 | |
| HM4-56163 | 09:59:08.14 | 01:47:35.96 | 21.4 | 2.158 | 1.63 | 1.00 | 11.08 | -0.19 | 0.0 | |
| HM4-59375 | 09:59:11.82 | 01:50:04.61 | 20.9 | 1.552 | 2.28 | 1.27 | 11.18 | -6.12 | 0.0 | |
| HM4-59449 | 09:59:01.28 | 01:50:04.84 | 21.4 | 2.159 | 1.39 | 0.89 | 11.10 | -0.56 | 0.0 | |
| HM4-60736 | 09:59:23.74 | 01:59:58.44 | 21.2 | 1.862 | 1.53 | 0.80 | 10.88 | -0.30 | 0.0 | |
3 Methodology
In this section, we outline the methods we employed to determine the spectral, photometric, and structural properties of the Heavy Metal galaxies. We begin by deriving the spectroscopic redshifts, emission-line fluxes, stellar population characteristics, and rest-frame colors for both the primary and filler galaxies (Sect. 3.1). In Section 3.2, we detail our approach to measuring the H emission line fluxes and subsequently calculating the star formation rates (SFRs) for our primary, quiescent targets. Lastly, in Section 3.3, we present the methodology used to derive the galaxy structures and estimate dynamical masses for the primary Heavy Metal galaxies.
3.1 Redshifts and stellar population properties
For all primary quiescent galaxies, we derive a spectroscopic redshift and stellar population properties by simultaneously fitting the spectra and the UltraVISTA photometry with the Flexible Stellar Population Synthesis models (FSPS; Conroy et al., 2009; Conroy & Gunn, 2010). We assume an exponentially delayed star formation history, the average Kriek & Conroy (2013) dust attenuation law, and the Chabrier (2003) initial mass function (IMF). We use a custom version of the fast fitting code (Kriek et al., 2009), in which the automatic scaling of the spectra to the photometry has been improved444In the original fast release, the spectra were scaled to the photometry by convolving the spectra (in ) by the transmission curve of the overlapping filters. However, the MOSFIRE spectra only partially overlap with the filter curves, and thus this method does not work for most galaxies. Instead, the spectra, similar to the photometry, were scaled to the models using least-square scaling.. To facilitate comparison with the full galaxy distribution from which the galaxies are selected, we assume solar metallicity. fast does not fit for the absorption line broadening, and thus we fit binned spectra.
For galaxy HM4-55878 the emission lines are very strong and affecting the broadband spectral shape. Thus, for this galaxy we first correct the photometry for the emission line fluxes (see Sect. 5). Furthermore, we mask the wavelength regions affected by emission lines while fitting. The strong lines also affect the absolute calibration of our spectra, and our default method does not work (see Sect. 2.3). Instead, for this galaxy we use the filter curves and integrated broadband magnitudes, corrected for the partial overlap between the spectra and filter curve.
The resulting best-fit redshifts, stellar masses, star-formation rates (SFRs), and magnitudes of dust attenuation () are listed in Table 1. The typical uncertainties on the stellar mass, SFR, and are 0.1 dex, 0.2 dex, and 0.1 mag, respectively. These uncertainties include the flux uncertainties as well as variations in the various assumptions (except for the IMF) and the stellar population synthesis model (fsps; Bruzual & Charlot, 2003; Maraston, 2005). The best-fit models are shown in Figures 3 and 4. For displaying purposes, we show the original models convolved to the velocity dispersion of the spectra, as derived by A. Beverage et al. (in prep.).
While most stellar continuum fits look reasonable, there are a few exceptions. First, for HM1-213931 the fit is quite poor, probably because it is a blended spectrum of multiple galaxies, which have a velocity offset. Though we cannot deblend the spectra of the sources, we find a different spectrum when assuming different weighing profiles for the extraction (see A. Beverage et al. in prep for more information on the implications). For HM4-59449 we do not see any clear absorption lines, and the redshift is based on the faint [O iii] emission lines.
For the filler galaxies, we derive spectroscopic redshifts by fitting the emission lines. The majority of the filler targets show multiple emission lines, resulting in robust spectroscopic redshifts. For the masks, we observed different filler galaxies for the LRIS and MOSFIRE masks. This strategy results in a larger number of filler galaxies, but lower success rate of confirming the spectroscopic redshift. For the masks, we use the same filler galaxies in the different settings, and thus had more wavelength coverage to detect possible spectral features.
Finally, for all galaxies in the observed Heavy Metal masks we determine rest-frame , , and colors using the EAY (Brammer et al., 2008) code. When available, we assume the spectroscopic redshift, otherwise we adopt the photometric redshifts provided by (Muzzin et al., 2013b). Each rest-frame magnitude is determined individually, using a fit to just the surrounding photometric datapoints. Hence, the colors are not based on the best-fit stellar population model to the full spectrum.
| ID | SFRHα | [N ii]/H | |
|---|---|---|---|
| erg s-1 cm-2 | M⊙/yr | ||
| HM1-213931 | |||
| HM1-213947 | — | ||
| HM1-214340 | — | ||
| HM1-214695 | — | ||
| HM1-217249 | — | ||
| HM2-23351 | |||
| HM2-23482 | |||
| HM2-23621 | |||
| HM2-25407 | |||
| HM2-25702 | — | ||
| HM2-26888 | — | ||
| HM3-103236 | — | ||
| HM3-104779 | — | ||
| HM3-106812 | — | ||
| HM3-107590 | — | ||
| HM3-108899 | |||
| HM4-55878 | |||
| HM4-56163 | |||
| HM4-59375 | |||
| HM4-59449 | — | ||
| HM4-60736 | — | — | — |
| ID | F814W structural properties | F160W Structural properties555Adopted from Cutler et al. (2022). | log 666Stellar masses corrected for the total magnitude difference between the photometric catalog and Galfit. | 777Adopted from A. Beverage et al. (in prep.) | log | |||||
| @ 5000 Å | km s-1 | |||||||||
| kpc | kpc | kpc | ||||||||
| HM1-213931 | 3.720.17 | 5.7 | 0.75 | 3.790.17 | 4.3 | 0.88 | 3.760.22 | 11.35 | ||
| HM1-213947 | 0.810.01 | 2.1 | 0.75 | 0.57888Bad Galfit fit | 6.0 | 0.95 | 0.690.04 | 10.73 | ||
| HM1-214340 | 3.160.17 | 3.7 | 0.76 | 2.130.11 | 2.4 | 0.78 | 2.460.16 | 10.81 | ||
| HM1-214695 | 1.990.11 | 2.3 | 0.83 | 1.940.14 | 2.5 | 0.98 | 1.960.16 | 11.02 | ||
| HM1-217249 | 0.590.01 | 2.4 | 0.57 | 0.600.02 | 1.3 | 0.56 | 0.590.03 | 10.60 | ||
| HM2-23351 | 1.820.03 | 2.2 | 0.31 | 1.580.05 | 2.3 | 0.34 | 1.660.09 | 10.96 | ||
| HM2-23482 | 2.160.10 | 2.2 | 0.69 | 3.25 0.33 | 5.5 | 0.71 | 2.800.23 | 11.11 | ||
| HM2-23621 | 5.620.31 | 1.5 | 0.36 | 3.750.24 | 1.7 | 0.40 | 4.420.29 | 10.98 | ||
| HM2-25407 | 1.360.14 | 5.3 | 0.95 | 1.420.08 | 1.7 | 0.73 | 1.400.10 | 10.66 | ||
| HM2-25702 | 1.460.12 | 5.8 | 0.74 | 1.410.08 | 3.9 | 0.79 | 1.430.10 | 10.84 | ||
| HM2-26888 | 2.340.27 | 2.9 | 0.75 | 2.460.19 | 4.1 | 0.89 | 2.410.20 | 10.94 | ||
| HM3-103236 | — | — | — | 2.41c | 2.6 | 0.58 | 2.360.59 | 11.08 | ||
| HM3-104779 | — | — | — | — | — | — | — | — | — | |
| HM3-106812 | — | — | — | 3.640.63 | 5.8 | 0.70 | 3.580.65 | 11.14 | ||
| HM3-107590 | — | — | — | 1.000.07 | 4.3 | 0.83 | 0.980.09 | 11.05 | ||
| HM3-108899 | — | — | — | 3.460.17 | 3.6 | 0.51 | 3.400.24 | 11.25 | ||
| HM4-55878 | — | — | — | 2.360.21 | 3.4 | 0.67 | 2.340.24 | 11.20 | — | — |
| HM4-56163 | — | — | — | 3.55c | 6.0 | 0.93 | 3.510.88 | 11.05 | ||
| HM4-59375 | — | — | — | — | — | — | — | — | — | |
| HM4-59449 | — | — | — | — | — | — | — | — | — | — |
| HM4-60736 | — | — | — | 1.580.05 | 2.0 | 0.44 | 1.620.10 | 10.70 | ||
3.2 H star formation rate measurements
For the primary quiescent targets we measure the H emission line flux. We use the best-fit stellar population model, convolved to the best-fit velocity dispersion, as the continuum model. This approach ensures that we incorporate the underlying Balmer absorption. To derive the fluxes and correct for emission-line blending, we fit H and the two [N ii] at 6548 Å and 6584 Å, simultaneously. For our model spectrum, we use three Gaussians with the same velocity dispersion and a fixed ratio between the two [N ii] lines of a factor of 3. The redshift is fixed to the best-fit absorption line redshift. If none of the lines are clearly visible, the velocity dispersion of the emission lines cannot exceed the stellar velocity dispersion by more than 1 . The minimum allowed velocity dispersion is set by the spectral resolution.
We derive the uncertainties on the emission-line flux measurements using Monte Carlo simulations. We make 500 realizations of the spectrum around H, by perturbing the fluxes following the error spectrum. For each realization we fit all three lines using the same method as for the actual spectrum. We derive the 16% and 84% confidence intervals on the emission-line fluxes from the resulting distribution. In Figure 5 we show these fits and confidence intervals for all 20 galaxies with coverage of H. For galaxies that do not have a 3 detection for H, we derive the 3 upper limit. All values are given in Table 3.
For galaxy 213947 we have to do additional masking to derive the H flux, as the 2D spectrum partially overlaps with the (negative) spectrum of a close galaxy. This nearby galaxy only has emission lines and no continuum emission, and thus only a small wavelength range is affected. Thus, for this galaxy, we mask the wavelengths that are contaminated by the emission lines of the nearby galaxy.
We convert the integrated H flux to the integrated luminosity using the spectroscopic redshift. In order to correct this line for dust attenuation, we ideally would use the Balmer decrement (H/H). However, with the exception of 55878, H is too faint to yield a useful Balmer decrement measurement, and thus we use the stellar attenuation for the dust correction instead. We do note, however, that nearly all galaxies have a best-fit . For 55878, we do use the Balmer decrement (H/H=4.43) for the dust correction. Finally, we adopt the conversion by Kennicutt (1998) for solar metallicity and a Kroupa (2001) IMF (which is comparable to the Chabrier, 2003, IMF) to derive SFRs for all galaxies with H coverage (see Table 3). The majority of the galaxies do not have detected H emission and thus we derive a 3 upper limit on the SFR.
Two galaxies stand out in Figure 5. First, galaxy 55878 has very strong emission lines and we will further discuss this galaxy in Sect. 4.2). Second, HM4-59375 stands out, as despite the low H flux and resulting SFR, the galaxy has significantly detected emission lines. For this galaxy the spectrosopic redshift of is significantly lower than the photometric redshift used in the selection. Hence, H does not fall in the K-band, as the other galaxies in its targeted redshift regime, but in the H-band for which the observations are significantly deeper. For galaxy 60736, the spectroscopic redshift falls outside the selection window, and thus we have no coverage of the H wavelength regions (see Fig. 1). Hence, this galaxy is missing from Figure 5.
3.3 Structural Measurements and Dynamical Masses
The Heavy Metal pointings overlap with the COSMOS/ACS-F814W (Scoville et al., 2007) and the COSMOS-DASH/WFC3-IR-F160W imaging (Momcheva et al., 2017; Mowla et al., 2018; Cutler et al., 2022), enabling structural measurements. We derive galaxy sizes from the F814W images by fitting single-component Sérsic models with Galfit (Peng et al., 2002), following the technique described in Beverage et al. (2021). For the COSMOS-DASH imaging, we adopt the structural measurements by Cutler et al. (2022).
For the galaxies we use both the F814W and F160W structural parameters in our analyses, listed in Table 4. We derive the structural parameters (, , ) at rest-frame 5000 Å using interpolation. For HM1-213947, the F160W image results in a bad Galfit fit, and thus for this galaxy we only use F814W. We use Equation 1 by van der Wel et al. (2014) to correct the size to rest-frame 5000 Å. For the galaxies we only use the F160W measurements, as these galaxies are not or barely detected in F814W. We also correct these size measurements, standardizing them to the rest-frame 5000 Å wavelength (see Table 4), following van der Wel et al. (2014). These corrections are generally subtle, fluctuating within the range of -0.01 to 0.009. For three galaxies no F160W size measurements were available, as either the fit failed or there was no coverage. For two additional galaxies, the fit was qualified as “bad”. We nonetheless use these structural measurements in the subsequent analysis, while flagging these galaxies in the figures. For galaxies without given uncertainties, we adopted uncertainties of 25%, 1.0 and 0.1 for , , and , respectively.
We also use the Galfit parameters to refine our stellar mass measurements and ensure their consistency with other structural measurements. For this refinement process we derive a mass correction factor by comparing the integrated magnitude from Galfit with the magnitude from the corresponding filter band in the photometric catalog. For the F814W and F160W filters, which are absent from the UltraVISTA catalog by (Muzzin et al., 2013b), we compute their magnitudes by integrating the best-fit fast model using the respective filter curves. For the galaxies we combine the correction factors from F160W and F814W following their proximity to rest-frame 5000 Å. The Galfit magnitudes are typically fainter than the catalog magnitudes by 0.094, resulting in an average mass correction of -0.038 dex. However, for some galaxies, in particular blended systems, such as HM1-213931, the mass corrections can be as large as -0.28 dex. The corrected masses () for the galaxies with structural measurements are listed in Table 4.
The Heavy Metal spectra yield velocity dispersion measurements () for all but two galaxies, as described in our accompanying paper by A. Beverage et al. (in prep). These measurements are derived using the absorption line fitter (alf) code (Conroy & van Dokkum, 2012; Choi et al., 2016; Conroy et al., 2018). Beverage et al. (2023) shows that the alf velocity dispersions are in perfect agreement with those found by ppxf (Cappellari & Emsellem, 2004) for a large sample of quiescent sample of galaxies. We increase the measured velocity dispersion measurements () by 4% to obtain the velocity dispersion within 1 () (see van de Sande et al., 2013).
The velocity dispersions and structural measurements together enable an estimate of the dynamical mass. We still have a poor understanding of the internal stellar dynamics within these galaxies. A few resolved investigations of three lensed distant quiescent galaxies have hinted at the presence of rotational support to varying degrees (Newman et al., 2015, 2018a; Toft et al., 2017). Nonetheless, due to our limited knowledge and to facilitate comparison with similar works, here we define dynamical mass as
| (1) |
with , the virial constant for a spherical isotropic model described by profile for different values of the Sérsic index (Cappellari et al., 2006). For we take the circularized radius () at rest-frame wavelength of 5000 Å. The resulting dynamical masses are listed in Table 4.
4 Results
While quiescent galaxies have been studied extensively throughout cosmic time, the majority of these investigations have relied on photometric data. The absence of spectroscopic information may lead to biases in our photometric redshifts, stellar masses, and stellar population properties. Consequently our studies of the build up and growth of galaxies over cosmic time may be biased as well. The Heavy Metal Survey provides redshifts for a significant sample of distant quiescent galaxies, resulting in more accurate stellar population properties. Additionally, the presence of absorption lines facilitates kinematic and chemical composition studies, while emission lines offer an alternative avenue for examining their star formation characteristics. In Section 4.1 we examine our galaxy sample and compare it with the parent galaxy sample from which the spectroscopic sample was drawn. In Section 4.2 we present the star formation properties of the primary Heavy Metal galaxies and assess whether they indeed have quiescent stellar populations. Moving to Section 4.3, we discuss their structural properties, and finally, in Section 4.4 we compare the stellar masses to the dynamical masses.
4.1 Galaxy sample and success rate
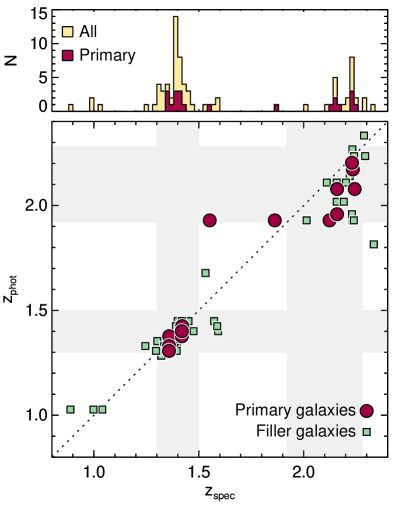
Our primary galaxy sample is selected to have quiescent stellar populations, be relatively bright, and fall in two redshift intervals, and . In Figure 6 we show the photometric versus spectrospic redshifts of the primary (circles) and filler (squares) galaxies, as well as the distribution of the spectroscopic redshifts. Most primary galaxies fall in or very close to the selection windows and their photometric and spectrscopic redshifts agree well with a normalized median absolute deviation in of . The only exception is HM4-59375, which has a significantly lower redshift than predicted by the photometry. This figure also shows the filler galaxies. These galaxies are drawn from a larger redshift distribution, though galaxies at similar redshifts were prioritized. The scatter for the filler galaxies is slightly larger with a , which may be explained by their fainter magnitudes.
The histogram in Figure 6 shows that the spectroscopic redshifts of the primary and filler targets are clustered, and several potential overdensities may exist, specifically at (HM1), (HM2), (HM4), and (HM3). This finding is not surprising, as we specifically selected pointings for which we can observe multiple quiescent galaxies in one field of view. A further investigation into these overdensities is beyond the scope of this paper. Nevertheless, when interpreting our results, it is important to keep in mind that the environments in which our galaxies reside may not be typical for distant quiescent galaxies.
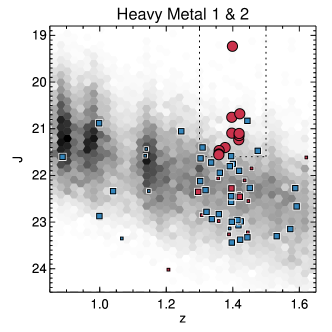
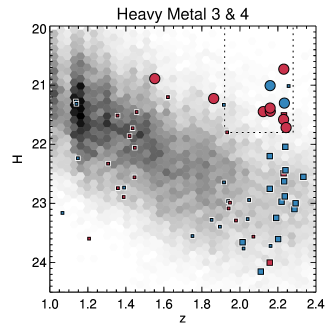
In Figure 7 we show all primary and filler targets in magnitude-redshift and rest-frame vs. space. The left panels show the galaxies in Heavy Metal 1 and 2, while the right panels show galaxies in Heavy Metal 3 and 4. The boxes in the top panels, enclosed by the dotted lines, indicate the primary target selection in terms of magnitude and redshift. In contrast to Figure 6, here we show both the confirmed filler galaxies (large squares) and the filler galaxies for which we did not measure a spectroscopic redshift (small squares). The top-left box in the bottom panels, enclosed by the solid lines, indicates our quiescent galaxy selection (red symbols; Muzzin et al., 2013a). Galaxies outside the box are generally identified as star-forming galaxies (blue symbols).
While we measure spectroscopic redshifts of all primary targets, for the filler targets the success rate is lower with 71% (42/59) and 53% (17/32) for the masks and masks, respectively. There are several reasons for the lower success rate of the fillers. First, for Heavy Metal 1 and 2, most fillers are only targeted by either MOSFIRE or LRIS. Second, many fillers are faint quiescent targets, for which we do not detect clear absorption lines. The few faint quiescent fillers that are confirmed, all have emission lines in their spectra. However, in the Heavy Metal 3 and 4 masks, there are several quiescent filler targets at which are as bright as the faintest primary targets. Unfortunately, we do not capture the 4000 Å region crucial for spectroscopic redshift measurements for these galaxies. Finally, for several star-forming fillers, the emission lines may be outside the atmospheric windows. For example, we find no confirmed star-forming galaxies below in the Heavy Metal 3 and 4 masks.
Based on the photometric redshifts, all primary targets were initially selected to be quiescent. However, when re-deriving the rest-frame colors using the spectroscopic redshifts, two of the primary targets (HM3-107590 & HM4-55878) just shift outside the quiescent box. Given their location though, we expect these galaxies to be post-starburst or young quiescent galaxies (e.g., Whitaker et al., 2012; Belli et al., 2019; Suess et al., 2021; Park et al., 2023), and thus still have quiescent populations. We will further assess their star-formation properties in the next section.
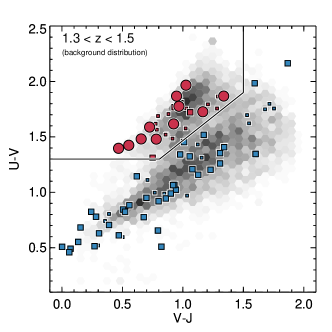
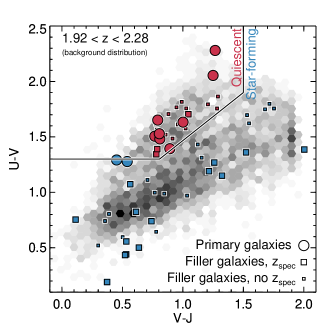
Finally, we compare our primary galaxies to the parent galaxy distributions at and from which the targets are drawn. At the primary targets do sample nearly the full distribution along the quiescent sequence, though there is a bias toward bluer colors. The quiescent galaxies at span a larger range along the quiescent sequence, but on average are also biased toward the bluer and younger systems. This bias is expected, as our bright magnitude limit favors galaxies with lower mass-to-light ratios (), which are generally bluer and younger. Obtaining a more representative sample would require significantly longer integration times and larger surveys, and thus necessitates more efficient telescopes and spectrographs, such as NIRSpec on JWST.
4.2 Star formation constraints
All primary Heavy Metal galaxies are selected to have quiescent stellar populations, based on their rest-frame colors. In this section we assess whether these galaxies indeed have low SFRs using both the stellar continuum emission and their emission-line properties.
The SFRs derived from fitting the stellar spectra and photometry with SPS models are listed in Table 2. Except for HM4-55878, all primary galaxies have best-fit SFRs of . HM4-55878 has a significantly higher SFR than expected based on its colors and the initial photometric analysis. This disparity is attributed to the influence of strong emission lines on the broadband SED. In our fitting procedure, we first adjusted the broadband photometry to account for the impact of these lines, as outlined in Section 3.1.
When examining the H SFRs, we find a similar result. With the exception of HM4-55878, the primary galaxies exhibit either very faint or undetectable H emission. Among the 9 galaxies where H is detected at , 7 display [N ii]/H ratios exceeding 0.45, implying that star formation is likely not the primary ionization source (e.g., Baldwin et al., 1981; Kauffmann et al., 2003; Kewley et al., 2006). Our study supports previous findings that high [N ii]/H ratios are common in distant quiescent galaxies (e.g., Kriek et al., 2007; Newman et al., 2018b; Belli et al., 2017b). Although such line ratios are commonly associated with photoionization by active galactic nuclei (AGN; e.g., Kauffmann et al., 2003; Kewley et al., 2006), in quiescent galaxies, they are thought to originate from the photoionization by hot evolved stars, including post-asymptotic giant branch stars (e.g., Yan & Blanton, 2012; Belfiore et al., 2016). For the majority of the galaxies, we do not have a meaningful measurement of [O iii]/H, and thus we cannot further assess the origin of the line emission in our sample. Only HM-55878 has a significant detection for all lines, with its line ratios suggesting an AGN (Ma et al. in prep.). HM1-213931 and HM4-56163 have [N ii]/H, and thus star formation is likely the dominant ionization source. These galaxies have low SFRs of 4-5 , but the uncertainties are significant. For HM1-213931 we also do not see a clear emission line in the 2 D spectrum (see Fig. 5).
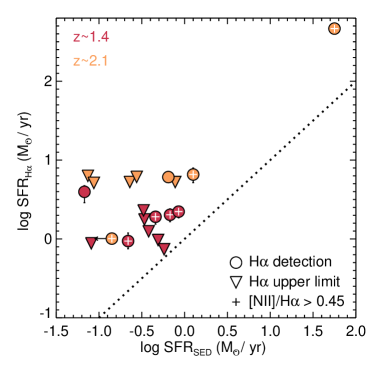
In Figure 8 (left panel) we compare the two SFR measurements. For consistency, both measurements assume solar metallicity and a similar IMF (Kroupa vs. Chabrier). For galaxies that have no detected H emission, we show the 3 upper limit (triangles). For galaxies with detected H, we mark the ones for which star formation is not the primary ionization mechanism by a plus. For these galaxies the SFRs are overestimated, and the values should been regarded as upper limits. Additional attenuation toward H ii regions, however, could potentially have resulted in an underestimation of the H SFRs, as indicated by the arrow (right panel).
Figure 8 shows that all SFR upper limits from H are not inconsistent with the SED SFRs. The galaxies for which H does not originate from star formation are all located above the 1-to-1 line as well. Only for HM1-213931 and HM4-56163, for which H is thought to originate from star formation, the two SFRs are inconsistent. HM1-213931 seems to be a merger between several galaxies (see Fig. 3), and thus it may not be surprising to find a low SFR of yr-1. In particular, different physical regions for the stellar and nebular components may explain the discrepant values. The low [N II]/H ratio implies low metallicity, which makes it more likely that the star formation is either fueled by low-metallicity infalling gas or associated with a nearby smaller galaxy. Belli et al. (2017b) find similarly low-levels of (metal-poor) star formation activity in distant quiescent galaxies, which they attribute to rejuvenation events due minor mergers or inflowing gas. Higher spatial resolution spectra will be needed to examine the different components and further assess this galaxy.
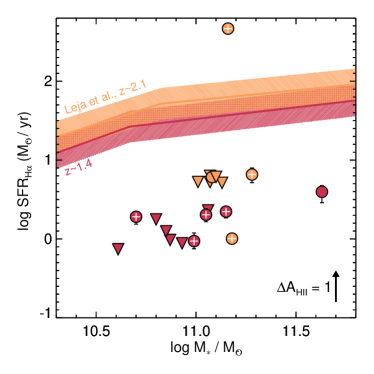
In the right panel of Figure 8 we show the H SFRs vs stellar mass, in comparison the star-forming main sequence (ridge) from Leja et al. (2022) at similar redshifts (and for a similar IMF). Except for AGN HM4-55878, all primary quiescent targets are significantly below the star-forming main sequence at its redshift. Furthermore, the majority of these data points are upper limits, either because H is undetected, or because H is not originating from star formation. Hence, except for HM4-55878, all galaxies have indeed strongly suppressed star formation.
4.3 Galaxy structures
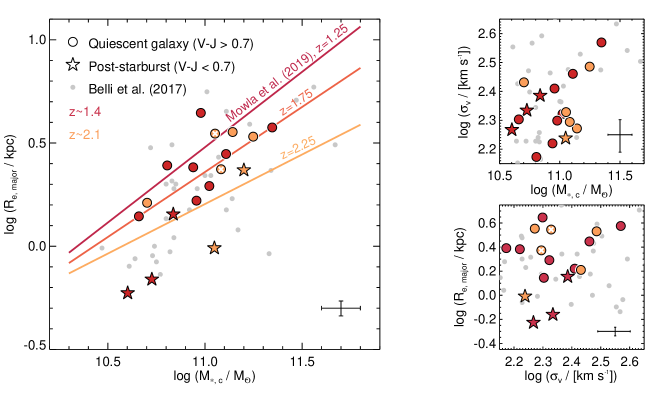
Quiescent galaxies follow a size-mass relationship, where galaxies with greater mass or luminosity exhibit larger effective radii (e.g., Kormendy, 1977; Shen et al., 2003). This relationship evolves over cosmic time, with galaxies at greater distances appearing more compact (e.g., Trujillo et al., 2006; van Dokkum et al., 2008; van der Wel et al., 2014; Mowla et al., 2018; Suess et al., 2019a, b). In Figure 9, we compare the half-light radii at rest-frame 5000 Å of the Heavy Metal galaxies with the average size-mass relation at , , and as reported by Mowla et al. (2018) (using the same IMF) for a large representative sample of massive quiescent galaxies. To ensure consistency with prior research, we consider the major axis (non-circularized) as the half-light radius. In contrast to Figure 8, here we use the stellar masses that are corrected using the Galfit magnitudes, to make them consistent with the size measurements (see Sect. 3.3). Mowla et al. (2018) also applied this correction.
When comparing the galaxies at to the relations at and (Fig. 9), we find that, on average, the Heavy Metal galaxies are smaller. This trend can likely be attributed to our selection criteria favoring quiescent galaxies with lower mass-to-light ratios (M/L), indicative of younger ages. Several studies have indeed highlighted that younger quiescent galaxies have smaller half-light radii than their older counterparts of equivalent mass (e.g., Whitaker et al., 2012; Belli et al., 2015; Yano et al., 2016; Almaini et al., 2017; Maltby et al., 2018; Wu et al., 2020; Suess et al., 2020, 2021; Setton et al., 2022). When excluding the youngest galaxies (stars), as identified by their blue () colors (e.g., Belli et al., 2019; Beverage et al., 2021), we find a good agreement between the relations by Mowla and the Heavy Metal galaxies at . The sizes of the Heavy Metal galaxies are more challenging to compare, as there are only five galaxies with robust size measurements, of which two have blue colors. Our primary quiescent galaxies also have similar sizes to the spectroscopic galaxy sample by Belli et al. (2017a), when including galaxies at similar redshifts ().
In Figure 9 we also show the stellar masses and sizes in relation to their velocity dispersions. These panels show that the youngest galaxies, despite their small sizes, have similar velocity dispersions as older galaxies of the similar mass. The Heavy Metal galaxies follow a roughly similar distributions as the sample by Belli et al. (2017a) in both diagrams.
4.4 Comparison of dynamical and stellar masses
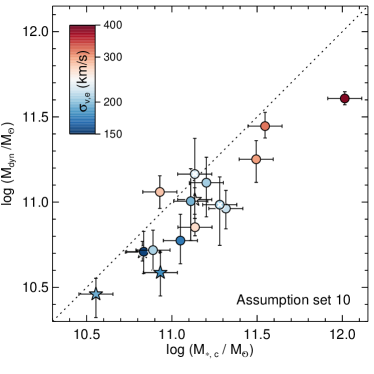
The combination of deep Keck spectra with high-resolution HST imaging enable dynamical mass measurements for the majority of the primary Heavy Metal galaxies, as listed in Table 5. In addition to the stellar content, the dynamical mass also includes the dark matter and gas components. Thus, in theory, the dynamical masses should give us insights into these dark components. In practice, however, this is extremely challenging, as both the stellar and dynamical mass measurements rely on many assumptions (see Sect. 3.3). Nonetheless, the boundary condition that the stellar mass should not exceed the dynamical mass provides an independent check on our stellar mass measurements, and may give us insights into assumptions that went into our mass estimates.
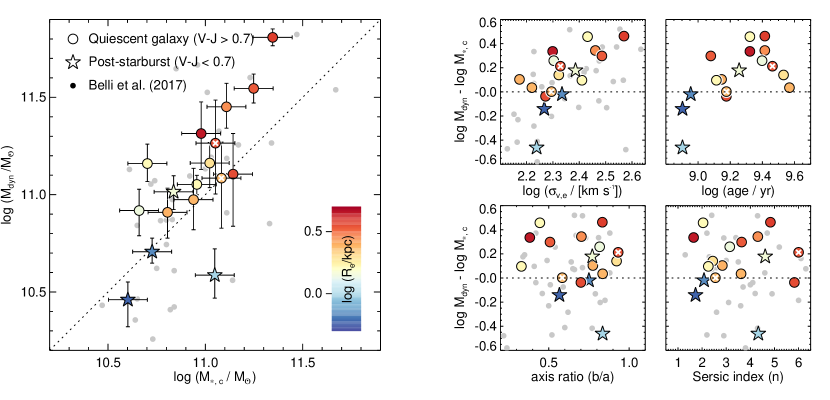
In Figure 10 we show the dynamical vs. stellar mass for the primary Heavy Metal galaxies. For the majority of the galaxies, the dynamical mass exceeds the stellar mass, with a median dark matter fraction of 28%. For two galaxies the dynamical masses are below their stellar masses, with one galaxy (HM3-107590) being off by . These galaxies are among the smallest (based on the light-weighted size) and youngest, as shown in the top-right panel of Figure 10. Interestingly, Runco et al. (2022) found a similar result for a post-starburst galaxy at redshift , with the stellar mass also being significantly larger than the dynamical mass. Cappellari (2023) also find a trend with age for galaxies in the LEGA-C survey, with the younger galaxies having lower dynamical-to-stellar mass ratios.
In order to assess how the masses compare when adopting different assumptions, and to understand why some galaxies have , we discuss the different assumptions below. First, when deriving the dynamical mass, we circularize the effective radius and use a Sérsic dependent virial coefficient . If we would not have circularized the radius, would increase by 0.023 dex and the scatter would increase from 0.232 to 0.255 (assumption set 2, Fig.11 and Table 5). Instead of circularizing, we also explore the axis ratio correction by van der Wel et al. (2022), which is implemented using an additional virial coefficient . This combination increases the median by 0.12 dex as well as the scatter (assumption set 3). Assuming a virial constant of 5 would also increase the scatter in , but the median would decrease by 0.15 dex (assumption set 4).
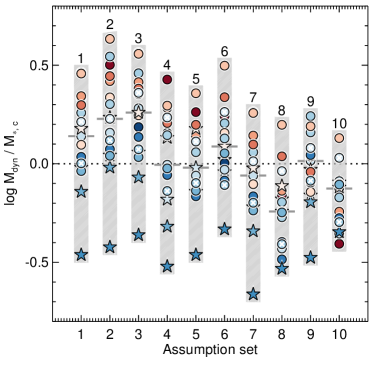
| No | assump. | assump. | log | |||
|---|---|---|---|---|---|---|
| VC999Virial coefficient | Z | IMF101010Ch, Sa, and refers to the IMFs by Chabrier (2003), Salpeter (1955) and Treu et al. (2010). | med | |||
| 1 | circ, light | 0.0190 | Ch | 0.14 | 0.23 | |
| 2 | sma, light | 0.0190 | Ch | 0.23 | 0.25 | |
| 3 | sma, light | 0.0190 | Ch | 0.26 | 0.24 | |
| 4 | circ, light | 5 | 0.0190 | Ch | -0.01 | 0.24 |
| 5 | circ, mass | 0.0190 | Ch | -0.02 | 0.20 | |
| 6 | circ, light | 0.0096 | Ch | 0.09 | 0.20 | |
| 7 | circ, light | 0.0190 | Sa | -0.06 | 0.23 | |
| 8 | circ, mass | 0.0096 | Sa | -0.24 | 0.19 | |
| 9 | circ, light | 0.0190 | 0.01 | 0.17 | ||
| 10 | circ, mass | 0.0096 | -0.13 | 0.14 | ||
Second, in our dynamical mass measurement we assume that the galaxies are pressure supported. However, if they are (partially) rotationally supported, our dynamical mass measurement would be off. For example, for HM3-107590 the low dynamical mass could be explained by a face-on view or by a strong mis-alignment of the slit and the major axis of the galaxy. For these cases, part of the velocity field would not be included in our dispersion measurement and we would underestimate the mass. We check for this possibility by examining as a function of the Sérsic index and axis ratio () in the right panels of Figure 10. HM3-107590 is nearly round and the velocity dispersion is indeed lower compared to galaxies of similar mass (Fig. 9). The Sérsic index appears at odds with the galaxy being a disk, though this measurement is quite uncertain as this galaxy is just barely resolved.
In this context it is interesting to note that Belli et al. (2017a) find higher for galaxies with low Sérsic indices () and low axis ratios, and interpret this finding as evidence for a significant contribution of rotational motion. We do not see any indications that galaxies with the highest preferentially have low and low . However, in contrast to Belli et al. (2017a), we circularize our effective radii when deriving the dynamical mass, which lowers for galaxies with low axis ratios, and thus we partially account for inclination effects. Improving upon our simplified approach requires a forward modeling method, preferentially combined with spatially resolved spectroscopy, allowing for dynamical models with different levels of rotational support and correcting for inclination and aperture effects (e.g., Price et al., 2016, 2020; van Houdt et al., 2021; de Graaff et al., 2023).
Third, dynamical masses depend on size measurements, which may have been biased due to stellar population gradients. Distant quiescent galaxies have redder centers, with gradient being stronger in galaxies that are more massive, older, and at lower redshifts (e.g., Mosleh et al., 2017; Suess et al., 2019a, b, 2020, 2021; Miller et al., 2023). By applying the average size corrections by Suess et al. (2019a, 2021, 0.2 dex and 0.1 dex for the older quiescent galaxies at and , respectively, and no corrections for post-starburst galaxies), we find that median decreases by 0.16 dex (see Fig. 11, assumption set 5). The color gradient correction also reduces the scatter . The of the two youngest galaxies remain unaffected, as post-starburst galaxies tend to display uniform color gradients (e.g., Setton et al., 2020; Suess et al., 2020, 2021). HM1-217249, the sole post-starburst galaxy with robust size measurements in both F814W and F160W, supports this trend. Thus, stellar population gradients do not explain the low of the few post-starburst galaxies. Instead, they further lower the median inferred dark matter fraction of our full distant quiescent galaxy sample. Finally, size underestimation could occur due to the presence of an AGN, although the full SEDs and spectra provide limited room for a power-law continuum contribution.
The stellar masses could also be biased. First, as we assume a simple delayed exponential star-formation history, it is likely that we miss older, and low stellar populations in our stellar mass. This “outshining” problem has been discussed in many works (e.g., Papovich et al., 2001; Wuyts et al., 2007; Leja et al., 2019; Giménez-Arteaga et al., 2023). However, for distant massive quiescent galaxies this effect is small, and thus the fast and Prospector masses (Johnson et al., 2021), assuming non-parameterized star formation histories are very close (Leja et al., 2019). Second, we assume solar metallicity, while the galaxies, on average, have sub-solar iron abundances (A. Beverage et al. in prep). Assuming a half-solar metallicity (Z=0.0096) would increase the median stellar masses by 13% (see Fig. 11) and decreases the scatter in by 0.035. Third, we assume a Chabrier (2003) IMF, which, similar to a Kroupa IMF, is relatively bottom light. Assuming a Salpeter (1955) IMF would increase the stellar masses by 0.2 dex (Fig. 11), such that it exceeds for the majority of the galaxies. Combining both stellar mass effects and the color gradient correction (assumption set 8 in Fig. 11), would lead to stellar masses vastly exceeding the dynamical masses for nearly all galaxies. Hence, given our dynamical masses we infer that a Chabrier IMF is more likely than a Salpeter IMF for distant quiescent galaxies. We will further explore the IMF in the next section.
5 Discussion
5.1 Implications for Photometric Studies
While the number of distant star-forming galaxies with spectroscopic redshifts has increased tremendously in the past decade (e.g., Steidel et al., 2014; Wisnioski et al., 2015; Kriek et al., 2015), the number of distant quiescent galaxies with spectroscopic redshifts or other spectroscopic information is still very small. Detecting absorption lines requires significantly longer integration times than observing nebular emission lines. Thus, the majority of studies of quiescent galaxies over cosmic time, including the build up of the stellar mass function, still rely on photometric data.
Our study presents a re-assuring picture. The initial photometric redshifts of our primary quiescent galaxies agree well with their spectroscopic redshifts (see Sect. 4.1) and nearly all galaxies have quiescent stellar populations with their SFRs significantly below the star-forming main sequence (see Sect. 4.2). We do find, however, that photometric redshifts become less accurate beyond . Furthermore, we show that for one galaxy, the contribution from strong AGN emission lines mimics the shape of a quiescent galaxy. Schreiber et al. (2018) shows that the success rate of the selection criteria further declines to about 80% when going to . Forrest et al. (2020) presents a less optimistic picture with a spectroscopic confirmation rate of about 50% for quiescent galaxy candidates beyond . Nonetheless, out to , we do not expect that mass functions of quiescent galaxies will be strongly biased by incorrect photometric redshifts or quiescent galaxy classifications.
5.2 Implications for the evolution of massive quiescent galaxies
One popular explanations for the size evolution of quiescent galaxies over cosmic time is growth by minor mergers. This scenario is supported by the finding that the central mass densities of quiescent galaxies remains roughly constant, while their (blue) outskirts are building up over time (e.g., Bezanson et al., 2009; van Dokkum et al., 2010; Barro et al., 2017; Suess et al., 2021). Furthermore, distant quiescent galaxies have many small companions (Newman et al., 2012; Suess et al., 2023). Thus, in this scenario, distant quiescent galaxies are the cores of massive galaxies today. These same cores are also found to have a bottom-heavy IMF (e.g., Treu et al., 2010; Conroy & van Dokkum, 2012), with the highest velocity dispersion galaxies having a larger excess of low-mass stars. Thus, for this inside-growth scenario, the IMF in the high-dispersion galaxies should already be bottom-heavy at these early times.
In Figure 10 we indeed find that correlates with , which could imply that the IMF may be more bottom heavy in higher-dispersion galaxies. This trend was already visible in the diagrams in several distant quiescent galaxy studies (e.g., van de Sande et al., 2013; Belli et al., 2017a; Forrest et al., 2022), and discussed in detail in Mendel et al. (2020). Mendel et al. (2020) argue that this trend is due to a varying IMF, and that the IMF- relation was already in place at these early times.
To further assess this theory, we show assuming a -dependent IMF for our distant quiescent galaxies in Figure 11 (assumption set 9). We use the relation by Treu et al. (2010, Equation 4), in which the IMF is more bottom-heavy than the Salpeter IMF for galaxies with . This IMF results in a median of 1.033. The scatter in is strongly reduced, which is expected as we are (partially) removing the trend with . Interestingly, when also assuming sub-solar metallicity (Z=0.0096) and correcting for color gradients, this IMF results in stellar masses that exceed the dynamical masses for all but one galaxy, with a median of 0.75 (Fig. 11, assumption set 10). Thus, our dynamical masses may suggest that compact distant quiescent galaxies do not “passively” evolved into the cores of massive elliptical galaxies today, and that the evolution is more complicated (e.g., Wellons et al., 2015). Major mergers (with galaxies with a different IMF) and/or late-time central star formation could have affected the average IMF in today’s cores.
Interestingly, van Dokkum et al. (2023) came to the opposite conclusions, based on a perfect lensing system (see also Mercier et al., 2023). They find that a bottom-heavy IMF must already be in place for a distant quiescent galaxy at , because the stellar mass, assuming the Chabrier (2003) IMF would lead to an unrealistically large dark matter fraction within the Einstein radius. Obtaining spectroscopic redshifts for both galaxies as well as a dynamical mass measurement for the quiescent galaxy lens would be needed to directly compare our results.
In order to further unravel this puzzle, we need progress on several fronts. First, we need to measure stellar population gradients and half-mass radii for our spectroscopic samples. This should preferentially be done from spectroscopic data, as age, metallicity, and dust gradients result in different gradients (e.g., van de Sande et al., 2015). We would also have to re-determine the stellar masses, taking into account these stellar population gradients. Second, we need to resolve the kinematics of distant quiescent galaxies, such that we can model their stellar dynamics. Third, we need a direct spectroscopic measurement of the IMF in distant quiescent galaxies, to obtain more accurate stellar masses and understand whether the bottom-heavy IMF was already in place at these early times. Finally, we need larger samples of galaxy spectra. JWST will book advances in all these areas, and has already collected spectra of a hand full of distant quiescent galaxies (Nanayakkara et al., 2022; Carnall et al., 2023; Marchesini et al., 2023; D’Eugenio et al., 2023; Belli et al., 2023).
6 Summary
In this paper, we present an overview of the Heavy Metal Survey, an ultradeep rest-frame optical spectroscopic survey of 21 distant quiescent galaxy candidates at . The Heavy Metal Survey was executed with MOSFIRE and LRIS on the Keck I Telescope and overlaps with the UltraVISTA and COSMOS-DASH surveys. Our primary targets were selected across two redshift intervals, and , allowing the observation of multiple Balmer and metal (Ca, Mg, Fe) absorption lines in atmospheric windows. The extensive sky coverage enabled galaxy pointings for which we observe 5-6 “bright” quiescent candidates in one pointing, with two pointings per redshift interval. The remaining slits were placed on fainter quiescent and star-forming galaxies at similar redshifts. The and targets were observed for a total of and hrs, respectively. The Heavy Metal Survey is unique for its wavelength coverage, and presents the first statistical sample of quiescent galaxies with ultra-deep spectra covering rest-frame 3700–5400 Å.
We measure spectroscopic redshifts for all primary targets, and nearly all show clear Balmer and metal absorption lines in their spectra. 20 out of the 21 quiescent candidates indeed have quiescent stellar populations; the SFRs determined from H and spectrophotometric fitting are both significantly below the star-forming main sequence. For 11 out of the 20 quiescent galaxies we detect no H and derive upper limits on the SFR from H. For nine targets we do detect faint H emission, but seven of them have emission-line ratios which indicate that star formation is not the primary ionization source; instead they may be powered by hot evolved stars or low-luminosity AGN. Hence, for these galaxies the H SFRs are more comparable to upper limits as well. For the remaining two galaxies with detected H, the SFRs are very low and for one of them [N ii]/H suggests that the star formation is likely associated with a nearby smaller galaxy. Finally, one of the quiescent candidates appeared to be an AGN, with strong (asymmetric) emission lines mimicking the shape of a quiescent galaxies. This galaxy will be discussed in detail in Y. Ma et al. (in preparation).
The primary goal of the Heavy Metal Survey is to measure chemical compositions and ages from the stellar absorption line spectra. These measurements are discussed in our accompanying paper by A. Beverage et al. (in preparation). The stellar population fitting, presented in that paper, also yields accurate stellar velocity dispersion measurements for 19 out of the 21 primary galaxies. These measurements, combined, with the structural parameters derived from HST F814W and F160W imaging, enable us to derive dynamical masses for the majority of the primary Heavy Metal galaxies.
In this paper, we compare our dynamical masses with the stellar masses from spectrophotometric modeling, considering various assumptions for both masses. Interestingly, for a fixed IMF, / shows a positive correlation with . This correlation may suggest that a varying IMF, that is more bottom-heavy for high- galaxies, was already in place at these early times (see also Mendel et al., 2020). When implementing the -dependent IMF found in the cores of nearby massive early-type galaxies, and also correcting for biases in our stellar mass and size measurements, we find a low scatter in / of only 0.14 dex and a median / of 0.75. Thus, for these assumptions, the stellar mass measurements exceed the dynamical masses for nearly all quiescent galaxies. This result may imply that distant quiescent galaxies do not simply grow inside-out into massive early-type galaxies in today’s universe and late-time evolution (major mergers and/or late-time star formation) may be needed.
In order to fully characterize the distant quiescent galaxy population, and solve this possible tension with the studies of the cores in nearby massive galaxies, we need to make progress on several fronts. First, we need a statistical sample of distant quiescent galaxies with resolved stellar kinematics, ages, elemental abundances, and robust stellar mass profiles. Moreover, we need to directly measure the IMF in distant quiescent galaxies. JWST will be able to make progress on all these fronts, and thus will be transformative for our understanding of the formation histories of distant quiescent galaxies and their evolutionary link to the massive early-type galaxies in the present-day universe.
We acknowledge support from NSF AAG grants AST-1908748 and 1909942. CC acknowledges support from NSF grant AST-131547. The authors wish to recognize and acknowledge the very significant cultural role and reverence that the summit of Mauna Kea has always had within the indigenous Hawaiian community. We are most fortunate to have the opportunity to conduct observations from this mountain.
References
- Almaini et al. (2017) Almaini, O., Wild, V., Maltby, D. T., et al. 2017, MNRAS, 472, 1401, doi: 10.1093/mnras/stx1957
- Antwi-Danso et al. (2023) Antwi-Danso, J., Papovich, C., Esdaile, J., et al. 2023, arXiv e-prints, arXiv:2307.09590, doi: 10.48550/arXiv.2307.09590
- Baldwin et al. (1981) Baldwin, J. A., Phillips, M. M., & Terlevich, R. 1981, PASP, 93, 5, doi: 10.1086/130766
- Barro et al. (2017) Barro, G., Faber, S. M., Koo, D. C., et al. 2017, ApJ, 840, 47, doi: 10.3847/1538-4357/aa6b05
- Belfiore et al. (2016) Belfiore, F., Maiolino, R., Maraston, C., et al. 2016, MNRAS, 461, 3111, doi: 10.1093/mnras/stw1234
- Belli et al. (2015) Belli, S., Newman, A. B., & Ellis, R. S. 2015, ApJ, 799, 206, doi: 10.1088/0004-637X/799/2/206
- Belli et al. (2017a) —. 2017a, ApJ, 834, 18, doi: 10.3847/1538-4357/834/1/18
- Belli et al. (2019) —. 2019, ApJ, 874, 17, doi: 10.3847/1538-4357/ab07af
- Belli et al. (2014) Belli, S., Newman, A. B., Ellis, R. S., & Konidaris, N. P. 2014, ApJ, 788, L29, doi: 10.1088/2041-8205/788/2/L29
- Belli et al. (2017b) Belli, S., Genzel, R., Förster Schreiber, N. M., et al. 2017b, ApJ, 841, L6, doi: 10.3847/2041-8213/aa70e5
- Belli et al. (2023) Belli, S., Park, M., Davies, R. L., et al. 2023, arXiv e-prints, arXiv:2308.05795, doi: 10.48550/arXiv.2308.05795
- Beverage et al. (2021) Beverage, A. G., Kriek, M., Conroy, C., et al. 2021, ApJ, 917, L1, doi: 10.3847/2041-8213/ac12cd
- Beverage et al. (2023) —. 2023, ApJ, 948, 140, doi: 10.3847/1538-4357/acc176
- Bezanson et al. (2013) Bezanson, R., van Dokkum, P., van de Sande, J., Franx, M., & Kriek, M. 2013, ApJ, 764, L8, doi: 10.1088/2041-8205/764/1/L8
- Bezanson et al. (2009) Bezanson, R., van Dokkum, P. G., Tal, T., et al. 2009, ApJ, 697, 1290, doi: 10.1088/0004-637X/697/2/1290
- Brammer et al. (2008) Brammer, G. B., van Dokkum, P. G., & Coppi, P. 2008, ApJ, 686, 1503, doi: 10.1086/591786
- Bruzual & Charlot (2003) Bruzual, G., & Charlot, S. 2003, MNRAS, 344, 1000, doi: 10.1046/j.1365-8711.2003.06897.x
- Cappellari (2023) Cappellari, M. 2023, MNRAS, 526, 3273, doi: 10.1093/mnras/stad2597
- Cappellari & Emsellem (2004) Cappellari, M., & Emsellem, E. 2004, PASP, 116, 138, doi: 10.1086/381875
- Cappellari et al. (2006) Cappellari, M., Bacon, R., Bureau, M., et al. 2006, MNRAS, 366, 1126, doi: 10.1111/j.1365-2966.2005.09981.x
- Carnall et al. (2022) Carnall, A. C., McLure, R. J., Dunlop, J. S., et al. 2022, ApJ, 929, 131, doi: 10.3847/1538-4357/ac5b62
- Carnall et al. (2023) —. 2023, Nature, 619, 716, doi: 10.1038/s41586-023-06158-6
- Chabrier (2003) Chabrier, G. 2003, PASP, 115, 763, doi: 10.1086/376392
- Choi et al. (2016) Choi, J., Dotter, A., Conroy, C., et al. 2016, ApJ, 823, 102, doi: 10.3847/0004-637X/823/2/102
- Cimatti et al. (2004) Cimatti, A., Daddi, E., Renzini, A., et al. 2004, Nature, 430, 184, doi: 10.1038/nature02668
- Conroy & Gunn (2010) Conroy, C., & Gunn, J. E. 2010, ApJ, 712, 833, doi: 10.1088/0004-637X/712/2/833
- Conroy et al. (2009) Conroy, C., Gunn, J. E., & White, M. 2009, ApJ, 699, 486, doi: 10.1088/0004-637X/699/1/486
- Conroy & van Dokkum (2012) Conroy, C., & van Dokkum, P. G. 2012, ApJ, 760, 71, doi: 10.1088/0004-637X/760/1/71
- Conroy et al. (2018) Conroy, C., Villaume, A., van Dokkum, P. G., & Lind, K. 2018, ApJ, 854, 139, doi: 10.3847/1538-4357/aaab49
- Cutler et al. (2022) Cutler, S. E., Whitaker, K. E., Mowla, L. A., et al. 2022, ApJ, 925, 34, doi: 10.3847/1538-4357/ac341c
- Daddi et al. (2005) Daddi, E., Renzini, A., Pirzkal, N., et al. 2005, ApJ, 626, 680, doi: 10.1086/430104
- de Graaff et al. (2023) de Graaff, A., Rix, H.-W., Carniani, S., et al. 2023, arXiv e-prints, arXiv:2308.09742, doi: 10.48550/arXiv.2308.09742
- D’Eugenio et al. (2023) D’Eugenio, F., Perez-Gonzalez, P., Maiolino, R., et al. 2023, arXiv e-prints, arXiv:2308.06317, doi: 10.48550/arXiv.2308.06317
- Esdaile et al. (2021) Esdaile, J., Glazebrook, K., Labbé, I., et al. 2021, ApJ, 908, L35, doi: 10.3847/2041-8213/abe11e
- Forrest et al. (2020) Forrest, B., Annunziatella, M., Wilson, G., et al. 2020, ApJ, 890, L1, doi: 10.3847/2041-8213/ab5b9f
- Forrest et al. (2022) Forrest, B., Wilson, G., Muzzin, A., et al. 2022, ApJ, 938, 109, doi: 10.3847/1538-4357/ac8747
- Franx et al. (2003) Franx, M., Labbé, I., Rudnick, G., et al. 2003, ApJ, 587, L79, doi: 10.1086/375155
- Giménez-Arteaga et al. (2023) Giménez-Arteaga, C., Oesch, P. A., Brammer, G. B., et al. 2023, ApJ, 948, 126, doi: 10.3847/1538-4357/acc5ea
- Glazebrook et al. (2004) Glazebrook, K., Abraham, R. G., McCarthy, P. J., et al. 2004, Nature, 430, 181, doi: 10.1038/nature02667
- Glazebrook et al. (2017) Glazebrook, K., Schreiber, C., Labbé, I., et al. 2017, Nature, 544, 71, doi: 10.1038/nature21680
- Grogin et al. (2011) Grogin, N. A., Kocevski, D. D., Faber, S. M., et al. 2011, ApJS, 197, 35, doi: 10.1088/0067-0049/197/2/35
- Horne (1986) Horne, K. 1986, PASP, 98, 609, doi: 10.1086/131801
- Jafariyazani et al. (2020) Jafariyazani, M., Newman, A. B., Mobasher, B., et al. 2020, ApJ, 897, L42, doi: 10.3847/2041-8213/aba11c
- Johnson et al. (2021) Johnson, B. D., Leja, J., Conroy, C., & Speagle, J. S. 2021, ApJS, 254, 22, doi: 10.3847/1538-4365/abef67
- Kauffmann et al. (2003) Kauffmann, G., Heckman, T. M., Tremonti, C., et al. 2003, MNRAS, 346, 1055, doi: 10.1111/j.1365-2966.2003.07154.x
- Kennicutt (1998) Kennicutt, Jr., R. C. 1998, ARA&A, 36, 189, doi: 10.1146/annurev.astro.36.1.189
- Kewley et al. (2006) Kewley, L. J., Groves, B., Kauffmann, G., & Heckman, T. 2006, MNRAS, 372, 961, doi: 10.1111/j.1365-2966.2006.10859.x
- Koekemoer et al. (2011) Koekemoer, A. M., Faber, S. M., Ferguson, H. C., et al. 2011, ApJS, 197, 36, doi: 10.1088/0067-0049/197/2/36
- Kormendy (1977) Kormendy, J. 1977, ApJ, 218, 333, doi: 10.1086/155687
- Kriek & Conroy (2013) Kriek, M., & Conroy, C. 2013, ApJ, 775, L16, doi: 10.1088/2041-8205/775/1/L16
- Kriek et al. (2009) Kriek, M., van Dokkum, P. G., Labbé, I., et al. 2009, ApJ, 700, 221, doi: 10.1088/0004-637X/700/1/221
- Kriek et al. (2006) Kriek, M., van Dokkum, P. G., Franx, M., et al. 2006, ApJ, 649, L71, doi: 10.1086/508371
- Kriek et al. (2007) —. 2007, ApJ, 669, 776, doi: 10.1086/520789
- Kriek et al. (2015) Kriek, M., Shapley, A. E., Reddy, N. A., et al. 2015, ApJS, 218, 15, doi: 10.1088/0067-0049/218/2/15
- Kriek et al. (2016) Kriek, M., Conroy, C., van Dokkum, P. G., et al. 2016, Nature, 540, 248, doi: 10.1038/nature20570
- Kriek et al. (2019) Kriek, M., Price, S. H., Conroy, C., et al. 2019, ApJ, 880, L31, doi: 10.3847/2041-8213/ab2e75
- Kroupa (2001) Kroupa, P. 2001, MNRAS, 322, 231, doi: 10.1046/j.1365-8711.2001.04022.x
- Leja et al. (2019) Leja, J., Johnson, B. D., Conroy, C., et al. 2019, ApJ, 877, 140, doi: 10.3847/1538-4357/ab1d5a
- Leja et al. (2022) Leja, J., Speagle, J. S., Ting, Y.-S., et al. 2022, ApJ, 936, 165, doi: 10.3847/1538-4357/ac887d
- Lonoce et al. (2015) Lonoce, I., Longhetti, M., Maraston, C., et al. 2015, MNRAS, 454, 3912, doi: 10.1093/mnras/stv2150
- Maltby et al. (2018) Maltby, D. T., Almaini, O., Wild, V., et al. 2018, MNRAS, 480, 381, doi: 10.1093/mnras/sty1794
- Maraston (2005) Maraston, C. 2005, MNRAS, 362, 799, doi: 10.1111/j.1365-2966.2005.09270.x
- Marchesini et al. (2023) Marchesini, D., Brammer, G., Morishita, T., et al. 2023, ApJ, 942, L25, doi: 10.3847/2041-8213/acaaac
- McCracken et al. (2012) McCracken, H. J., Milvang-Jensen, B., Dunlop, J., et al. 2012, A&A, 544, A156, doi: 10.1051/0004-6361/201219507
- McDermid et al. (2015) McDermid, R. M., Alatalo, K., Blitz, L., et al. 2015, MNRAS, 448, 3484, doi: 10.1093/mnras/stv105
- McLean et al. (2012) McLean, I. S., Steidel, C. C., Epps, H. W., et al. 2012, in Society of Photo-Optical Instrumentation Engineers (SPIE) Conference Series, Vol. 8446, Society of Photo-Optical Instrumentation Engineers (SPIE) Conference Series, doi: 10.1117/12.924794
- McLeod et al. (2021) McLeod, D. J., McLure, R. J., Dunlop, J. S., et al. 2021, MNRAS, 503, 4413, doi: 10.1093/mnras/stab731
- Mendel et al. (2015) Mendel, J. T., Saglia, R. P., Bender, R., et al. 2015, ApJ, 804, L4, doi: 10.1088/2041-8205/804/1/L4
- Mendel et al. (2020) Mendel, J. T., Beifiori, A., Saglia, R. P., et al. 2020, ApJ, 899, 87, doi: 10.3847/1538-4357/ab9ffc
- Mercier et al. (2023) Mercier, W., Shuntov, M., Gavazzi, R., et al. 2023, arXiv e-prints, arXiv:2309.15986, doi: 10.48550/arXiv.2309.15986
- Miller et al. (2023) Miller, T. B., van Dokkum, P., & Mowla, L. 2023, ApJ, 945, 155, doi: 10.3847/1538-4357/acbc74
- Momcheva et al. (2017) Momcheva, I. G., van Dokkum, P. G., van der Wel, A., et al. 2017, PASP, 129, 015004, doi: 10.1088/1538-3873/129/971/015004
- Mosleh et al. (2017) Mosleh, M., Tacchella, S., Renzini, A., et al. 2017, ApJ, 837, 2, doi: 10.3847/1538-4357/aa5f14
- Mowla et al. (2018) Mowla, L., van Dokkum, P., Brammer, G., et al. 2018, ArXiv e-prints. https://arxiv.org/abs/1808.04379
- Muzzin et al. (2013a) Muzzin, A., Marchesini, D., Stefanon, M., et al. 2013a, ApJ, 777, 18, doi: 10.1088/0004-637X/777/1/18
- Muzzin et al. (2013b) —. 2013b, ApJS, 206, 8, doi: 10.1088/0067-0049/206/1/8
- Nanayakkara et al. (2022) Nanayakkara, T., Glazebrook, K., Jacobs, C., et al. 2022, arXiv e-prints, arXiv:2212.11638, doi: 10.48550/arXiv.2212.11638
- Newman et al. (2015) Newman, A. B., Belli, S., & Ellis, R. S. 2015, ApJ, 813, L7, doi: 10.1088/2041-8205/813/1/L7
- Newman et al. (2018a) Newman, A. B., Belli, S., Ellis, R. S., & Patel, S. G. 2018a, ApJ, 862, 126, doi: 10.3847/1538-4357/aacd4f
- Newman et al. (2018b) —. 2018b, ApJ, 862, 125, doi: 10.3847/1538-4357/aacd4d
- Newman et al. (2012) Newman, A. B., Ellis, R. S., Bundy, K., & Treu, T. 2012, ApJ, 746, 162, doi: 10.1088/0004-637X/746/2/162
- Oke & Gunn (1983) Oke, J. B., & Gunn, J. E. 1983, ApJ, 266, 713, doi: 10.1086/160817
- Oke et al. (1995) Oke, J. B., Cohen, J. G., Carr, M., et al. 1995, PASP, 107, 375, doi: 10.1086/133562
- Onodera et al. (2015) Onodera, M., Carollo, C. M., Renzini, A., et al. 2015, ApJ, 808, 161, doi: 10.1088/0004-637X/808/2/161
- Papovich et al. (2001) Papovich, C., Dickinson, M., & Ferguson, H. C. 2001, ApJ, 559, 620, doi: 10.1086/322412
- Park et al. (2023) Park, M., Belli, S., Conroy, C., et al. 2023, ApJ, 953, 119, doi: 10.3847/1538-4357/acd54a
- Peng et al. (2002) Peng, C. Y., Ho, L. C., Impey, C. D., & Rix, H.-W. 2002, AJ, 124, 266, doi: 10.1086/340952
- Price et al. (2016) Price, S. H., Kriek, M., Shapley, A. E., et al. 2016, ApJ, 819, 80, doi: 10.3847/0004-637X/819/1/80
- Price et al. (2020) Price, S. H., Kriek, M., Barro, G., et al. 2020, ApJ, 894, 91, doi: 10.3847/1538-4357/ab7990
- Runco et al. (2022) Runco, J. N., Shapley, A. E., Kriek, M., et al. 2022, MNRAS, 517, 4405, doi: 10.1093/mnras/stac2863
- Salpeter (1955) Salpeter, E. E. 1955, ApJ, 121, 161, doi: 10.1086/145971
- Saracco et al. (2019) Saracco, P., La Barbera, F., Gargiulo, A., et al. 2019, MNRAS, 484, 2281, doi: 10.1093/mnras/sty3509
- Schreiber et al. (2018) Schreiber, C., Glazebrook, K., Nanayakkara, T., et al. 2018, A&A, 618, A85, doi: 10.1051/0004-6361/201833070
- Scoville et al. (2007) Scoville, N., Aussel, H., Brusa, M., et al. 2007, ApJS, 172, 1, doi: 10.1086/516585
- Setton et al. (2020) Setton, D. J., Bezanson, R., Suess, K. A., et al. 2020, ApJ, 905, 79, doi: 10.3847/1538-4357/abc265
- Setton et al. (2022) Setton, D. J., Verrico, M., Bezanson, R., et al. 2022, ApJ, 931, 51, doi: 10.3847/1538-4357/ac6096
- Sharples et al. (2013) Sharples, R., Bender, R., Agudo Berbel, A., et al. 2013, The Messenger, 151, 21
- Shen et al. (2003) Shen, S., Mo, H. J., White, S. D. M., et al. 2003, MNRAS, 343, 978, doi: 10.1046/j.1365-8711.2003.06740.x
- Steidel et al. (2014) Steidel, C. C., Rudie, G. C., Strom, A. L., et al. 2014, ApJ, 795, 165, doi: 10.1088/0004-637X/795/2/165
- Suess et al. (2019a) Suess, K. A., Kriek, M., Price, S. H., & Barro, G. 2019a, ApJ, 877, 103, doi: 10.3847/1538-4357/ab1bda
- Suess et al. (2019b) —. 2019b, ApJ, 885, L22, doi: 10.3847/2041-8213/ab4db3
- Suess et al. (2020) —. 2020, ApJ, 899, L26, doi: 10.3847/2041-8213/abacc9
- Suess et al. (2021) —. 2021, ApJ, 915, 87, doi: 10.3847/1538-4357/abf1e4
- Suess et al. (2023) Suess, K. A., Williams, C. C., Robertson, B., et al. 2023, ApJ, 956, L42, doi: 10.3847/2041-8213/acf5e6
- Tanaka et al. (2019) Tanaka, M., Valentino, F., Toft, S., et al. 2019, ApJ, 885, L34, doi: 10.3847/2041-8213/ab4ff3
- Thomas et al. (2005) Thomas, D., Maraston, C., Bender, R., & Mendes de Oliveira, C. 2005, ApJ, 621, 673, doi: 10.1086/426932
- Toft et al. (2017) Toft, S., Zabl, J., Richard, J., et al. 2017, Nature, 546, 510, doi: 10.1038/nature22388
- Tomczak et al. (2014) Tomczak, A. R., Quadri, R. F., Tran, K.-V. H., et al. 2014, ApJ, 783, 85, doi: 10.1088/0004-637X/783/2/85
- Treu et al. (2010) Treu, T., Auger, M. W., Koopmans, L. V. E., et al. 2010, ApJ, 709, 1195, doi: 10.1088/0004-637X/709/2/1195
- Trujillo et al. (2006) Trujillo, I., Förster Schreiber, N. M., Rudnick, G., et al. 2006, ApJ, 650, 18, doi: 10.1086/506464
- van de Sande et al. (2015) van de Sande, J., Kriek, M., Franx, M., Bezanson, R., & van Dokkum, P. G. 2015, ApJ, 799, 125, doi: 10.1088/0004-637X/799/2/125
- van de Sande et al. (2011) van de Sande, J., Kriek, M., Franx, M., et al. 2011, ApJ, 736, L9, doi: 10.1088/2041-8205/736/1/L9
- van de Sande et al. (2013) —. 2013, ApJ, 771, 85, doi: 10.1088/0004-637X/771/2/85
- van der Wel et al. (2014) van der Wel, A., Franx, M., van Dokkum, P. G., et al. 2014, ApJ, 788, 28, doi: 10.1088/0004-637X/788/1/28
- van der Wel et al. (2016) van der Wel, A., Noeske, K., Bezanson, R., et al. 2016, ApJS, 223, 29, doi: 10.3847/0067-0049/223/2/29
- van der Wel et al. (2021) van der Wel, A., Bezanson, R., D’Eugenio, F., et al. 2021, ApJS, 256, 44, doi: 10.3847/1538-4365/ac1356
- van der Wel et al. (2022) van der Wel, A., van Houdt, J., Bezanson, R., et al. 2022, ApJ, 936, 9, doi: 10.3847/1538-4357/ac83c5
- van Dokkum et al. (2023) van Dokkum, P., Brammer, G., Wang, B., Leja, J., & Conroy, C. 2023, arXiv e-prints, arXiv:2309.07969, doi: 10.48550/arXiv.2309.07969
- van Dokkum (2001) van Dokkum, P. G. 2001, PASP, 113, 1420, doi: 10.1086/323894
- van Dokkum et al. (2009) van Dokkum, P. G., Kriek, M., & Franx, M. 2009, Nature, 460, 717, doi: 10.1038/nature08220
- van Dokkum et al. (2008) van Dokkum, P. G., Franx, M., Kriek, M., et al. 2008, ApJ, 677, L5, doi: 10.1086/587874
- van Dokkum et al. (2010) van Dokkum, P. G., Whitaker, K. E., Brammer, G., et al. 2010, ApJ, 709, 1018, doi: 10.1088/0004-637X/709/2/1018
- van Houdt et al. (2021) van Houdt, J., van der Wel, A., Bezanson, R., et al. 2021, ApJ, 923, 11, doi: 10.3847/1538-4357/ac1f29
- Vernet et al. (2011) Vernet, J., Dekker, H., D’Odorico, S., et al. 2011, A&A, 536, A105, doi: 10.1051/0004-6361/201117752
- Wellons et al. (2015) Wellons, S., Torrey, P., Ma, C.-P., et al. 2015, MNRAS, 449, 361, doi: 10.1093/mnras/stv303
- Whitaker et al. (2012) Whitaker, K. E., Kriek, M., van Dokkum, P. G., et al. 2012, ApJ, 745, 179, doi: 10.1088/0004-637X/745/2/179
- Williams et al. (2009) Williams, R. J., Quadri, R. F., Franx, M., van Dokkum, P., & Labbé, I. 2009, ApJ, 691, 1879, doi: 10.1088/0004-637X/691/2/1879
- Wisnioski et al. (2015) Wisnioski, E., Förster Schreiber, N. M., Wuyts, S., et al. 2015, ApJ, 799, 209, doi: 10.1088/0004-637X/799/2/209
- Wu et al. (2020) Wu, P.-F., van der Wel, A., Bezanson, R., et al. 2020, ApJ, 888, 77, doi: 10.3847/1538-4357/ab5fd9
- Wuyts et al. (2007) Wuyts, S., Labbé, I., Franx, M., et al. 2007, ApJ, 655, 51, doi: 10.1086/509708
- Yan & Blanton (2012) Yan, R., & Blanton, M. R. 2012, ApJ, 747, 61, doi: 10.1088/0004-637X/747/1/61
- Yano et al. (2016) Yano, M., Kriek, M., van der Wel, A., & Whitaker, K. E. 2016, ApJ, 817, L21, doi: 10.3847/2041-8205/817/2/L21
- Zhuang et al. (2023) Zhuang, Z., Leethochawalit, N., Kirby, E. N., et al. 2023, ApJ, 948, 132, doi: 10.3847/1538-4357/acc79b