A multi-reflection time-of-flight mass spectrometer for the offline ion source of the PUMA experiment
bUniversität Greifswald, Institut für Physik, Felix-Hausdorff-Straße 6, 17489 Greifswald, Germany)
1 Introduction
To date, the many-body problem of nuclear physics cannot be solved exactly and approximations are required [1]. To contribute to the understanding of nuclear structure, radioactive ion beam facilities provide the investigation of a broad variety of short-lived nuclei which allow to explore nuclear systems beyond isospin symmetry. On the neutron rich side of the nuclear landscape, nuclei form neutron skins, referring to an excess of neutrons on the nuclear surface. Its size, the neutron skin thickness, can be determined by various methods [2, 3, 4, 5, 6] and is correlated to the nuclear equation of state through the slope of the symmetry energy, i.e. the contribution of the proton-to-neutron asymmetry in nuclear matter [7]. Bridging the gap between the smallest and largest nucleonic systems known, this correlation is also of relevance for the structure of neutron stars [8, 9]. Proceeding to even more asymmetric systems than neutron-skin nuclei, halo nuclei located at the nuclear drip lines [10] offer the possibility of studying nuclear few-body systems [11]. These are nuclei in which one or more nucleons have an increased probability density within classically forbidden regions, far beyond the nuclear core potential [12, 13].
To contribute to the understanding of phenomena that occur beyond the half-density radius of nuclei, such as neutron skins and halo nuclei, the antiProton Unstable Matter Annihilation (PUMA) experiment will investigate the nucleon composition at the tail of the matter density distribution of stable as well as radioactive isotopes using low-energy antiprotons [14, 15]. By trapping both matter and antimatter together and studying the antiproton-nucleon annihilation residuals, which are mainly pions, the PUMA experiment aims to determine the proton-to-neutron ratio in the tail of the nuclear matter density distribution. However, there is to date no facility worldwide that provides both radioactive nuclei and low-energy antiprotons at the same location. The PUMA experiment therefore plans to transport the antiprotons within the CERN site from the Extra Low ENergy Antiproton (ELENA) facility [16], located at the Antimatter Factory, to the Isotope mass Separator On-Line DEvice (ISOLDE) [17, 18] in a transportable Penning trap.
In order to start with stable-ion experiments, PUMA requires mass-separated and cooled ion bunches that can be obtained from a broad mass range of isotopes. Therefore, a versatile offline ion source system is currently under development at the Technical University of Darmstadt. Following the ion source, a multi-reflection time-of-flight mass spectrometer (MR-ToF MS) [19, 20] for beam purification and a radio-frequency quadrupole (RFQ) for particle accumulation and beam cooling [21, 22, 23, 24] will be used. State-of-the-art MR-ToF systems provide mass resolving powers beyond [25, 26], reached within milliseconds [27]. As such, they are the tool of choice for fast, high-precision ion beam purification.
2 The PUMA offline ion source beamline
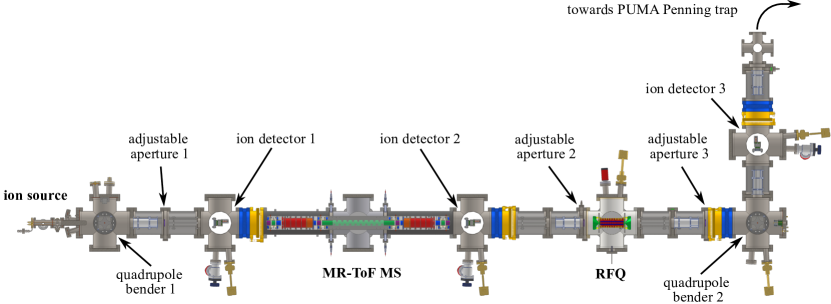
The offline ion source beamline can be divided into three main sections which - in beam direction - are the ion source, the MR-ToF MS and the RFQ (see Fig. 1). They are followed by a fourth section to gradually improve the vacuum behind a 90-degree bend towards the PUMA beamline. Furthermore, the offline ion source is complemented with three movable ion detection units, three iris-type apertures for adjustments of the gas flow and ion optical components for focusing, steering and energy modification (not labelled in Fig. 1). The offline setup is to be installed at the PUMA experimental area located at the ELENA facility.
2.1 Overview of the setup
In a commercial electron impact ionisation source (IQE 12/38, SPECS Surface Nano Analysis GmbH, Berlin, Germany), a gaseous material is ionised and the ions are extracted continuously with beam currents of a few up to (maximum current specified by manufacturer for argon ion-beam production). The ion source is equipped with two pairs of deflection plates ( ), each spaced, which are aligned perpendicular to each other. When switching the electric potentials applied to the plates between an ion blocking and transmission state, chopped ion packets can be extracted, which is required for the operation of the MR-ToF MS. Bunches with a full width of half maximum (FWHM) minimum of about can be extracted. The ion source is attached to a quadrupole ion bender, which provides the possibility to add other ion source types at a later stage. Downstream, the MR-ToF MS allows beam analysis and mass-selective ion ejection towards the RFQ, in which the ions remain trapped until up to ions are accumulated in one bunch. While ion accumulation is the main purpose of the RFQ, the ion bunch emittance can simultaneously be reduced within milliseconds through buffer gas cooling. Subsequently, the ions are ejected and guided towards the PUMA Penning trap, in which they annihilate with the trapped antiprotons.
2.2 The MR-ToF mass spectrometer
MR-ToF systems, operated in various nuclear laboratories around the world [28, 29, 26, 30, 31], share the operating principle that charged particles are trapped between two opposing ion-optical mirrors and ejected after up to thousands of revolutions. In this way, the ion flight path can reach several kilometres in experimental setups that measure only a few meters. Furthermore, the reflecting potentials are tuned to retain small temporal bunch widths by compensating flight-time differences resulting from small discrepancies in the ions’ energies. Ion species differing in mass-over-charge ratio and accelerated by the same electric potential can thus be separated with isobaric precision. The two electrostatic mirrors are usually made of stacks of cylindrical electrodes for better control of the potential gradients and are separated by a field-free drift region [32].
The design of the PUMA MR-ToF MS is a further development that started from the present MR-ToF setup at the University of Greifswald [25, 33, 34, 35], which includes lens and steering optics in front of the entrance and behind the exit mirror, in-trap deflector electrodes for in-trap separation of unwanted ion species [36] and an in-trap lift electrode. The latter can be used to capture ions at adjustable storing energies as well as to eject a desired ion species after mass separation [37, 38, 39]. The PUMA offline ion source is intended to allow for fast accumulation of up to mass-selected ions inside the RFQ before they are sent to the antiprotons in the PUMA Penning trap to obtain annihilation event rates that can be distinguished from background annihilations. Therefore, the design aims to maximise the transversal acceptance of the MR-ToF device to allow for a large ion throughput while guaranteeing a sufficient mass resolving power of up to 105.
Intuitively, the acceptance is expected to increase with the inner diameter of the electrodes. To our knowledge, however, a correlation is not known and, thus, it is investigated in the following with simulations. The maximum possible electrode size is limited by the vacuum tubes, which are chosen to have an inner diameter of in the present design. Due to limited space of the experimental site at ELENA, it is decided to allow a maximum length of for the MR-ToF MS. In analogy to the Greifswald design, the MR-ToF system should include injection and ejection ion optics, the in-trap deflector and lift electrodes. However, it is decided not to include the support for temperature compensation [33] in the new MR-ToF system, as it has been found that the stability of the potentials is much more important than the influence of temperature fluctuations [40]. This allows a simpler and more modular design. Furthermore, similar to the Greifswald design, it is decided to use six electrodes per ion-mirror stack, including one electrode on negative potential which is intended to form lens-like potentials for radial refocusing and five electrodes on positive potential. The operation of existing MR-ToF systems has shown that this provides sufficient degrees of freedom to shape the potential profile to reach mass resolving powers beyond 100,000.
3 Simulations
For the optimisation of the electrode geometry, simulations are performed using SIMION® [41]. This allows to define customised electrode geometries to which a potential can be assigned. The software then calculates the resulting electric fields by solving the Laplace equation. Based on the potential array thus determined, ion trajectories are calculated as a function of the starting values of the ions. In all simulations described, we use cations. The application to anions requires a polarity change of the specified potential values.
3.1 Simulation method
Using SIMION®, the ion-optical acceptance of a given electrode geometry is determined by measuring the emittance of the ions that successfully pass through the MR-ToF system. However, this strongly depends on the six-dimensional potential set which is applied to the mirror electrodes. Here, we assume that the same potential is applied mirror-symmetrically to opposing electrodes. A potential combination that allows sufficiently isochronous ion reflection (time dispersion of the ion bunch per revolution in the order of a few tens of picoseconds), again depends on the electrode geometry and can only be found with a more time-consuming optimisation algorithm. However, this approach can result in local minima, which means that comparability between different geometries is not necessarily given. Therefore, an alternative measure is used that indirectly reflects the ion acceptance and is comparable for different designs, regardless of the electrode size and shape: We use the volume of the subspace formed by all mirror potential sets that allow a given ion bunch to be trapped without losses. If the initial conditions for the ions are not changed for the trajectory simulations of different geometries, the solution volume is expected to reflect the acceptance depending on the proposed geometry modifications. Since it is not possible to calculate the described volume analytically, its size is determined using a Monte Carlo (MC) approach.
The voltages that can be applied to the mirror electrodes are limited by the maximum operation voltage of for standard SHV connectors. Furthermore, we restrict the outer five mirror electrodes to a repulsive potential, while the innermost electrode is used as lens with a negative potential applied to it. This provides a finite sample volume of voltage combinations for the mirror electrodes. The used mirror potentials are taken randomly from the defined voltage interval. With the weight function , which is equal to 1 if the applied potential profile allows to trap all ions on loss-free trajectories and equal to 0 if this is not the case, the MC simulation approaches the desired relative solution volume
| (1) |
by calculating the mean value
| (2) |
Here, is the number of voltage configurations tested. An illustration of the potential volume determined in this kind of MC simulation is provided in Sec. 3.4. Unless stated otherwise, 100 85Rb+ ions trapped for 20 revolutions are used in each of the following simulations.
| mirror concept | spacing | ||||||
|---|---|---|---|---|---|---|---|
| Greifswald MR-ToF analyser | |||||||
| unified mirror electrodes |
3.2 Determination of the mirror electrode size
To converge to a final electrode design, the MC simulation approach is applied to MR-ToF systems with varying electrode dimensions. The design currently in use at the University of Greifswald has mirror electrodes of different lengths. As a first step, it is investigated whether the unification of the mirror electrode length has an effect on the solution volume. Identical mirror electrodes provide the advantages to make use of mass production. Therefore, the MC simulation is applied to two different mirror concepts with electrode lengths as specified in Tab. 1. The length of the unified electrodes is chosen such that the total length of the electrostatic mirror equals that of the Greifswald MR-ToF analyser while the length of the negative mirror electrode (M1) is on the same order of magnitude.
The ion bunch used for the simulation has a transverse 2 emittance of 3.7 and a Gaussian energy distribution around with a standard deviation of . According to the MC simulation, this leads to the solution volumes of for unified electrodes and for the Greifswald design. Considering the uncertainties, the results are compatible with each other. Therefore, the advantages of uniform electrodes are considered to be more important and it is decided to use mirror electrodes of equal length, which has yet to be determined.
As stated above, it is to be expected that the acceptance of the MR-ToF analyser is increased by increasing the inner diameter of the system, i.e. the diameter of the in-trap lift and that of the mirror electrodes . Also, their ratio / as well as the ratio /, where is the length of a mirror electrode, may affect the acceptance.
To investigate the effect of the mirror electrode size, MC simulations are conducted for fifteen different mirror designs with varying electrode lengths (, , , and ) and inner diameters (, and ). The values are chosen to meet the mechanical and experimental length restrictions and to feature reasonable dimensional differences in order to see a trend of as a function of the electrodes’ dimension. Further, the diameter value of was chosen to match the mirror diameter to that of the in-trap lift used in this simulation.
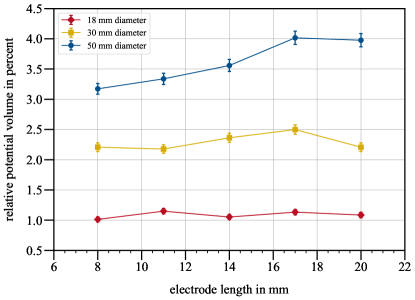
The results are given in Fig. 2. Confirming the expectations, we see that grows with increasing inner diameter, which is interpreted as an increased acceptance. Moreover, it turns out that there is an optimum electrode length as a function of its diameter, which becomes more apparent for larger diameters. Based on these results, we decide to use mirror electrodes with the largest diameter compatible with the current design constraints, which is and is simulated below.
With the diameter determined, the mirror electrode length is varied, keeping the in-trap lift electrode dimensions at and . As can be seen in Tab. 2, a maximum is found for . Larger mirror electrodes are not considered because long electrodes come at the expense of a shorter in-trap lift electrode and thus reduced longitudinal acceptance due to the given limit of the MR-ToF MS length (see Sec. 2.2). The negative mirror electrode (M1) is optimised using the same algorithm leading to a length of .
3.3 Final electrode dimensions
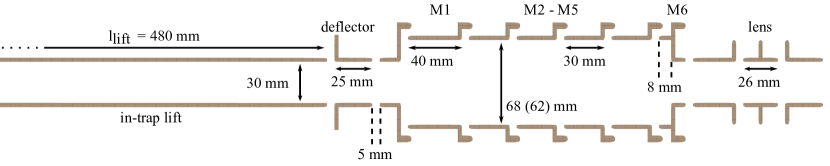
Finalising the geometry of the MR-ToF system, the MC algorithm is used to define the in-trap lift diameter and that of the aperture on the injection and ejection side of the mirror. is determined for both dimensions. Furthermore, the length of the in-trap lift, , is chosen to ensure that the MR-ToF system uses the entire length of the vacuum chamber. A variation of the aperture of mirror electrode M6, which forms the transition between the mirror electrode stack and the lens electrode assembly, shows no relevant influence on the solution volume. It is adjusted to the lift and lens diameter. Due to minor technical difficulties in the design of the mirror electrode assembly, the inner diameter had to be reduced from to . An overview of the final geometry and relevant dimensions is given in Fig. 3. It should be noted that all the investigations shown are multi-dimensional problems and the result of each simulation is affected by all electrode dimensions. However, the simulation effort for an absolute optimisation of the MR-ToF MS geometry in dependence of all relevant dimensions on each other is not feasible in terms of simulation cost.
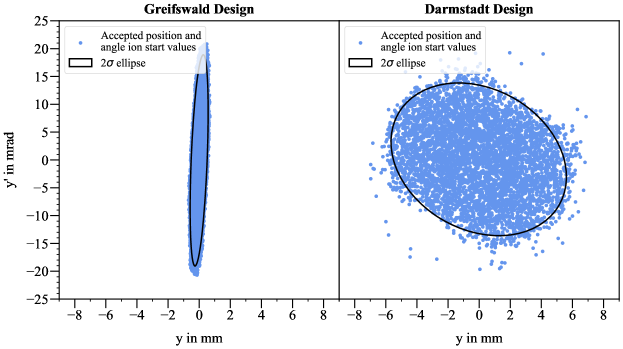
After specifying the electrode geometry, final MC simulations are performed to compare the solution spaces obtained from the Greifswald and the new Darmstadt design. A solution volume of is found for the Greifswald MR-ToF device and for the new PUMA MR-ToF system. The solution space is increased by a factor of about six for the considered ion distribution. This result is interpreted as an increased acceptance. To investigate the acceptance change directly, the potential profiles leading to the largest mass resolving power are selected for each solution space, where is the mean ToF and the FWHM ToF of the simulated ions. Based on these two mirror potential sets and geometries, the starting values of the ions that can be successfully trapped for 100 revolutions and ejected are measured. To include the capture and ejection process, the ions are generated in front of the injection lens and stopped behind the ejection lens. The result is plotted in Fig. 4 together with the 2 ellipse containing of the measured data points. Compared to the Greifswald design the area of the 2 ellipse increases from to , directly showing the increase in acceptance by a factor of about eight.
| electrode | M1 | M2 | M3 | M4 | M5 | M6 | in-trap lift |
|---|---|---|---|---|---|---|---|
| potential in |
3.4 Potential profile determination
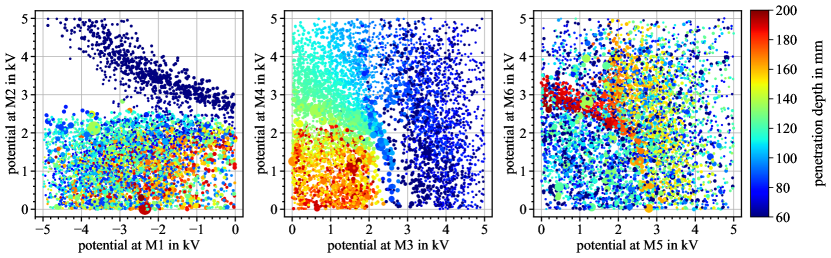
The MC simulation approach described is not only used to improve the system’s acceptance, but also to determine suitable potential profiles. Figure 5 illustrates the potential configurations obtained from the MC simulation performed for the final electrode design. While the spot size reflects the value of the final bunch width, the larger the plotted circle the larger the width of the ToF distribution, the colour indicates the penetration depth of the ions into the long electrostatic mirror.
Highlighted by clusters of points of the same colour, subspaces of the potential volume can be identified that allow ion storage at different penetration depths. Stable trajectories are found that have reversal points over almost the entire span of the mirror volume. A penetration depth of corresponds to the first of the mirror electrode M2, while a depths of forms the end of the mirror electrode volume. In order to include all mirror electrodes to contribute to the reflecting mirror potential, voltage configurations that allow a penetration depth of about 160 - are considered. In this way, the available six degrees of freedom are exploited, which is expected to be beneficial for the compensation of the time dispersion of the trapped ion bunches. By additionally separating those that lead to the smallest possible bunch widths, suitable mirror potentials can be determined.
For the further improvement of the mirror potential shape, a simplex optimisation routine (Nelder-Mead downhill type) is used, included in a module provided by SIMION®. The algorithm varies the potentials applied to the six mirror electrodes while locally minimising a user-specific metric. This allows to reduce the final bunch width further and thus increase the mass resolving power after a given number of revolutions.
Based on this approach, the mirror potential set to be used for commissioning measurements is determined for a 85Rb+ beam captured with a trapping energy of about inside the MR-ToF MS. The relevant potentials are provided in Tab. 3. While the injection and ejection lens are set to , all steering and in-trap deflector segments are kept at .
With this specific potential configuration, the mass resolving power achievable is investigated varying the initial ion distribution. Keeping the transverse 2 emittance constant at 8 , initial bunch widths of , and (FWHM) are combined with energy distributions of , and (FWHM). In the ideal case of and , the mass resolving power reaches a value of about 630,000 after 2000 revolutions. In contrast, at and the mass resolving power reaches a value of about 230,000 for similar storing times. Although the resolving power for ion selection is generally smaller, the values obtained are sufficient to achieve the objectives of the offline ion source to provide isotopically pure stable ion bunches.
4 Technical design
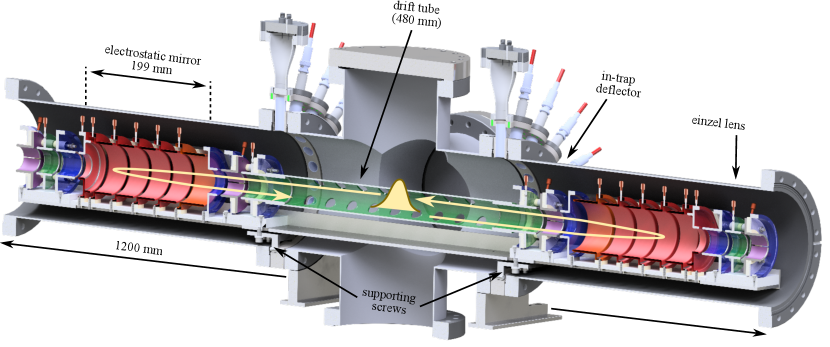
A sectional view of the system is shown in Fig. 6. It includes the electrostatic mirrors, lens and steering electrodes in front of the entrance mirror and behind exit mirror as well as in-trap deflector electrodes. The central drift tube serves as an in-trap potential lift.
To maintain high flexibility, all in-vacuum components are combined into individual subassemblies that are placed on separate base plates, see Sec. 4.1 and 4.2. All modules are in turn supported by a base plate ranging over the full length, which is referred to as the optical table in the following. Apart from electrically nonconducting materials and electrode supporting base plates made of aluminium and titanium, all in-vacuum components are made of stainless steel (material number 1.4404). For electrical insulating components, alumina ceramic and Macor® glass ceramic are chosen, which allow bake-out temperatures up to . With the materials used, it is expected to reach a vacuum below inside the MR-ToF MS during operation, reducing ion losses, especially for long storage times.
4.1 Electrode assemblies
Separated by the drift tube, the symmetrical arms of the MR-ToF mass spectrometer are formed by three subassemblies, which each serve individual purposes. This modular character offers the advantage of flexible assembly and easy modification for adaptations. Each subassembly is mounted onto its own base plate before it is fixed to the long, wide and thick optical table. Thus, it can be dismounted, modified and reintegrated without changing the remaining system. In the following, the three electrode modules are described in more detail, from the inside out.
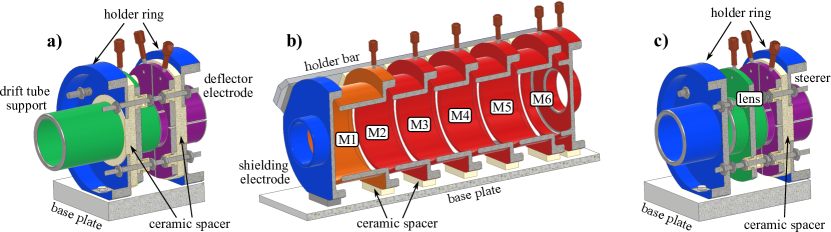
The innermost electrode assembly includes a support electrode for the drift tube as well as an in-trap deflector electrode. The central drift tube can be plugged onto the support and is fixed to it by integrated screws. The in-trap deflector, which enables mass-selective ion deflection during the ion trapping phase, is formed by a quartered ring electrode which connects to the drift section. When applying an attractive or a repulsive potential to a deflector segment (or opposite potentials to opposing segments), ions can be kicked off their trajectory and are thus removed from the beam [36]. Both components, the drift tube support and the in-trap deflector, are supported by two holder rings from which they are insulated by ceramic spacers. In order to define the axial orientation, all components are mounted on four threaded rods. Their axial distance is specified and fixed by nuts on these rods (see Fig. 7a).
Following the innermost module outwards, the mirror-electrode stack forms the core of the MR-ToF system. A shielding electrode and six mirror electrodes are stacked with a distance of , electrically insulated by MACOR® spacer plates and mounted on a common base plate. To keep the electrodes axially aligned, insulated holder bars fix the electrode orientation at two additional positions (see Fig. 7b).
At both ends of the MR-ToF MS, a lens and ion steering module completes the assembly. Similar to the in-trap module, presented above, a lens electrode and a quartered steering electrode, identical in construction to the in-trap deflector, are supported by four threaded rods and two mounting rings. One of the latter, together with the steering electrode, serves as grounded lens segment in front of and behind the lens electrode (see Fig. 7c). To protect the ceramics from mechanical stress during temperature fluctuations, the assemblies, which are secured by threaded rods, are spring-loaded. It allows movement of the electrodes and decouples the electrodes from the thermal expansion of the threaded rods. All electrodes are connected to standard SHV feedthroughs via in-vacuum Kapton cables and beryllium-copper connectors, which are plugged onto set screws integrated in the electrodes.
4.2 In-vacuum support system
The optical table that supports the complete MR-ToF system is made of titanium. It is reinforced by two additional long, wide and thick titanium plates to form a U-shaped profile. Originally, only one plate was planned but it was found that the plate bends too much under the weight of the electrodes. The material has been chosen because of the low thermal expansion coefficient, for temperatures between and , compared to for 1.4404-type stainless steel and for aluminium [42]. The lowest possible thermal expansion is in the interest of a stable potential profile and thus an improved mass resolving power for elongated measurement timescales. Consequently, it is advantageous to limit temperature fluctuations of the in-vacuum components and electrodes. They may most likely arise from variations of the temperature in the laboratory environment. Therefore, it is preferable to decouple the in-vacuum system as much as possible from the surrounding vacuum chamber. Hence, the titanium plate and, thus, the entire MR-ToF electrode system is designed to rest only on the conical tips of four set screws while its position is fixed by two additional screws. The set screws that define the support points are height-adjustable through threaded holes integrated in two dedicated mounting plates attached to the vacuum chamber.
5 Current status
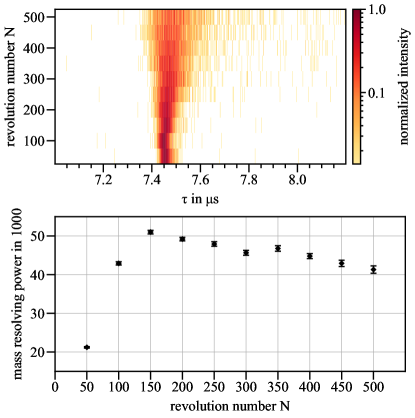
The PUMA offline ion source setup as shown in Fig. 1 has been assembled from the ion source to the Paul trap. The electron impact ionisation source has been commissioned with different gases, such as air, hydrogen, argon, neon and xenon. With an electron energy of about , multiply-charged ions can be generated. For the commissioning of the MR-ToF MS, using argon as target material, a continuous ion beam of approximately is extracted and chopped by pulsing a pair of deflector electrodes included in the ion source with a gate from a deflection to a transmission state. This results in ion packets with a FWHM of the ToF distribution of about , measured with a ToF detector behind the MR-ToF MS. Due to the largest abundance, 40Ar+ was selected to be used for first test measurements. Starting from the potential configuration determined in Sec. 3.4 and compensating possible misalignments by manually tuning the mirror electrodes and the in-trap lift voltage, the ToF focus could be set on the detector behind the device after trapping the ions for about 100 - 150 revolutions. For longer storing times and the given voltage applied to the in-trap lift electrode, the ToF signal is defocused again. This is shown in Fig. 8 together with a plot of the mass resolving power as a function of the number of revolutions that the 40Ar+ ions are trapped in the MR-ToF MS for. With a signal width of (FWHM), the highest mass resolving power of is reached after 150 revolutions.
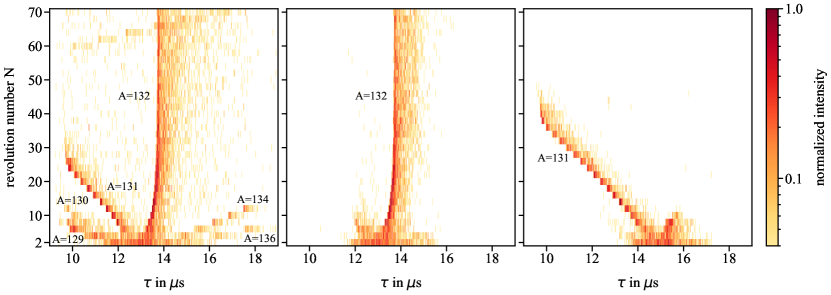
In order to demonstrate the capability for isotopic purification, the in-trap deflector electrodes are commissioned using xenon as target gas, which has nine natural isotopes. A fast high voltage switch (Stahl-Electronics, HS-2000) is used to switch the potential applied to two opposite segments of the quadruple segmented deflector electrode between and , respectively. Thus, the in-trap deflector can be switched between a deflecting ( potential difference) and a transmission state ( potential difference). The rising and falling times are typically below and therefore enable undisturbed deflection of ion species separated by a few . By synchronising the switch to the revolution period of a desired ion mass-over-charge ratio, the deflector can be used for a mass-selective transversal ion ejection [36]. The left-hand plot in Fig. 9 shows the measured ion intensity of singly-charged xenon isotopes as a function of the time-of-flight after the ejection from the MR-ToF MS (abscissa) and the number of revolutions the ions are trapped in the MR-ToF MS for (ordinate). Here, the deflector is not active. Below (above ) ions with a smaller (larger) mass-to-charge ratio are not located in the in-trap lift electrode during switching, resulting in them not being ejected from the MR-ToF MS. The centre plot shows the same measurement but with the deflector activated using a duty cycle of 67%. The latter refers to the ratio between the length of the deflection state of and the revolution period of for A/z=132 ions, where A is the mass number and z the charge state. In this case, the transmission window of the deflector is synchronised and centred on mass A/z=132. In the right-hand plot, the measurement is repeated with the transmission window synchronised and centred to mass A/z=131, allowing to isolate 131Xe ions. To increase the number of revolutions for which 131Xe ions can still be ejected, the capture time was decreased by , which is the time between the ion extraction from the source and the switching of the in-trap lift. This results in a shift of by to a longer ToF.
6 Conclusion and outlook
In the framework of the PUMA project, a new MR-ToF-MS has been developed for the PUMA offline ion source setup, allowing for fast isotopic ion beam purification. To increase the transmission of the device and, thus, decreasing the accumulation time of ions in an RFQ ion trap, which is mandatory for PUMA, SIMION® simulations have been performed modifying the electrode geometry of an MR-ToF MS design from the University of Greifswald. This has predominantly led to an increase in the inner diameters and the corresponding adjustment of the individual electrode lengths. As a result, the transmission could be increased by a factor of about eight, as shown by benchmarking simulations with realistic mirror potential profiles. To facilitate the assembly and allow for later modifications, the design is based on several electrode sub-assemblies. The setup can be used to capture the ions of interest and separate them from unwanted ion species. Furthermore, focus and steering electrodes are included in the design on both the injection and the ejection sides of the device.
The MR-ToF MS has been commissioned, using a chopped argon ion beam, extracted from a commercial electron impact ionisation source. First mirror tuning attempts have led so far to a mass resolving power of 50,000, trapping Ar+ ions for 150 revolutions. Furthermore, the in-trap deflector has been commissioned using Xe+ ions. For the examples 131Xe+ and 132Xe+, it could be demonstrated that the device is able to successfully isolate isotopes of interest from a stable ion spectrum.
Already during the simulation phase, an increasing number of institutes expressed their interest in an MR-ToF device. As a result, the Darmstadt’s MR-ToF (DA’s MR-ToF) Collaboration has been formed to distribute the manufacturing and acquisition of the different parts among seven institutions. These collaboration partners are the Technical University of Darmstadt, the University of Greifswald, the University of Groningen, the University of Manchester, the Massachusetts Institute of Technology, the Johannes Gutenberg University Mainz and the University of Innsbruck.
Acknowledgements
We gratefully acknowledge the discussions with the staff of the mechanical workshop at TU Darmstadt and thank the contributing institutes and workshops for their support. The PUMA project is funded by the European Research Council through the ERC grant PUMA-726276. J.F., C.K., A.O., A.S. and M.S. appreciate the support from the Alexander von Humboldt Foundation.
References
- [1] Heiko Hergert “A Guided Tour of ab initio Nuclear Many-Body Theory” In Front. Phys. (Lausanne) 8, 2020 DOI: 10.3389/fphy.2020.00379
- [2] J. Zenihiro et al. “Neutron density distributions of deduced via proton elastic scattering at MeV” In Phys. Rev. C 82 American Physical Society, 2010, pp. 044611 DOI: 10.1103/PhysRevC.82.044611
- [3] A. Krasznahorkay et al. “Neutron-skin thickness in neutron-rich isotopes” In Nucl. Phys. A 731, 2004, pp. 224–234 DOI: 10.1016/j.nuclphysa.2003.11.034
- [4] B. Kłos et al. “Neutron density distributions from antiprotonic and atoms” In Phys. Rev. C 76 American Physical Society, 2007, pp. 014311 DOI: 10.1103/PhysRevC.76.014311
- [5] D. Adhikari et al. “Accurate Determination of the Neutron Skin Thickness of through Parity-Violation in Electron Scattering” In Phys. Rev. Lett. 126 American Physical Society, 2021, pp. 172502 DOI: 10.1103/PhysRevLett.126.172502
- [6] C.. Tarbert et al. “Neutron Skin of from Coherent Pion Photoproduction” In Phys. Rev. Lett. 112 American Physical Society, 2014, pp. 242502 DOI: 10.1103/PhysRevLett.112.242502
- [7] X. Roca-Maza, M. Centelles, X. Viñas and M. Warda “Neutron Skin of 208Pb, Nuclear Symmetry Energy, and the Parity Radius Experiment” In Phys. Rev. Lett. 106 American Physical Society, 2011, pp. 252501 DOI: 10.1103/PhysRevLett.106.252501
- [8] C.. Horowitz and J. Piekarewicz “Neutron Star Structure and the Neutron Radius of 208Pb” In Phys. Rev. Lett. 86 American Physical Society, 2001, pp. 5647–5650 DOI: 10.1103/PhysRevLett.86.5647
- [9] K. Hebeler, J.. Lattimer, C.. Pethick and A. Schwenk “EQUATION OF STATE AND NEUTRON STAR PROPERTIES CONSTRAINED BY NUCLEAR PHYSICS AND OBSERVATION” In Astrophys. J. 773 The American Astronomical Society, 2013, pp. 11 DOI: 10.1088/0004-637X/773/1/11
- [10] I. Tanihata et al. “Measurements of Interaction Cross Sections and Nuclear Radii in the Light -Shell Region” In Phys. Rev. Lett. 55, 1985, pp. 2676–2679 DOI: 10.1103/PhysRevLett.55.2676
- [11] T. Frederico, A. Delfino, Lauro Tomio and M.T. Yamashita “Universal aspects of light halo nuclei” In Prog. Part. Nucl. Phys. 67, 2012, pp. 939–994 DOI: 10.1016/j.ppnp.2012.06.001
- [12] P G Hansen, A S Jensen and B Jonson “Nuclear Halos” In Annu. Rev. Nucl. Part. Sci. 45, 1995, pp. 591–634 DOI: 10.1146/annurev.ns.45.120195.003111
- [13] K. Riisager “Halos and related structures” In Phys. Scr. T152 IOP Publishing, 2013, pp. 014001 DOI: 10.1088/0031-8949/2013/t152/014001
- [14] T. Aumann et al. “PUMA, antiProton unstable matter annihilation” In Eur. Phys. J. A 58, 2022, pp. 88 DOI: 10.1140/epja/s10050-022-00713-x
- [15] Sabrina Zacarias “Probing nuclear density tails with antiprotons at PUMA: Detection and method”, 2022 DOI: 10.26083/tuprints-00022851
- [16] Stephan Maury et al. “ELENA: the extra low energy anti-proton facility at CERN” In Hyperfine Interact. 229, 2014, pp. 105–115 DOI: 10.1007/s10751-014-1067-y
- [17] E Kugler “The ISOLDE facility” In Hyperfine Interact. 129, 2000, pp. 23–42 DOI: 10.1023/A:1012603025802
- [18] R Catherall et al. “The ISOLDE facility” In J. Phys. G 44 IOP Publishing, 2017, pp. 094002 DOI: 10.1088/1361-6471/aa7eba
- [19] H. Wollnik and M. Przewloka “Time-of-flight mass spectrometers with multiply reflected ion trajectories” In Int. J. Mass Spectrom. 96, 1990, pp. 267–274 DOI: 10.1016/0168-1176(90)85127-N
- [20] Hermann Wollnik “History of mass measurements in time-of-flight mass analyzers” In Int. J. Mass Spectrom. 349-350, 2013, pp. 38–46 DOI: 10.1016/j.ijms.2013.04.023
- [21] F Herfurth et al. “A linear radiofrequency ion trap for accumulation, bunching, and emittance improvement of radioactive ion beams” In Nucl. Instrum. Methods Phys. Res. A 469, 2001, pp. 254–275 DOI: 10.1016/S0168-9002(01)00168-1
- [22] A. Nieminen et al. “On-Line Ion Cooling and Bunching for Collinear Laser Spectroscopy” In Phys. Rev. Lett. 88 American Physical Society, 2002, pp. 094801 DOI: 10.1103/PhysRevLett.88.094801
- [23] E. Mané et al. “An ion cooler-buncher for high-sensitivity collinear laser spectroscopy at ISOLDE” In Eur. Phys. J. A 42, 2009, pp. 503–507 DOI: 10.1140/epja/i2009-10828-0
- [24] A.A. Valverde et al. “A cooler-buncher for the N=126 factory at Argonne National Laboratory” In Nucl. Instrum. Methods Phys. Res. B 463, 2020, pp. 330–333 DOI: 10.1016/j.nimb.2019.04.070
- [25] Paul Fischer and Lutz Schweikhard “Multiple active voltage stabilizations for multi-reflection time-of-flight mass spectrometry” In Rev. Sci. Instrum. 92, 2021, pp. 063203 DOI: 10.1063/5.0050568
- [26] T. Dickel et al. “A high-performance multiple-reflection time-of-flight mass spectrometer and isobar separator for the research with exotic nuclei” In Nucl. Instrum. Methods Phys. Res. A 777, 2015, pp. 172–188 DOI: 10.1016/j.nima.2014.12.094
- [27] M. Rosenbusch et al. “The new MRTOF mass spectrograph following the ZeroDegree spectrometer at RIKEN’s RIBF facility” In Nucl. Instrum. Methods Phys. Res. A 1047, 2023, pp. 167824 DOI: 10.1016/j.nima.2022.167824
- [28] R.N. Wolf et al. “ISOLTRAP’s multi-reflection time-of-flight mass separator/spectrometer” In Int. J. Mass Spectrom. 349-350, 2013, pp. 123–133 DOI: 10.1016/j.ijms.2013.03.020
- [29] M. Rosenbusch et al. “A new multi-reflection time-of-flight mass spectrograph for the SLOWRI facility” In Nucl. Instrum. Methods Phys. Res. B 463, 2020, pp. 184–188 DOI: 10.1016/j.nimb.2019.05.058
- [30] C. Jesch et al. “The MR-TOF-MS isobar separator for the TITAN facility at TRIUMF” In Hyperfine Interact. 235, 2015, pp. 97–106 DOI: 10.1007/s10751-015-1184-2
- [31] Tsviki Y. Hirsh et al. “First operation and mass separation with the CARIBU MR-TOF” In Nucl. Instrum. Methods Phys. Res. B 376, 2016, pp. 229–232 DOI: 10.1016/j.nimb.2015.12.037
- [32] Y. Ishida et al. “A time-of-flight mass spectrometer to resolve isobars” In Nucl. Instrum. Methods Phys. Res. B 219-220, 2004, pp. 468–472 DOI: 10.1016/j.nimb.2004.01.104
- [33] S. Knauer et al. “A multi-reflection time-of-flight setup for the improvement and development of new methods and the study of atomic clusters” In Int. J. Mass Spectrom. 446, 2019, pp. 116189 DOI: 10.1016/j.ijms.2019.116189
- [34] Paul Fischer and Lutz Schweikhard “Isotope-resolved photodissociation pathways of lead-doped bismuth clusters from tandem multi-reflection time-of-flight mass spectrometry” In Phys. Rev. Res. 1 American Physical Society, 2019, pp. 033050 DOI: 10.1103/PhysRevResearch.1.033050
- [35] Paul Fischer and Lutz Schweikhard “Decay-rate power-law exponent as a link between dissociation energy and temperature” In Phys. Rev. Res. 2 American Physical Society, 2020, pp. 043177 DOI: 10.1103/PhysRevResearch.2.043177
- [36] Paul Fischer, Stefan Knauer, Gerrit Marx and Lutz Schweikhard “In-depth study of in-trap high-resolution mass separation by transversal ion ejection from a multi-reflection time-of-flight device” In Rev. Sci. Instrum. 89, 2018, pp. 015114 DOI: 10.1063/1.5009167
- [37] Robert N. Wolf, Gerrit Marx, Marco Rosenbusch and Lutz Schweikhard “Static-mirror ion capture and time focusing for electrostatic ion-beam traps and multi-reflection time-of-flight mass analyzers by use of an in-trap potential lift” In Int. J. Mass Spectrom. 313, 2012, pp. 8–14 DOI: 10.1016/j.ijms.2011.12.006
- [38] F. Wienholtz et al. “Mass-selective ion ejection from multi-reflection time-of-flight devices via a pulsed in-trap lift” In Int. J. Mass Spectrom. 421, 2017, pp. 285–293 DOI: 10.1016/j.ijms.2017.07.016
- [39] S. Knauer et al. “Multi-reflection time-of-flight mass spectrometry with combined in-trap lift capture and mirror-switch ejection” In Int. J. Mass Spectrom. 423, 2017, pp. 46–53 DOI: 10.1016/j.ijms.2017.10.007
- [40] F. Wienholtz et al. “Improved stability of multi-reflection time-of-flight mass spectrometers through passive and active voltage stabilization” In Nucl. Instrum. Methods Phys. Res. B 463, 2020, pp. 348–356 DOI: 10.1016/j.nimb.2019.04.061
- [41] David A Dahl “SIMION for the personal computer in reflection” In Int. J. Mass Spectrom. 200, 2000, pp. 3–25 DOI: 10.1016/S1387-3806(00)00305-5
- [42] Werner Martienssen and Hans Warlimont “Springer Handbook of Condensed Matter and Materials Data” Berlin, Heidelberg: Springer, 2005 DOI: 10.1007/3-540-30437-1