Problems in the astrophysics of accretion onto compact celestial bodies ∗00footnotetext: ∗Invited book chapter in ”Highlights of the Compact Objects Sciences in the Last Decade”, edited by Şölen Balman, IU Press (Istanbul University Press, Turkey)
Jean-Pierre LASOTA1,2
1 Nicolaus Copernicus Astronomical Center, Polish Academy of Sciences,
Warsaw, Poland
2 Institut d’Astrophysique de Paris, CNRS et Sorbonne Université,
Paris, France
E-mail: lasota@iap.fr
Most people do not read; if they read, they do not understand. And those who understand forget.
Henry de Montherlant (French writer; 1895-1972)
Abstract Although during the last decade new observations and new theoretical results have brought better understanding of the physics of accretion onto compact objects, many old and several new questions and problems await answers and solutions. I show how the disc thermal–viscous instability model applied to both cataclysmic variable stars and X–ray binary transients compels us to conclude that assuming the existence in these systems of a flat accretion disc extending down to the accretor’s surface or to the last stable orbit and fed with matter at its outer edge is too simple and inadequate a description of these objects. It is also clear that, in most cases, these discs cannot driven by (anomalous) viscosity only. The origin of the superhumps observed in cataclysmic variables and X–ray binaries is, contrary to the common opinion, still unknown. In accreting magnetic white dwarf systems outbursts not of the dwarf–nova type can be due to the magnetic gating instability and/or thermonuclear micronova explosions. Although the “typical” lightcurves of X–ray transients can be described by analytical formulæ (but their decay phase is not exponential), observations show that in many cases the light variations in these systems are much more complex. An elementary argument shows the impossibility of magnetars in pulsing ultraluminous X–ray systems, but we still do not have a complete, self-consistent description of supercritical accretion onto magnetized neutron stars and the resulting (necessarily beamed) emission. Although it is (almost) universally believed that active galactic nuclei contain accretion discs of the same type as those observed in binary systems, the evidence supporting this alleged truth is slim and the structure of accretion flows onto supermassive black holes is still to be determined.
Keywords: black holes, neutron stars, white dwarfs - accretion, accretion discs - binary stars
1.1 Introduction
1.1.1 Accretors
There are three types of compact celestial bodies in the Universe: white dwarfs, neutron stars and black holes. Other types of compact objects have also been proposed, e.g. strange stars, gravastars, Q-stars, boson stars etc., but so far, no evidence of their existence has been found. Compactness is defined through the size of the body relative to its gravitational radius . For white dwarfs, this is , so they are “weakly” compact, but their efficiency of accretion can be comparable to the efficiency of thermonuclear reactions. Neutron stars are obviously relativistic bodies with .
Black holes are purely general–relativistic objects. However, this does not mean that they must be extremely dense, or that the gravitation at their surface must be extremely strong, contrary to what is (too) often asserted in the media and even in the astrophysical literature. The mean density of a non–rotating black hole () is equal to
| (1.1) |
(decreasing with the square of the black hole mass) so the mean density of a black hole is the same as the density of air. It’s not clear what the density of a black hole corresponds to, but since the space–time curvature is also , Eq. (1.1) tells us that the curvature near a black-hole horizon is not necessarily strong. The space-time curvature in the vicinity of the famous M87* black hole () is weaker than on the Earth’s surface. In this sense, gravitation is stronger around us than it is near this six–billion solar-mass compact body. But this does not exempt us from using Einstein’s theory of gravitation when describing physical processes in the vicinity of a supermassive black hole. Although the pull of gravitation can be locally suppressed by free–falling, crossing a black–hole surface, despite being unnoticeable, has literally inescapable consequences. Above the black–hole’s surface, its gravity pull can be locally counteracted by applying external forces (through engines) but at the surface itself this requires infinite energy. What is, usually, called the “black–hole surface” is, in fact a 2D slice of a stationary and axisymmetric null hypersurface – a global, space–time structure. This has consequences that are, too often, ignored by astrophysicists.
The space–time curvature certainly cannot be ignored when considering motions on the scale of the curvature radius, such as propagation of light emitted near the black hole surface (see e.g. Gralla et al., 2019; Vincent et al., 2021). Also the popular “pseudo–potential” of Paczynsky and Wiita, (1980) should be used with care, since it describes correctly only Keplerian orbits (in the Schwarzschild metric) of massive particles in the equatorial plane, but not other types of motions (and not the light propagation, of course).
Black holes supposedly come in three mass categories: stellar–mass, intermediate–mass and supermassive (sometimes just called “massive”). The first category is observed mostly in binary systems with a normal star, but since 2015, mergers of couples of such black holes have been observed in gravitational waves. While the masses of black holes in electromagnetically observed binaries span the range (Miller-Jones et al., , 2021), in the case of detection through gravitational waves this range is much larger, spanning (Abbott and LVK collaboration, , 2023). This difference could be due to the fact that observations in gravitational waves reaching up to , access a much larger range of metallicities than observations in electromagnetic waves (Belczynski et al., , 2021). Low metallicities allow the formation of high–mass () black holes (Belczynski et al., , 2010). The existence of intermediate–mass black holes (IMBHs) is still to be confirmed. It is now clear that they are not components of the ultraluminous X–ray sources (see, e.g., King et al., , 2023), but black hole mergers can result in objects, formally in the IMBH range. The existence of supermassive black holes in galaxy centres is well established. The maximum mass of an accreting black hole could be equal to (King, , 2016), but this result relies on the (untested, see Sect. 1.7) hypothesis that standard accretion discs are present in active galactic nuclei (AGN). It is conceivable that primordial, “stupendously” massive () black holes exist (Carr et al., , 2021).
Accretion flows
Most of accretion flows onto compact celestial bodies contain a sufficient amount of angular momentum to form a flattened rotating structure, usually called an “accretion disc” even when it looks more like a torus. In binary systems, an accretion disc always form when the mass–loosing star is filling, or almost filling, its Roche lobe. It is not clear what is the structure of the inner accretion flow in active galactic nuclei (see e.g. Antonucci, 2013 and Sect. 1.7), but in at least some cases a spectacular disc is observed far from the nuclear black hole (e.g. a warped Keplerian disc in NGC 4258; Miyoshi et al., 1995).
In the case of cataclysmic variables (CVs), thanks to observations of eclipsing systems, there is no doubt that the accreting white dwarf is surrounded by a geometrically thin Keplerian disc. Some such discs have been observed in a bright steady state (e.g., Horne and Stiening, 1985), other in a non–steady quiescent state (e.g. Wood et al., 1986). Despite this certainty, the predictions of accretion disc models do not always correspond to observations. This is the case of disc spectra which fail to be faithfully reproduced by the standard –disc model (see e.g. Idan et al., 2010). The problem lies in the disc’s vertical structure which still not well understood (Hubeny and Long, , 2021). In other systems, in cases where the existence of an accretion disc is not well established, model predictions not corresponding to the observed spectra (as e.g. Kinney et al., 1989) should not be automatically used as a decisive argument against the disc’s presence.
It seemed that the discovery by Balbus and Hawley, (1991) that the magneto–rotational–instability (MRI) triggers turbulence in Keplerian discs, had finally solved the problem of the origin of the accretion driving mechanism, but in reality things are more complicated. First, the MRI works only in ionised discs, while quiescent (low temperature) discs between dwarf–nova and transient X–ray binary outbursts are neutral, hence not subject to MRI (Scepi et al., , 2018). The same is true of protostellar accretion discs (Lesur, , 2021). Therefore some other angular–momentum transport mechanisms have to be at work in such discs (e.g., winds, Scepi et al., 2019). Second, in hot discs of dwarf novæ and X–transients in outburst, the observed decay times imply a viscosity parameter (corresponding to the ratio of the (vertically averaged) total stress to thermal (vertically averaged) pressure) (in the case of dwarf novæ, Kotko and Lasota, 2012) and (for X–ray transients, Tetarenko et al., 2018), while MRI simulations (with no net magnetic field) give an . In addition, the disc instability model (DIM) that correctly reproduces the main properties of dwarf–nova and X-ray transient outbursts requires a ratio 4 – 10 between the values of in the hot and cold states of the disc (Smak, , 1984; Meyer and Meyer-Hofmeister, , 1984; Hameury et al., , 1998). This is not reproduced by the standard MRI simulations. increases to when convection appears in the MRI simulations (Hirose et al., 2014) but this is not sufficient to produce dwarf–nova lightcurves resembling the ones observed (Coleman et al., , 2016). It seems that additional ingredients, such as winds (Scepi et al., 2019; Tetarenko et al., 2018) must play a role in driving disc accretion.
Despite its obvious weaknesses, the DIM (see Lasota, 2001; Hameury, 2020 for reviews of the model) has proved to be a powerful tool to test some basic properties of accretion discs, mainly those relating to the accretion driving mechanisms. The best test-bed for the MRI simulations are CV discs, in particular those of dwarf–novæ, since they are the real structures closest to what these simulations are supposed to describe. Due to a couple incorrect determinations of the distance to the closest dwarf nova SS Cyg, the veracity of DIM was put out to doubt, but its reputation has been rescued by distance measurements by radio interferometry and Gaia (see Schreiber, 2013 and references therein).
In this chapter I present and discuss problems with understanding accretion onto compact objects, that have been solved or have arisen mainly during the preceding decade. As usual, solving some problems, gives rise to new ones. The chapter begins with a reminder of the basic DIM features. This is followed by a discussion of the problems of applying this model to the description of the observed dwarf–nova outbursts. I then present the inadequacy of the almost universally used model of superhumps but I also enumerate the weaknesses of the alternative. The next section deals with outbursts of systems with magnetised white dwarfs. I consider first the (rare) cases when such binaries appear as dwarf novæ, then I present the successful application of the magnetic–gating instability model, designed to explain the neutron–star Rapid Burster, to the case of intermediate polars. I end this section with a discussion the problems with the recently proposed phenomenon of micronovæ. The following part of the article deals with X-ray binaries. I begin with presenting an analytic method of describing the decay–from–maximum light curves of X-ray transients. Then I provide a detailed discussion of pulsing ultra–luminous X-ray sources (PULXs) in which I present a simple argument that exclude the presence of magnetars in these systems. A short subsection deals with recent results on transient ULXs. The chapter ends with a section concerned with the problem of accretion discs in AGNs.
1.2 The thermal–viscous disc–instability
If they are sufficiently large, all hot (K), standard, stationary accretion discs are thermally unstable. In such discs the viscous heating rate per unit surface can be written as
| (1.2) |
where is the angular velocity, the prime denotes the radial derivative, is the column density and the total “viscous” torque (see e.g. Lasota, 2016). In the last equality, the disc is assumed to be Keplerian ().
For Keplerian discs the angular momentum conservation in the form of
| (1.3) |
being the specific (per unit mass) angular momentum (the subscript “in” designs the its value at the flow’s inner limit), implies the following relation between viscosity and accretion rate
| (1.4) |
where is the inner disc radius. Therefore, from Eqs. (1.2) and (1.4) it follows that
| (1.5) |
hence the temperature of the disc is decreasing with distance from the centre:
| (1.6) |
Notice that Eq. (1.6) assumes only the stationarity and Keplerianity of the disc, so it is a universal relation independent of the accretion mechanism.
It follows that for () the temperature profile of a stationary Keplerian accretion disc can be written
| (1.7) |
where
| (1.8) |
if one assumes that , i.e. that it is the ISCO for a non-rotating black hole. and , where the Eddington accretion rate is defined as
| (1.9) |
where is the radiative efficiency of accretion and the electron–scattering (Thomson) opacity coefficient.
For white dwarf accretors the ISCO is not relevant since the stellar radius and typical accretion rates are usually well below the Eddington value. In this case the disc temperature profile is more conveniently written as
| (1.10) |
with
| (1.11) |
where cm.
We see that, for sufficiently large discs, depending on the accretor’s mass and accretion rate, even for very hot discs, a radius will be reached where the temperature drops below K, roughly the hydrogen recombination temperature. This is where the disc not only stops being hot but also becomes thermally unstable (see, e.g. Hameury, 2020). For neutron stars and stellar–mass black holes, the critical (maximal) hot–disc radius is cm for and cm for . For white dwarfs, this radius varies from cm for , to cm for (notice that such accretion rates do not result in luminosities close to the Eddington value, because the accretion efficiency for white dwarfs is and not ).
Therefore cataclysmic variables, whose accretion discs have radii larger than the critical value, cannot be steady.
1.3 Cataclysmic variables
1.3.1 Dwarf novæ
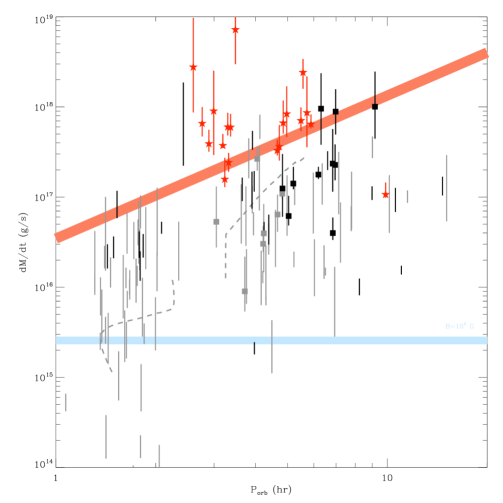
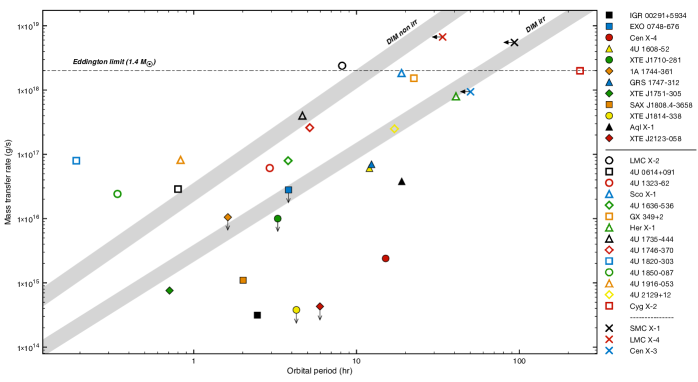
Figure 1.1 shows that they do indeed exhibit outbursts: they are dwarf-nova stars which show repeated outbursts with an amplitude larger than about 2 optical magnitudes on timescales of weeks to decades. In this figure the solid red line corresponds to the stability criterion obtained from Eq. (1.10) by assuming , where is the value of the temperature at which the disc becomes thermally unstable. The critical values of parameters at which the disc becomes unstable are calculated through fits obtained from numerical models of the disc’s vertical structure. The stability limit in Figure 1.1 uses fits from Lasota et al., (2008) where K. Eq. (1.10) provides , so to get one uses a relation between the disc radius and the orbital period , obtained assuming that the radius of the disc is a fraction of the binary separation : , where is the mass ratio (mass-of-the-companion/white-dwarf-mass). In general, is well approximated by .
In Fig. 1.1 all the observed systems above the stability limit are steady (“nova–like”), as they should be; all systems below show outbursts, except for one: a very special magnetic binary AE Aqr, also known as a source of very–high energy emission, for which the method of deducing the mass–transfer rate from the secondary used in plotting the figure does not apply (see Dubus et al., 2018 for details).
1.3.2 Dwarf–nova lightcurves
The DIM for dwarf novæ is not only successful in predicting which CV must be a dwarf nova, but also is able to reproduce the lightcurves of (at least some) of these systems.
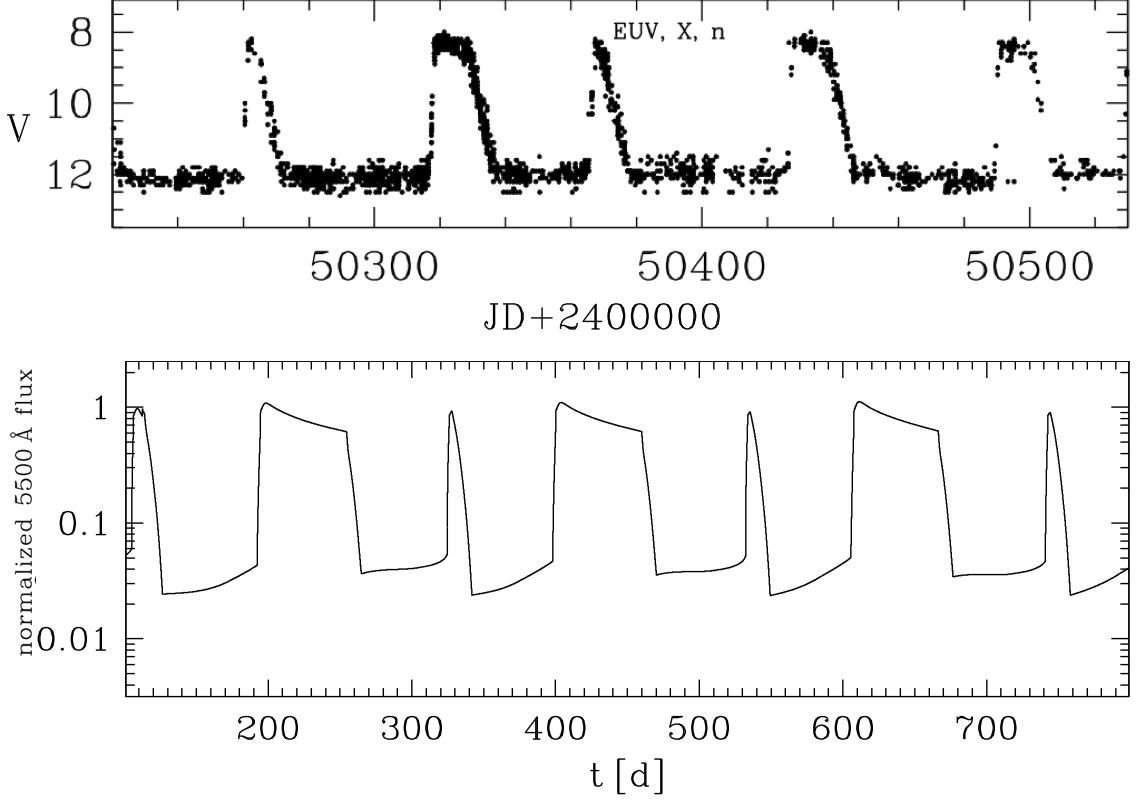
Figure 1.2 (Schreiber et al., , 2003) compares observations of SS Cyg with the lightcurve calculated using the DIM code by Hameury et al., (1998). The DIM reproduces the two types of outbursts observed in this best–observed (and brightest) dwarf nova, as well as the recurrence time. However, one should stress that the “standard” DIM cannot reproduce the observed sequences of dwarf–nova outbursts (see e.g. Hameury, 2020; Lasota, 2001). By “standard” (or “basic”) I understand the model which assumes that the disc always extends to the white-dwarf surface and is supplied in mass to its outer edge at a constant rate. To calculate the lightcurve in Fig. 1.2, the disc was assumed to be truncated and the mass–supply was smoothly varied by . However, SS Cyg, a dwarf-nova of U Gem type, has a relatively simple lightcurve, if one exclude occasional anomalies.
In other type of systems the lightcurves are more complex. For example, in Z Cam–type dwarf novæ, the decay from outburst’s peak is interrupted by a standstill. In this case the DIM can reproduce the lightcurves of Z Cam stars if one takes into account the heating of the outer disc by the impact of the mass–transfer stream and by the tidal torques and if the mass-transfer rate from the secondary varies by about 30% around the value critical for stability (Buat-Ménard et al., , 2001). In this case, the disc during standstill is hot and stable. This, however, seemed to be false when outbursts appearing during standstills were observed (Simonsen, , 2011; Szkody et al., , 2013). Hameury and Lasota, (2014) showed that applying the DIM to such systems requires a rather special type of mass–transfer bursts from the secondary. Such bursts should last a few days and have short rise–times and exponential decays followed by short but significant mass-transfer dips. They could result from a giant flare near the Roche–lobe filling, secondary’s star surface, due, for example to the absence of star spots in the L1 region.
All these truncations and mass–transfer variations could look like made–up tricks had they not been observed in real CVs. Disc truncation is confirmed by X–ray observations (see e.g. Balman, 2014; Dobrotka et al., 2023) and could be due either to the action of the white–dwarf’s magnetic field (see Sect. 1.4) or to evaporation (Meyer and Meyer-Hofmeister, , 1994). Huge mass–transfer variations are directly observed in polars (AM Her stars; see Kalomeni, 2012 and references therein). Since the strong magnetic moment of the white dwarf prevents disc formation in these systems, there can be no doubt that the observed luminosity variations are provoked by changes in the mass–transfer rate from the companion star. Also in the case of VY Scl (see Sect. 1.4) it is clear that the mass-transfer simply switches off. Short–term variations are most probably provoked by the movements of star spots, as other mechanisms involving the star’s bulk, or the mass transfer are excluded (Ritter, , 1988).
Things become even more complicated when one tries to apply the DIM to dwarf–novæ called SU UMa stars. In these systems, in addition to normal dwarf–nova outbursts, one also observes longer and brighter eruptions, so-called superoutbursts. Superoutbursts occur regularly, typically every few normal outbursts. A sub–class of SU UMa stars, the WZ Sge–type dwarf novæ, show superoutbursts only. The nature of the mechanism producing superoutbursts is still a subject of controversy. On the one hand, the tidal–thermal instability (TTI) model, proposed by Osaki, (1989) invokes the existence of a tidal instability that is supposed to occur when the mass ratio is low enough for the 3:1 resonance radius to fit inside the tidal radius defining the outermost disc radius (see Sec. 1.3.3 for details and the allegedly related superhump phenomenon). This tidal instability is supposed to generate an increased viscous dissipation in the whole disc, thus leading to a superoutburst until the disc shrinks enough to be well inside the tidal radius. The physical mechanism behind the supposed viscosity–increase mechanism in TTI remains a total mystery.
On the other hand, Vogt, (1983), Smak, (1991) and Osaki, (1985) proposed that superoutbursts are caused by an enhanced mass transfer (EMT) from the secondary. Next, Hameury et al., (2000) showed that relating the mass transfer rate to the accretion rate, i.e. assuming that irradiation of secondary increases the mass–transfer rate, allows one to reproduce the observed visual light curves. The irradiated EMT (IEMT) works quite well (see e.g. Schreiber et al., 2004) and succeeds where the TTI model fails, i.e. it reproduces the lightcurves of the ER UMa’s, those frantic SU UMa-type stars, that are never in quiescence, showing superhumps (see next Section) even when exhibiting normal outbursts. However, while in contrast to the TTI, the IEMT superoutburst mechanism is well–specified, it is not immediately clear that it can work in real binaries. The problem is that, because it is shadowed by the disc, the L1 point cannot be irradiated directly, which precludes any significant increase of the mass transfer rate (Viallet and Hameury, , 2007). This is true if the disc is flat. But discs in binary systems might be warped which would allow the L1 point to be irradiated directly, at least at some orbital phases. Simulations by Cambier, (2015) show that when the disc is warped, irradiation can “agitate” the mass–transfer from the secondary. The simulations leading to this conclusion are still only in 2D, we shall have to wait some time for a detailed description of the irradiated mass–transfer enhancement. As we shall see in a moment, a warped disc has another useful property: it allows the mass–transfer stream to over(under)flow the disc surface, modifying, among other things, how mass and angular momentum are delivered to the disc. One should stress, however, that in cataclysmic variables the warping mechanism is not well established. In fact, the only viable mechanism proposed is itself related to secondary’s irradiation. Smak, 2009b finds that the mass–transfer stream through L1 has a component perpendicular to the disc plane which oscillates in phase with the binary period. He suggests that this comes about because the tilted disc enables the neighbourhood of the L1 point to be heated in an asymmetric manner, which varies with the orbital period.

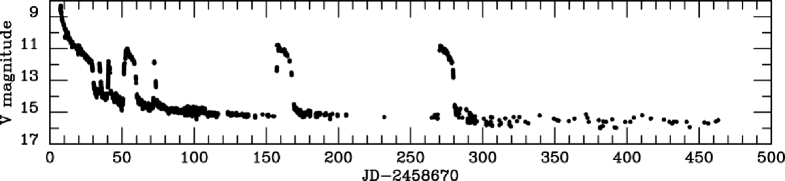
Reproducing the extraordinary lightcurve of the dwarf nova TCP J21040470+4631129 (Fig. 1.3) with the DIM is a real challenge. This system exhibited, first a bright superoutburst, followed by two normal outbursts that were succeeded by three superoutbursts (fainter than the first one), the first two of which were separated by a normal outburst. In total 4 superoutbursts and 3 normal outbursts during 300 days. All superoutbursts exhibited superhumps.
Hameury and Lasota, (2021) showed that the main features of this astonishing lightcurve can be reproduced by the DIM with the following additions: the mass transfer rate from the secondary increases by several orders of magnitudes during the initial superoutburst. Then the mass–transfer rate slowly returns to its secular average and causes the observed succession of outbursts with increasing quiescence durations until the disc is steady, cold, and neutral; its inner parts are truncated either by the white dwarf magnetic field or by evaporation. The very short, quiescence phases between reflares are reproduced when the mass-transfer stream overflows the disc. The luminosity in quiescence is dominated by a hot white dwarf that cools down on timescales of months.
Using similar additions to the DIM, one can also produce lightcurves containing rebrightenings closely resembling those observed in two WZ Sge stars, the prototype and EG Cnc (Hameury and Lasota, , 2021).
All these supplements may look like “epicycles”111On the other hand, epicycles, deferents and equants do not deserve their bad name (see A Modern Almagest), but their necessity proves that an accretion disc by itself, even when a realistic model is used to describe its behaviour, will not be able to reproduce lightcurves of TCP J21040470+4631129’s complexity.
1.3.3 The superhump problem
Superhumps are periodic light variations, with periods slightly longer (in the case of positive superhumps222There exist also negative superhumps, with slightly shorter periods.) than the orbital period, observed in the light–curves of dwarf–nova superoubursts. Superhumps are also observed in some bright (nova–like) cataclysmic variables, the so–called “permanent superhumpers” (Patterson, 1999).
A popular explanation of the superhump phenomenon is given by the tidal-resonance model (TR model, Whitehurst 1988, Hirose and Osaki 1990) according to which it results from periodic enhancement of tidal stresses in an eccentric accretion disc undergoing apsidal motion. The mechanism producing the disc’s eccentricity is supposed to be provided by the 3:1 resonance between the orbital frequency of the binary system and the orbital frequency of the outer parts of the deformed disc. For this mechanism to work, the 3:1–resonance radius
| (1.12) |
where is binary separation, must be smaller than the disc (tidal) radius. For a long time and not very–well known reasons it was believed that the value of the maximum mass–ratio for the condition to be satisfied is or even . Smak, 2020a calculated this critical ratio from the first principles obtaining a smaller value: .
All observed permanent superhumpers have . The prototypical dwarf–nova U Gem have , but in 1985 went into a superoutburst. In dwarf novæ of the SU UMa type, superhumps appear during superoubursts, so when Lasota et al., (1995) have pointed out that the outburst of U Gem observed in X–rays by Mason et al., (1988) is in fact a superoutburst (the only one seen during almost 170 years of continuous observations), Smak and Waagen, (2004) searched in the archival data for a superhump and found one. Its statistical significance is only (Schreiber, , 2007) but if superhumps in dwarf novæ are related to superoutbursts, its presence should be expected. The argument against its reality on account of the “incorrect” mass–ratio of the system, has been considerably weakened by the observation of equally incorrect permanent superhumpers. But there is worse.
The frequency of the eccentric–disc apsidal motion is related to the orbital and superhump frequencies and through
| (1.13) |
The superhump excess, used to quantify the superhump phenomenon is defined as
| (1.14) |
() and can be expressed through the apsidal frequency:
| (1.15) |
The initial version of the TR model assumed that the apsidal motion can be described by orbits of free particles and that this dynamical effect is given by a function of the mass ratio and the disc’s effective radius , where the effective radius is assumed to be the 3:1 resonance radius in Eq. (1.12). This formulation of the model failed, however, to describe the observations (see e.g. Murray, 2000; Pearson, 2006). But since, in reality, particles in the discs in question do not move on exactly free orbits, one could hope that adding a pressure term to the apsidal frequency formula:
| (1.16) |
would solve the problem (Murray, 2000; Montgomery, 2001; Pearson, 2006).
Smak, 2020b have tested this hypothesis by comparing its predictions to observations of 21 CVs exhibiting superhumps (including two helium, AM CVn systems). His results are presented in Fig. 1.5.
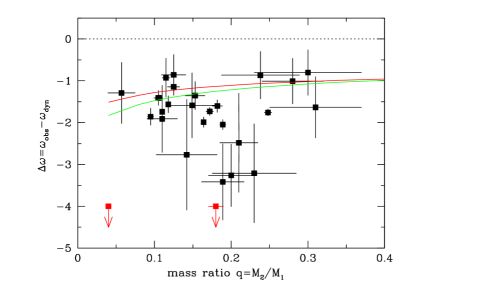
Smak, 2020b has determined the observed apsidal frequency, then calculated , using the system’s orbital parameters. This allowed him to calculate , which according to the theory should be equal to and plotted it as a function of . Clearly, the result contradicts the model: not only do the points not follow the theoretical curves but they show large scatter and do not seem to represent any clear trend. Clearly, the TR model is not in agreement with observation. Unfortunately, it is widely used for their interpretation.
The irradiation–modulated mass–transfer (IMMT) model (Smak, 2009a ; Smak, 2017), based on purely observational evidence, explains superhumps as being due to the periodically variable dissipation of the kinetic energy of the stream which results from variations in the mass transfer rate which are produced by the modulated irradiation of the secondary star. This is a purely “observational model”, providing a description of the phenomenon but not its explanation. It does not provide the mechanism of the clock ticking at the superhump period. Since the model assumes that the mass–transfer is modulated through the irradiation of the secondary, it would imply the presence of a warped accretion disc, but the stream overflow of such a disc is supposed to produce only negative superhumps, not the excess–period ones observed. Of course the accretion stream can also overflow a flat disc but then it is unlikely that the secondary’s irradiation would be able to increase the mass–transfer rate. On the other hand, there are systems showing both negative and positive superhumps, but they are rather an exception.
The superhump phenomenon in CVs still awaits a complete explanation (see e.g., Oyang et al., 2021).
1.4 Instabilities in magnetic white–dwarf systems
When its moment is sufficiently large, the accretor’s magnetic field can affect the structure of the inner accretion flow. White dwarfs, whose dipolar magnetic fields can have more than G, can have sometimes magnetic moments larger than , 4 orders of magnitudes larger than that of the usual X-ray pulsars (XRPs) with magnetic fields G. Only the most extreme magnetars have magnetic moments comparable to that of polars (AM Her stars), but since they are never members of binary systems, this is not relevant for accretion processes.
The condition for accretion–disc formation and existence can be written as
| (1.17) |
where the circularisation radius is defined through
| (1.18) |
where , while the magnetospheric radius can be written as
| (1.19) |
where (Frank et al., , 2002).
Therefore when , for systems with hr, a disc will not form, even for . This is case of polars, for which the magnetospheric radius is larger than the orbital separation and the secondary is brought by magnetic torques to rotation synchronous with the orbital motion (Joss et al., , 1979). For lower magnetic moments, depending on the orbital period and mass–transfer rate, a disc might form, as is the case of intermediate polars (IPs). However, if the mass–transfer from the companion star diminishes or even stops, such discs will vanish when the increasing magnetospheric radius reaches and overtakes the circularisation radius. This phenomenon was used by Hameury and Lasota, (2002) to explain the absence of dwarf–nova outbursts during the decay and rise phases of the VY Scl stars luminosity variations. In these nova–like CVs, with orbital periods mostly between 3 and 4 hours, the mass–transfer diminished on timescales longer than the disc viscous time, reaching a minimum during which the transfer of mass stops. Then on similar timescales the system reaches its initial, quasi–steady luminosity state. Since during the luminosity decay and rise the system crosses the thermal–viscous instability strip, one would expect to observe dwarf–nova outbursts, but none has been observed. Hameury and Lasota, (2002) found that this can only happen if, during the decay, the magnetospheric radius exceeds the circularisation radius, so that the disc disappears before it enters the instability strip for dwarf nova outbursts. And on the way up, the disc reappears only when it can be stable. The principle is simple: no disc outbursts must mean: no disc (Hameury and Lasota, , 2005). But this must also mean that white dwarfs in VY Scl stars dwarf–nova outbursts are magnetised, with a magnetic moment
| (1.20) |
where is the outer disc radius, and the orbital separation.
Polars and IPs exhibit low states similar to those observed in VY Scl stars. Since polars have no discs, the dimming of these sources can be due only to a drop of the mass–transfer from the secondary. But IPs with discs should be become discless by the same mechanism as VY Scl stars. Hameury and Lasota, 2017b showed that observations of the IP FO Aqr are well accounted for by the same mechanism that we have suggested to explain the absence of outbursts during low states of VY Scl stars. This has been confirmed in detail by the observations of this system by Littlefield et al., (2020).
The hypothesis that all VY Scl stars contain magnetized white dwarfs still needs observational confirmation. Until now, only the VY Scl star DW Cnc has been confirmed to be an IP with a spin period min (Rodríguez-Gil et al., , 2004; Duffy et al., , 2022). Some other systems of this type could be magnetic according to e.g. Zemko et al., (2014). Three SW Sex stars: LS Peg and V795 Her, RXJ1643.7+3402 are known to exhibit optical modulated circular polarization (Rodríguez-Gil et al., , 2009), an unmistakable signal of the presence of a strong ( G) magnetic field,
1.4.1 Intermediate Polars as dwarf novæ
Dwarf nova outbursts from intermediate polars are rare despite the fact that many of them having mass–transfer rates locating them in the thermal instability strip, i.e. a mass–transfer rate satisfying
| (1.21) |
where is the “effective” disc radius (usually ; Hameury and Lasota, 2017a ), and
| (1.22) |
In general, for hydrogen–dominated discs extending down to the white dwarf’s surface, the lower limit is too low to be of much interest333But stable cold helium-dominated discs of AM CVn stars, satisfying are observed (see Kotko et al., 2012). Because of the higher ionisation potential of helium, (Lasota et al., , 2008)..
However, in the case of IPs, , putting Eq. (1.19) in Eq. (1.22) gives a stability condition444Here the effective inner radius is taken as (see Hameury and Lasota, 2017a )
| (1.23) |
which is quite a realistic mass–transfer rate for these systems.
IPs with no disc () obviously cannot have dwarf–nova outbursts. But the majority of IPs with magnetic fields allowing the presence of discs seem to be mostly steady, and the rare observed outbursts, in particular in systems with long orbital periods, are much too short (sometimes lasting less than the orbital period) to be dwarf–nova outbursts, since only long outbursts (lasting a few days) result from the thermal–viscous disc instability. In many cases the mass transfer is low enough and the magnetic field strong enough to keep the accretion disc stable on the cold equilibrium branch (Hameury and Lasota, 2017a, ).
1.4.2 Magnetic–gating instability
The nature of the short (and rare) IP outbursts therefore requires an explanation, especially now that the Transiting Exoplanet Survey Satellite (TESS), with its unprecedented monitoring of the optical sky has drastically increased their observed number.

Scaringi et al., (2017); Scaringi et al., 2022a and Littlefield et al., (2022) proposed that the repetitive series of rapid, low-amplitude luminosity bursts in MV Lyr, TW Pic and V1025 Cen are produced by the magnetic–gating instability, originally proposed by Spruit and Taam, (1993) to explain the Type II X-ray bursts of the Rapid Burster. This instability appears in systems with a magnetised accretor, when the inner disc radius, i.e. the radius of the magnetosphere, is close to the corotation radius , defined as the radius at which the centrifugal forces on matter corotating with the white dwarf balance gravity forces:
| (1.24) |
In such a situation, the rapidly rotating magnetosphere prevents accretion and causes the accretion flow to pile up just outside the magnetospheric boundary. Eventually, this material compresses the magnetosphere until it is able to couple to the magnetic field lines (opening a gate in the magnetic wall) and accrete. Once the reservoir of matter outside the magnetosphere is depleted, the cycle repeats itself, giving rise to episodic bursts of accretion. The magnetic–gating instability model (MGIM) was developed for magnetic neutron stars by D’Angelo and Spruit, (2010, 2011, 2012) (hereafter D’AS). However, there is a problem with such an interpretation of white-dwarf system outbursts: MV Lyr and TW Pic are not known to be magnetic (although MV Lyr is a VY Scl star) and the presence a disc in V1025 Cen is uncertain (Hellier et al., , 2002), while the MGIM assumes its existence.
Hameury et al., (2022) adapted the MGIM to the case of accreting magnetic white dwarfs and applied it to the bona fide disc–possessing IP V1223. The main uncertainty in the description of the disc-magnetosphere border is its width, the size of the region where the two interact. The most popular model, and still widely used, is that of Ghosh et al., (1977); Ghosh and Lamb, 1979a ; Ghosh and Lamb, 1979b which assumes that the stellar fields invade the disc over a large range of radii. However, the problem with this picture is that to make it work, one needs a very large (and unrealistic) magnetic diffusivity (see e.g. Lai, 2014 and references therein).
Taking this into account, in their model D’AS correctly assume that the width of the disc-magnetosphere interaction region is narrow. They define a critical accretion rate
| (1.25) |
where is a numerical factor describing the distortion of the magnetic field by the disc. Following D’AS Hameury et al., (2022) took it to be equal to 0.1 (they call it ). is the rate at which the inner (magnetospheric) disc radius is equal to the corotation radius. When the inner disc radius is less than , disc accretion proceeds in a standard way. In the opposite case, the accretion rate is vanishingly small. The model depends on two parameters: – the width of the disc–magnetospheric interaction, and - the characteristic width of the change of accretion–rate through the interaction zone. Hameury et al., (2022) adapted the D’AS model to the parameters of an IP, but in contrast to D’AS they used a standard definition of the viscosity parameter and applied it to configurations of thermally stable–hot and stable–cold discs. They found magnetic–gating instabilities in both cases, but in the cold case the outburst amplitudes are too low to be of interest and the recurrence times are too long: of the order of years.
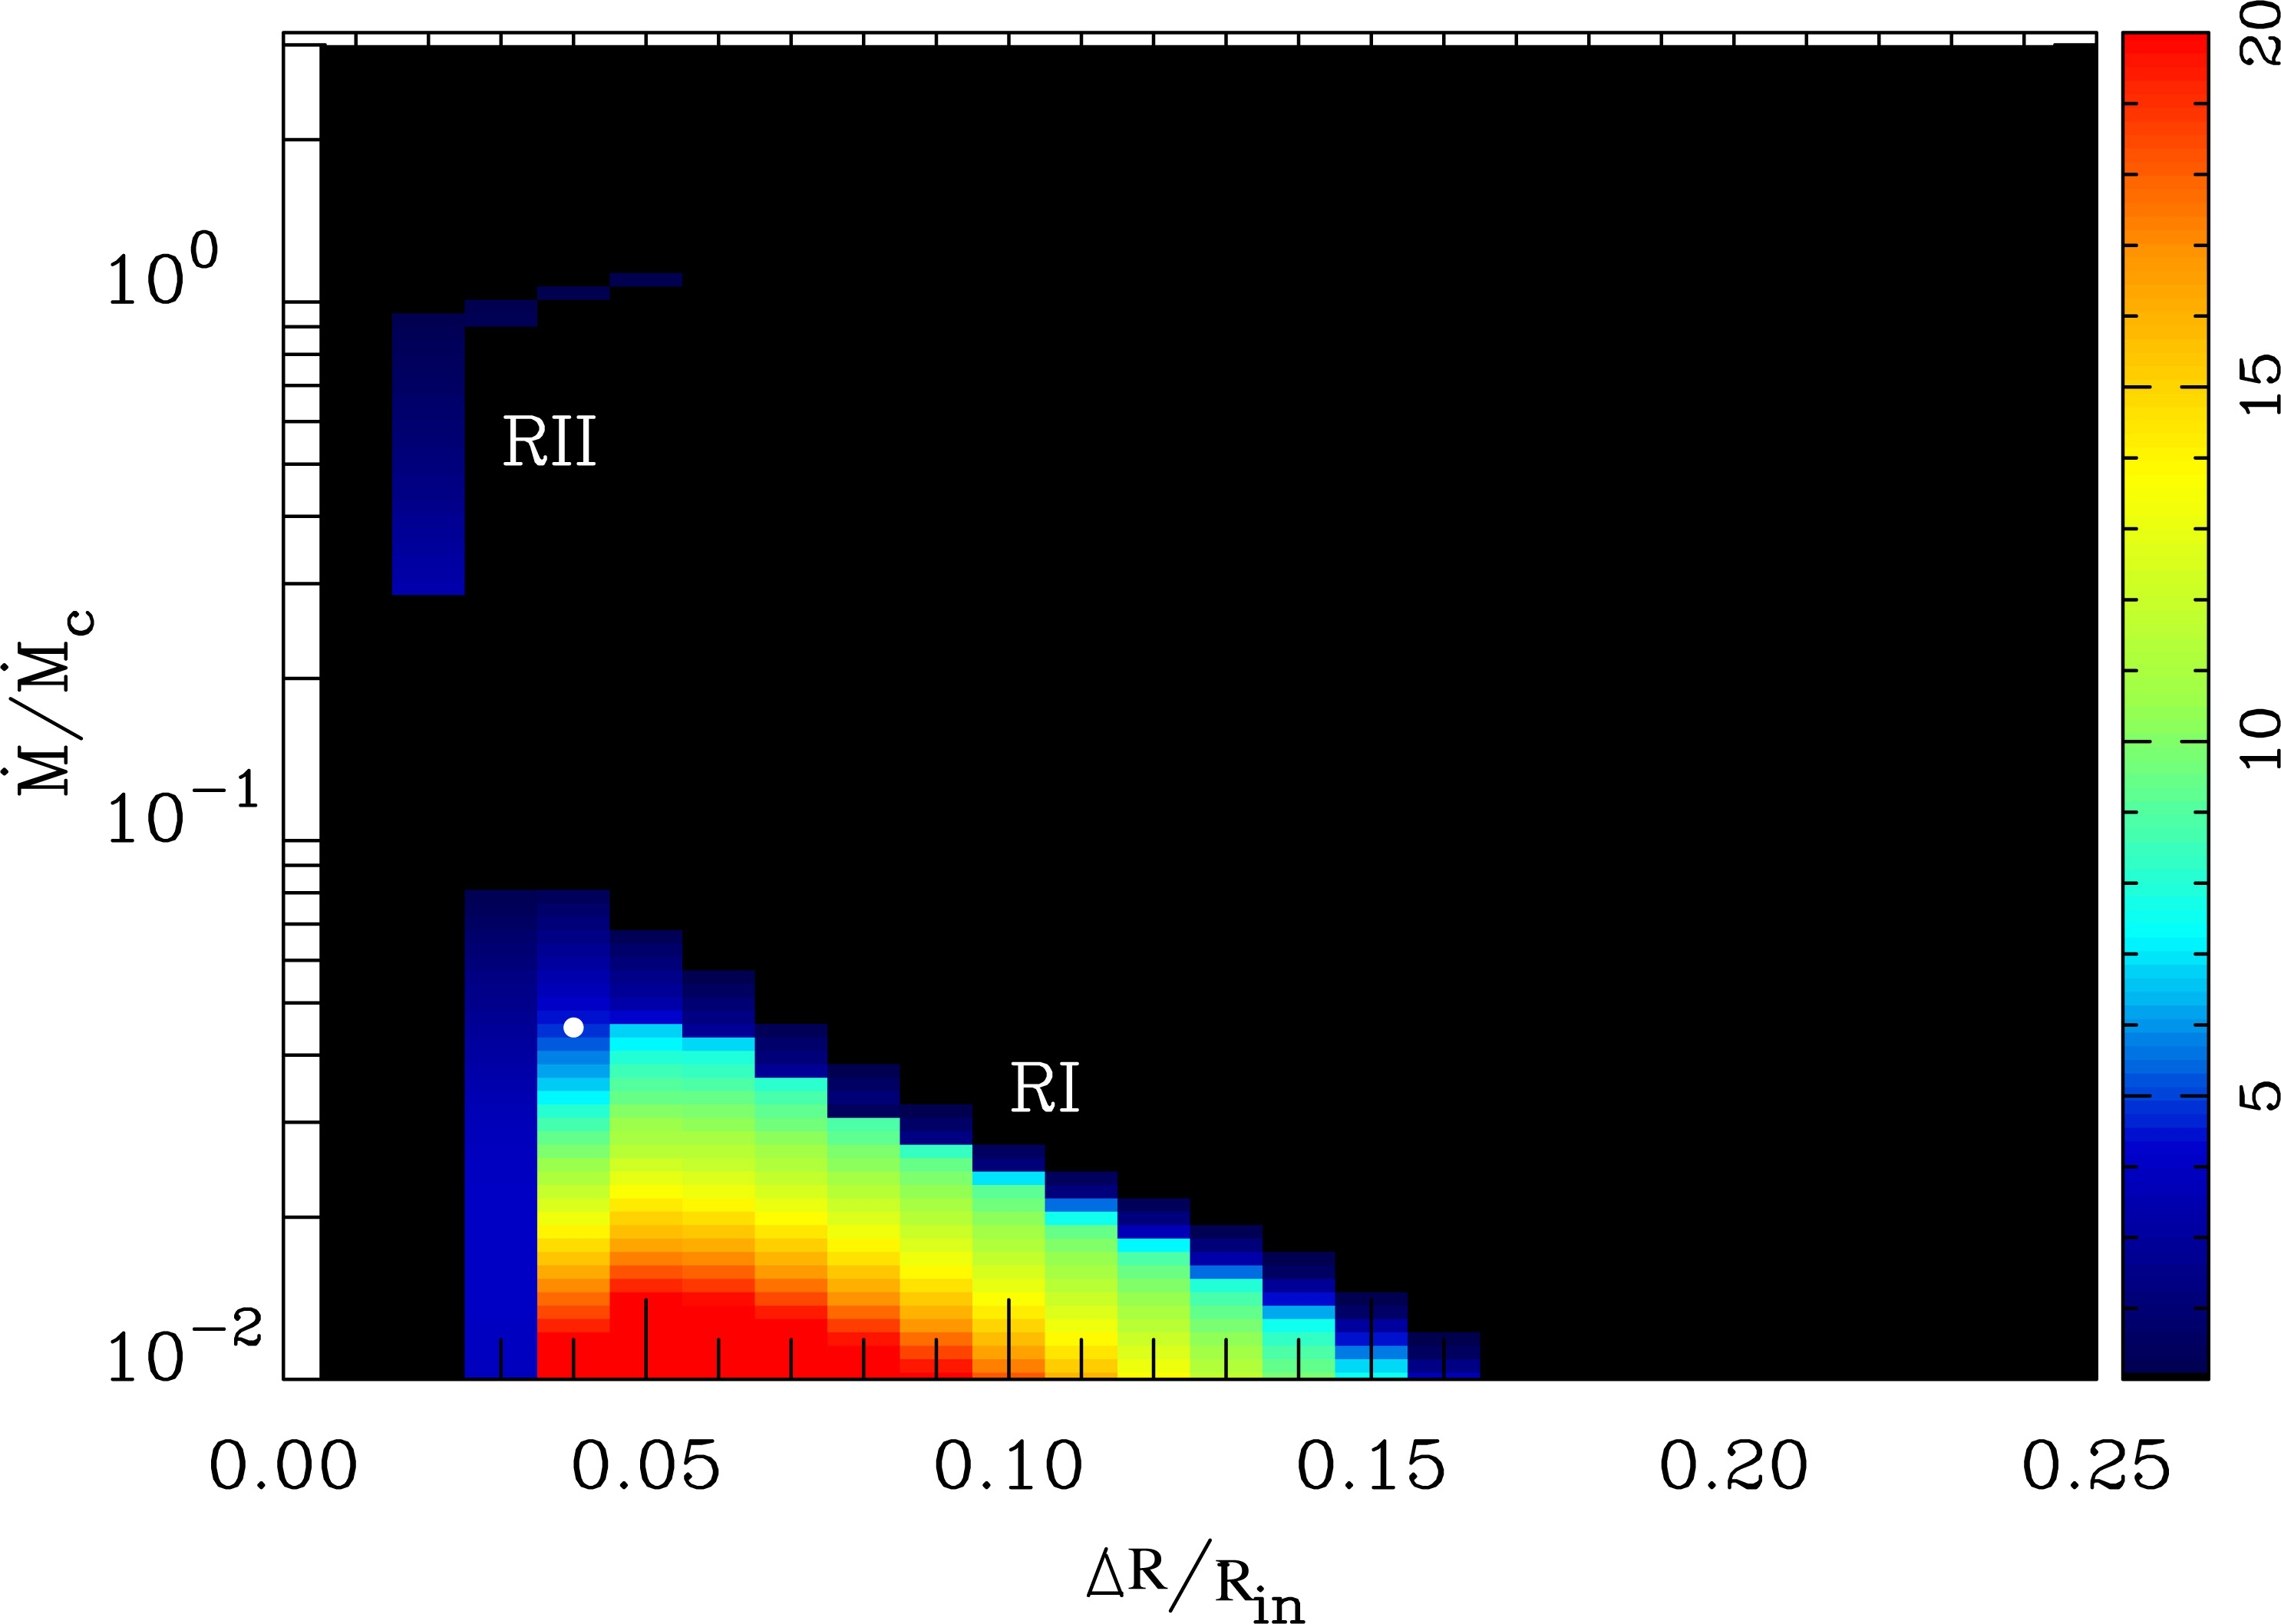
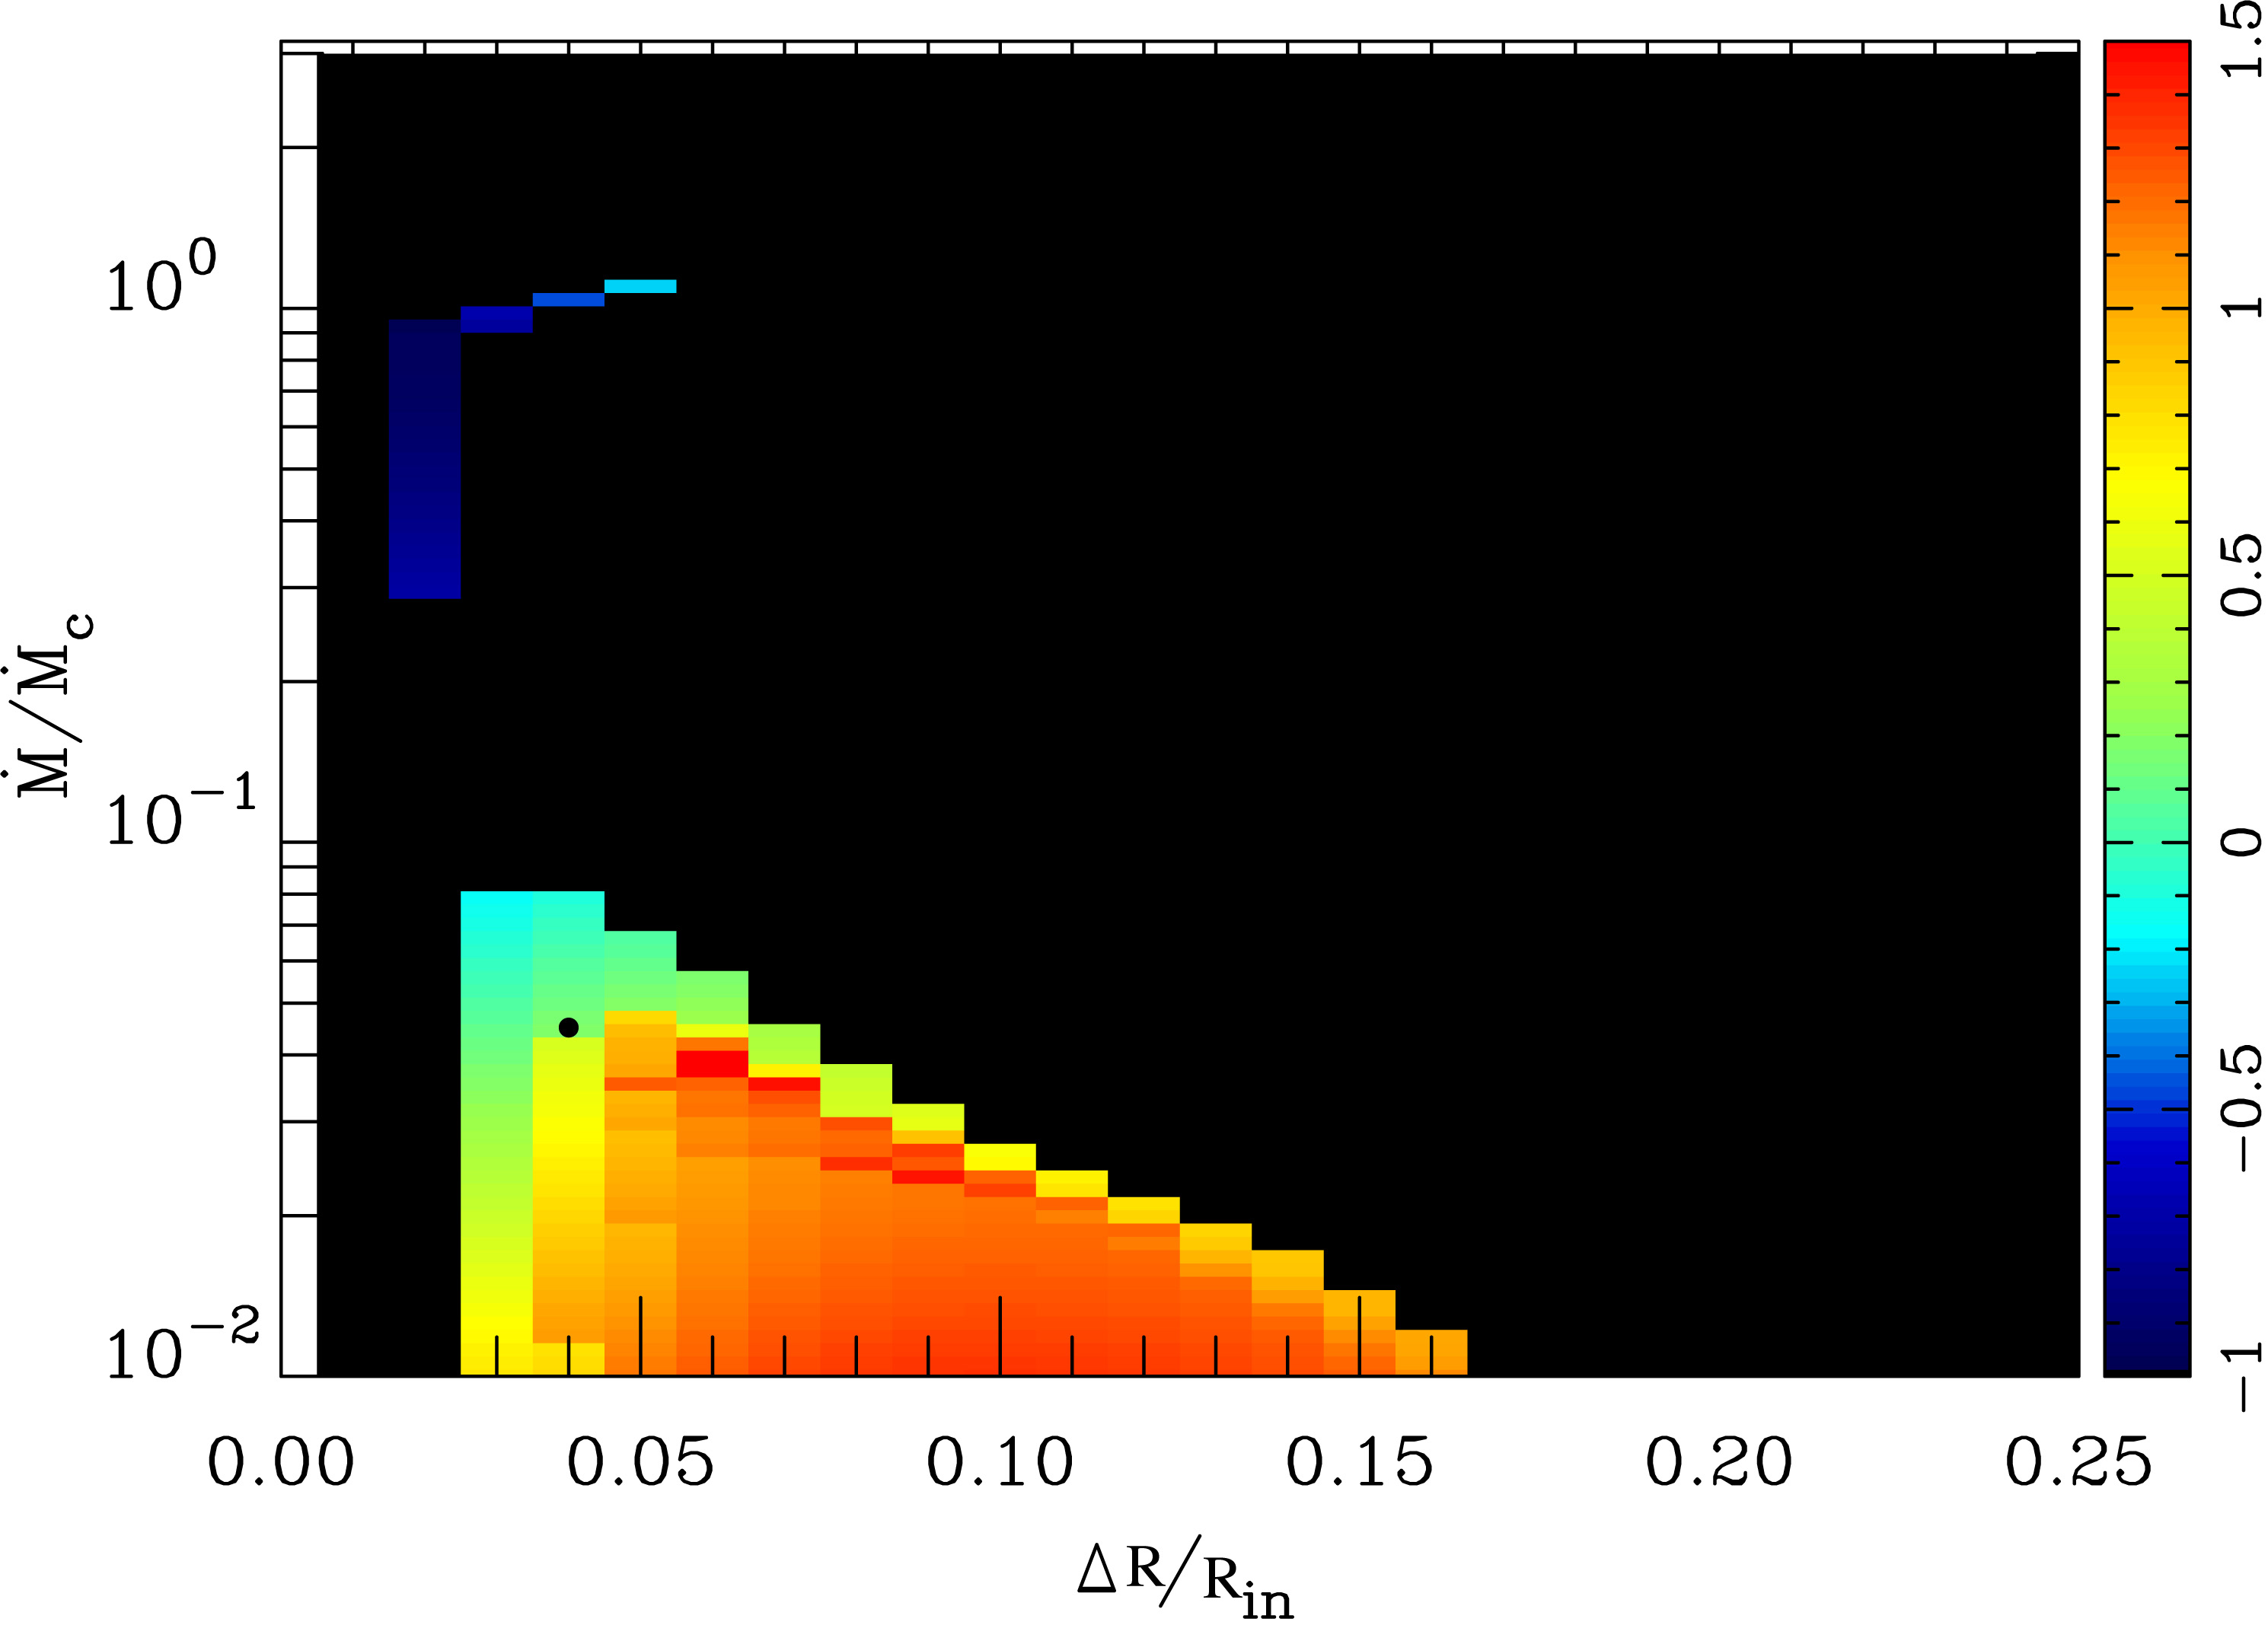
In the hot disc case, for mass–transfer rates , Hameury et al., (2022) find (as do D’AS) two regimes of magnetic–gating : RII and RI (see Fig. 1.7). In the RII region the outbursts have low amplitudes and short recurrence times. In this regime, the accretion rate varies smoothly with a period of a few hours, by less than a factor of two. Regime RI, on the other hand, corresponds well to the sequence of short outbursts observed in V1223 Sgr. Fig. 1.6 (bottom) shows the variations of the accretion rate when and . These parameters correspond to the (white on the left, black on the right) point in the instability map in Fig. 1.7. The magnetic moment is more appropriate for polars than for IPs, but was chosen in order to explore a large range of mass-transfer rates, reaching down to . For lower accretion rates (depending on ), the disc would become thermally unstable. Hameury et al., (2022) verified that simulations for produce a lightcurve similar to that of Fig. 1.6. The MGIM explicitly assumes the presence of an accretion disc. The similarities between the lightcurves of V1223 Sgr and the (possibly) discless IP V1025 Cen (Littlefield et al., , 2022) suggest that this model should also apply to systems with an accretion annulus (torus; see, e.g. King and Wynn, 1999), instead of a disc.
It seems, however, that isolated, short outbursts that cannot be of the dwarf–nova type are not due to the MGIM. Although this instability can produce long recurrence times, of the order of a month or more, the outburst duration would then also have to be long, because the ratio between the outburst recurrence time and its duration is roughly equal to the ratio between the mean mass-transfer and the peak–accretion rates, which is less than 30 in the model. We should also notice that the profiles of isolated outbursts often have a sharp rise and a slower decay, in contrast with the almost symmetric profiles produced by the MGIM and observed in V1223 Sgr and V1025 Cen. In fact, the shape of some isolated short bursts is similar to that of X–ray bursts from neutron stars. Hence the idea that they could be of thermonuclear origin.
1.4.3 Micronovæ
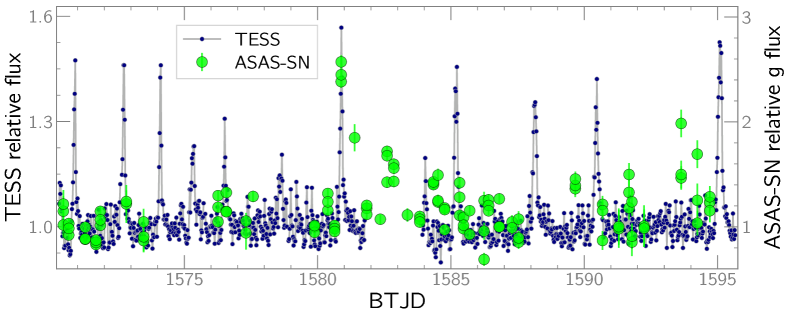
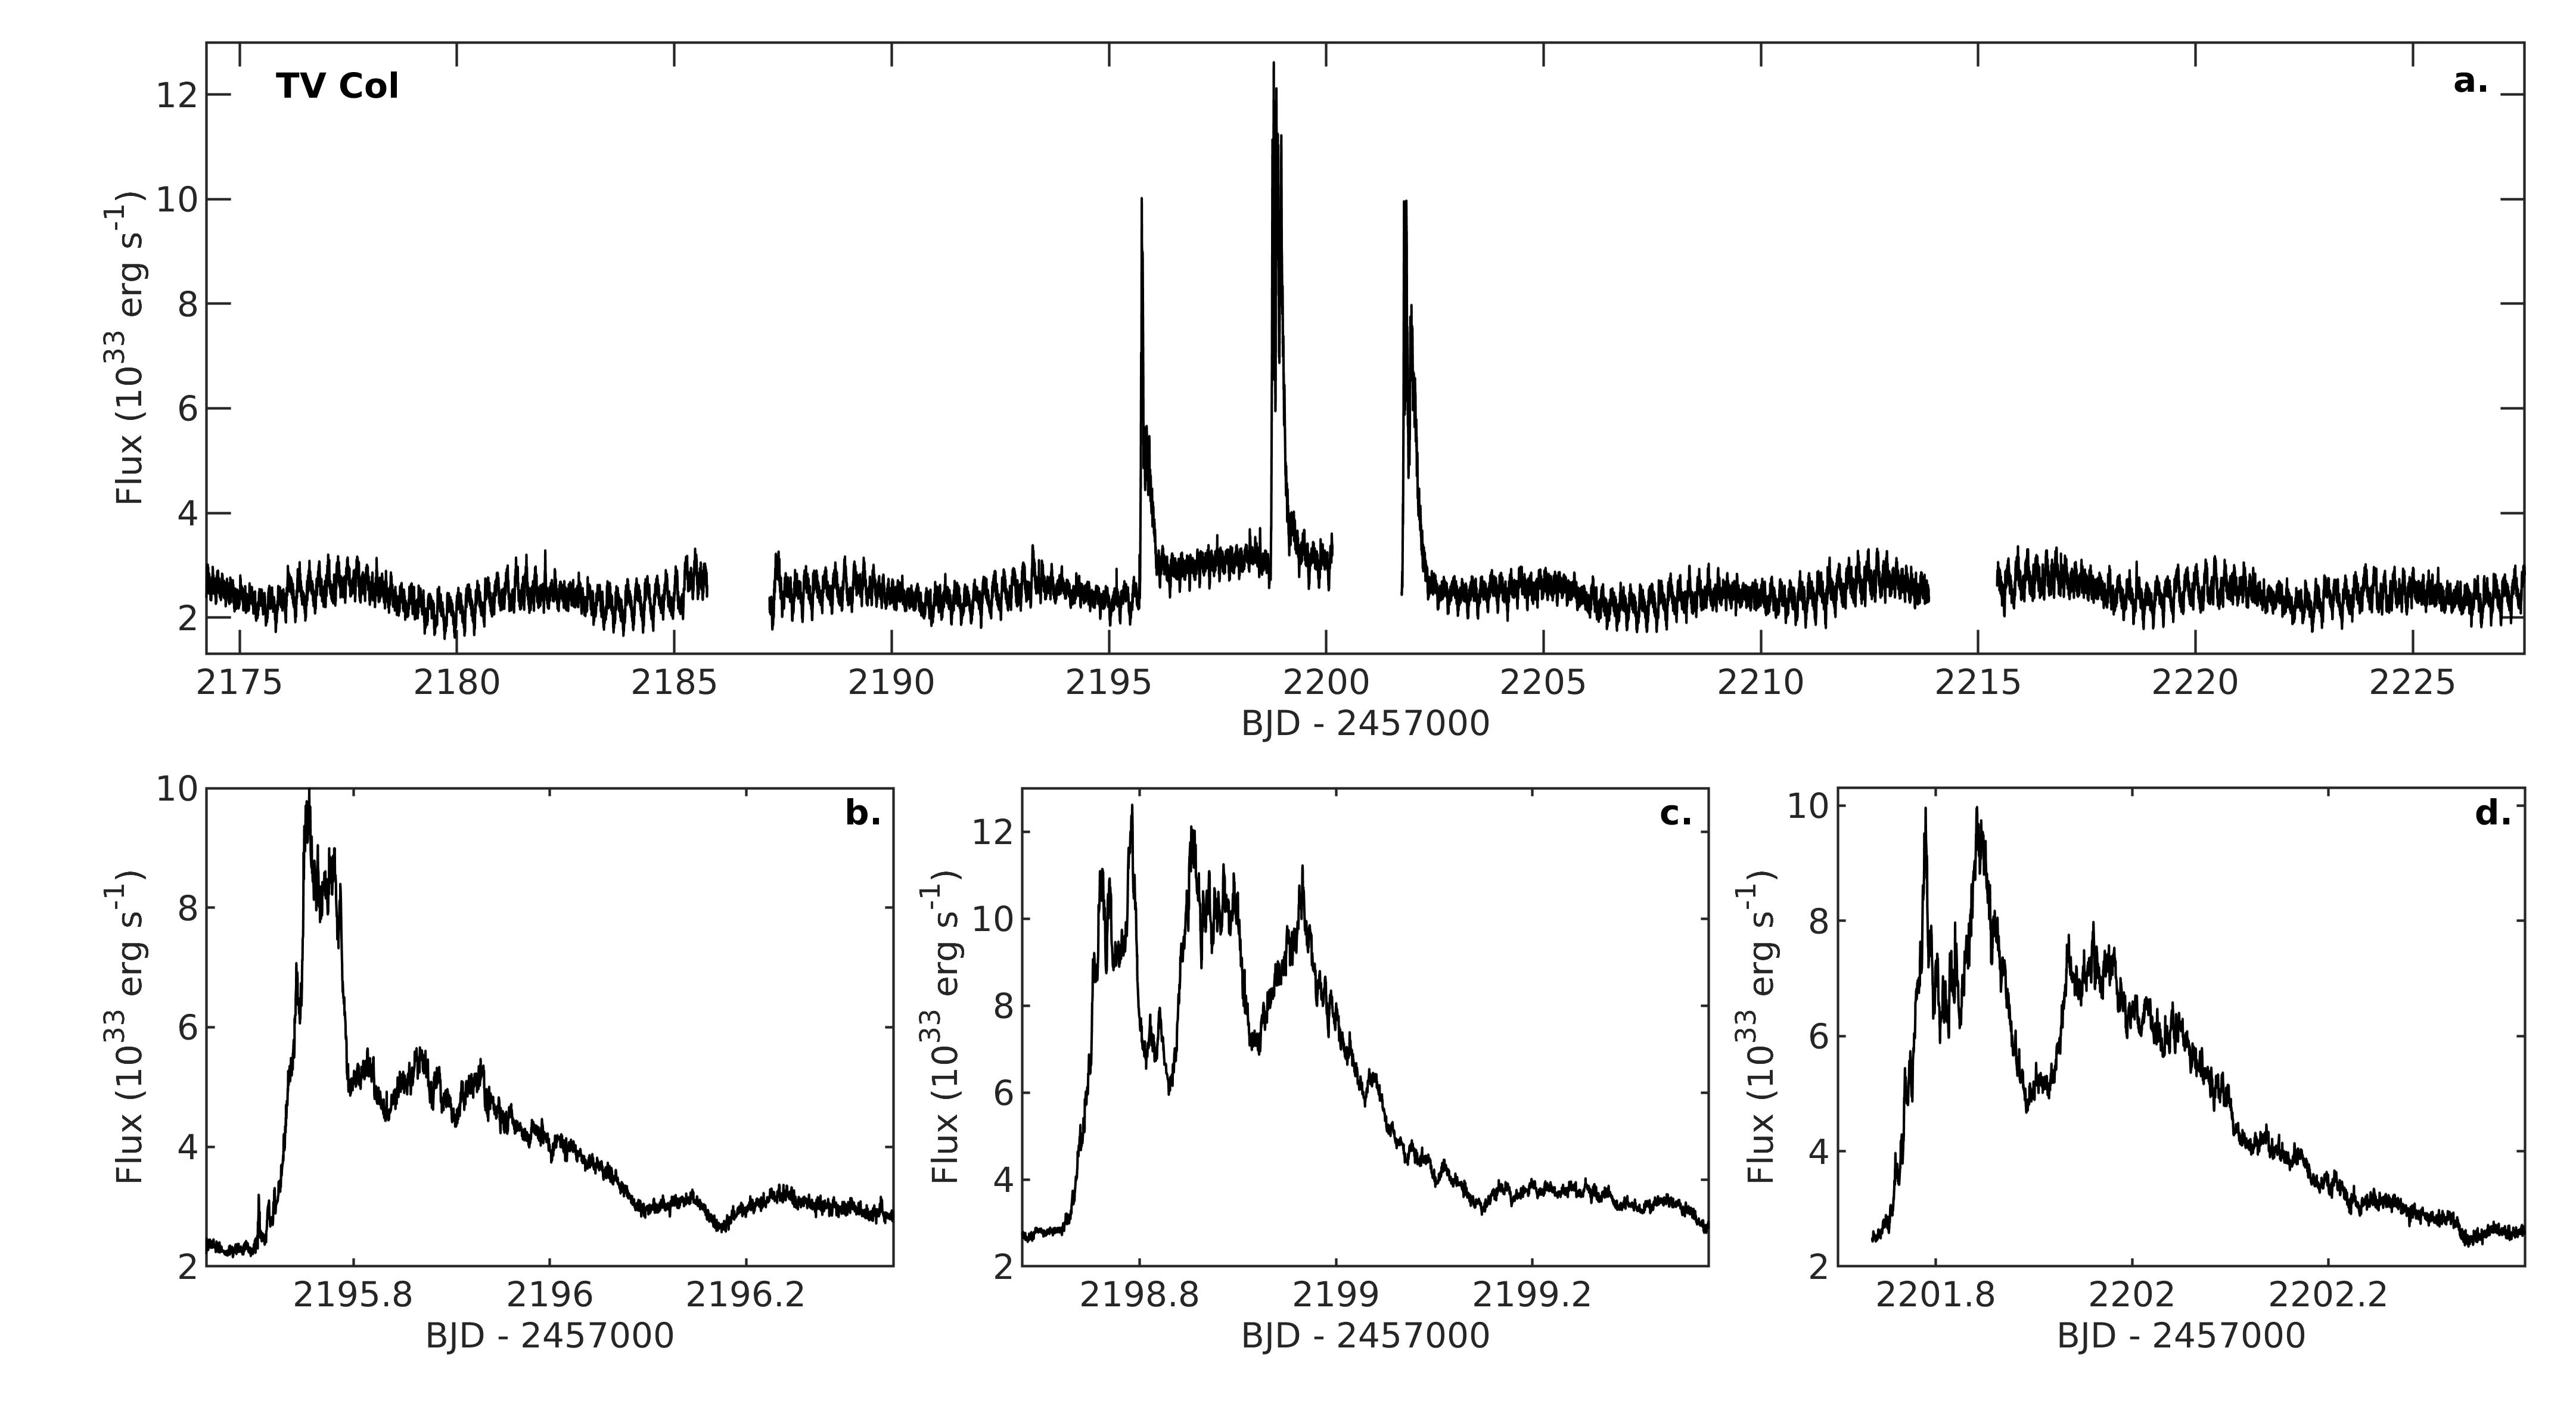
In several cataclysmic variable, TESS has observed short-duration fast-rise exponential-decay bursts, grouped in pairs or triples and lasting a few hours, with recurrence times of days to months. Such events are therefore different (mainly in recurrence–time properties) from the outbursts discussed in the previous section. Scaringi et al., 2022b noted such events in the IPs TV Col (see Fig. 1.8), EI UMa and in the CV ASASSN-19bh. Schaefer et al., (2022) discovered similar bursts in the recurrent nova V2487 Oph during quiescence.
During these bursts the optical/UV luminosity increases by a factor of more than in less than an hour and decays during hours. Fast outflows with velocities larger than , comparable to the escape velocity from the white dwarf surface, have been observed in UV spectral lines. The bursts have a total energy that of classical nova explosions (“micronovæ”), and their lightcurves are similar to those observed in Type I X-ray bursts.
Guided by energy considerations and these similarities, Scaringi et al., 2022b ; Scaringi et al., 2022c proposed that these events result from thermonuclear runaway events in magnetically-confined accretion columns on the surface of accreting white dwarfs. Thus the series of short outbursts observed in IPs would be the analogue of Type II X-ray bursts, while those with longer recurrence times would be the equivalent of Type I X-ray bursts.
The model assumes the accretion column on the magnetic poles of the white dwarf to be magnetically confined and increasing in mass. The pressure exerted on the white–dwarf surface, resulting from the column’s weight, causes its base to sink to greater depths. If this magnetic confinement can hold until the pressure at the base of the accreted column reaches , a thermonuclear runaway (TNR) will start and burn through most of the overlaying accumulated mass in the column. The process can repeat every time the pressure at the column’s base reaches the critical pressure required to drive a TNR.
For the flow to remain confined in the column by the magnetic pressure , the condition
| (1.26) |
must be satisfied, where
| (1.27) |
is the gas pressure of the magnetically confined material, and a critical value.
As the weight of the column grows with time, the pressure at the base of the magnetically confined column () will also grow, acting sideways on the magnetically confined boundary. When the column pressure substantially distorts the magnetic field lines, and plasma from the accretion column may spread on to the white–dwarf surface.
The pressure exerted at the base of the accretion column is given by
| (1.28) |
where is the white–dwarf mass, the column mass, and
| (1.29) |
where is the white–dwarf radius and the radius of the circular accretion–column’s footprint. Then the accretion column will remain confined by the magnetic pressure as long as
| (1.30) |
where
| (1.31) |
and
| (1.32) |
with being the height of the accumulated material in the column (Hameury and Lasota, , 1985).
Assuming that outbursts are produced by the freshly accreted hydrogen from the companion star, the CNO cycle flash will yield erg/g. Since the observed micronovæ release – erg, this implies column masses , which for a typical value corresponds to a fractional accretion area . This is a much smaller value than that deduced from observations, which suggest rather – (see, Frank et al., 2002 who, in a different context and for strongly magnetized polar systems555Accretion rates in polars might be too low to produce micronovæ, on the other hand if such outbursts occur, they could have been missed., consider buried columns with , but find such a model “contrived”.). For masses , can be increased to , reaching for masses close to the Chandrasekhar limit. Such high masses and strong fields contradict the observationally determined white–dwarf’s mass in TV Col: .
The exploding–column model suffers from two other drawbacks. First, it assumes that the magnetic field lines are solidly anchored in the white dwarf, at the bottom of the accretion column. While such an assumption is justified in the case of a neutron star, it is rather uncertain when the accreting body is a white dwarf. Second, plasma confined by a magnetic field is subject to instabilities that may lead to leakage preventing accumulation of the mass required to ignite a TNR.
But what is the alternative? A model in which TNRs are triggered by magnetically confined “blobs”, whose ram pressure reaches , requires even smaller fractional areas (Scaringi et al., 2022b, ). Dwarf–nova outbursts are excluded, as are mass–transfer variations or reconnection events (Scaringi et al., 2022b, ). In the end, the micronova explanation might be the best option.
1.5 X-ray binaries
1.5.1 X-ray transients
In X-ray binaries, the outer parts of the accretion disc are strongly X-ray irradiated by the central source (van Paradijs and McClintock, , 1994). This heating effect must be taken into account when considering the disc thermal stability (van Paradijs, , 1996). In an irradiated disc the surface temperature is
| (1.33) |
with
| (1.34) |
where the irradiation constant (Dubus et al., , 2019) is usually taken to be (Dubus et al., 2001). Of course , as defined by Eq. (1.34), is unlikely to correspond to disc X–ray irradiation in all circumstances and this equation will have to be modified when more is known about the process it is supposed to be describing (see Tetarenko et al., 2018, 2020). In practice, even small modifications appear to be useful in some cases (see, e.g. Faruk Çoban and Ertan, 2023).
For an X-ray irradiated disc the stability criterion reads
| (1.35) |
where , and a factor very weakly depending on the viscosity parameter has been dropped.
Figure 1.9 (Coriat et al., , 2012) shows the stability properties of neutron–star X–ray binaries. The non–irradiated–disc criterion is also plotted. Clearly, the irradiated–disc stability limit correctly separates steady systems from outbursting ones, i.e. X-ray transient systems.
While both steady and transient systems are found among low–mass, neutron–star X–ray binaries, all black–hole, low–mass X-ray binaries are transient. The reason for this difference is still unknown (King et al., , 1996; Justham et al., , 2006; Yungelson et al., , 2006; Yungelson and Lasota, , 2008; Wiktorowicz et al., , 2014), but all such black–hole X–transients also lie below the irradiated–disc stability criterion (Coriat et al., , 2012).
1.5.2 Lightcurves of X-ray transients
As for dwarf novæ, and for the same reason, in X-ray transients systems the simplest version of the DIM predicts fast–rise and slow–decay outbursts, but contrary to the common opinion (e.g. King and Ritter, , 1998; Dubus et al., , 2001; Lasota et al., , 2015) the decay parts of the outburst lightcurves produced by the irradiated–disc instability are not exponential. As shown by Ritter and King, (2001, see also and ), according to the model, the initial (irradiation controlled) decay from outburst maximum of an X–ray transient is described by
| (1.36) |
where is the accretion rate at the outburst maximum and is given by:
| (1.37) |
where , g s-1 (Hameury and Lasota, , 2020).
corresponds to the time it takes the accretion rate to fall to one tenth of its initial value.
Based on Eq. (1.36) and the DIM, Hameury and Lasota, (2020) found analytical formulæ describing the decay lightcurves of X–transients which can be used to determine the disc parameters.
The characteristic timescale of the disc evolution is defined as
| (1.38) |
where666There is some confusion in the literature about the definition of the “irradiation constant” : on the one hand Dubus et al., (1999) define (called here) through Eq. (1.34) (this definition is also used by Coriat et al., 2012), on the other, Dubus et al., (2001), “extracting” the accretion efficiency, in Eq. (1.34) use , instead of . Finally, Hameury et al., (2020) find it convenient to use , as in Eq.(1.34). As the co–author of three of the above–mentioned papers, I would like to apologise for this inconvenience.
| (1.39) |
and the ratio of the maximum to the critical accretion rate is given by
| (1.40) |
where is the mass transfer rate from the secondary, , while and are respectively the viscosity parameter in the hot and cold disc. As in the case of dwarf novæ, for the outbursts to have the observed amplitudes, this ratio has to satisfy the condition 4–10 (Hameury et al., , 1998; Dubus et al., , 2001). For , ; for , . Since the necessary condition for disc instability is , it follows that . The mass of a fully hot disc is obtained by integrating the critical surface density over the disc (Hameury and Lasota, , 2020):
| (1.41) |
The critical accretion rate below which a hot, irradiated disc become unstable is given by
| (1.42) |
(Lasota, 2001; slightly different fits to the critical values of the disc parameters are found in Lasota et al., 2008).
When the front fails to reach the outer disc edge777In X-ray binary transients outbursts are only of the inside-out type (Lasota, , 2001)., , the maximum accretion rate during an outburst, is roughly equal to the rate at the maximum distance reached by the transition front (Lasota et al., , 2015), because at the outburst peak, the portion of the disc that has been brought into the hot state is almost steady, and the mass accretion rate is thus equal to the minimum (critical) rate for which a hot stable disc can still exist. Only when the heating front reaches the outer disc edge () is the ratio .
The maximum accretion rate can be related to the characteristic decay time by combining Eqs. (1.42) and (1.38):
| (1.43) |
When both and are known from observations, this relation determines , and hence and the size of the accretion disc. When this size can be estimated (from the orbital period and mass ratio) this can be used to estimate .
Alternatively, from Eqs. (1.36), (1.37) and (1.42) we can obtain the duration of the the quasi–steady phase of the outburst decay, during which ;
| (1.44) |
from which we can determine if the accretor mass is known, since here the dependence on is weak.
Once the decreasing accretion rate reaches the critical value, a cooling front starts propagating (always inwards, since in the hot state the accretion rate is roughly constant but the critical values increase with radius) and switches off the outburst. Since now the hot disc is shrinking we have
| (1.45) |
where is the front positional radius and is the mass flow at the propagating–front position888Not the mass transfer rate.. Since , from Eq. 1.42, the radius can be expressed as a function of :
| (1.46) |
Putting (Hameury and Lasota, , 2020), from Eq. (1.41) using Eqs. (1.42) and (1.46); we obtain:
| (1.47) |
where is a constant that is determined by the condition that, when the cooling front starts, is equal to at the maximum front–transition radius. can then be written as:
| (1.48) |
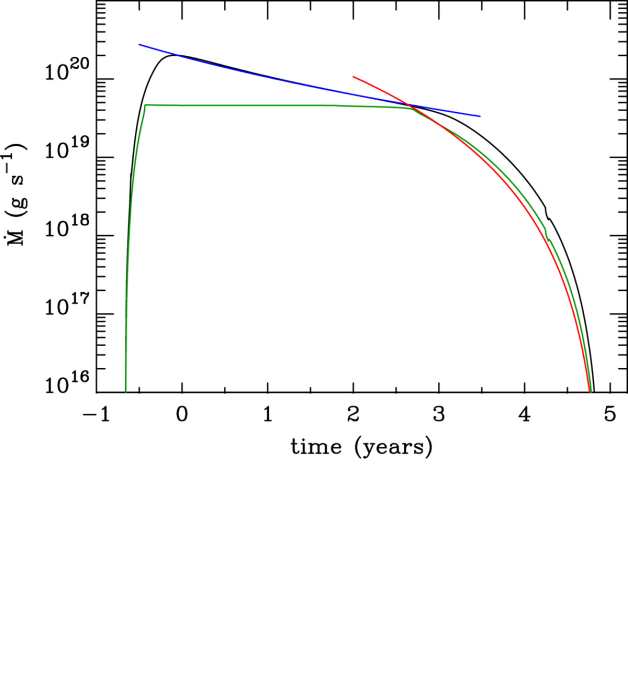
As can be seen in Fig. 1.10, Eq. 1.47 represents the results of numerical simulations quite well also for this part of the lightcurve. The shift between the two curves is due to the fact that in the simulations the accretion rate is not exactly equal to the critical rate.
Using Eqs. (1.43), (1.44), (1.47) and (1.48) we can determine the properties of the outbursting accretion disc from observed lightcurves, in particular the value 999Such a method was used by Tetarenko et al., (2018, 2020) but in those papers it was assumed that the quasi–steady decay phase is exponential.. In Sect.1.6.1, I will show the results of applying this method to transient ultraluminous X–ray sources.
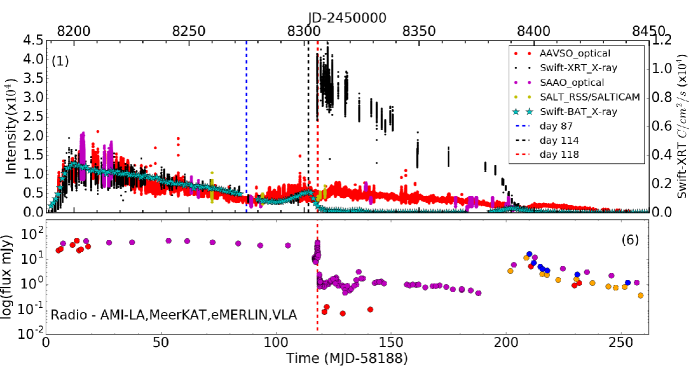
As in the case of dwarf novæ, quite often the real lightcurves of X-ray transients (see Fig. 1.11) are much more complicated than those predicted by the DIM (Fig. 1.10). The Hameury and Lasota, (2020) model assumes a flat disc, while the lightcurve in Fig. 1.11 requires the disc to be warped (Thomas et al., , 2022). Also, this model describes neither the source of the hard X–ray component(s) (the corona), nor the jet ejected at some phase of the outburst. Figure 1.10 compares the evolution of the accretion rate as found in numerical simulations with the analytical estimate given by Eq. (1.36), demonstrating how well the analytical formula represents the results of numerical simulations. One should stress again that, although the decay is not far from exponential, the “” power law is a much better fit by far.
1.6 Ultraluminous X-ray sources
By definition, ultraluminous X-ray sources (ULXs) have luminosities and are not located in galaxy centres. The defining luminosity has no astrophysical basis but was chosen for corresponding roughly to the Eddington luminosity of a black hole, this critical luminosity being defined as
| (1.49) |
while the corresponding Eddington accretion rate is given by
| (1.50) | ||||
| (1.51) |
where is the radiative efficiency of accretion. ULXs were identified as a separate class of objects at the end of the previous millennium (Colbert and Mushotzky, , 1999). After about fifteen years, during which the majority of researchers involved in their study believed that they contained intermediate–mass black-holes (IMBH), the discovery by Bachetti et al., (2014) that the source ULX-2 in the galaxy M82 is a pulsar confirmed the view of the dissenters (King et al., , 2001), who had claimed from the start that ULXs are just a phase in the life of (presumably massive) X-ray binaries containing stellar–mass accreting objects, i.e. black holes or neutron stars, or even white dwarfs.
Now we know that out of the 1800 observed ULXs (see King et al., 2023 and references therein) at least 10 contain magnetized neutron stars, detected through their periodic pulses (PULXs; see Table 1.1). Four of them are transient: they are members of Be–X binary systems, which become X–ray sources when the eccentric orbit of the compact companion (in most cases a neutron star) of the massive Be star crosses its circumstellar disc. In most cases this disc–crossing produces sub-Eddington–luminosity outbursts (called “Type I”), but from time to time, most probably due to von Zeipel-Kozai-Lidov oscillations (Martin et al., , 2014), it results in a giant (super-Eddington; “Type II”) outburst.
Since the maximum mass of neutron star is , it is clear that the observed luminosity of all PULXs is super-Eddington - up to 1000 times larger than the Eddington luminosity of . Since at super-Eddington accretion rates the resulting luminosity is
| (1.52) |
(see e.g. Lasota, 2016; King et al., 2023), it is clear that, for realistic values of the mass–transfer rate in stellar binary systems (, say), observed luminosities in excess of () cannot be intrinsic if the critical luminosity of the accretion flow is equal to the Eddington luminosity. Since strong magnetic fields lower the Thomson scattering opacity (Canuto et al., , 1971), in their presence the critical luminosity (corresponding to the equality of the radiative and gravitational forces) is equal to
| (1.53) |
(when ) where , as shown by Paczynski, (1992). Therefore, to be intrinsic, the observed PULX luminosities must be emitted by a plasma permeated by magnetar–strength fields . As an alternative, not requiring super–strong magnetic fields, it has been proposed that a buoyancy-driven, “photon bubble” wave pattern can facilitate the escape of radiation, producing intrinsic super-Eddington luminosities from accretion columns (Begelman, 2017, see also Arons, 1992). However, the reality of this process has yet to be confirmed and it seems that very super–Eddington emission from such a bubbling column would also require beaming.
In the absence of super–strong (magnetar–strength) magnetic fields, the emitted luminosity must be beamed and it is the apparent luminosity that is super-Eddington, Eq. (1.52) becoming
| (1.54) |
where the beaming factor , as already proposed by King et al., (2001). There are thus three options explaining the observed hugely super-Eddington luminosities of PULXs:
- •
-
•
Buoyancy–driven, “photon bubble” wave patterns allowing the escape of radiation at extremely super-Eddington rates and some amount of geometrical beaming (Begelman, , 2017).
- •
I will show, however, that the magnetar hypothesis can be easily rejected (Lasota and King, , 2023): a fundamental property of PULX, the value of their spin-up rate ( is the pulsar’s spin frequency), makes the first option physically impossible, as first pointed out by Kluźniak and Lasota, (2015). The photon–bubble mechanism which allows large super–Eddington intrinsic luminosities has not been sufficiently developed to be compared to observations, but would require some beaming anyway (Begelman, , 2017).
Figure 1.12 shows that the spin-up rate for all (with sub– and super–Eddington luminosities) X-ray pulsars is strongly correlated with their X–ray luminosity . This correlation (over-seven-orders of magnitude in luminosity) can be explained as resulting from the domination of the accretion torque over all other torques acting in these systems:
| (1.55) |
where (Eq. 1.56) is the magnetospheric radius, the neutron star’s magnetic moment and the neutron star’s moment of inertia.
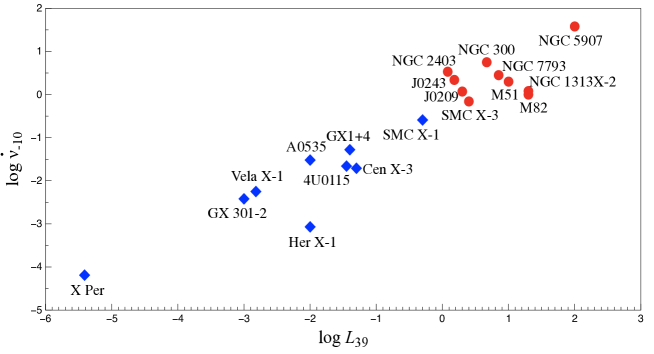
Figure 1.12 shows that PULXs are characterised not only by their luminosity () but also by their spin-up rate (): they are all located inside a rectangle delimited by the values of these two quantities. If we did not know the distances to the X-ray pulsars, the value of their spin-up rate alone would allow us to separate “normal” XRPs from PULXs. Indeed, since the transient ULX Swift J0243.6+6124 is in the Galaxy (the only known such source there), its exact distance is uncertain, but while its deduced luminosity is close to the ULX-defining limit (), the value of its spin-up rate () puts it safely into the PULX category.
The magnetospheric radius is defined by the equation (Frank et al., , 2002)
| (1.56) |
where is a factor taking into account the geometry of the accretion flow at the magnetosphere and . Putting and , from Eqs. 1.56 and 1.55 one obtains
| (1.57) |
In general, super–Eddington luminosities are not proportional to the accretion rate. Only in the presence of very strong magnetic fields, when (see Eq. 1.53) can we assume that , since is no longer the critical luminosity. This would be the case if PULXs contained accreting magnetars.
In such a sub–critical case, from Eq. (1.57), one gets the relation
| (1.58) |
But this contradicts the condition , assumed in its derivation, since for the second inequality to be satisfied, one needs (by construction) . Eq. (1.58) is a direct consequence of Eq. (1.55), i.e. assumes that the spin–up torque is dominated by accretion. Which, in this context, is inescapable.
Therefore Eq. (1.58) demonstrates that magnetars cannot be present in systems with both and , i.e. it shows that neutron stars with magnetar field-strengths cannot be present in PULXs. Which is fully consistent with other observational facts, such as the absence of magnetars in binary systems (for a detailed discussion see King and Lasota, 2019; King et al., 2023).
Since the magnetar–PULX model is directly contradicted by observations, one is necessarily left with the geometrically–beamed–emission option. This means that Eqs. (1.54) and (1.56) have to be completed by two equations: one providing that gives , the other defining the beaming factor .
To describe the accretion flow King et al., (2017) (hereafter KLK17; see also King and Lasota, 2016 and King et al., 2023) used the Shakura and Sunyaev, (1973), “windy” accretion–disc model, according to which the local radiative flux is never larger than its Eddington value, the “excess” power being blown away in a disc–wind. This happens inside the spherization radius
| (1.59) |
where (see King et al., 2023; King et al., 2017 use the original, Shakura and Sunyaev, 1973, “27/4” factor, instead of the correct “15”), resulting in
| (1.60) |
for ( is the mass-transfer rate in Eddington units). Following King, (2009) the beaming factor is taken to be
| (1.61) |
For the given values of the observed quantities and , KLK17 obtain the value of the mass-transfer rate , the beaming factor and the neutron star’s magnetic moment for each PULX. The results are presented in Table 1.1.
[Based on King and Lasota, (2020) (corrected in King et al., 2023)]
| Name | [erg/s] | [s-2] | [G]1 | [cm] | [cm] | ||
|---|---|---|---|---|---|---|---|
| M82 ULX2 | 46 | 0.03 | |||||
| NGC 7793 P13 | 25 | 0.12 | |||||
| NGC5907 ULX1 | 95 | 0.01 | |||||
| NGC300 ULX1 | 24 | 0.13 | |||||
| M51 ULX7 | 28 | 0.09 | |||||
| NGC 1313 X-2 | 46 | 0.03 | |||||
| SMC X-3 | 18 | 0.23 | |||||
| NGC 2403 ULX | 13 | 0.43 | |||||
| Swift J0243.6+6124 | (?)2 | 14 | 0.37 | ||||
| RXJ0209.6-7427 | 17 | 0.25 |
-
- Systems in the last four rows are transient and have confirmed or suspected Be–star companions.
1- obtained from assuming , and .
2- System in the Galaxy: distance uncertain,
Magnetic fields have normal pulsar values and their beaming factors are moderate. The exception is ULX1 in NGC5907, rather strongly beamed and magnetized (but still not a magnetar). In a recent paper (Fürst et al., , 2023) reported observations of ULX1 in NGC5907 in a low state, during a phase of spindown, and, assuming that it is in a propeller regime, deduced a magnetic field G. This value is fully consistent with the result of the KLK17 model: G (Table 1.1), which was obtained assuming and . Using and , say, the resulting field is G. One should stress, however, that for such a field, neither the KLK17 nor the Fürst et al., (2023) calculations are self-consistent because they do not take into account the fact that for such a high field the Eddington luminosity is no longer critical (Eq. 1.53). But even then, ULX1 in NGC 5907 is still super-critical. Iterating, one can put the field G back into the KLK17 equations and obtain a solution which takes into account the fact that the critical luminosity is 43 times larger (Eq. 1.53) than the Eddington luminosity. Then for ULX1 in NGC 5970 . One then obtains a solution with ( times larger than with ), and a beaming factor .
It has been claimed often that beaming suppresses pulsations, however, King and Lasota, (2020) pointed out that the magnetic axis of a neutron-star accretor is not necessarily aligned with the disc (i.e. funnel) axis, and that it is very common for the neutron star spin to be misaligned from the binary orbit defining the accretion disc plane (see Rankin et al., 2023 for a recent example). When these three axes are not aligned the system appears as a PULX since when the neutron-star spin axis is strongly misaligned from the central disc axis at the spherization radius, large polar caps produce the sinusoidal pulse light curves observed in pulsing ULXs because a significant part of the pulsed emission can escape without scattering, giving a large pulse fraction (see King and Lasota, 2020 for details).
Since neutron stars in X–ray binaries have magnetic fields spanning the range from G to several G (Revnivtsev and Mereghetti, , 2018), PULXs are normal XRPs at a special phase of the evolution of their parent binary systems, as suggested a long time ago by King et al., (2001).
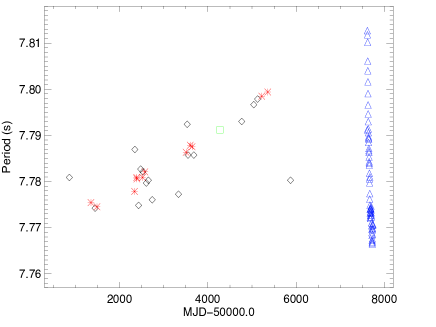
This conclusion is beautifully confirmed by the Be-X binaries that become PULXs only at a certain phase of their orbital evolution. The binary SMC X-3 also illustrates how, during the ULX phase, the neutron–star spin evolution becomes dominated by the accretion torque, as assumed in the KLK17 model. Fig. 1.13 (Townsend et al., , 2017) shows the spin-down observed in this system, right up to the beginning of a giant outburst on MJD 57599, when significant spin-up is observed. Townsend et al., (2017) deduce from the SMC X-3 spin history that the angular momentum transferred by material accreted during the 5–month giant–outburst was larger than the angular momentum lost by magnetic braking over the previous 18 years. The long-term spin-down rate of SMC X-3 is roughly 500 times lower than the spin-up rate seen during the giant outburst, showing the significantly larger torques present during this outburst. Even during previous Type I outbursts recorded by RXTE, the spin period seemed to continue increasing under low levels of accretion. But during the giant outburst, the spin-up rate is tightly correlated with the X-ray luminosity during the super-Eddington phase (Weng et al., , 2017). In other words, in PULXs the spin-up rate is strongly correlated with the X-ray luminosity both in time and over the population.
Weng et al., (2017) and Tsygankov et al., (2017) deduce the value of the magnetic field in SMC X-3. The first team gets , the second , both values well below the magnetar–strength. The KLK17 model gives a lower value of . But Tsygankov et al., (2017) use the Ghosh and Lamb, 1979b model describing the accretion-disc – magnetosphere interaction. Although widely used, this model is known to use very unrealistic assumptions as mentioned in Sect. 1.4.2. On the other hand Weng et al., (2017) use a “simple” model describing the presumed spin–equilibrium of the system. Townsend et al., (2017) use the Ghosh and Lamb, 1979b framework for the description the orbital spin evolution and do not get satisfactory results. In view of this, the discrepancies between these various methods of magnetic–field determination do not seem to be a serious problem. Neither of them lead to the conclusion that SMC X-3 contains a magnetar. Tsygankov et al., (2017) claim that close to the neutron-star surface the magnetic field may contain stronger components than those of the dipole. But, of course, what counts at the magnetosphere is the dipole.
Quite recently, Veledina et al., (2023) found through X-ray polarimetry observations that the WR X-ray binary Cyg X-3 is a ULX with a beaming factor101010I am using here the symbol “b” as defined in this chapter; Veledina et al., 2023 use to denote our ., which corresponds to an Eddington factor (Lasota and King, 2023), but seen from the side. This system is supposed to contain a black hole. Puzzlingly, the authors of this paper do not mention the famous source SS433, which until now had been the best documented case of a “sideways–seen” ULX, nor do they cite any paper on the beamed–radiation interpretation of the ULXs (see the epigraph of this chapter).
1.6.1 Transient ultraluminous X-ray sources
It has recently been established that many, and most probably most, ULXs are transient (Brightman et al., 2023). As mentioned above, some of the ULX transients are Be–X transient systems that occasionally become super–Eddington. Although the peak luminosities of the transient sources in Brightman et al., (2023): are similar to those of Be-ULXs (; see, King et al., 2023), their rise to outburst peak is faster than that observed in Be-ULX sources and three regions of their occurrence show varying ages of the possible stellar counterparts, while Be stars are massive and young. The transient ULX in the galaxy M51 reached a luminosity of (Brightman et al., , 2020), which rather excludes a Be-ULX source. It is therefore worth trying to apply the DIM to transient ULXs, especially since it has already been successfully applied to the description of the lightcurve of XT1 in M51 (Hameury and Lasota, , 2020).
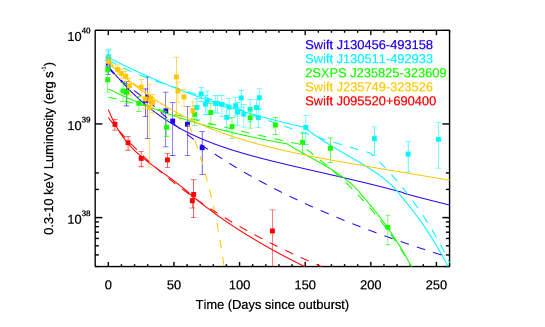
Brightman et al., (2023) used the formulæ from Sec. 1.5.1 to fit the lightcurves of the five transient ULXs described in this paper. The results are shown in Fig. 1.14.
Neither the accretor masses nor the orbital parameters of these transient ULXs are known, which precludes a univocal determination of . Also, one can determine both and only in two cases, because in the other three cases a change of slope has not been observed, which leaves us with only an upper limit on the hot–disc viscosity parameter. The fits correspond to rather high values of : (Brightman et al. 2023). The highest –value determined is 1.39, for a accretor, but the fit for the same system with gives 0.37. High values () were also determined by Tetarenko et al., (2018) for sub–Eddington transient outbursts of black-hole X-ray binaries.
1.7 AGN
Almost 40 years ago, Martin Rees ended his seminal AGN review (Rees, , 1984) with the words: “There has been progress toward a consensus, in that some bizarre ideas that could be seriously discussed a decade ago have been generally discarded. But if we compare present ideas with the most insightful proposals advanced when quasars were first discovered 20 years ago (such proposals being selected, of course, with benefit of hindsight), progress indeed seems meager. It is especially instructive to read Zel’dovich and Novikov, (1965) paper entitled ‘The Mass of Quasi-Stellar Objects’. In this paper, on the basis of early data on 3C 273, they conjectured the following: (a) Radiation pressure perhaps balances gravity, so the central mass is . (b) For a likely efficiency of , the accretion rate would be (c) The radiation would come from an effective “photosphere” at a radius cm (i.e. ), outside of which line opacity would cause radiation to drive a wind. (d) The accretion may be self-regulatory, with a characteristic time scale of 3 yrs. These suggestions accord with the ideas that remain popular today, and we cannot yet make many firmly based statements that are more specific.”
When in 2023 one reads the recent assessment, “In marked contrast to models of accretion discs around stellar mass black holes, neutron stars, and in cataclysmic variables, existing theoretical models of accretion discs around supermassive black holes do a very poor job of explaining, never mind predicting, the observed properties of luminous active galactic nuclei.” (Blaes, 2021), one is tempted to conclude that during the last 60 years, theoretical progress in the field was still meagre (see also an older, but still valid diagnosis in Antonucci, 2013).
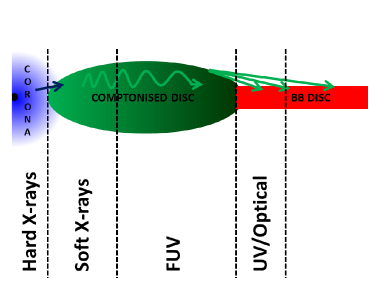
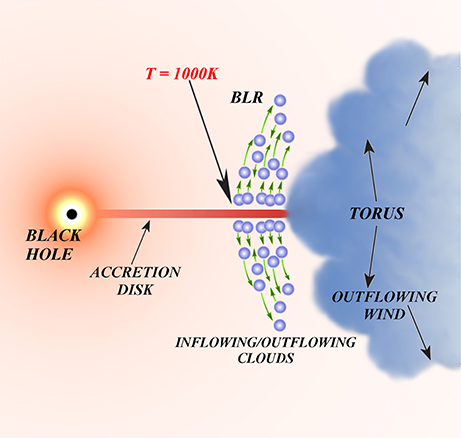
One of the reasons for this lack of progress could be deduced from the two panels on Figure 1.15. These types of figures might be thought to illustrate what are often called “toy models”, even if these two particular examples are not supposed to belong to this category. Nevertheless they correspond to what could be called “Lego models”, since they join together various, more or less physical, models as if they were Lego bricks taken from different sets. Is it the fault of astrophysicists, as suggested by Antonucci, (2013), or are AGNs too complex and too distant to be understood with the theoretical and observational tools available to us? Probably both.
As an illustration, I will address two problems with applying the standard disc model to AGNs: the presumed disc size and the variability timescales.
Disc radius
The disc size can be defined as corresponding to the radius at which the disc temperature matches the wavelength :
| (1.62) |
i.e.,
| (1.63) |
is the wavelength in the rest-frame of the AGN and . Thus the prediction of the thin-disc model is that (for a given Eddington ratio) the size of the disc satisfies the relation , which is confirmed by observations (Morgan et al., , 2010) and that . Determinations of disc sizes through microlensing and reverberation mapping give values several times larger than those expected from Eq. (1.63). For example, for the AGN MCG 08-11-011 Fian et al., (2023) obtain lags that are larger by a factor of than predictions based on the standard thin–disc model . They also detect a size-wavelength relation significantly steeper than predicted by the model: . However, the derivation of Eq. (1.63) assumes that emission at wavelength originates solely at radius , while in real discs this emission also comes from other radii. Therefore a more appropriate size for comparison with observations would be a flux–weighted mean radius with . Also, the formula for the radius assumes its stationarity, but if the disc variability is taken into account this factor could even be . In addition, depends on the black hole mass and the accretion rate (through radiative efficiency), so uncertainties in the values of these quantities might influence the comparison of the model-size with observations.
However, the main weak point of Eq. (1.63) is the assumption that every ring of the putative disc radiates like a black body, and what is observed is the effective temperature. This is not the case with discs in cataclysmic variables (see Sect. 1.3), and it is not the case here. The emitted spectrum depends on the details of the disc’s vertical structure, which are not well known, and what is observed is the colour temperature
| (1.64) |
where is the colour temperature correction. This formula was used by Zdziarski et al., (2022) to reevaluate AGN disc radii. Instead of the disc radius, they calculate the half-light radius, , at which half of the emission at the frequency is emitted inside . They apply the disc model to the quasar SDSS 0924+0219, whose half-light radius, at Hz, from microlensing, is (Morgan et al., , 2010). Using two different colour corrections, Zdziarski et al., (2022) obtain the same result: . Still too short, but just by a factor of 1.4. When the effect of the disc’s inner truncation and disc winds is added, the half–light radius rises to 128. The authors mention that AGN discs are supposed to have X-ray coronas, whose effect would be to multiply the disc size by a factor of , where is the fraction of the disc emission that is lost due both to its covering by a corona and to the coronal dissipation. This might be so, but by adding all these ingredients (except for the colour correction) we end up trying to force a more complex system into the shape of a thin accretion disc, just as Ptolemeus was attempting to make an ellipse into a circle with “equants” and “epicycles’
Therefore, to the question: are observations of AGN disc sizes compatible with the presence there of a stationary, geometrically thin, optically thick Keplerian disc111111This does not have to be a Shakura and Sunyaev, (1973) disc which is a power-law solution assuming a specific form of the viscosity torque and opacity law. The result is much more general. ?, the answer seems to be: “no”. It is possible, however, that the disc size problem is a red herring because of the large intrinsic reddening of AGNs not being properly taken into account, which leads to underestimating their bolometric luminosities ( and in Eq. 1.63, Gaskell, 2017; Gaskell et al., 2023). Still, it is not clear that taking into account the intrinsic reddening results in a self-consistent model of AGNs accreting from stationary geometrically thin discs. (see e.g. Antonucci, 2023). In any case, the thin–disc model in AGNs has to face other serious challenges.
Timescales
The most conspicuous challenge to the thin disc model is probably the extreme variability observed in so–called changing look AGNs (CLAGNs). In these sources, the UV–optical continuum and broad emission line spectral components appear or disappear on timescales of months to years. In the case of Seyferts, this corresponds to a transition between AGN spectra that contain broad emission lines (i.e. Seyfert 1 type) and those with only narrow lines (Seyfert 2 type). For thin discs in the gas–pressure dominated regime the viscous time is
| (1.65) |
so these variability timescales are related rather to the thermal timescale
| (1.66) |
but we still need to explain how huge changes in luminosities can be triggered without affecting the accretion rate.
Jiang and Blaes, (2020) remark that there is a very important difference between accretion discs in bright AGNs and those in cataclysmic variables and X-ray binaries: discs around supermassive black holes “have thermal pressures that are hugely dominated by radiation pressure”, which in the case of the latter could explain the CLAGN phenomenon.
At first glance this assertion might seem surprising, since (when ), according to the Shakura and Sunyaev, (1973) model
| (1.67) |
so that this ratio, close to a black hole, say, is only 6 times smaller than it would be near a neutron star. On the other hand, only hugely super–Eddington accretion rates () would make ,
However, true absorption dominates the opacities only for
| (1.68) |
where I used the Kramers opacities
| (1.69) |
so it seems that, as in the original Shakura and Sunyaev, (1973) solution, the regime can exist only when . This will happen for radii
| (1.70) |
and there, i.e. for radii less than about few tens of
| (1.71) |
so that, at comparable Eddington (accretion–rate) factors, radiation pressure in discs around supermassive BHs can indeed be 100 times larger than in discs around NS and stellar–mass BH.
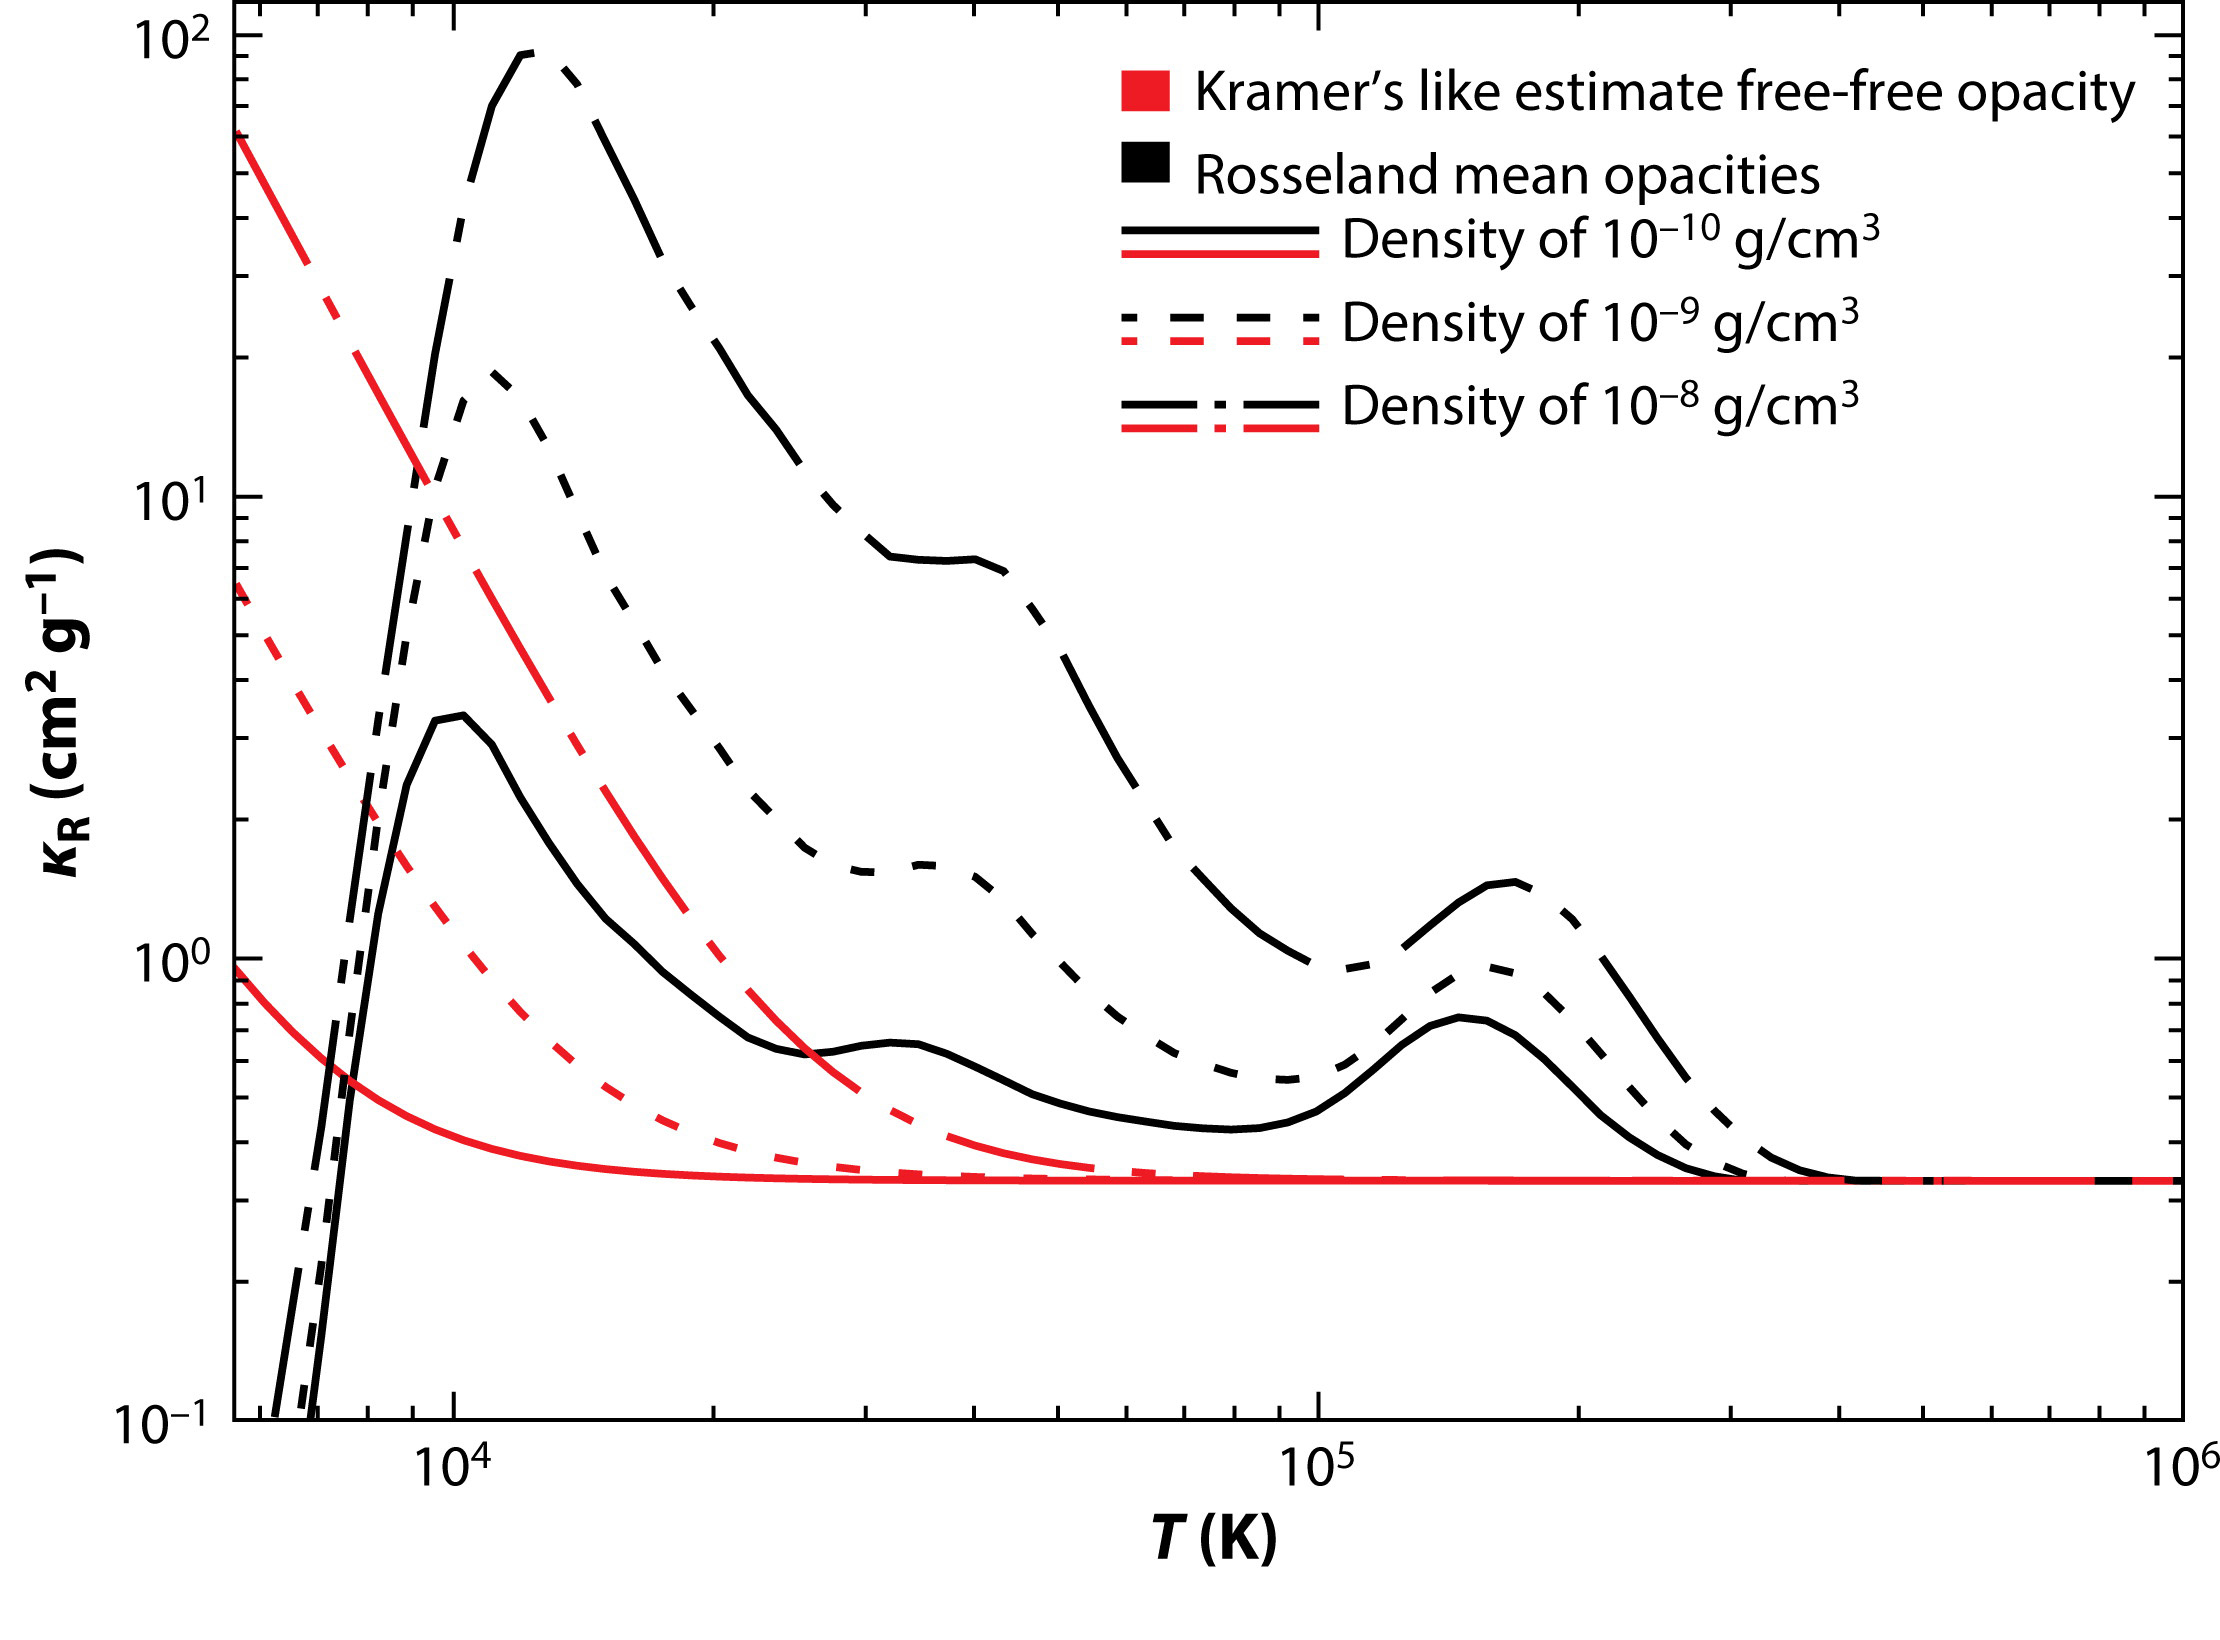
But the real difference between accretion at high rates onto supermassive BH and stellar–mass compact bodies is the temperature of the inner parts of the accreting matter. In the case of NS and stellar–mass BHs the (effective) temperature is K, for white dwarfs it is K, while for supermassive black holes it is K, which corresponds to UV radiation. In addition, the density is much lower than in discs around stellar–mass accretors: . In such conditions the inner region of the accretion disc can be in a regime non–existing in the standard, three–zone Shakura–Sunyaev model: and . The reason is illustrated in Fig. 1.16, taken from Davis and Tchekhovskoy, (2020). Therefore, for typical conditions in the inner–disc region of bright AGNs, the Rosseland mean opacity is expected to be larger than the electron scattering value. Jiang and Blaes, (2020) show that the iron opacity bump (around K) causes the disc to be convectively unstable. Their simulations show that turbulence generated by convection increases the disc thickness due to additional turbulent–pressure support and enhances the local angular momentum transport. They find that this also results in strong fluctuations in surface density and heating of the disc. When the opacity drops with increasing temperature, the convection is suppressed, the disc cools down and the whole cycle repeats again. As a result, the disc scale height strongly oscillates, causing luminosity variations of more than a factor of on a timescale of a few years. The authors propose that this is the physical mechanism which explains AGN variability with a wide range of amplitudes over a timescale of years to decades.
This is, however, doubtful, as demonstrated by the example of Mrk 590, a nearby CLAGN (Lawther et al., , 2023). In its high state, it is a Seyfert 1, i.e. a moderate–accretion rate source, but it shows X-ray and UV variability amplitudes higher than those typically observed in steady-state AGNs of this type. Its variability is similar to that of highly accreting AGNs, i.e. quasars. The characteristic timescale of the Mrk 590 flares is d. Since its mass is , this corresponds to the thermal timescale of its putative accretion discs (see Eq. 1.66 and Fig. 10 in Lawther et al., 2023). However, with an accretion rate at maximum, it is unlikely that the Jiang and Blaes, (2020) mechanism is here at work . At such accretion rates the disc is radiation–pressure dominated only at its innermost tip. The X-ray and UV flares in Mrk 590 have a complex spacetime structure, which seems to exclude a simple disc–like structure. Incidentally, the X-rays in this source irradiate the UV–emitting region, which might suppress convection (Dubus et al., , 1999), if any.
Recently, Yang et al., (2023) suggested that changes observed in changing-look quasars (CLQ) are due to changing accretion rates, with the multiwavelength emission varying accordingly. In this they find “promising analogies to the accretion states of X-ray binaries”. One should, however, be very careful with the interpretation of apparent analogies in the behaviour of accreting systems at different mass and space scales. For example, it has been shown that the hystereses observed in the hardness–intensity diagrams of LMXBs (in X–rays) and of dwarf–novæ (in optical vs EUV/X-ray), despite their apparent similarity, are due to two completely different mechanisms (Hameury et al., 2017; see also Hameury et al., 2020). In the case of apparent analogies between CLQs and binary X–ray transients, one should stress that in the latter, the viscous timescale in the relevant disc region is much shorter than the observed variability times, in striking contrast to CLQs and CLAGNs, so that the existence of a common, or similar, mechanism explaining both these classes of phenomena is rather doubtful.
Interestingly, at , the accretion disc of Mrk 590 should be subject to the dwarf–nova–type thermal–viscous instability (Hameury et al., , 2009; Lasota, , 2022), but the observed variability of this AGN is nothing like the lightcurves produced by this mechanism (see Fig. 7 in Lasota, 2022). The reason is that, although heating and cooling fronts propagate throughout the disc, their movement is too fast to significantly affect the disc’s density. The front propagation timescale is
| (1.72) |
where is the thermal timescale. Hence is shorter than the viscous time by a factor of , i.e. by several orders of magnitude, since (in a gas–pressure dominated disc)
| (1.73) |
where and is the Keplerian speed. Another difference between the discs in binaries and in AGNs is that in the former, the optical emission region is at , while in the latter it is at , much deeper in the gravity potential well, if the AGNs have stationary, flat, geometrically thin, optically thick Keplerian accretion discs. Which is less than certain. But there are alternatives: see e.g. chapter 5 in King, (2023).
Acknowledgements
I am grateful to Robert Antonucci, Mitchell Begelman, Jean-Marie Hameury and Andrew King for inspiring comments, criticism and discussions. I thank Martin Gaskell, Jonathan Katz, Galina Lipunova and Andrzej Zdziarski for their valuable advice and comments on the first posted version of this article. I also thank an anonymous referee for the very detailed report which helped me to correct several errors in the original manuscript. I acknowledge with thanks the variable star observations from the AAVSO International Database contributed by observers worldwide and used in this research.
References
- Abbott and LVK collaboration, (2023) Abbott, R. and LVK collaboration (2023). Population of Merging Compact Binaries Inferred Using Gravitational Waves through GWTC-3. Physical Review X, 13(1):011048.
- Antonucci, (2013) Antonucci, R. (2013). Astrophysics: Quasars still defy explanation. Nature, 495(7440):165–167.
- Antonucci, (2023) Antonucci, R. R. J. (2023). A Walk through AGN Country—For the Somewhat Initiated! Galaxies, 11(5):102.
- Arons, (1992) Arons, J. (1992). Photon Bubbles: Overstability in a Magnetized Atmosphere. ApJ, 388:561.
- Bachetti et al., (2014) Bachetti, M., Harrison, F. A., Walton, D. J., Grefenstette, B. W., Chakrabarty, D., Fürst, F., Barret, D., Beloborodov, A., Boggs, S. E., Christensen, F. E., Craig, W. W., Fabian, A. C., Hailey, C. J., Hornschemeier, A., Kaspi, V., Kulkarni, S. R., Maccarone, T., Miller, J. M., Rana, V., Stern, D., Tendulkar, S. P., Tomsick, J., Webb, N. A., and Zhang, W. W. (2014). An ultraluminous X-ray source powered by an accreting neutron star. Nature, 514:202–204.
- Bachetti et al., (2022) Bachetti, M., Heida, M., Maccarone, T., Huppenkothen, D., Israel, G. L., Barret, D., Brightman, M., Brumback, M., Earnshaw, H. P., Forster, K., Fürst, F., Grefenstette, B. W., Harrison, F. A., Jaodand, A. D., Madsen, K. K., Middleton, M., Pike, S. N., Pilia, M., Poutanen, J., Stern, D., Tomsick, J. A., Walton, D. J., Webb, N., and Wilms, J. (2022). Orbital Decay in M82 X-2. ApJ, 937(2):125.
- Balbus and Hawley, (1991) Balbus, S. A. and Hawley, J. F. (1991). A Powerful Local Shear Instability in Weakly Magnetized Disks. I. Linear Analysis. ApJ, 376:214.
- Balman, (2014) Balman, S. (2014). Probing disk truncation in Dwarf Novae and CVs with X-ray variations and comparisons with work on other wavelengths. In Proceedings of Frontier Research in Astrophysics (FRAPWS2014) held 26-31 May, page 9.
- Begelman, (2017) Begelman, M. (2017). Photon Bubbles in Ultraluminous X-ray Pulsars. unpublished.
- Belczynski et al., (2010) Belczynski, K., Dominik, M., Bulik, T., O’Shaughnessy, R., Fryer, C., and Holz, D. E. (2010). The Effect of Metallicity on the Detection Prospects for Gravitational Waves. ApJLett, 715(2):L138–L141.
- Belczynski et al., (2021) Belczynski, K., Done, C., Hagen, S., Lasota, J. P., and Sen, K. (2021). Common origin of black holes in high mass X-ray binaries and in gravitation-wave sources. arXiv e-prints, page arXiv:2111.09401.
- Blaes, (2021) Blaes, O. (2021). Accretion Disks around Supermassive Black Holes with Realistic Opacity. NASA proposal id 21-ATP21-96.
- Brightman et al., (2020) Brightman, M., Earnshaw, H., Fürst, F., Harrison, F. A., Heida, M., Israel, G., Pike, S., Stern, D., and Walton, D. J. (2020). Swift Monitoring of M51: A 38 day Superorbital Period for the Pulsar ULX7 and a New Transient Ultraluminous X-Ray Source. ApJ, 895(2):127.
- Brightman et al., (2023) Brightman, M., Hameury, J.-M., Lasota, J.-P., Baldi, R. D., Bruni, G., Cann, J. M., Earnshaw, H., Fürst, F., Heida, M., Jaodand, A., Lazzarini, M., Middleton, M. J., Walton, D. J., and Weaver, K. A. (2023). A New Sample of Transient Ultraluminous X-Ray Sources Serendipitously Discovered by Swift/XRT. ApJ, 951(1):51.
- Buat-Ménard et al., (2001) Buat-Ménard, V., Hameury, J. M., and Lasota, J. P. (2001). Z Cam stars: A particular response to a general phenomenon. A&A, 369:925–931.
- Cambier, (2015) Cambier, H. (2015). Agitating mass transfer with a warped disc’s shadow. MNRAS, 452(4):3620–3628.
- Canuto et al., (1971) Canuto, V., Lodenquai, J., and Ruderman, M. (1971). Thomson Scattering in a Strong Magnetic Field. Phys. Rev. D, 3(10):2303–2308.
- Carr et al., (2021) Carr, B., Kühnel, F., and Visinelli, L. (2021). Constraints on stupendously large black holes. MNRAS, 501(2):2029–2043.
- Colbert and Mushotzky, (1999) Colbert, E. J. M. and Mushotzky, R. F. (1999). The Nature of Accreting Black Holes in Nearby Galaxy Nuclei. ApJ, 519:89–107.
- Coleman et al., (2016) Coleman, M. S. B., Kotko, I., Blaes, O., Lasota, J. P., and Hirose, S. (2016). Dwarf nova outbursts with magnetorotational turbulence. MNRAS, 462(4):3710–3726.
- Coriat et al., (2012) Coriat, M., Fender, R. P., and Dubus, G. (2012). Revisiting a fundamental test of the disc instability model for X-ray binaries. MNRAS, 424:1991–2001.
- Czerny et al., (2017) Czerny, B., Li, Y.-R., Sredzinska, J., Hryniewicz, K., Panda, S., Wildy, C., and Karas, V. (2017). Self-consistent dynamical model of the Broad Line Region. Frontiers in Astronomy and Space Sciences, 4:5.
- Dall’Osso et al., (2015) Dall’Osso, S., Perna, R., and Stella, L. (2015). NuSTAR J095551+6940.8: a highly magnetized neutron star with super-Eddington mass accretion. MNRAS, 449(2):2144–2150.
- D’Angelo and Spruit, (2010) D’Angelo, C. R. and Spruit, H. C. (2010). Episodic accretion on to strongly magnetic stars. MNRAS, 406(2):1208–1219.
- D’Angelo and Spruit, (2011) D’Angelo, C. R. and Spruit, H. C. (2011). Long-term evolution of discs around magnetic stars. MNRAS, 416(2):893–906.
- D’Angelo and Spruit, (2012) D’Angelo, C. R. and Spruit, H. C. (2012). Accretion discs trapped near corotation. MNRAS, 420(1):416–429.
- Davis and Tchekhovskoy, (2020) Davis, S. W. and Tchekhovskoy, A. (2020). Magnetohydrodynamics Simulations of Active Galactic Nucleus Disks and Jets. ARA&A, 58:407–439.
- Dobrotka et al., (2023) Dobrotka, A., Ness, J. U., Nucita, A. A., and Melicherčík, M. (2023). XMM-Newton observation of V1504 Cyg as a probe for the existence of an evaporated corona. A&A, 674:A188.
- Dubus et al., (2019) Dubus, G., Done, C., Tetarenko, B. E., and Hameury, J.-M. (2019). The impact of thermal winds on the outburst lightcurves of black hole X-ray binaries. A&A, 632:A40.
- Dubus et al., (2001) Dubus, G., Hameury, J.-M., and Lasota, J.-P. (2001). The disc instability model for X-ray transients: Evidence for truncation and irradiation. A&A, 373:251–271.
- Dubus et al., (1999) Dubus, G., Lasota, J.-P., Hameury, J.-M., and Charles, P. (1999). X-ray irradiation in low-mass binary systems. MNRAS, 303:139–147.
- Dubus et al., (2018) Dubus, G., Otulakowska-Hypka, M., and Lasota, J.-P. (2018). Testing the disk instability model of cataclysmic variables. A&A, 617:A26.
- Duffy et al., (2022) Duffy, C., Ramsay, G., Steeghs, D., Kennedy, M. R., West, R. G., Wheatley, P. J., Dhillon, V. S., Ackley, K., Dyer, M. J., Galloway, D. K., Gill, S., Acton, J. S., Burleigh, M. R., Casewell, S. L., Goad, M. R., Henderson, B. A., Tilbrook, R. H., Strøm, P. A., and Anderson, D. R. (2022). The return of the spin period in DW Cnc and evidence of new high state outbursts. MNRAS, 510(1):1002–1009.
- Eksi et al., (2015) Eksi, K. Y., Andac, I. C., Cikintoglu, S., Gencali, A. A., Gungor, C., and Oztekin, F. (2015). The ultraluminous X-ray source NuSTAR J095551+6940.8: a magnetar in a high-mass X-ray binary. MNRAS, 448:L40–L42.
- Faruk Çoban and Ertan, (2023) Faruk Çoban, Ö. and Ertan, U. (2023). Typical X-ray Outburst Light Curves of Aql X-1. arXiv e-prints, page arXiv:2304.05280.
- Fian et al., (2023) Fian, C., Chelouche, D., Kaspi, S., Sobrino Figaredo, C., Lewis, T., and Catalan, S. (2023). Continuum reverberation mapping of MCG 08-11-011. A&A, 672:A132.
- Frank et al., (2002) Frank, J., King, A., and Raine, D. J. (2002). Accretion Power in Astrophysics: Third Edition. CUP.
- Fürst et al., (2023) Fürst, F., Walton, D. J., Israel, G. L., Bachetti, M., Barret, D., Brightman, M., Earnshaw, H. P., Fabian, A., Heida, M., Imbrogno, M., Middleton, M. J., Pinto, C., Salvaterra, R., Roberts, T. P., Rodríguez Castillo, G. A., and Webb, N. (2023). Probing the nature of the low state in the extreme ultraluminous X-ray pulsar NGC 5907 ULX1. A&A, 672:A140.
- Gardner and Done, (2017) Gardner, E. and Done, C. (2017). The origin of the UV/optical lags in NGC 5548. MNRAS, 470(3):3591–3605.
- Gaskell, (2017) Gaskell, C. M. (2017). The case for cases B and C: intrinsic hydrogen line ratios of the broad-line region of active galactic nuclei, reddenings, and accretion disc sizes. MNRAS, 467(1):226–238.
- Gaskell et al., (2023) Gaskell, C. M., Anderson, F. C., Birmingham, S. Á., and Ghosh, S. (2023). Estimating reddening of the continuum and broad-line region of active galactic nuclei: the mean reddening of NGC 5548 and the size of the accretion disc. MNRAS, 519(3):4082–4093.
- (42) Ghosh, P. and Lamb, F. K. (1979a). Accretion by rotating magnetic neutron stars. II. Radial and vertical structure of the transition zone in disk accretion. ApJ, 232:259–276.
- (43) Ghosh, P. and Lamb, F. K. (1979b). Accretion by rotating magnetic neutron stars. III. Accretion torques and period changes in pulsating X-ray sources. ApJ, 234:296–316.
- Ghosh et al., (1977) Ghosh, P., Lamb, F. K., and Pethick, C. J. (1977). Accretion by rotating magnetic neutron stars. I. Flow of matter inside the magnetosphere and its implications for spin-up and spin-down of the star. ApJ, 217:578–596.
- Gralla et al., (2019) Gralla, S. E., Holz, D. E., and Wald, R. M. (2019). Black hole shadows, photon rings, and lensing rings. PRD, 100(2):024018.
- Hameury, (2020) Hameury, J. M. (2020). A review of the disc instability model for dwarf novae, soft X-ray transients and related objects. Adv. Sp. Res., 66(5):1004–1024.
- Hameury et al., (2020) Hameury, J. M., Knigge, C., Lasota, J. P., Hambsch, F. J., and James, R. (2020). Modelling hystereses observed during dwarf nova outbursts. A&A, 636:A1.
- Hameury and Lasota, (1985) Hameury, J. M. and Lasota, J. P. (1985). Magnetohydrostatics in the polar caps of accreting magnetized white dwarfs. A&A, 145(2):L10–L12.
- Hameury and Lasota, (2002) Hameury, J. M. and Lasota, J. P. (2002). VY Sculptoris stars as magnetic cataclysmic variables. A&A, 394:231–239.
- Hameury and Lasota, (2005) Hameury, J.-M. and Lasota, J.-P. (2005). The disk vanishes. arXiv e-prints, pages astro–ph/0506382.
- Hameury and Lasota, (2014) Hameury, J. M. and Lasota, J. P. (2014). Anomalous Z Cam stars: a response to mass-transfer outbursts. A&A, 569:A48.
- (52) Hameury, J. M. and Lasota, J. P. (2017a). Dwarf nova outbursts in intermediate polars. A&A, 602:A102.
- (53) Hameury, J. M. and Lasota, J. P. (2017b). The disappearance and reformation of the accretion disc during a low state of FO Aquarii. A&A, 606:A7.
- Hameury and Lasota, (2020) Hameury, J. M. and Lasota, J. P. (2020). Models of ultraluminous X-ray transient sources. A&A, 643:A171.
- Hameury and Lasota, (2021) Hameury, J. M. and Lasota, J. P. (2021). Modelling rebrightenings, reflares, and echoes in dwarf nova outbursts. A&A, 650:A114.
- Hameury et al., (2017) Hameury, J. M., Lasota, J. P., Knigge, C., and Körding, E. G. (2017). Hystereses in dwarf nova outbursts and low-mass X-ray binaries. A&A, 600:A95.
- Hameury et al., (2022) Hameury, J. M., Lasota, J. P., and Shaw, A. W. (2022). Magnetically gated accretion model: Application to short bursts in the intermediate polar V1223 Sgr. A&A, 664:A7.
- Hameury et al., (2000) Hameury, J.-M., Lasota, J.-P., and Warner, B. (2000). The zoo of dwarf novae: illumination, evaporation and disc radius variation. A&A, 353:244–252.
- Hameury et al., (1998) Hameury, J.-M., Menou, K., Dubus, G., Lasota, J.-P., and Hure, J.-M. (1998). Accretion disc outbursts: a new version of an old model. MNRAS, 298(4):1048–1060.
- Hameury et al., (2009) Hameury, J. M., Viallet, M., and Lasota, J. P. (2009). The thermal-viscous disk instability model in the AGN context. A&A, 496(2):413–421.
- Hellier et al., (2002) Hellier, C., Wynn, G. A., and Buckley, D. A. H. (2002). On the accretion mode of the intermediate polar V1025 Centauri. MNRAS, 333(1):84–92.
- Hirose et al., (2014) Hirose, S., Blaes, O., Krolik, J. H., Coleman, M. S. B., and Sano, T. (2014). Convection Causes Enhanced Magnetic Turbulence in Accretion Disks in Outburst. ApJ, 787(1):1.
- Horne and Stiening, (1985) Horne, K. and Stiening, R. F. (1985). Eclipse maps of the accretion disc in RW Trianguli. MNRAS, 216:933–948.
- Hubeny and Long, (2021) Hubeny, I. and Long, K. S. (2021). An improved model for the spectra of discs of nova-like variables. MNRAS, 503(4):5534–5544.
- Idan et al., (2010) Idan, I., Lasota, J. P., Hameury, J. M., and Shaviv, G. (2010). Accretion-disc model spectra for dwarf-nova stars. A&A, 519:A117.
- Jiang and Blaes, (2020) Jiang, Y.-F. and Blaes, O. (2020). Opacity-driven Convection and Variability in Accretion Disks around Supermassive Black Holes. ApJ, 900(1):25.
- Joss et al., (1979) Joss, P. C., Katz, J. I., and Rappaport, S. (1979). Synchronous rotation in magnetic X-ray binaries. ApJ, 230:176–183.
- Justham et al., (2006) Justham, S., Rappaport, S., and Podsiadlowski, P. (2006). Magnetic braking of Ap/Bp stars: application to compact black-hole X-ray binaries. MNRAS, 366(4):1415–1423.
- Kalomeni, (2012) Kalomeni, B. (2012). Short and long time-scale variability in magnetic cataclysmic variables: long-term monitoring of polars. MNRAS, 422(2):1601–1608.
- King, (2016) King, A. (2016). How big can a black hole grow? MNRAS, 456(1):L109–L112.
- King, (2023) King, A. (2023). Supermassive Black Holes. CUP.
- King and Lasota, (2016) King, A. and Lasota, J.-P. (2016). ULXs: Neutron stars versus black holes. MNRAS, 458:L10–L13.
- King and Lasota, (2019) King, A. and Lasota, J.-P. (2019). No magnetars in ULXs. MNRAS, 485(3):3588–3594.
- King and Lasota, (2020) King, A. and Lasota, J.-P. (2020). Pulsing and non-pulsing ULXs: the iceberg emerges. MNRAS, 494(3):3611–3615.
- King et al., (2017) King, A., Lasota, J.-P., and Kluźniak, W. (2017). Pulsing ULXs: tip of the iceberg? MNRAS, 468:L59–L62.
- King et al., (2023) King, A., Lasota, J.-P., and Middleton, M. (2023). Ultraluminous X-ray sources. NewAR, 96:101672.
- King, (1998) King, A. R. (1998). Outbursts of irradiated accretion discs. MNRAS, 296(4):L45–l50.
- King, (2009) King, A. R. (2009). Masses, beaming and Eddington ratios in ultraluminous X-ray sources. MNRAS, 393:L41–L44.
- King et al., (2001) King, A. R., Davies, M. B., Ward, M. J., Fabbiano, G., and Elvis, M. (2001). Ultraluminous X-Ray Sources in External Galaxies. ApJLett, 552(2):L109–L112.
- King et al., (1996) King, A. R., Kolb, U., and Burderi, L. (1996). Black Hole Binaries and X-Ray Transients. ApJLett, 464:L127.
- King and Ritter, (1998) King, A. R. and Ritter, H. (1998). The light curves of soft X-ray transients. MNRAS, 293(1):L42–L48.
- King and Wynn, (1999) King, A. R. and Wynn, G. A. (1999). The spin period of EX Hydrae. MNRAS, 310(1):203–209.
- Kinney et al., (1989) Kinney, A. L., Antonucci, R. R. J., and Ford, H. C. (1989). Lyman Edges in Quasar Spectra. In Osterbrock, D. E. and Miller, J. S., editors, Active Galactic Nuclei, volume 134, page 555.
- Kluźniak and Lasota, (2015) Kluźniak, W. and Lasota, J.-P. (2015). An ultraluminous nascent millisecond pulsar. MNRAS, 448:L43–L47.
- Knigge et al., (2011) Knigge, C., Baraffe, I., and Patterson, J. (2011). The Evolution of Cataclysmic Variables as Revealed by Their Donor Stars. ApJS, 194(2):28.
- Kotko and Lasota, (2012) Kotko, I. and Lasota, J. P. (2012). The viscosity parameter and the properties of accretion disc outbursts in close binaries. A&A, 545:A115.
- Kotko et al., (2012) Kotko, I., Lasota, J. P., Dubus, G., and Hameury, J. M. (2012). Models of AM Canum Venaticorum star outbursts. A&A, 544:A13.
- Lai, (2014) Lai, D. (2014). Theory of Disk Accretion onto Magnetic Stars. In European Physical Journal Web of Conferences, volume 64 of European Physical Journal Web of Conferences, page 01001.
- Lasota, (2001) Lasota, J.-P. (2001). The disc instability model of dwarf novae and low-mass X-ray binary transients. NewAR, 45:449–508.
- Lasota, (2016) Lasota, J.-P. (2016). Black Hole Accretion Discs. In Bambi, C., editor, Astrophysics of Black Holes: From Fundamental Aspects to Latest Developments, volume 440 of Astrophysics and Space Science Library, page 1.
- Lasota, (2022) Lasota, J.-P. (2022). AGN Accretion Disks in Active Galactic Nuclei; F. Combes, ed., pages 103–153. Wiley.
- Lasota et al., (2008) Lasota, J. P., Dubus, G., and Kruk, K. (2008). Stability of helium accretion discs in ultracompact binaries. A&A, 486(2):523–528.
- Lasota et al., (1995) Lasota, J. P., Hameury, J. M., and Hure, J. M. (1995). Dwarf novae at low mass transfer rates. A&A, 302:L29.
- Lasota and King, (2023) Lasota, J.-P. and King, A. (2023). Ultraluminous X-ray sources are beamed. MNRAS, 526(2):2506–2509.
- Lasota et al., (2015) Lasota, J.-P., King, A. R., and Dubus, G. (2015). X-ray Transients: Hyper- or Hypo-Luminous? ApJLett, 801(1):L4.
- Lawther et al., (2023) Lawther, D., Vestergaard, M., Raimundo, S., Koay, J. Y., Peterson, B. M., Fan, X., Grupe, D., and Mathur, S. (2023). Flares in the changing look AGN Mrk 590 - I. The UV response to X-ray outbursts suggests a more complex reprocessing geometry than a standard disc. MNRAS, 519(3):3903–3922.
- Lesur, (2021) Lesur, G. (2021). Magnetohydrodynamics of protoplanetary discs. Journal of Plasma Physics, 87(1):205870101.
- Lipunova and Shakura, (2000) Lipunova, G. V. and Shakura, N. I. (2000). New solution to viscous evolution of accretion disks in binary systems. A&A, 356:363–372.
- Littlefield et al., (2020) Littlefield, C., Garnavich, P., Kennedy, M. R., Patterson, J., Kemp, J., Stiller, R. A., Hambsch, F.-J., Heras, T. A., Myers, G., Stone, G., Sjöberg, G., Dvorak, S., Nelson, P., Popov, V., Bonnardeau, M., Vanmunster, T., de Miguel, E., Alton, K. B., Harris, B., Cook, L. M., Graham, K. A., Brincat, S. M., Lane, D. J., Foster, J., Pickard, R., Sabo, R., Vietje, B., Lemay, D., Briol, J., Krumm, N., Dadighat, M., Goff, W., Solomon, R., Padovan, S., Bolt, G., Kardasis, E., Debackère, A., Thrush, J., Stein, W., Walter, B., Coulter, D., Tsehmeystrenko, V., Gout, J.-F., Lewin, P., Galdies, C., Fernandez, D. C., Walker, G., Boardman, James, J., and Pellett, E. (2020). The Rise and Fall of the King: The Correlation between FO Aquarii’s Low States and the White Dwarf’s Spin-down. ApJ, 896(2):116.
- Littlefield et al., (2022) Littlefield, C., Lasota, J.-P., Hameury, J.-M., Scaringi, S., Garnavich, P., Szkody, P., Kennedy, M., and Leichty, M. (2022). Rapid Bursts of Magnetically Gated Accretion in the Intermediate Polar V1025 Cen. ApJLett, 924(1):L8.
- Martin et al., (2014) Martin, R. G., Nixon, C., Lubow, S. H., Armitage, P. J., Price, D. J., Doğan, S., and King, A. (2014). The Kozai-Lidov Mechanism in Hydrodynamical Disks. ApJLett, 792(2):L33.
- Mason et al., (1988) Mason, K. O., Cordova, F. A., Watson, M. G., and King, A. R. (1988). The discovery of orbital dips in the soft X-ray emission of U GEM during an outburst. MNRAS, 232:779–791.
- Meyer and Meyer-Hofmeister, (1984) Meyer, F. and Meyer-Hofmeister, E. (1984). Outbursts in dwarf novae accretion disks. A&A, 132:143–150.
- Meyer and Meyer-Hofmeister, (1994) Meyer, F. and Meyer-Hofmeister, E. (1994). Accretion disk evaporation by a coronal siphon flow. A&A, 288:175–182.
- Miller-Jones et al., (2021) Miller-Jones, J. C. A., Bahramian, A., Orosz, J. A., Mandel, I., Gou, L., Maccarone, T. J., Neijssel, C. J., Zhao, X., Ziółkowski, J., Reid, M. J., Uttley, P., Zheng, X., Byun, D.-Y., Dodson, R., Grinberg, V., Jung, T., Kim, J.-S., Marcote, B., Markoff, S., Rioja, M. J., Rushton, A. P., Russell, D. M., Sivakoff, G. R., Tetarenko, A. J., Tudose, V., and Wilms, J. (2021). Cygnus X-1 contains a 21-solar mass black hole—Implications for massive star winds. Science, 371(6533):1046–1049.
- Miyoshi et al., (1995) Miyoshi, M., Moran, J., Herrnstein, J., Greenhill, L., Nakai, N., Diamond, P., and Inoue, M. (1995). Evidence for a black hole from high rotation velocities in a sub-parsec region of NGC4258. Nature, 373(6510):127–129.
- Montgomery, (2001) Montgomery, M. M. (2001). An analytical expression for apsidal superhump precession and comparisons with numerical simulations and dwarf nova observations. MNRAS, 325(2):761–766.
- Morgan et al., (2010) Morgan, C. W., Kochanek, C. S., Morgan, N. D., and Falco, E. E. (2010). The Quasar Accretion Disk Size-Black Hole Mass Relation. ApJ, 712(2):1129–1136.
- Murray, (2000) Murray, J. R. (2000). The precession of eccentric discs in close binaries. MNRAS, 314(1):L1–L5.
- Osaki, (1985) Osaki, Y. (1985). Irradiation-induced mass-overflow instability as a possible cause of superoutbursts in SU UMa stars. A&A, 144:369–380.
- Osaki, (1989) Osaki, Y. (1989). A model for the superoutburst phenomenon of SU Ursae Majoris stars. PASJ, 41:1005–1033.
- Oyang et al., (2021) Oyang, B., Jiang, Y.-F., and Blaes, O. (2021). Investigating lack of accretion disc eccentricity growth in a global 3D MHD simulation of a superhump system. MNRAS, 505(1):1–17.
- Paczynski, (1992) Paczynski, B. (1992). GB 790305 as a Very Strongly Magnetized Neutron Star. Ac. Ast., 42:145–153.
- Paczynsky and Wiita, (1980) Paczynsky, B. and Wiita, P. J. (1980). Thick accretion disks and supercritical luminosities. A&A, 500:203–211.
- Patterson, (1999) Patterson, J. (1999). Permanent Superhumps in Cataclysmic Variables. In Mineshige, S. and Wheeler, J. C., editors, Disk Instabilities in Close Binary Systems, page 61.
- Pearson, (2006) Pearson, K. J. (2006). Superhumps: confronting theory with observation. MNRAS, 371(1):235–244.
- Rankin et al., (2023) Rankin, J., La Monaca, F., Di Marco, A., Poutanen, J., Bobrikova, A., Kravtsov, V., Muleri, F., Pilia, M., Veledina, A., Fender, R., Kaaret, P., Kim, D. E., Marinucci, A., Marshall, H. L., Papitto, A., Tennant, A. F., Tsygankov, S. S., Weisskopf, M. C., Wu, K., Zane, S., Ambrosino, F., Farinelli, R., Gnarini, A., Agudo, I., Antonelli, L. A., Bachetti, M., Baldini, L., Baumgartner, W. H., Bellazzini, R., Bianchi, S., Bongiorno, S. D., Bonino, R., Brez, A., Bucciantini, N., Capitanio, F., Castellano, S., Cavazzuti, E., Chen, C.-T., Ciprini, S., Costa, E., De Rosa, A., Del Monte, E., Di Gesu, L., di Lalla, N., Donnarumma, I., Doroshenko, V., Dovčiak, M., Ehlert, S. R., Enoto, T., Evangelista, Y., Fabiani, S., Ferrazzoli, R., Garcia, J. A., Gunji, S., Hayashida, K., Heyl, J., Iwakiri, W., Jorstad, S. G., Karas, V., Kislat, F., Kitaguchi, T., Kolodziejczak, J. J., Krawczynski, H., Latronico, L., Liodakis, I., Maldera, S., Manfreda, A., Marin, F., Marscher, A. P., Massaro, F., Matt, G., Mitsuishi, I., Mizuno, T., Negro, M., Ng, C.-Y., O’Dell, S. L., Omodei, N., Oppedisano, C., Pavlov, G. G., Peirson, A. L., Perri, M., Pesce-Rollins, M., Petrucci, P.-O., Possenti, A., Puccetti, S., Ramsey, B. D., Ratheesh, A., Roberts, O. J., Romani, R. W., Sgrò, C., Slane, P., Soffitta, P., Spandre, G., Swartz, D. A., Tamagawa, T., Tavecchio, F., Taverna, R., Tawara, Y., Thomas, N. E., Tombesi, F., Trois, A., Turolla, R., Vink, J., and Xie, F. (2023). X-Ray Polarized View on the Accretion Geometry in the X-Ray Binary Circinus X-1. arXiv e-prints, page arXiv:2311.04632.
- Rees, (1984) Rees, M. J. (1984). Black Hole Models for Active Galactic Nuclei. ARA&A, 22:471–506.
- Revnivtsev and Mereghetti, (2018) Revnivtsev, M. and Mereghetti, S. (2018). Magnetic Fields of Neutron Stars in X-Ray Binaries. In Beskin, V. S., Balogh, A., Falanga, M., Lyutikov, M., Mereghetti, S., Piran, T., and Treumann, R. A., editors, The Strongest Magnetic Fields in the Universe, volume 54, pages 299–320. Springer.
- Ritter, (1988) Ritter, H. (1988). Turning on and off mass transfer in cataclysmic binaries. A&A, 202:93–100.
- Ritter and King, (2001) Ritter, H. and King, A. R. (2001). On the Spin-Up of Neutron Stars to Millisecond Pulsars in Long-Period Binaries. In Podsiadlowski, P., Rappaport, S., King, A. R., D’Antona, F., and Burderi, L., editors, Evolution of Binary and Multiple Star Systems, volume 229 of Astronomical Society of the Pacific Conference Series, page 423.
- Rodríguez-Gil et al., (2004) Rodríguez-Gil, P., Gänsicke, B. T., Araujo-Betancor, S., and Casares, J. (2004). DW Cancri: a magnetic VY Scl star with an orbital period of 86 min. MNRAS, 349(1):367–374.
- Rodríguez-Gil et al., (2009) Rodríguez-Gil, P., Martínez-Pais, I. G., and de la Cruz Rodríguez, J. (2009). The magnetic SW Sextantis star RXJ1643.7+3402. MNRAS, 395(2):973–978.
- (124) Scaringi, S., de Martino, D., Buckley, D. A. H., Groot, P. J., Knigge, C., Fratta, M., Iłkiewicz, K., Littlefield, C., and Papitto, A. (2022a). An accreting white dwarf displaying fast transitional mode switching. Nature Astronomy, 6:98–102.
- (125) Scaringi, S., Groot, P. J., Knigge, C., Bird, A. J., Breedt, E., Buckley, D. A. H., Cavecchi, Y., Degenaar, N. D., de Martino, D., Done, C., Fratta, M., Iłkiewicz, K., Koerding, E., Lasota, J. P., Littlefield, C., Manara, C. F., O’Brien, M., Szkody, P., and Timmes, F. X. (2022b). Localized thermonuclear bursts from accreting magnetic white dwarfs. Nature, 604(7906):447–450.
- (126) Scaringi, S., Groot, P. J., Knigge, C., Lasota, J. P., de Martino, D., Cavecchi, Y., Buckley, D. A. H., and Camisassa, M. E. (2022c). Triggering micronovae through magnetically confined accretion flows in accreting white dwarfs. MNRAS, 514(1):L11–L15.
- Scaringi et al., (2017) Scaringi, S., Maccarone, T. J., D’Angelo, C., Knigge, C., and Groot, P. J. (2017). Magnetically gated accretion in an accreting ‘non-magnetic’ white dwarf. Nature, 552(7684):210–213.
- Scepi et al., (2019) Scepi, N., Dubus, G., and Lesur, G. (2019). Magnetic wind-driven accretion in dwarf novae. A&A, 626:A116.
- Scepi et al., (2018) Scepi, N., Lesur, G., Dubus, G., and Flock, M. (2018). Impact of convection and resistivity on angular momentum transport in dwarf novae. A&A, 609:A77.
- Schaefer et al., (2022) Schaefer, B. E., Pagnotta, A., and Zoppelt, S. (2022). Discovery of extreme, roughly daily superflares on the recurrent nova V2487 Oph. MNRAS, 512(2):1924–1943.
- Schreiber, (2007) Schreiber, M. R. (2007). The statistical significance of the superhump signal in U Geminorum. A&A, 466(3):1025–1030.
- Schreiber, (2013) Schreiber, M. R. (2013). One Good Measure. Science, 340(6135):932–933.
- Schreiber et al., (2003) Schreiber, M. R., Hameury, J. M., and Lasota, J. P. (2003). Delays in dwarf novae I: The case of SS Cygni. A&A, 410:239–252.
- Schreiber et al., (2004) Schreiber, M. R., Hameury, J. M., and Lasota, J. P. (2004). Delays in dwarf novae II: VW Hyi, the tidal instability and enhanced mass transfer models. A&A, 427:621–635.
- Shakura and Sunyaev, (1973) Shakura, N. I. and Sunyaev, R. A. (1973). Black holes in binary systems. Observational appearance. A&A, 24:337–355.
- Simonsen, (2011) Simonsen, M. (2011). The Z CamPaign: Year 1. J. Am. Assoc. Var. Star Obs., 39(1):66.
- Smak, (1984) Smak, J. (1984). Accretion in cataclysmic binaries. IV. Accretion disks in dwarf novae. Ac. Ast., 34:161–189.
- (138) Smak, J. (2009a). New Interpretation of Superhumps. Ac. Ast., 59(1):121–130.
- (139) Smak, J. (2009b). On the Origin of Tilted Disks and Negative Superhumps. Ac. Ast., 59(4):419–430.
- Smak, (2017) Smak, J. (2017). DW UMa and the Irradiation Modulated Mass Transfer Model for Superhumps. Ac. Ast., 67(3):273–280.
- (141) Smak, J. (2020a). On the Critical Mass Ratio for the 3:1 Resonance in Accretion Disks. Ac. Ast., 70(4):313–315.
- (142) Smak, J. (2020b). On the Periods and Nature of Superhumps. Ac. Ast., 70(4):317–321.
- Smak and Waagen, (2004) Smak, J. and Waagen, E. O. (2004). The 1985 Superoutburst of U Geminorum. Detection of Superhumps. Ac. Ast., 54:433–442.
- Smak, (1991) Smak, J. I. (1991). On the models for superoutbursts in dwarf novae of the SU UMa type. Ac. Ast., 41:269–277.
- Spruit and Taam, (1993) Spruit, H. C. and Taam, R. E. (1993). An Instability Associated with a Magnetosphere-Disk Interaction. ApJ, 402:593.
- Szkody et al., (2013) Szkody, P., Albright, M., Linnell, A. P., Everett, M. E., McMillan, R., Saurage, G., Huehnerhoff, J., Howell, S. B., Simonsen, M., and Hunt-Walker, N. (2013). A Study of the Unusual Z Cam Systems IW Andromedae and V513 Cassiopeia. PASP, 125(934):1421.
- Tetarenko et al., (2020) Tetarenko, B. E., Dubus, G., Marcel, G., Done, C., and Clavel, M. (2020). Thermally driven disc winds as a mechanism for X-ray irradiation heating in black hole X-ray binaries: the case study of GX339-4. MNRAS, 495(4):3666–3682.
- Tetarenko et al., (2018) Tetarenko, B. E., Lasota, J. P., Heinke, C. O., Dubus, G., and Sivakoff, G. R. (2018). Strong disk winds traced throughout outbursts in black-hole X-ray binaries. Nature, 554(7690):69–72.
- Thomas et al., (2022) Thomas, J. K., Charles, P. A., Buckley, D. A. H., Kotze, M. M., Lasota, J.-P., Potter, S. B., Steiner, J. F., and Paice, J. A. (2022). Large optical modulations during 2018 outburst of MAXI J1820 + 070 reveal evolution of warped accretion disc through X-ray state change. MNRAS, 509(1):1062–1074.
- Townsend et al., (2017) Townsend, L. J., Kennea, J. A., Coe, M. J., McBride, V. A., Buckley, D. A. H., Evans, P. A., and Udalski, A. (2017). The 2016 super-Eddington outburst of SMC X-3: X-ray and optical properties and system parameters. MNRAS, 471(4):3878–3887.
- Tsygankov et al., (2017) Tsygankov, S. S., Doroshenko, V., Lutovinov, A. A., Mushtukov, A. A., and Poutanen, J. (2017). SMC X-3: the closest ultraluminous X-ray source powered by a neutron star with non-dipole magnetic field. A&A, 605:A39.
- van Paradijs, (1996) van Paradijs, J. (1996). On the Accretion Instability in Soft X-Ray Transients. ApJLett, 464:L139.
- van Paradijs and McClintock, (1994) van Paradijs, J. and McClintock, J. E. (1994). Absolute visual magnitudes of low-mass X-ray binaries. A&A, 290:133–136.
- Veledina et al., (2023) Veledina, A., Muleri, F., Poutanen, J., Podgorný, J., Dovčiak, M., Capitanio, F., Churazov, E., De Rosa, A., Di Marco, A., Forsblom, S., Kaaret, P., Krawczynski, H., La Monaca, F., Loktev, V., Lutovinov, A. A., Molkov, S. V., Mushtukov, A. A., Ratheesh, A., Rodriguez Cavero, N., Steiner, J. F., Sunyaev, R. A., Tsygankov, S. S., Zdziarski, A. A., Bianchi, S., Bright, J. S., Bursov, N., Costa, E., Egron, E., Garcia, J. A., Green, D. A., Gurwell, M., Ingram, A., Kajava, J. J. E., Kale, R., Kraus, A., Malyshev, D., Marin, F., Matt, G., McCollough, M., Mereminskiy, I. A., Nizhelsky, N., Piano, G., Pilia, M., Pittori, C., Rao, R., Righini, S., Soffitta, P., Shevchenko, A., Svoboda, J., Tombesi, F., Trushkin, S., Tsybulev, P., Ursini, F., Weisskopf, M. C., Wu, K., Agudo, I., Antonelli, L. A., Bachetti, M., Baldini, L., Baumgartner, W. H., Bellazzini, R., Bongiorno, S. D., Bonino, R., Brez, A., Bucciantini, N., Castellano, S., Cavazzuti, E., Chen, C.-T., Ciprini, S., Del Monte, E., Di Gesu, L., Di Lalla, N., Donnarumma, I., Doroshenko, V., Ehlert, S. R., Enoto, T., Evangelista, Y., Fabiani, S., Ferrazzoli, R., Gunji, S., Hayashida, K., Heyl, J., Iwakiri, W., Jorstad, S. G., Karas, V., Kislat, F., Kitaguchi, T., Kolodziejczak, J. J., Latronico, L., Liodakis, I., Maldera, S., Manfreda, A., Marinucci, A., Marscher, A. P., Marshall, H. L., Massaro, F., Mitsuishi, I., Mizuno, T., Negro, M., Ng, C.-Y., O’Dell, S. L., Omodei, N., Oppedisano, C., Papitto, A., Pavlov, G. G., Peirson, A. L., Perri, M., Pesce-Rollins, M., Petrucci, P.-O., Possenti, A., Puccetti, S., Ramsey, B. D., Rankin, J., Roberts, O., Romani, R. W., Sgrò, C., Slane, P., Spandre, G., Swartz, D., Tamagawa, T., Tavecchio, F., Taverna, R., Tawara, Y., Tennant, A. F., Thomas, N. E., Trois, A., Turolla, R., Vink, J., Xie, F., and Zane, S. (2023). Astronomical puzzle Cyg X-3 is a hidden Galactic ultraluminous X-ray source. arXiv e-prints, page arXiv:2303.01174.
- Viallet and Hameury, (2007) Viallet, M. and Hameury, J. M. (2007). Hydrodynamic simulations of irradiated secondaries in dwarf novae. A&A, 475(2):597–606.
- Vincent et al., (2021) Vincent, F. H., Wielgus, M., Abramowicz, M. A., Gourgoulhon, E., Lasota, J. P., Paumard, T., and Perrin, G. (2021). Geometric modeling of M87* as a Kerr black hole or a non-Kerr compact object. A&A, 646:A37.
- Vogt, (1983) Vogt, N. (1983). VW Hydri revisited : conclusions on dwarf nova outburst models. A&A, 118:95–101.
- Weng et al., (2017) Weng, S.-S., Ge, M.-Y., Zhao, H.-H., Wang, W., Zhang, S.-N., Bian, W.-H., and Yuan, Q.-R. (2017). Swift Observations of SMC X-3 during Its 2016-2017 Super-Eddington Outburst. ApJ, 843(1):69.
- Wiktorowicz et al., (2014) Wiktorowicz, G., Belczynski, K., and Maccarone, T. (2014). Black hole X-ray transients: The formation puzzle. In de Grijs, R., editor, Binary Systems, their Evolution and Environments, page 37.
- Wood et al., (1986) Wood, J., Horne, K., Berriman, G., Wade, R., O’Donoghue, D., and Warner, B. (1986). High-speed photometry of the dwarf nova Z Cha in quiescence. MNRAS, 219:629–655.
- Yang et al., (2023) Yang, Q., Green, P. J., MacLeod, C. L., Plotkin, R. M., Anderson, S. F., Bieryla, A., Civano, F., Eracleous, M., Graham, M., Ruan, J. J., Runnoe, J., and Zhao, X. (2023). Probing the Origin of Changing-look Quasar Transitions with Chandra. arXiv e-prints, page arXiv:2303.06733.
- Yungelson and Lasota, (2008) Yungelson, L. R. and Lasota, J. P. (2008). Evolutionary models of short-period soft X-ray transients: comparison with observations. A&A, 488(1):257–265.
- Yungelson et al., (2006) Yungelson, L. R., Lasota, J. P., Nelemans, G., Dubus, G., van den Heuvel, E. P. J., Dewi, J., and Portegies Zwart, S. (2006). The origin and fate of short-period low-mass black-hole binaries. A&A, 454(2):559–569.
- Zdziarski et al., (2022) Zdziarski, A. A., You, B., and Szanecki, M. (2022). Corrections to Estimated Accretion Disk Size due to Color Correction, Disk Truncation, and Disk Wind. ApJLett, 939(1):L2.
- Zel’dovich and Novikov, (1965) Zel’dovich, Y. B. and Novikov, I. D. (1965). Mass of Quasi-Stellar Objects. Soviet Physics Doklady, 9:834.
- Zemko et al., (2014) Zemko, P., Orio, M., Mukai, K., and Shugarov, S. (2014). X-ray observations of VY Scl-type nova-like binaries in the high and low state. MNRAS, 445(1):869–880.