Temporal Action Localization for
Inertial-based Human Activity Recognition
Abstract.
A persistent trend in Deep Learning has been the applicability of machine learning concepts to other areas than originally introduced for. As of today, state-of-the-art activity recognition from wearable sensors relies on classifiers being trained on fixed windows of data. Contrarily, video-based Human Activity Recognition has followed a segment-based prediction approach, localizing activity occurrences from start to end. This paper is the first to systematically demonstrate the applicability of state-of-the-art TAL models for wearable Human Activity Recongition (HAR) using raw inertial data as input. Our results show that state-of-the-art TAL models are able to outperform popular inertial models on 4 out of 6 wearable activity recognition benchmark datasets, with improvements ranging as much as in F1-score. Introducing the TAL community’s most popular metric to inertial-based HAR, namely mean Average Precision, our analysis shows that TAL models are able to produce more coherent segments along with an overall higher NULL-class accuracy across all datasets. Being the first to provide such an analysis, the TAL community offers an interesting new perspective to inertial-based HAR with yet to be explored design choices and training concepts, which could be of significant value for the inertial-based HAR community.
1. Introduction
The recognition of performed activities through wearable sensors such as IMUs has shown to be of significant value in areas such as health care or the support of complex work processes (Bulling et al., 2014). Deep Learning has established itself as the de facto standard in wearable, inertial-based Human Activity Recognition (HAR), consistently outperforming classical Machine Learning approaches in recognition performance. A persistent trend in Deep Learning has been the applicability of machine learning concepts such as self-attention (Vaswani et al., 2017) to other areas and application scenarios than originally introduced for. With significant progress having been made since the introduction of deep neural architectures such as the DeepConvLSTM (Ordóñez and Roggen, 2016), researchers have followed this trend and continuously worked on improving the architectural design of networks by incorporating newly introduced techniques (see e.g., (Zhou et al., 2022)).
A promising recent approach in video-based Human Activity Recognition (HAR) is Temporal Action Localization (TAL), which aims to locate activity segments, defined by a class label, start, and end point, within an untrimmed video. Even though introduced architectures have almost doubled in performance over the last 5 years on existing datasets like THUMOS-14 (Jiang et al., 2014), results on large corpora such as EPIC-KITCHENS-100 (Damen et al., 2022) and Ego4D (Grauman et al., 2022) show that the prediction problem is far from being saturated. Recently, Zhang et al. (2022b) introduced the ActionFormer, an end-to-end, single-stage TAL model utilizing transformer-based layers. Being the first of its kind, the ActionFormer along with extensions of it (Tang et al., 2023; Shi et al., 2023) are as of today holding top ranks in prediction performance on a multitude of TAL benchmark datasets. Despite sharing a mutual goal, the TAL community evaluates their approaches differently from the inertial community, using mean Average Precision (mAP) as opposed to traditional classification metrics like F1-score or accuracy. TAL models have recently been shown to be capable of being trained using raw inertial data (Bock et al., 2023), marking the first instance of such vision-based models being applied in the context of inertial-based HAR. When compared with popular inertial models, results on one particular dataset have already shown that TAL models can produce more coherent and less fragmented predictions while maintaining performance in terms of traditional classification metrics.
Setting out to further examine the applicability of Temporal Action Localization for inertial-based HAR, our contributions in this paper are three-fold:
-
(1)
We demonstrate the capabilities of a novel approach to inertial-based HAR, being single-stage TAL, to outperform popular inertial models on four out of six wearable activity recognition benchmark datasets.
-
(2)
Complementing traditional, frame-wise classification metrics, we introduce a set of unexplored, segment-based evaluation metrics for inertial-based HAR, which are based around the scalar evaluation metric mean Average Precision (Alwassel et al., 2018).
-
(3)
We name differences and similarities between models originating from both communities, highlighting applied concepts that TAL models use to produce coherent segments along with a high NULL-class accuracy.
2. Related Work
Inertial-based Human Activity Recognition
With on-body sensors providing a robust and non-intrusive way to monitor participants along long stretches of time, research conducted in the area of inertial-based HAR has worked towards the automatic interpretation of one or multiple sensor streams to reliably detect activities e.g. in the context of providing medical support or providing guidance during complex work processes (Bulling et al., 2014). With deep neural networks having established themselves as the de facto standard in inertial-based HAR, the DeepConvLSTM (Ordóñez and Roggen, 2016) as well as models introduced at a later point all follow a similar prediction scenario design applying a sliding window approach which groups concurrent data points for classification. In their original publication Ordóñez and Roggen (2016) have found a combination of convolutional and recurrent layers to produce competitive results, with the idea being to model temporal dependencies amongst automatically extracted discriminative features within a sliding window in order to classify it correctly as one of the activity classes or, if applicable, NULL-class. Building up on the idea of combining these two types of layers, researchers have worked on extending the original DeepConvLSTM or have introduced their own architectural designs (Murahari and Plötz, 2018; Vaizman et al., 2018; Peng et al., 2018; Xi et al., 2018; Xu et al., 2019; Xia et al., 2020; Liu et al., 2020; Chen et al., 2020; Bock et al., 2021; Abedin et al., 2021; Zhou et al., 2022; Zhang et al., 2022a; Miao et al., 2022; Chen et al., 2023b, a; Wieland and Pankratius, 2023). A simple modification of the DeepConvLSTM is the shallow DeepConvLSTM (Bock et al., 2021). Contradicting the popular belief that one needs at least two recurrent layers when dealing with time series data (Karpathy et al., 2015), Bock et al. (2021) demonstrated that removing the second LSTM layer within the original DeepConvLSTM architecture, results in significant increases in predictive performance on a multitude of HAR benchmark datasets while also decreasing the number of learnable parameters. Furthermore, with the original DeepConvLSTM only being able to learn temporal dependencies within a sliding window, the shallow DeepConvLSTM applies the LSTM across batches, effectively making the batches the sequence which is to be learned by the LSTM. This dimension-flip, along with a non-shuffled training dataset, enables the architecture to learn temporal dependencies amongst a batched input. The same year as the shallow DeepConvLSTM, Abedin et al. (2021) introduced Attend-and-Discriminate, a deep neural network architecture following the idea of the original DeepConvLSTM by combining both convolutional and recurrent layers, yet further adding a cross-channel interaction encoder using self-attention as well as attention mechanism to the recurrent parts of the network. In 2022 Zhou et al. (2022) proposed TinyHAR, a lightweight HAR model that uses a transformer encoder block along with means of cross-channel fusion via a fully connected layer and a final self-attention layer which aims to learn the contribution of each outputted time step produced by the recurrent parts individually.
Video-based Human Activity Recognition
Classifying videos in the context of Human Activity Recognition can broadly be categorized into three main application scenarios: Action Recognition, which aims to classify trimmed videos into one of activity classes; Action Anticipation, which aims to predict the next likely activities after observing a preceding video sequence; and Temporal Action Localization (TAL), which seeks to identify and locate all activity segments within an untrimmed video. With the inertial-based benchmark datasets consisting of a multitude of activities, TAL is to be considered most comparable to inertial-based HAR. Unlike popular intertial architectures though, TAL models aim to predict all segments within an untrimmed video at once. Existing TAL methods can broadly be categorized into two categories: two-stage and one-stage recognition systems. Two-stage recognition system (Lin et al., 2019, 2020; Xu et al., 2020; Bai et al., 2020; Zhao et al., 2020; Zeng et al., 2019; Gong et al., 2020; Liu et al., 2021; Qing et al., 2021; Sridhar et al., 2021; Zhu et al., 2021; Zhao et al., 2021; Tan et al., 2021) divide the process of identifying actions within an untrimmed video into two subtasks. First, during proposal generation, candidate segments are generated, which are then, during the second step, classified into one of activity classes and iteratively refined regarding their start and end times. Contrarily, single-stage models (Yang et al., 2023; Shi et al., 2022; Nag et al., 2022; Liu et al., 2022; Liu and Wang, 2020; Long et al., 2019; Lin et al., 2021; Chen et al., 2022; Zhang et al., 2022b; Tang et al., 2023; Shi et al., 2023) do not rely on activity proposals, directly aiming to localize segments along their class label and refined boundaries. In 2022 Zhang et al. (2022b) introduced the ActionFormer, a lightweight, single-stage TAL model which unlike previously introduced single-stage architectures does not rely on pre-defined anchor windows. In line with the success of transformers in other research fields, Zhang et al. (2022b) demonstrated their applicability for TAL, outperforming previously held benchmarks on several TAL datasets (Heilbron et al., 2015; Damen et al., 2022; Jiang et al., 2014) by a significant margin. Surprisingly, a year later the TemporalMaxer suggested removing transformer layers within the ActionFormer arguing feature embeddings are already discriminative enough (Tang et al., 2023). Though being more lightweight than the ActionFormer, the TemporalMaxer showed to outperform its precedent during benchmark analysis. Similar to the TemporalMaxer, Shi et al. (2023) introduced TriDet, which suggested altering the ActionFormer in two ways. First, to mitigate the risk of rank-loss, self-attention layers are replaced with SGP layers. Second, the regression head in the decoder is replaced with a Trident head, which improves imprecise boundary predictions via an estimated relative probability distribution around each timestamp’s activity boundaries.
3. Temporal Action Localization for Inertial-based HAR
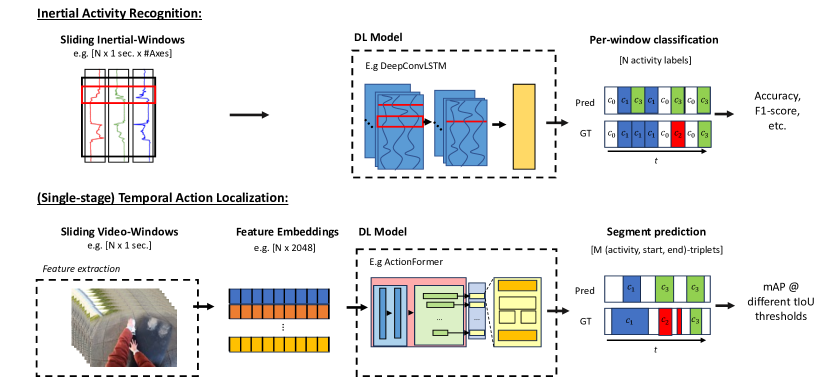
As the inertial-based HAR and TAL communities deal with inherently different modalities, both communities have developed distinct predictive pipelines and algorithms tailored to the challenges and characteristics of their respective modalities (see Figure 1). In the following section, we will provide detailed descriptions of the two different predictive pipelines and demonstrate how vision-based TAL models can be applied to a previously unexplored modality — inertial data. Furthermore, we provide a detailed overview of the architectural design of three popular single-stage TAL models (Zhang et al., 2022b; Tang et al., 2023; Shi et al., 2023) highlighting similarities as well as differences of the architectures compared to models originating from the inertial-based HAR community.
3.1. Inertial-based HAR vs. Temporal Action Localization
Problem definition
The objective of both inertial activity recognition and TAL is to predict all activities present in an untrimmed timeline. Given an input data stream of a sample participant, both the inertial and TAL communities start by applying a sliding window approach which shifts over , dividing the input data into windows, e.g. of one second duration with a 50% overlap between consecutive windows. This process results in being discretized into time steps, where is the number of windows for each participant. It is important to note that the TAL models do not use raw data as input, but are instead trained using feature embeddings extracted from each individual sliding video clip, which are extracted using pretrained methods such as (Carreira and Zisserman, 2017). That is, in the case of TAL, represents a one-dimensional feature embedding vector associated with the video clip at time step . In case of inertial-based activity recognition, represents a two-dimensional matrix of size , where is the number of samples within a window, and is the number of sensor axes present in the sensor data.
Given all sliding windows associated with an untrimmed sequence, inertial activity recognition models aim to predict an activity label for each sliding window , where belongs to a predefined set of activity labels, . To do so, the sliding windows are batched and fed through e.g. a deep neural network, such as the DeepConvLSTM (Ordóñez and Roggen, 2016). The resulting activity labels for each window are then compared to the true activity labels from the ground truth data, and classification metrics like accuracy or F1-score are calculated. Contrarily, TAL models aim to identify and localize segments of actions within the untrimmed data stream, which can span across multiple windows. To achieve this algorithms are trained to predict activity segments using a collection of feature embeddings as input, where varies across participants. Each activity instance is defined by its starting time (onset), ending time (offset) and its associated activity label , where , and .
Evaluation metrics
As predictive outcomes of inertial activity recognition and TAL differ, both communities have adopted different evaluation metrics. In case of the inertial community, the problem of recognizing activities is translated to a per-window classification problem, where each window represents an instance to be classified into one of classes. Therefore, most researchers assess their algorithms based on traditional classification measures, including recall (), precision (), and F1-score (). In order to calculate these activity-wise metrics one first needs to calculate activity-wise True Positives (TP), False Positives (FP), True Negatives (TN) and False Negatives (FN). For a given activity class , a predicted activity label is to be treated as:
-
•
TP of class (): the predicted and ground truth label are equal to
-
•
FP of class (): the predicted label is equal to , yet the ground truth is not
-
•
TN of class (): the predicted and ground truth label are not equal to
-
•
FN of class (): the predicted label is not equal to , yet the ground truth is
Calculating TP, FP, TN and FN counts of all activities then allows to calculate the per-class classification metrics, which are defined as:
| (1) |
| (2) |
| (3) |
To account for the continuous nature of activity recognition prediction streams, Ward et al. (2011) introduced additional performance metrics to explicitly measure misalignment within predictions made by inertial-based activity recognition systems. According to the authors, calculating classification metrics such as precision and recall based on window-wise errors does not provide intuitive insights about the overall fragmentation and merging behavior of the prediction stream. The authors propose to further divide the class-wise counts of FPs and FNs into additional sub-categories based on their relative position within a segmented predictive stream. These misalignment sub-categories are:
-
(1)
Underfill (): False Negatives of class that occur at the start or end of an activity segment, effectively making the predicted segment shorter by starting later or finishing earlier than the corresponding ground truth segment of .
-
(2)
Deletion (): False Negatives of class that correspond to a deleted event, i.e. a ground segment which is missed completely within the prediction stream.
-
(3)
Fragmenting (): False Negatives of class that occur in-between True Positive instances of class , falsely splitting a coherent segment into two segments.
-
(4)
Insertion (): False Positives of class that correspond to a non-existent ground truth segment.
-
(5)
Overfill (): False Positives of class that occur at the start or end of an activity segment, effectively making the predicted segment longer by predicting an earlier start or later finish than the corresponding ground truth segment.
-
(6)
Merge (): False Positives of class that occur between two ground truth segments incorrectly merging the two segments into one coherent segment.
Calculating these six misalignment , , , , and counts of all activities then allows calculating the per-class misalignment ratios, which are defined as:
| (4) |
| (5) |
| (6) |
| (7) |
| (8) |
| (9) |
Inspired by measures applied during object detection, the TAL community assess algorithms based mean Average Precision (mAP) performance applied at different temporal Intersection over Union (tIoU) thresholds. With a TAL model being trained to predict a set of activity segments , each predicted segment is compared with the ground truth activity segments within the complete input data stream of a participant. That is, given a predicted activity segment and a ground truth activity segment , the two segments are considered to be either TP, FP, TN or FN based on the condition that the temporal intersection over union (tIoU) (overlap of the two segments divided by the union of the two segments) is greater than a predefined threshold, e.g., 0.5. Mean Average Precision is then calculated as:
| (10) |
where represents the area under the curve of the Precision-Recall-Curve, which is obtained by plotting a model’s precision and recall values as a function of the model’s confidence score threshold for a given class . More specifically, the mAP score at a tIoU threshold of, for example, 0.2 (mAP@0.2), is calculated as the mAP score assuming a required tIoU of 0.2 when calculating , , and counts. Typically, to assess the predictive performance of TAL models, mAP is calculated using a range of tIoU thresholds, which are then averaged. In case of this benchmark analysis we calculate mAP as mAP@(0.3:0.1:07), which equates to calculating the mAP@0.3, mAP@0.4, mAP@0.5, mAP@0.6 and mAP@0.7 and averaging the individual scores.
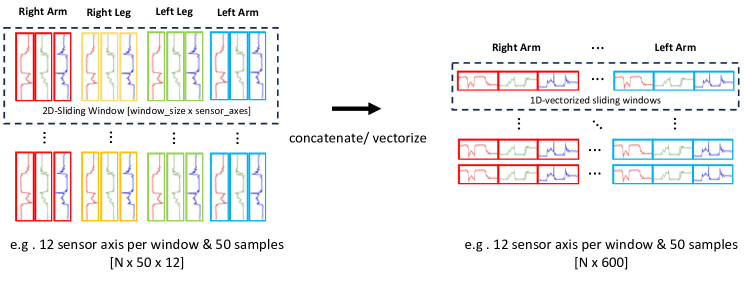
3.2. Vectorization of Inertial Data for TAL
As previously mentioned, the input data used to train TAL models is a collection of feature embeddings. These embeddings are, for instance, extracted using some pre-trained method applied on each video clip. The resulting embeddings are 1-dimensional feature vectors that summarize information such as RGB and optical flow of the video clip (see, for example, Carreira and Zisserman (2017)). Since both communities employ a sliding window approach but feed data to their models using different dimensions, Bock et al. (2023) proposed a simple, yet effective preprocessing step. This step converts the 2-dimensional, windowed inertial data, as used by inertial architectures, into a 1-dimensional feature embedding suitable for training TAL models. The preprocessing method as detailed in Figure 2 involves concatenating the different sensor axes of each window, converting the input data to be a collection of 1-dimensional feature embedding vectors where is the number of samples within a window, and is the number of sensor axes. More specifically, given a sliding window , we vectorize the two-dimensional matrix as follows:
| (11) |
3.3. Architectures Overview
In order to predict activity segments within an input video, the ActionFormer, TemporalMaxer and TriDet model all follow the same sequence labeling problem formulation for action localization. That is, given a set of feature input vectors , a model aims to classify each timestamp’s as either one of the activity categories or as background (NULL-class) and regress the distance towards the timestamp’s corresponding segment’s start and end point. More specifically, given the input vectors a model aims to learn to label the sequence as
| (12) |
, where at timestamp is defined by a probability vector indicating the class-wise probability of the timestamp being classified as one of the activity categories and and being the distance between the current timestamp and the current segment’s onset and offset. Note that and are not defined if the timestamp is to be classified as background. The sequence labeling formulation can then be easily decoded to activity segments as:
| (13) |
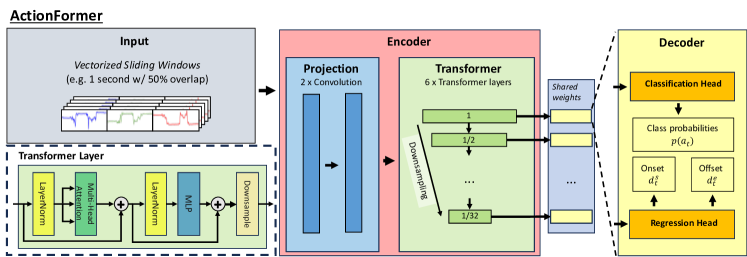
ActionFormer
Introduced in 2022, the ActionFormer was among the first single-stage, anchor-free TAL models which followed a transformer-based design (Zhang et al., 2022b). The architecture, depicted in Figure 3, follows an encoder-decoder structure that decomposes the previously defined task of learning to predict activity segments using a function as , where serves as the encoder and is the decoder. As the encoder Zhang et al. (2022b) employ a combination of convolutional layers and a transformer network. The convolutional layers, paired with ReLU activation functions, project each input feature vector into a -dimensional space. To limit complexity, each layer of the transformer network applies alternating layers of multi-head local self-attention and MLP. To capture information at different temporal scales, the transformer network is structured in such a way that across its layers, the initially embedded feature vector at timestamp is downsampled using a strided depthwise 1D-convolution.
After encoding the input sequence into a feature pyramid , which captures information at various temporal scales, the decoder decodes the feature pyramid into sequence labels . To do so, the decoder includes both a classification and regression head. The classification head, being 1D convolutional network complemented with layer normalization and ReLU activation, predicts for all pyramid levels the probability vector at each timestep . The regression head, following the same design, predicts the onset () and offset distance () at all pyramid levels for each timestamp . Note that for both the classification and regression heads, parameters are shared across pyramid levels and output regression ranges are pre-specified per pyramid level. Finally, to reduce overlapping instances and create a final set of predicted activity segments, the obtained predictions across all pyramid levels are postprocessed using Soft-NMS (Bodla et al., 2017).
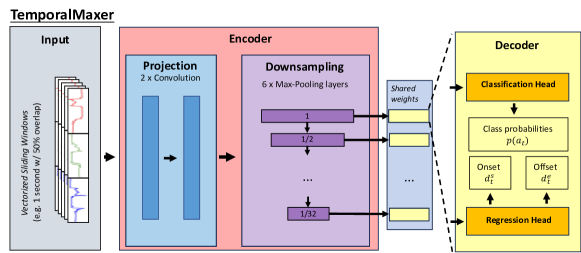
TemporalMaxer
Building upon the architectural design of the Actionformer (Zhang et al., 2022b), the TemporalMaxer proposed by Tang et al. (2023) suggests modifying the encoder of the ActionFormer to employ solely max pooling and remove any multi-head attention layers (see Figure 4). According to the authors, the removal of the transformer-based layers does not come at the cost of a lost in information, as the extracted feature embeddings outputted by the projection layer are already discriminative enough to achieve state-of-the-art predictive performance. Same as the ActionFormer, the weights of both the classification and regression heads within the TemporalMaxer are shared across pyramid levels, output regression ranges are pre-specified per pyramid level, and to create a final set of predicted activity segments, obtained predictions across all pyramid levels are postprocessed using Soft-NMS (Bodla et al., 2017).
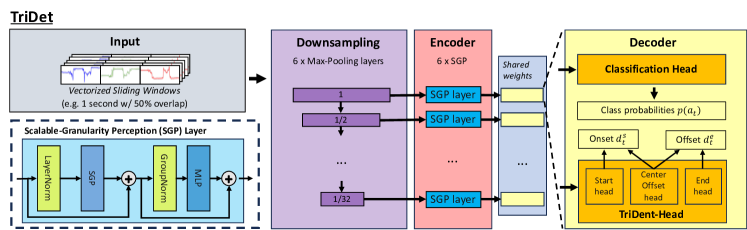
TriDet
Similar to the TemporalMaxer, the TriDet model (see Figure 5) suggested to make modifications to the architectural design of the ActionFormer by altering both the encoder and regression head decoder (Shi et al., 2023). The authors claim that a transformer-based encoder is prone to suffer from rank loss while simultaneously being high in computational complexity. Consequently, Shi et al. (2023) propose replacing the projection and transformer network of the ActionFormer with Scalable-Granularity Perception (SGP) layers. These layers, being fully-convolutional, comprise of two branches: an instant-level branch, which increases the discriminability between the activity classes and the NULL-class, and a window-level branch, aiming to capture semantic context from a wider receptive field. Mathematically, the SGP operator replacing the mulit-head attention operator is defined as:
| (14) |
, where are fully-connected, are 1D-depth-wise convolutional layers over the window size and is a scalable factor controlling the granularity of captured temporal information. In the TriDet model, the layers of the feature pyramid are thus defined as first downsampling the input feature embeddings times and applying a SGP layer to each downsampled embedding. According to the authors, the ActionFormer architecture suffers from imprecise boundary predictions. To address this, the original regression head is replaced by a Trident-head, which aims to overcome the ActionFormer’s shortcomings via an estimated relative probability distribution around each activity boundary. The Trident-head consists of three main components: a start head, responsible for locating the start of an activity segment; an end head, responsible locating the end of an activity segment; and a center-offset head, responsible for locating the center of an activity segment. Using these three heads, the Trident-head predicts the start () and end boundary () for all pyramid levels for each timestamp . Note that all heads, including the classification head, are modelled as three 1D-convolutional layers with parameters shared across all feature pyramid levels.
3.4. Similarities and Differences between Inertial and TAL Models
Similar to inertial models, the ActionFormer, TemporalMaxer and TriDet model aim to learn temporal dependencies by learning discriminative feature embeddings. Nevertheless, do the authors accredit much of their models’ performance to the constructed multi-layer feature pyramid. As described above, the feature pyramid within each of the three models downsamples the input embedding multiple times in order to create embedding vectors of different temporal granularity. Though this is similar to downsampling performed by concatenating multiple convolution layers without padding, as demonstrated by all inertial architectures in this benchmark analysis, the TAL models use each embedding vector separately instead of only using the resulting embedding vector of the last pyramid layer. More specifically, the authors claim that predicting timestamps at different degrees of temporal granularity holds significant value and is essential in order to correctly predict different types and lengths of activities. Furthermore, as already detailed in previous chapters, the TAL community aims to localize segments rather than provide window-wise predictions. Due to their objective thus differing from that of the inertial community, TAL models are trained not only on a classification loss, but also a regression loss, which optimizes each timestamps corresponding activity onset and offset. Lastly, the use of self-attention based layers has shown to improve results in both communities, yet variations of the ActionFormer show that these layers are not necessarily needed. More specifically, the use of fully-convolutional SGP layers in the TriDet model show that, rather than the type of technique being important, focus needs to be put specifically learning both local and global temporal information for each timestamp.
4. Methodology
4.1. Datasets
We evaluate each algorithm featured in this benchmark analysis using 6 popular HAR datasets, namely the Opportunity (Roggen et al., 2010), SBHAR (Reyes-Ortiz et al., 2016), Wetlab (Scholl et al., 2015), WEAR (Bock et al., 2023), Hang-Time (Hoelzemann et al., 2023) and RWHAR dataset (Sztyler and Stuckenschmidt, 2016). The datasets, all covering different application and recording scenarios, provide us with a challenging set of prediction problems to properly assess the strengths and weaknesses of each model. Table 1 summarizes the key characteristics of each dataset. In addition to vital information such as participant count, activity count, and sensor axes count, the table also includes details on the type of activities found in each dataset. We classify activities into four types: (1) periodic activities, characterized by recurring periodic patterns; (2) non-periodical activities consisting of non-occurring, non-periodical patterns; and (3) complex activities, defined by an arbitrary sequence of non-periodic and periodic activities. Lastly, following the works of Alwassel et al. (2018), we provide average count of segments across all subjects, categorizing each segment within each dataset into five bins: XS: (0 seconds, 3 seconds], S: (3 seconds, 6 seconds], M: (6 seconds, 12 seconds], L: (12 seconds, 18 seconds], and XL: more than 18 seconds.
| Dataset | #Sbjs | #Cls | #Axes | #Segments (Alwassel et al., 2018) | Type of Activities | ||||
|---|---|---|---|---|---|---|---|---|---|
| XS | S | M | L | XL | |||||
| Opportunity (Roggen et al., 2010) | 4 | 17(+1) | 113 | non-periodic, complex | |||||
| SBHAR (Reyes-Ortiz et al., 2016) | 30 | 12(+1) | 3 | periodic, non-periodic | |||||
| Wetlab (Scholl et al., 2015) | 22 | 8(+1) | 3 | complex | |||||
| WEAR (Bock et al., 2023) | 18 | 18(+1) | 12 | periodic | |||||
| Hang-Time (Hoelzemann et al., 2023) | 24 | 5(+1) | 3 | non-periodic, periodic, complex | |||||
| RWHAR (Sztyler and Stuckenschmidt, 2016) | 15 | 8 | 21 | periodic | |||||
Opportunity
Introduced by Roggen et al. (2010) in 2010, the Opportunity dataset features a sensor-rich recording scenario of four participants performing various activities of daily living. As part of this benchmark analysis we chose to use only the sensor subset associated with the Opportunity challenge Chavarriaga et al. (2013), which consists of 113 sensor axes from IMU and accelerometer body-worn sensors, all sampling at 30Hz. The Opportunity challenge provides two prediction scenarios, i.e. types of annotations, that is modes of locomotion and gestures. For the benchmark analysis presented in this paper, we focus on the latter, which involves predicting 17 types of activities. The Opportunity dataset was recorded under laboratory-like conditions having each participant take part in six different recording sessions. There were two types of sessions: ADL sessions, repeated 5 times, in which participants followed a higher-level protocol and were allowed to interleave activities, and Drill sessions, repeated once, in which participants performed a sequence of activities 20 times. Breaks were included in all recording sessions, resulting in a substantial NULL-class being part of the dataset.
SBHAR
Comprising of 30 participants performing six activities of daily living, the SBHAR dataset augments the base locomotion activities with annotated transitional activities, representing transition periods between two base activities (Reyes-Ortiz et al., 2016). The dataset itself consists of uninterrupted 3D-accelerometer data sampled at 50 Hz, which was captured by a smartphone attached to the waist of each participant. Similar as the Opportunity dataset, the SBHAR dataset was also recorded under laboratory-like conditions, with participants following an experimental protocol that defined repetition count, order and execution length of each activity.
Wetlab
Published by Scholl et al. (2015), the Wetlab dataset provides 3D-accelerometer data from 22 participants. A single inertial sensor, placed in a fixed orientation on the dominant wrist of each participant, captured data at a constant sampling rate of 50Hz. The recording of the dataset took place in a wetlab environment in which each participant performed two DNA extraction experiments. Participants were allowed to take as much time as needed for each experiment. However, following an experimental wetlab protocol, recordings of different participants contain almost identical sequences of consecutive activities. Nevertheless, since not all steps in the experimental protocol were mandatory, some activities were skipped by certain participants. The provided annotated activity streams are two-fold, with one set indicating the steps within the recording protocol and the other representing the recurring base activities, such as peeling, pestling, and cutting. During our benchmark analysis the latter will be used, being the 8 base activities (+ the NULL-class), as it is most comparable to the prediction scenarios present in the other benchmark datasets used.
WEAR
Published by Bock et al. (2023) in 2023, WEAR consists of 3D-accelerometer and egocentric video data from 18 participants performing 18 workout sports activities at 10 outdoor locations. These activities include running-, stretching- and strength-based exercises, with base activities like push-ups being complemented with complex variations that alter and/ or extend the performed movement during the exercise. The 18 activities were divided across multiple recording sessions, with each session consisting of uninterrupted data streams of all modalities, i.e. including a NULL-class. Although participants were assigned a fixed set of workout activities and instructed to perform each activity for approximately 90 seconds, each participant had the freedom to choose the order of activities and take breaks as desired. During each workout session, four inertial sensors all sampling at 50Hz were placed on both left and right wrists and ankles.
Hang-Time
Published by Hoelzemann et al. (2023), Hang-Time features uninterrupted data streams of 24 participants during a basketball practice. The 3D-accelerometer data of each participant was sampled using a smartwatch worn on each participant’s right wrist. Although the dataset provides both locomotion and basketball-related activity labels across three different types of sessions (drills, warm-up and game), we intentionally exclude the locomotion activities during our benchmark analysis, replacing them with a NULL-class label. In the drill sessions, participants followed a strict experimental protocol with predefined activity durations and sequences. In contrast, the warm-up and game sessions allowed participants to commence activities at their discretion in a more real-world recording scenario.
RWHAR
Consisting of 15 participants performing a set of 8 different locomotion activities, the RWHAR dataset (Sztyler and Stuckenschmidt, 2016) was recorded at in-the-wild locations. Unlike the other datasets featured in this benchmark analysis, the RWHAR dataset does not contain a NULL-class, as recordings were trimmed to only contain the activities of relevancy, cutting out the breaks in-between. Except for jumping, each activity was performed the same amount of time, i.e. around 15 minutes. Participants wore a total of 6 body-worn sensors, all set to sample at 50Hz. During this benchmark analysis, we will only be using the 3D-accelerometer and 3D-gyroscope data provided to make modalities comparable to that of the other datasets.
4.2. Training Pipeline
All experiments were initiated employing a Leave-One-Subject-Out cross-validation. This type of validation involves iteratively training on all but one participant’s data and using the hold-out participant’s data during validation until all participants have been evaluated, ensuring that each network architecture is assessed based on its capabilities to generalize across unseen participants. All datasets were windowed using a sliding window of one second with a 50% overlap across windows. For all inertial architectures (Ordóñez and Roggen, 2016; Bock et al., 2021; Abedin et al., 2021; Zhou et al., 2022) we employed a similar optimization as proposed with the release of the shallow DeepConvLSTM, namely an Adam optimizer paired with a learning rate of , a weight decay of , and Glorot weight initialization (Glorot and Bengio, 2010). To allow each model to converge more properly, we increase the number of epochs to 100 and employ a step-wise learning-rate schedule that multiplies the learning rate by a factor of 0.9 after every 10 epochs. For all architectures, we fixed the hidden dimension of the recurrent layers to employ 128 units and scaled kernel sizes of the convolutional filters according to the relative difference in sampling rate among the different input datasets. In line with how the Attend-and-Discriminate architecture was first introduced, we optimized said architecture using center-loss (Wen et al., 2016) as opposed to a weighted cross-entropy loss, which was used during training of all other inertial architectures. Lastly, as proposed by the authors, we do not shuffle batches during the training of the shallow DeepConvLSTM.
For all three TAL architectures (Zhang et al., 2022b; Tang et al., 2023; Shi et al., 2023) part of this benchmark analysis, we chose to employ hyperparameters reported by the authors that produced best results on the EPIC-KITCHENS dataset (Damen et al., 2022). The hyperparamenters, though optimized for a different modality than inertial data (egocentric videos), have shown to produce competitive results on the WEAR dataset (Bock et al., 2023) and are thus considered a good starting point for evaluating the applicability of the three architectures on other HAR datasets. Nevertheless, given the small size of the tested inertial datasets compared to datasets used by the TAL community, we chose to increase the amount of epochs to 100 throughout all TAL-based experiments. As TAL models are designed to predict both a regression (boundary prediction) and classification target (segment label), loss calculation of the ActionFormer, TemporalMaxer and TriDet models are performed as a weighted combination of a regression loss (IoU loss (Rezatofighi et al., 2019)) and classification loss (focal loss (Li et al., 2020)). The latter, originates from the object detection community, which, like HAR, often times suffers from the background class dominating the class distribution. Furthermore, as we treat each subject’s data as a continuous data stream, we apply the TAL models to predict each subject’s data as a whole. With the input sequences thus being of arbitrary length, the ActionFormer, TemporalMaxer and TriDet model limit their complexity by randomly truncating the input sequence to not exceed a maximum sequence length during training. Furthermore, center sampling is employed when training the three TAL models. This technique makes it such that only time steps within an interval around a segment’s center are to be considered positive, while all other parts are considered negative. Within the TAL community, center sampling has shown to encourage higher scores around activity centers and overall improve results (Tian et al., 2022; Zhang et al., 2020).
As inertial models are tasked to predict on a per-window basis and, in most cases, are trained using shuffled data, the architectures suffer from producing only small coherent segments. Caused by frequently occuring activity switches, the fragmentation ultimately leads to significantly lower mAP scores being produced by the inertial architectures as opposed to the TAL models. Therefore, to remove only short lasting switches, predictions of inertial-based architectures mentioned in this paper were smoothed using a majority-vote filter. The exact size of the majority filter was chosen dataset-specific, being, for example, 15 seconds in the case of the WEAR dataset. Similar to the inertial models, the TAL architectures are tasked to predict class probabilities and segment boundaries of each windowed timestamp. Consequently, without applying any confidence threshold, all predicted activity segments are considered during creation of the prediction timeline causing accuracy of the NULL-class to be significantly low. Therefore, to alleviate this, we apply an optimized confidence threshold on predicted segments of all TAL models. Similarly to the majority filter, the score threshold for each architecture was chosen dataset-specific, being, for instance, 0.2 in the case of the WEAR dataset. This eliminates low scoring segments and substantially lowers the confusion of the NULL-class with the other activities.
5. Results
As part of our experimental evaluation, we provide traditional classification metrics (precision, recall and F1-score), misalignment measures as defined by Ward et al. (2006) and mAP averaged across tIoU thresholds 0.3, 0.4, 0.5, 0.6 and 0.7. All results are the unweighted average across all subjects along the LOSO validation. Experiments were repeated three times employing three different random seeds (1, 2 and 3). Classification metrics are calculated on a per-sample basis as the segmented output of the TAL models and windowed output of the inertial-models need to be translated to a common time granularity. To ensure readability of this work, visualization of the per-class analysis will only include confusion matrices of the SBHAR and RWHAR datasets, as we deemed these two datasets to be the most representative in illustrating the strengths and weaknesses of the TAL architectures when applied to inertial data. Please note that the confusion matrices of the other datasets can be found in the supplementary material. Furthermore, all created plots part of a performed DETAD analysis (Alwassel et al., 2018) on each dataset can be found in our repository.
Per-Dataset Results
Table 2 provides average results of the seven tested architectures across each dataset. One can see that the TAL architectures outperform the inertial architectures across all datasets regarding average mAP. This shows that by being trained to specifically optimize activity boundaries, the different prediction target has resulted in overall more coherent segments which overlap to a larger degree with the ground truth segments. Even though prediction results of the inertial architectures were further smoothed by a majority filter, average mAP is, except for the WEAR dataset, more than halved when compared to that of the TAL architectures. Regarding traditional classification metrics the TAL architectures are able to outperform inertial architectures for four out of six datasets with only the RWHAR (Sztyler and Stuckenschmidt, 2016) and WEAR dataset (Bock et al., 2023) being the exception. These improvements range between for the Opportunity and Wetlab dataset, for the Hang-Time and even as much as 25% in F1-score for the SBHAR dataset. Calculated misalignment ratios show that both inertial and TAL architectures have a similar distribution of errors, with architectures producing better overall classification results also showing overall lower misalignment measures. Only for the RWHAR dataset one can see that TAL architectures show a significantly higher Overfill-Ratio. This might be due to the RWHAR dataset not featuring a NULL-class, which introduces an uncommon prediction scenario for the TAL architectures. Nevertheless, the performed DETAD analysis (Alwassel et al., 2018), which further differentiates amongst the segment-based errors, reveals that inertial architectures suffer more severely from background errors, i.e. confusing activities with the NULL-class. While this effect is decreased for the shallow DeepConvLSTM, TAL architectures show to be able to more reliably differentiate between activities and the NULL-class, and thus more reliably localize activities within the untrimmed sequences.
| Model | P () | R () | F1 () | UR () | OR () | DR () | IR () | FR () | MR () | mAP () | |
|---|---|---|---|---|---|---|---|---|---|---|---|
| Opportunity | DeepConvLSTM | 50.22 | 33.88 | 34.41 | 0.30 | 17.29 | 0.78 | 31.26 | 0.01 | 0.23 | 13.97 |
| Shallow D. | 42.08 | 27.18 | 26.46 | 0.24 | 14.28 | 0.97 | 35.06 | 0.01 | 0.15 | 10.61 | |
| A-and-D | 35.25 | 48.55 | 36.35 | 0.32 | 15.28 | 0.45 | 52.55 | 0.02 | 0.35 | 13.75 | |
| TinyHAR | 48.09 | 54.27 | 47.09 | 0.34 | 19.99 | 0.39 | 34.01 | 0.02 | 0.46 | 19.78 | |
| ActionFormer | 54.63 | 58.78 | 51.93 | 0.19 | 13.34 | 0.41 | 33.82 | 0.01 | 0.42 | 51.24 | |
| TemporalMaxer | 44.44 | 55.63 | 44.74 | 0.21 | 14.13 | 0.40 | 43.78 | 0.01 | 0.55 | 46.31 | |
| TriDet | 48.72 | 57.69 | 48.79 | 0.23 | 13.20 | 0.39 | 40.07 | 0.01 | 0.58 | 49.70 | |
| SBHAR | DeepConvLSTM | 67.54 | 63.72 | 62.31 | 0.41 | 7.19 | 0.59 | 21.44 | 0.07 | 0.10 | 49.60 |
| Shallow D. | 72.98 | 75.41 | 71.13 | 0.60 | 10.19 | 0.46 | 14.23 | 0.02 | 0.09 | 65.15 | |
| A-and-D | 68.64 | 71.07 | 66.49 | 0.31 | 9.47 | 0.45 | 21.71 | 0.05 | 0.11 | 55.79 | |
| TinyHAR | 58.91 | 63.70 | 56.29 | 0.31 | 8.16 | 0.54 | 31.67 | 0.05 | 0.13 | 45.38 | |
| ActionFormer | 87.02 | 84.37 | 84.43 | 0.36 | 5.41 | 0.16 | 5.09 | 0.00 | 0.20 | 95.46 | |
| TemporalMaxer | 86.52 | 83.37 | 83.66 | 0.41 | 6.02 | 0.19 | 4.41 | 0.00 | 0.24 | 94.39 | |
| TriDet | 88.95 | 86.15 | 86.45 | 0.38 | 5.41 | 0.12 | 3.95 | 0.01 | 0.29 | 94.75 | |
| Wetlab | DeepConvLSTM | 38.65 | 47.34 | 37.87 | 0.51 | 7.13 | 0.69 | 48.53 | 0.21 | 0.64 | 11.88 |
| Shallow D. | 39.01 | 35.42 | 34.42 | 0.51 | 9.52 | 1.57 | 34.51 | 0.06 | 0.43 | 15.40 | |
| A-and-D | 37.75 | 55.71 | 37.49 | 0.56 | 9.69 | 0.63 | 57.60 | 0.16 | 0.57 | 12.27 | |
| TinyHAR | 34.31 | 50.84 | 31.48 | 0.61 | 8.41 | 1.00 | 61.26 | 0.11 | 0.59 | 10.05 | |
| ActionFormer | 40.71 | 49.25 | 40.71 | 0.56 | 9.41 | 0.79 | 52.44 | 0.07 | 0.79 | 33.53 | |
| TemporalMaxer | 50.43 | 36.65 | 37.09 | 0.59 | 9.37 | 0.83 | 53.59 | 0.10 | 0.61 | 35.72 | |
| TriDet | 44.13 | 49.15 | 42.85 | 0.58 | 8.85 | 0.75 | 48.63 | 0.10 | 0.84 | 34.05 | |
| WEAR | DeepConvLSTM | 80.68 | 76.25 | 75.78 | 0.28 | 2.35 | 0.52 | 6.68 | 0.11 | 0.32 | 61.03 |
| Shallow D. | 80.78 | 78.91 | 77.71 | 0.27 | 3.23 | 0.50 | 5.21 | 0.04 | 0.43 | 67.89 | |
| A-and-D | 82.34 | 83.29 | 80.61 | 0.20 | 4.03 | 0.33 | 7.18 | 0.09 | 0.52 | 64.78 | |
| TinyHAR | 81.87 | 84.23 | 80.56 | 0.21 | 4.77 | 0.27 | 9.54 | 0.10 | 0.55 | 63.33 | |
| ActionFormer | 71.88 | 76.70 | 72.43 | 0.22 | 6.48 | 0.65 | 7.12 | 0.01 | 2.06 | 73.80 | |
| TemporalMaxer | 69.54 | 72.80 | 69.52 | 0.23 | 6.87 | 0.83 | 5.50 | 0.01 | 1.50 | 69.18 | |
| TriDet | 73.57 | 77.54 | 73.18 | 0.28 | 4.79 | 0.64 | 6.21 | 0.03 | 1.64 | 77.12 | |
| Hang-Time | DeepConvLSTM | 44.13 | 33.95 | 35.25 | 0.28 | 10.60 | 0.88 | 20.16 | 0.27 | 1.46 | 5.44 |
| Shallow D. | 37.97 | 38.19 | 36.85 | 0.35 | 14.00 | 1.07 | 36.38 | 0.21 | 2.33 | 5.00 | |
| A-and-D | 40.54 | 43.32 | 40.39 | 0.35 | 14.14 | 0.72 | 34.81 | 0.30 | 1.44 | 6.73 | |
| TinyHAR | 37.09 | 41.13 | 36.89 | 0.41 | 11.59 | 0.75 | 42.90 | 0.43 | 1.26 | 4.73 | |
| ActionFormer | 49.19 | 57.57 | 51.23 | 0.62 | 11.63 | 0.51 | 47.65 | 0.48 | 0.64 | 29.26 | |
| TemporalMaxer | 45.01 | 54.56 | 47.17 | 0.71 | 10.97 | 0.45 | 52.71 | 1.13 | 0.65 | 27.86 | |
| TriDet | 49.59 | 55.14 | 50.67 | 0.73 | 9.85 | 0.52 | 48.55 | 0.69 | 0.62 | 29.24 | |
| RWHAR | DeepConvLSTM | 79.05 | 81.93 | 77.56 | 0.65 | 2.05 | 1.09 | 13.63 | 1.07 | 0.00 | 0.11 |
| Shallow D. | 88.59 | 89.01 | 86.85 | 0.31 | 1.14 | 0.38 | 6.93 | 0.98 | 0.00 | 0.00 | |
| A-and-D | 79.46 | 82.68 | 78.09 | 0.66 | 2.31 | 1.17 | 11.28 | 0.84 | 0.00 | 0.04 | |
| TinyHAR | 83.59 | 86.25 | 82.62 | 0.53 | 1.14 | 0.76 | 11.65 | 0.89 | 0.00 | 0.02 | |
| ActionFormer | 63.76 | 67.64 | 61.24 | 2.48 | 11.12 | 2.06 | 11.23 | 0.09 | 0.00 | 65.40 | |
| TemporalMaxer | 63.20 | 67.60 | 60.59 | 2.59 | 11.95 | 1.81 | 13.96 | 0.36 | 0.05 | 50.60 | |
| TriDet | 69.27 | 73.04 | 67.86 | 1.48 | 6.88 | 2.03 | 10.24 | 0.23 | 0.00 | 69.98 |
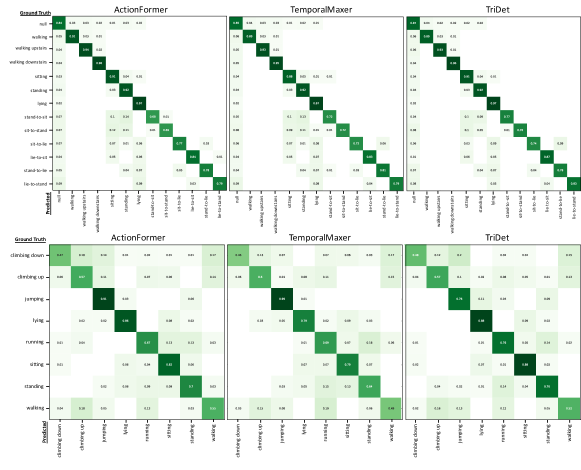
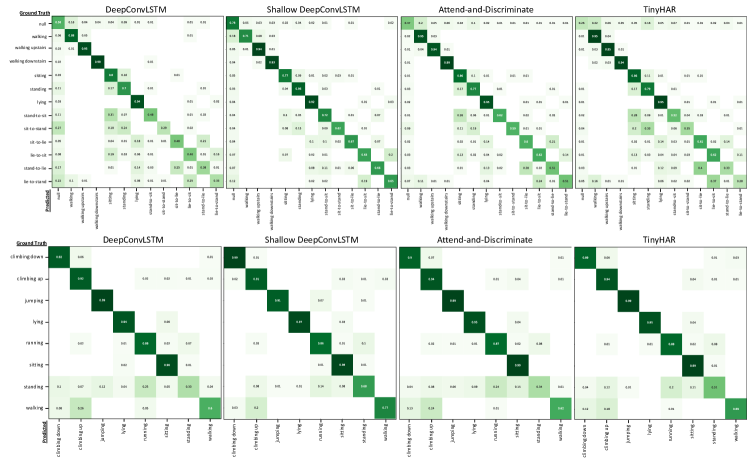
Per-Class Results
Figures 6 and 7 show the confusion matrices of the TAL and inertial architectures obtained on the SBHAR and RWHAR datasets. With the improvements on the SBHAR being the largest across all datasets, one can see that this increase can be attributed to improved performance on transitional, non-periodic classes like sit-to-stand. These activities are mostly recognisable by their context and surrounding activities and are thus particularly challenging to predict for models that do not rely on temporal dependencies spanning multiple seconds. Since the DeepConvLSTM, Attend-and-Discriminate and TinyHAR models are being trained on shuffled training data and have recurrent parts applied on within-window sequences, the three architectures cannot learn to predict these activities based on surrounding context. Among inertial models, only the shallow DeepConvLSTM is able to more reliably predict these context-based classes as it is trained on unshuffeled data and applies a dimensional flip when training the LSTM. Across all datasets part of this benchmark analysis, the RWHAR dataset yields the least performant results for the TAL architectures. We accredit this primarily due to the absence of a NULL-class in the dataset, which introduces a uncommon prediction scenario for the models. Furthermore, the RWHAR consists of the least amount of segments per subject, limiting the amount of training segments which can be used to optimize the TAL models. Results on the RWHAR dataset are nevertheless surprising as the TAL models show confusion among classes which they do not struggle to predict in other datasets (e.g., lying in the SBHAR dataset) as well as classes that are not similar to each other (e.g., lying and jumping). The obtained results raise the question of whether TAL models are primarily suited for being applied on untrimmed sequences, which (1) include breaks and/ or (2) provide a larger amount of segments than the RWHAR dataset.
Nevertheless, apart from the RWHAR dataset, the TAL models deliver the most consistent results across all classes. Even though, in most cases, the individual per-class accuracies are not the highest when compared to results obtained using the inertial architectures, the inertial architectures are frequently not able to predict all classes reliably, with at least one class showing low prediction accuracy. This is especially evident when examining the results obtained on the Hang-Time and Opportunity datasets, where TAL models are capable of correctly predicting challenging non-periodic activities such as rebounds, passes, opening door and closing door. Furthermore, as also seen in the DETAD analysis, TAL models are overall more capable of differentiating activities from the NULL-class, showing the highest NULL-class accuracy across all datasets. To summarize, the TAL architectures are more reliable in recognizing any kind of actions within an untrimmed sequence, and are less prone to predict fragmented prediction streams or non-existent breaks.
6. Discussion & Conclusion
This article demonstrated the applicability of vision-based, single-stage Temporal Action Localization for inertial-based Human Activity Recognition. We showed that three state-of-the-art TAL models (Zhang et al., 2022b; Tang et al., 2023; Shi et al., 2023) can be applied in a plain fashion to raw inertial data and achieve competitive results on six popular inertial HAR datasets (Roggen et al., 2010; Reyes-Ortiz et al., 2016; Scholl et al., 2015; Sztyler and Stuckenschmidt, 2016; Hoelzemann et al., 2023; Bock et al., 2023), outperforming in most cases popular models from the inertial community by a significant margin. A previously unexplored metric in inertial-based HAR, mean Average Precision (mAP), reveals that TAL models predict less fragmented timelines compared to inertial models and overall achieve larger degrees of overlap with ground truth segments. Furthermore, TAL models show to predict even non-periodic and complex activities more reliably than inertial architectures, providing consistent results across all types of classes across all datasets. Being one of the key challenges in HAR (Bulling et al., 2014), the TAL architectures further show to be less affected by the unbalanced nature of HAR datasets due to a large NULL-class. Across the five benchmark datasets which offered a NULL-class, the TAL architectures showed to deliver the highest NULL-class accuracy.
Within the past years inertial-based HAR has been working on improving upon methods to model temporal relationships, such as using Transformers as opposed to LSTMs to handle longer sequences (Zhou et al., 2022). Nevertheless, as also evident from this benchmark analysis, the way these mechanisms are used in popular inertial models does not give them the capability to learn temporal context beyond the current timestamp which is to be predicted (Pellatt and Roggen, 2020). This causes predicted timelines to suffer from frequent activity switches. Even though researchers have suggested new metrics (Ward et al., 2011), traditional classification metrics remain the focus of analyses within the inertial community. These metrics, though providing a good intuition about the overall recognition performance, do not provide any insight about the degree of fragmentation of the predicted timeline. With researchers such as Pellatt and Roggen (2020) and Guan and Plötz (2017) having worked on implementing improved training strategies, inertial architectures by default still lack to incorporate context-aware information into their models. Nevertheless, results obtained using the shallow DeepConvLSTM demonstrate that inertial models can be set to learn temporal context, yet require more segment-based optimization to be comparable to TAL architectures as far as average mAP scores.
To summarize, the way TAL architectures are trained does not allow them to be applied in an online fashion. Furthermore, comparing learnable parameters of TAL and inertial models, the former is substantially larger and thus is not suited to be deployed on edge devices. Nevertheless, the retrospective analysis of a fully-captured timeline performed by the TAL community along with fast training times even on large sequences offers an interesting new perspective to inertial-based HAR. Results show that these types of models are leveraging context-based information and are able to outperform popular inertial models on a variety of datasets. Even though models of the two independent communities are sharing similarities, the TAL community offers many unexplored design choices and training concepts, which should be considered to be investigated by the inertial-based HAR community.
References
- (1)
- Abedin et al. (2021) Alireza Abedin, Mahsa Ehsanpour, Qinfeng Shi, Hamid Rezatofighi, and Damith C. Ranasinghe. 2021. Attend and discriminate: Beyond the state-of-the-art for human activity recognition using wearable sensors. ACM on Interactive, Mobile, Wearable and Ubiquitous Technologies 5, 1 (2021), 1–22. https://doi.org/10.1145/3448083
- Alwassel et al. (2018) Humam Alwassel, Fabian Caba Heilbron, Victor Escorcia, and Bernard Ghanem. 2018. Diagnosing error in temporal action detectors. In European Conference on Computer Vision. https://doi.org/10.1007/978-3-030-01219-9_16
- Bai et al. (2020) Yueran Bai, Yingying Wang, Yunhai Tong, Yang Yang, Qiyue Liu, and Junhui Liu. 2020. Boundary content graph neural network for temporal action proposal generation. In European Conference on Computer Vision. https://doi.org/10.1007/978-3-030-58604-1_8
- Bock et al. (2021) Marius Bock, Alexander Hoelzemann, Michael Moeller, and Kristof Van Laerhoven. 2021. Improving Deep Learning for HAR with Shallow LSTMs. In ACM International Symposium on Wearable Computers. https://doi.org/10.1145/3460421.3480419
- Bock et al. (2023) Marius Bock, Hilde Kuehne, Kristof Van Laerhoven, and Michael Moeller. 2023. WEAR: An outdoor sports dataset for wearable and egocentric activity recognition. CoRR abs/2304.05088 (2023). https://arxiv.org/abs/2304.05088
- Bodla et al. (2017) Navaneeth Bodla, Bharat Singh, Rama Chellappa, and Larry S. Davis. 2017. Soft-NMS – improving object detection with one line of code. In IEEE International Conference on Computer Vision. https://doi.org/10.1109/iccv.2017.593
- Bulling et al. (2014) Andreas Bulling, Ulf Blanke, and Bernt Schiele. 2014. A tutorial on human activity recognition using body-worn inertial sensors. Comput. Surveys 46, 3 (2014), 1–33. https://doi.org/10.1145/2499621
- Carreira and Zisserman (2017) Joao Carreira and Andrew Zisserman. 2017. Quo vadis, action recognition? A new model and the kinetics dataset. In IEEE Conference on Computer Vision and Pattern Recognition. https://doi.org/10.1109/cvpr.2017.502
- Chavarriaga et al. (2013) Ricardo Chavarriaga, Hesam Sagha, Alberto Calatroni, Sundara Tejaswi Digumarti, Gerhard Tröster, José del R. Millán, and Daniel Roggen. 2013. The Opportunity challenge: A benchmark database for on-body sensor-based activity recognition. Pattern Recognition Letters 34, 15 (2013). https://doi.org/10.1016/j.patrec.2012.12.014
- Chen et al. (2022) Guo Chen, Yin-Dong Zheng, Limin Wang, and Tong Lu. 2022. DCAN: Improving Temporal Action Detection via Dual Context Aggregation. In AAAI Conference on Artificial Intelligence. https://doi.org/10.1609/aaai.v36i1.19900
- Chen et al. (2023a) Ling Chen, Rong Hu, Menghan Wu, and Xin Zhou. 2023a. HMGAN: A hierarchical multi-modal generative adversarial network model for wearable human activity recognition. ACM on Interactive, Mobile, Wearable and Ubiquitous Technologies 7, 3 (2023). https://doi.org/10.1145/3610909
- Chen et al. (2023b) Ling Chen, Yi Zhang, Shenghuan Miao, Sirou Zhu, Rong Hu, Liangying Peng, and Mingqi Lv. 2023b. SALIENCE: An unsupervised user adaptation model for multiple wearable sensors based human activity recognition. IEEE Transactions on Mobile Computing 22, 9 (2023). https://doi.org/10.1109/TMC.2022.3171312
- Chen et al. (2020) Ling Chen, Yi Zhang, and Liangying Peng. 2020. METIER: A deep multi-task learning based activity and user recognition model using wearable sensors. ACM on Interactive, Mobile, Wearable and Ubiquitous Technologies 4, 1 (2020). https://doi.org/10.1145/3381012
- Damen et al. (2022) Dima Damen, Hazel Doughty, Giovanni Maria Farinella, Antonino Furnari, Jian Ma, Evangelos Kazakos, Davide Moltisanti, Jonathan Munro, Toby Perrett, Will Price, and Michael Wray. 2022. Rescaling egocentric vision: Collection, pipeline and challenges for EPIC-KITCHENS-100. International Journal of Computer Vision 130 (2022). https://doi.org/10.1007/s11263-021-01531-2
- Glorot and Bengio (2010) Xavier Glorot and Yoshua Bengio. 2010. Understanding the Difficulty of Training Deep Feedforward Neural Networks. In International Conference on Artificial Intelligence and Statistics. http://proceedings.mlr.press/v9/glorot10a
- Gong et al. (2020) Guoqiang Gong, Liangfeng Zheng, and Yadong Mu. 2020. Scale matters: Temporal scale aggregation network for precise action localization in untrimmed videos. In IEEE International Conference on Multimedia and Expo. https://doi.org/10.1109/ICME46284.2020.9102850
- Grauman et al. (2022) Kristen Grauman, Andrew Westbury, Eugene Byrne, Zachary Chavis, Antonino Furnari, Rohit Girdhar, Jackson Hamburger, Hao Jiang, Miao Liu, and Xingyu Liu. 2022. Ego4D: Around the world in 3,000 hours of egocentric video. In IEEE/CVF Conference on Computer Vision and Pattern Recognition. https://doi.org/10.1109/CVPR52688.2022.01842
- Guan and Plötz (2017) Yu Guan and Thomas Plötz. 2017. Ensembles of Deep LSTM Learners for Activity Recognition using Wearables. ACM on Interactive, Mobile, Wearable and Ubiquitous Technologies 1, 2 (2017), 1–28. https://doi.org/10.1145/3090076
- Heilbron et al. (2015) Fabian Caba Heilbron, Juan Carlos Niebles, Victor Escorcia, and Bernard Ghanem. 2015. ActivityNet: A large-scale video benchmark for human activity understanding. In IEEE Conference on Computer Vision and Pattern Recognition. https://doi.org/10.1109/cvpr.2015.7298698
- Hoelzemann et al. (2023) Alexander Hoelzemann, Julia L. Romero, Marius Bock, Kristof Van Laerhoven, and Qin Lv. 2023. Hang-time HAR: A benchmark dataset for basketball activity recognition using wrist-worn inertial sensors. Sensors 23, 13 (2023). https://doi.org/10.3390/s23135879
- Jiang et al. (2014) Y.-G. Jiang, J. Liu, A. Roshan Zamir, G. Toderici, I. Laptev, M. Shah, and R. Sukthankar. 2014. THUMOS challenge: Action recognition with a large number of classes. http://crcv.ucf.edu/THUMOS14/
- Karpathy et al. (2015) Andrej Karpathy, Justin Johnson, and Fei-Fei Li. 2015. Visualizing and Understanding Recurrent Networks. CoRR abs/1506.02078 (2015). http://arxiv.org/abs/1506.02078
- Li et al. (2020) Xiang Li, Wenhai Wang, Lijun Wu, Shuo Chen, Xiaolin Hu, Jun Li, Jinhui Tang, and Jian Yang. 2020. Generalized focal loss: Learning qualified and distributed bounding boxes for dense object detection. In Advances in Neural Information Processing Systems. https://proceedings.neurips.cc/paper_files/paper/2020/file/f0bda020d2470f2e74990a07a607ebd9-Paper.pdf
- Lin et al. (2020) Chuming Lin, Jian Li, Yabiao Wang, Ying Tai, Donghao Luo, Zhipeng Cui, Chengjie Wang, Jilin Li, Feiyue Huang, and Rongrong Ji. 2020. Fast learning of temporal action proposal via dense boundary generator. In IEEE Conference on Computer Vision and Pattern Recognition. https://doi.org/10.1609/aaai.v34i07.6815
- Lin et al. (2021) Chuming Lin, Chengming Xu, Donghao Luo, Yabiao Wang, Ying Tai, Chengjie Wang, Jilin Li, Feiyue Huang, and Yanwei Fu. 2021. Learning salient boundary feature for anchor-free temporal action localization. In IEEE/CVF Conference on Computer Vision and Pattern Recognition. https://doi.org/10.1109/cvpr46437.2021.00333
- Lin et al. (2019) Tianwei Lin, Xiao Liu, Xin Li, Errui Ding, and Shilei Wen. 2019. BMN: Boundary-matching network for temporal action proposal generation. In {IEEE}/{CVF} International Conference on Computer Vision. https://doi.org/10.1109/iccv.2019.00399
- Liu and Wang (2020) Qinying Liu and Zilei Wang. 2020. Progressive boundary refinement network for temporal action detection. In AAAI Conference on Artificial Intelligence. https://doi.org/10.1609/aaai.v34i07.6829
- Liu et al. (2020) Shengzhong Liu, Shuochao Yao, Jinyang Li, Dongxin Liu, Tianshi Wang, Huajie Shao, and Tarek Abdelzaher. 2020. GIobalFusion: A global attentional deep learning framework for multisensor information fusion. ACM on Interactive, Mobile, Wearable and Ubiquitous Technologies 4, 1 (2020). https://doi.org/10.1145/3380999
- Liu et al. (2021) Xiaolong Liu, Yao Hu, Song Bai, Fei Ding, Xiang Bai, and Philip H. S. Torr. 2021. Multi-shot temporal event localization: A benchmark. In IEEE/CVF Conference on Computer Vision and Pattern Recognition. https://doi.org/10.1109/cvpr46437.2021.01241
- Liu et al. (2022) Xiaolong Liu, Qimeng Wang, Yao Hu, Xu Tang, Shiwei Zhang, Song Bai, and Xiang Bai. 2022. End-to-end temporal action detection with transformer. IEEE Transactions on Image Processing 31 (2022). https://doi.org/10.1109/TIP.2022.3195321
- Long et al. (2019) Fuchen Long, Ting Yao, Zhaofan Qiu, Xinmei Tian, Jiebo Luo, and Tao Mei. 2019. Gaussian temporal awareness networks for action localization. In IEEE/CVF Conference on Computer Vision and Pattern Recognition. https://doi.org/10.1109/cvpr.2019.00043
- Miao et al. (2022) Shenghuan Miao, Ling Chen, Rong Hu, and Yingsong Luo. 2022. Towards a dynamic inter-sensor correlations learning framework for multi-sensor-based wearable human activity recognition. ACM Interactive, Mobile, Wearable and Ubiquitous Technologies 6, 3 (2022). https://doi.org/10.1145/3550331
- Murahari and Plötz (2018) Vishvak S. Murahari and Thomas Plötz. 2018. On attention models for human activity recognition. In ACM International Symposium on Wearable Computers. https://doi.org/10.1145/3267242.3267287
- Nag et al. (2022) Sauradip Nag, Xiatian Zhu, Yi-Zhe Song, and Tao Xiang. 2022. Proposal-free temporal action detection via global segmentation mask learning. In European Conferencee on Computer Vision. https://doi.org/10.1007/978-3-031-20062-5_37
- Ordóñez and Roggen (2016) Francisco Javier Ordóñez and Daniel Roggen. 2016. Deep Convolutional and LSTM Recurrent Neural Networks for Multimodal Wearable Activity Recognition. Sensors 16, 1 (2016). https://doi.org/10.3390/s16010115
- Pellatt and Roggen (2020) Lloyd Pellatt and Daniel Roggen. 2020. CausalBatch: Solving Complexity/Performance tradeoffs for deep convolutional and LSTM networks for wearable activity recognition. In ACM International Joint Conference on Pervasive and Ubiquitous Computing and ACM International Symposium on Wearable Computers. https://doi.org/10.1145/3410530.3414365
- Peng et al. (2018) Liangying Peng, Ling Chen, Zhenan Ye, and Yi Zhang. 2018. AROMA: A deep multi-task learning based simple and complex human activity recognition method using wearable sensors. ACM on Interactive, Mobile, Wearable and Ubiquitous Technologies 2, 2 (2018). https://doi.org/10.1145/3214277
- Qing et al. (2021) Zhiwu Qing, Haisheng Su, Weihao Gan, Dongliang Wang, Wei Wu, Xiang Wang, Yu Qiao, Junjie Yan, Changxin Gao, and Nong Sang. 2021. Temporal context aggregation network for temporal action proposal refinement. In IEEE/CVF Conference on Computer Vision and Pattern Recognition. https://doi.org/10.1109/cvpr46437.2021.00055
- Reyes-Ortiz et al. (2016) Jorge-L. Reyes-Ortiz, Luca Oneto, Albert Samà, Xavier Parra, and Davide Anguita. 2016. Transition-Aware Human Activity Recognition Using Smartphones. Neurocomputing 171 (2016). https://doi.org/10.1016/j.neucom.2015.07.085
- Rezatofighi et al. (2019) Hamid Rezatofighi, Nathan Tsoi, JunYoung Gwak, Amir Sadeghian, Ian Reid, and Silvio Savarese. 2019. Generalized intersection over union: A metric and a loss for bounding box regression. In IEEE/CVF Conference on Computer Vision and Pattern Recognition. https://doi.org/10.1109/cvpr.2019.00075
- Roggen et al. (2010) Daniel Roggen, Alberto Calatroni, Mirco Rossi, Thomas Holleczek, Kilian Förster, Gerhard Tröster, Paul Lukowicz, David Bannach, Gerald Pirkl, Alois Ferscha, Jakob Doppler, Clemens Holzmann, Marc Kurz, Gerald Holl, Ricardo Chavarriaga, Hesam Sagha, Hamidreza Bayati, Marco Creatura, and José del R. Millàn. 2010. Collecting Complex Activity Datasets in Highly Rich Networked Sensor Environments. In IEEE Seventh International Conference on Networked Sensing Systems. https://doi.org/10.1109/INSS.2010.5573462
- Scholl et al. (2015) Philipp M. Scholl, Matthias Wille, and Kristof Van Laerhoven. 2015. Wearables in the Wet Lab: A Laboratory System for Capturing and Guiding Experiments. In ACM International Joint Conference on Pervasive and Ubiquitous Computing. https://doi.org/10.1145/2750858.2807547
- Shi et al. (2023) Dingfeng Shi, Yujie Zhong, Qiong Cao, Lin Ma, Jia Li, and Dacheng Tao. 2023. TriDet: Temporal action detection with relative boundary modeling. In IEEE/CVF Conference on Computer Vision and Pattern Recognition. https://doi.org/10.1109/cvpr52729.2023.01808
- Shi et al. (2022) Dingfeng Shi, Yujie Zhong, Qiong Cao, Jing Zhang, Lin Ma, Jia Li, and Dacheng Tao. 2022. ReAct: Temporal action detection with relational queries. In European Conference on Computer Vision. https://doi.org/10.1007/978-3-031-20080-9_7
- Sridhar et al. (2021) Deepak Sridhar, Niamul Quader, Srikanth Muralidharan, Yaoxin Li, Peng Dai, and Juwei Lu. 2021. Class semantics-based attention for action detection. In IEEE/ CVF International Conference on Computer Vision. https://doi.org/10.1109/iccv48922.2021.01348
- Sztyler and Stuckenschmidt (2016) Timo Sztyler and Heiner Stuckenschmidt. 2016. On-body localization of wearable devices: An investigation of position-aware activity recognition. In IEEE International Conference on Pervasive Computing and Communications. https://doi.org/10.1109/PERCOM.2016.7456521
- Tan et al. (2021) Jing Tan, Jiaqi Tang, Limin Wang, and Gangshan Wu. 2021. Relaxed transformer decoders for direct action proposal generation. In IEEE/CVF International Conference on Computer Vision. https://doi.org/10.1109/iccv48922.2021.01327
- Tang et al. (2023) Tuan N. Tang, Kwonyoung Kim, and Kwanghoon Sohn. 2023. TemporalMaxer: Maximize temporal context with only max pooling for temporal action localization. CoRR abs/2303.09055 (2023). https://arxiv.org/abs/2303.09055
- Tian et al. (2022) Zhi Tian, Xiangxiang Chu, Xiaoming Wang, Xiaolin Wei, and Chunhua Shen. 2022. Fully convolutional one-stage 3D object detection on LiDAR range images. In Advances in Neural Information Processing Systems. https://proceedings.neurips.cc/paper_files/paper/2022/file/e1f418450107c4a0ddc16d008d131573-Paper-Conference.pdf
- Vaizman et al. (2018) Yonatan Vaizman, Nadir Weibel, and Gert Lanckriet. 2018. Context recognition in-the-wild: Unified model for multi-modal sensors and multi-label classification. ACM on Interactive, Mobile, Wearable and Ubiquitous Technologies 1, 4 (2018). https://doi.org/10.1145/3161192
- Vaswani et al. (2017) Ashish Vaswani, Noam Shazeer, Niki Parmar, Jakob Uszkoreit, Llion Jones, Aidan N Gomez, Łukasz Kaiser, and Illia Polosukhin. 2017. Attention is all you need. In Advances in Neural Information Processing Systems. https://proceedings.neurips.cc/paper/2017/file/3f5ee243547dee91fbd053c1c4a845aa-Paper.pdf
- Ward et al. (2011) Jamie A. Ward, Paul Lukowicz, and Hans W. Gellersen. 2011. Performance metrics for activity recognition. ACM Transactions on Intelligent Systems and Technology 2, 1 (2011). https://doi.org/10.1145/1889681.1889687
- Ward et al. (2006) Jamie A. Ward, Paul Lukowicz, and Gerhard Tröster. 2006. Evaluating Performance in Continuous Context Recognition Using Event-Driven Error Characterisation. In Location- and Context-Awareness. https://doi.org/10.1007/11752967_16
- Wen et al. (2016) Yandong Wen, Kaipeng Zhang, Zhifeng Li, and Yu Qiao. 2016. A Discriminative Feature Learning Approach for Deep Face Recognition. In European Conference on Computer Vision. 499–515. https://doi.org/10.1007/978-3-319-46478-7_31
- Wieland and Pankratius (2023) Christoph Wieland and Victor Pankratius. 2023. TinyGraphHAR: Enhancing human activity recognition with graph neural networks. In IEEE World AI IoT Congress. https://doi.org/10.1109/AIIoT58121.2023.10174597
- Xi et al. (2018) Rui Xi, Mengshu Hou, Mingsheng Fu, Hong Qu, and Daibo Liu. 2018. Deep Dilated Convolution on Multimodality Time Series for Human Activity Recognition. In IEEE International Joint Conference on Neural Networks. https://doi.org/10.1109/IJCNN.2018.8489540
- Xia et al. (2020) Kun Xia, Jianguang Huang, and Hanyu Wang. 2020. LSTM-CNN architecture for human activity recognition. IEEE Access 8 (2020). https://doi.org/10.1109/ACCESS.2020.2982225
- Xu et al. (2019) Cheng Xu, Duo Chai, Jie He, Xiaotong Zhang, and Shihong Duan. 2019. InnoHAR: A deep neural network for complex human activity recognition. IEEE Access 7 (2019). https://doi.org/10.1109/ACCESS.2018.2890675
- Xu et al. (2020) Mengmeng Xu, Chen Zhao, David S. Rojas, Ali Thabet, and Bernard Ghanem. 2020. G-TAD: Sub-graph localization for temporal action detection. In IEEE/CVF Conference on Computer Vision and Pattern Recognition. https://doi.org/10.1109/cvpr42600.2020.01017
- Yang et al. (2023) Min Yang, Guo Chen, Yin-Dong Zheng, Tong Lu, and Limin Wang. 2023. BasicTAD: an astounding rgb-only baseline for temporal action detection. Computer Vision and Image Understanding 232 (2023). https://doi.org/10.1016/j.cviu.2023.103692
- Zeng et al. (2019) Runhao Zeng, Wenbing Huang, Mingkui Tan, Yu Rong, Peilin Zhao, Junzhou Huang, and Chuang Gan. 2019. Graph convolutional networks for temporal action localization. In IEEE/CVF International Conference on Computer Vision. https://doi.org/10.1109/iccv.2019.00719
- Zhang et al. (2022b) Chen-Lin Zhang, Jianxin Wu, and Yin Li. 2022b. ActionFormer: Localizing moments of actions with transformers. In Lecture Notes in Computer Science. https://doi.org/10.1007/978-3-031-19772-7_29
- Zhang et al. (2020) Shifeng Zhang, Cheng Chi, Yongqiang Yao, Zhen Lei, and Stan Z. Li. 2020. Bridging the gap between anchor-based and anchor-free detection via adaptive training sample selection. In IEEE/CVF Conference on Computer Vision and Pattern Recognition. https://doi.org/10.1109/cvpr42600.2020.00978
- Zhang et al. (2022a) Ye Zhang, Longguang Wang, Huiling Chen, Aosheng Tian, Shilin Zhou, and Yulan Guo. 2022a. IF-ConvTransformer: A framework for human activity recognition using IMU fusion and ConvTransformer. ACM on Interactive, Mobile, Wearable and Ubiquitous Technologies 6, 2 (2022). https://doi.org/10.1145/3534584
- Zhao et al. (2021) Chen Zhao, Ali K. Thabet, and Bernard Ghanem. 2021. Video self-stitching graph network for temporal action localization. In IEEE/CVF International Conference on Computer Vision. https://doi.org/10.1109/iccv48922.2021.01340
- Zhao et al. (2020) Peisen Zhao, Lingxi Xie, Chen Ju, Ya Zhang, Yanfeng Wang, and Qi Tian. 2020. Bottom-up temporal action localization with mutual regularization. In European Conference on Computer Vision. https://doi.org/10.1007/978-3-030-58598-3_32
- Zhou et al. (2022) Yexu Zhou, Haibin Zhao, Yiran Huang, Till Riedel, Michael Hefenbrock, and Michael Beigl. 2022. TinyHAR: A lightweight deep learning model designed for human activity recognition. In ACM International Symposium on Wearable Computers. https://doi.org/10.1145/3544794.3558467
- Zhu et al. (2021) Zixin Zhu, Wei Tang, Le Wang, Nanning Zheng, and Gang Hua. 2021. Enriching local and global contexts for temporal action localization. In IEEE/CVF International Conference on Computer Vision. https://doi.org/10.1109/iccv48922.2021.01326