Motility-induced coexistence of a hot liquid and a cold gas
Abstract
If two phases of a certain material exist at the same time, e.g., a gas and a liquid, they have the same temperature. This fundamental law of equilibrium physics is known to apply even to many non-equilibrium systems. However, recently, there has been much attention in the finding that inertial self-propelled particles like Janus colloids in a plasma, microflyers, or beetles at interfaces could self-organize into a hot gas-like phase that coexists with a colder liquid-like phase. Here, we show that a kinetic temperature difference across coexisting phases can occur even in equilibrium systems when adding generic (overdamped) self-propelled particles. In this case, surprisingly, we find that the dense phase (liquid) cannot only be colder but also hotter than the dilute phase (gas). This generic effect hinges on correlated events where active particles collectively push and heat up passive ones, which can overcompensate their collision-induced energy loss locally. Our results answer the fundamental question if a non-equilibrium gas can be colder than a coexisting liquid and create a route to equip matter with self-organized domains of different kinetic temperatures.
Keywords: active matter, colloids, granulates, self-propulsion, computer simulations, motility-induced phase separation, non-equilibrium physics
Introduction
We are all used to the experience that a gas is often hotter than a liquid of the same material. For example, to evaporate water from a pot in our kitchens, we need to increase its temperature. Then, at some point, vapor molecules rapidly escape from the liquid and distribute in the surrounding air. This experience that vapor emerges when increasing the temperature of a liquid has played a key role throughout human history: It was an essential ingredient, e.g., for the development of the steam engine [1], and it is key to technological applications like distillation techniques [2, 3] or physical vapor deposition [4, 5] as well as to natural spectacles such as geysers [6]. The central exception from the experience that gases are hotter than liquids occurs when two phases, e.g., a gas and a liquid, coexist at the same time. Then they share the same temperature. This is guaranteed by the fundamental laws of statistical mechanics and thermodynamics for all equilibrium systems and it also applies to some non-equilibrium systems [7, 8, 9, 10, 11]. Intuitively, this is plausible since any type of temperature gradient seems to evoke an energy flow evening out an initial temperature gradient.
Despite this, very recently, it was found that at phase coexistence in certain active systems consisting of active particles which consume energy from their environment to propel themselves [12, 13, 14], the dilute (gas-like) phase is hotter by up to one or two orders of magnitude compared to the dense (liquid-like) phase in terms of the kinetic temperature of the particles [15, 11, 16]. While this complies with our intuition that gases are often hotter than liquids, it is in stark contrast to the situation in equilibrium systems and the expectation that any temperature difference should evoke an energy flux that balances it out. By now, such a temperature difference across coexisting phases has been shown to occur for a variety of temperature definitions that all coincide in equilibrium. It has been observed, e.g., for the kinetic temperature [11], the effective temperature [15] as well as for tracer-based temperature definitions [16, 17] in systems undergoing motility-induced phase separation (MIPS) [18, 19, 20, 21, 7, 22, 23, 8, 24, 25, 26, 27, 28, 29, 30, 9], i.e., in systems of particles that self-organize into a dilute (gas) and a coexisting dense (liquid) phase. The mechanism underlying the emergence of a temperature difference across coexisting phases hinges on the consumption of energy at the level of the active particles when undergoing frequent collisions within the dense phase. This mechanism crucially requires inertia [11, 15, 16], whereas overdamped active particles show the same kinetic temperature in coexisting phases [11]. The requirement of inertia restricts the observation of different coexisting temperatures to a special class of active systems and precludes its experimental observation in generic microswimmer experiments.
In the present work, we explore the possibility to achieve a kinetic temperature difference across coexisting phases in a system made of two generic components that on their own would not lead to a temperature difference: an ordinary equilibrium system made of, e.g., granular particles or colloidal plasmas (inertial passive tracers) and conventional active particles like bacteria or synthetic microswimmers that are overdamped. This exploration leads us to the following central insights: First, we show that kinetic temperature differences across coexisting phases can indeed occur in passive systems with inertia that are mixed with overdamped active particles, i.e., in a broader class of systems than what was anticipated so far. The temperature differences are not only visible for the kinetic temperature but also for the Maxwell-Boltzmann temperature obtained from the velocity distribution of the passive particles, which is approximately Gaussian at large enough self-propulsion speed of the active particles. Second, we find that not only the gas can be hotter – but, counterintuitively – also the dense phase can be hotter than the dilute phase. This transcends a knowledge boundary in the literature and appears as particularly surprising since the current understanding of the mechanism leading to different temperatures across coexisting phases hinges on the idea that collisions in active systems lead to a local loss of kinetic energy (similarly as inelastic collisions do in granular systems [31, 32, 33, 34, 35, 36, 37, 38, 39, 40, 41, 42, 43]). Such collisions are more frequent in dense regions suggesting that the dense phase is always colder than the dilute one, which coincides with all previous observations [11, 15, 16, 31, 32, 33, 34, 35, 36, 37, 38, 39, 40, 41, 42, 44]. In the present work, we show that in suitable parameter regimes, this effect can be reverted because the influence of the higher collision rate in the dense phase can overcompensate the kinetic energy loss per collision. This is a subtle but generic effect that is made possible by long-lasting coherent motion patterns of active and passive particles within the dense phase, which results in a small velocity difference, and hence, in a small energy loss per collision. Finally, our results pave the route towards the usage of microswimmers such as bacteria [45, 46, 47, 48], algae [49, 50], or Janus particles and other synthetic microswimmers [20, 12, 51, 52, 53] for controlling the kinetic temperature profile and hence, the dynamics of fluids and other passive materials.
Results
Model
We study a mixture of active and passive particles in two spatial dimensions, in which the active (passive) particles are represented by the active (passive) Brownian particle [ABP (PBP)] model [54, 11, 26, 55, 56, 30] (see Methods for details). While the motion of the active particles is overdamped, the passive species is significantly heavier (inertial). For simplicity, we consider active and passive particles with the same size and drag coefficients [57] but different material density. However, note that the key effects which we discuss in the following are similar for particles with significantly different sizes and drag coefficients, as we shall see. We define the Péclet number, which measures the relative importance of self-propulsion and diffusion, by , where , denote the translational and the rotational diffusion coefficients of the active particles, respectively. Here, denotes the bath temperature, and are the translational and rotational drag coefficients, respectively, represents the self-propulsion speed, and is the Boltzmann constant. The corresponding Langevin equations [see Methods Eqs. (5)–(7)] are solved numerically by using LAMMPS [58] (see Methods for details).
Coexistence of a hot gas and a cold liquid
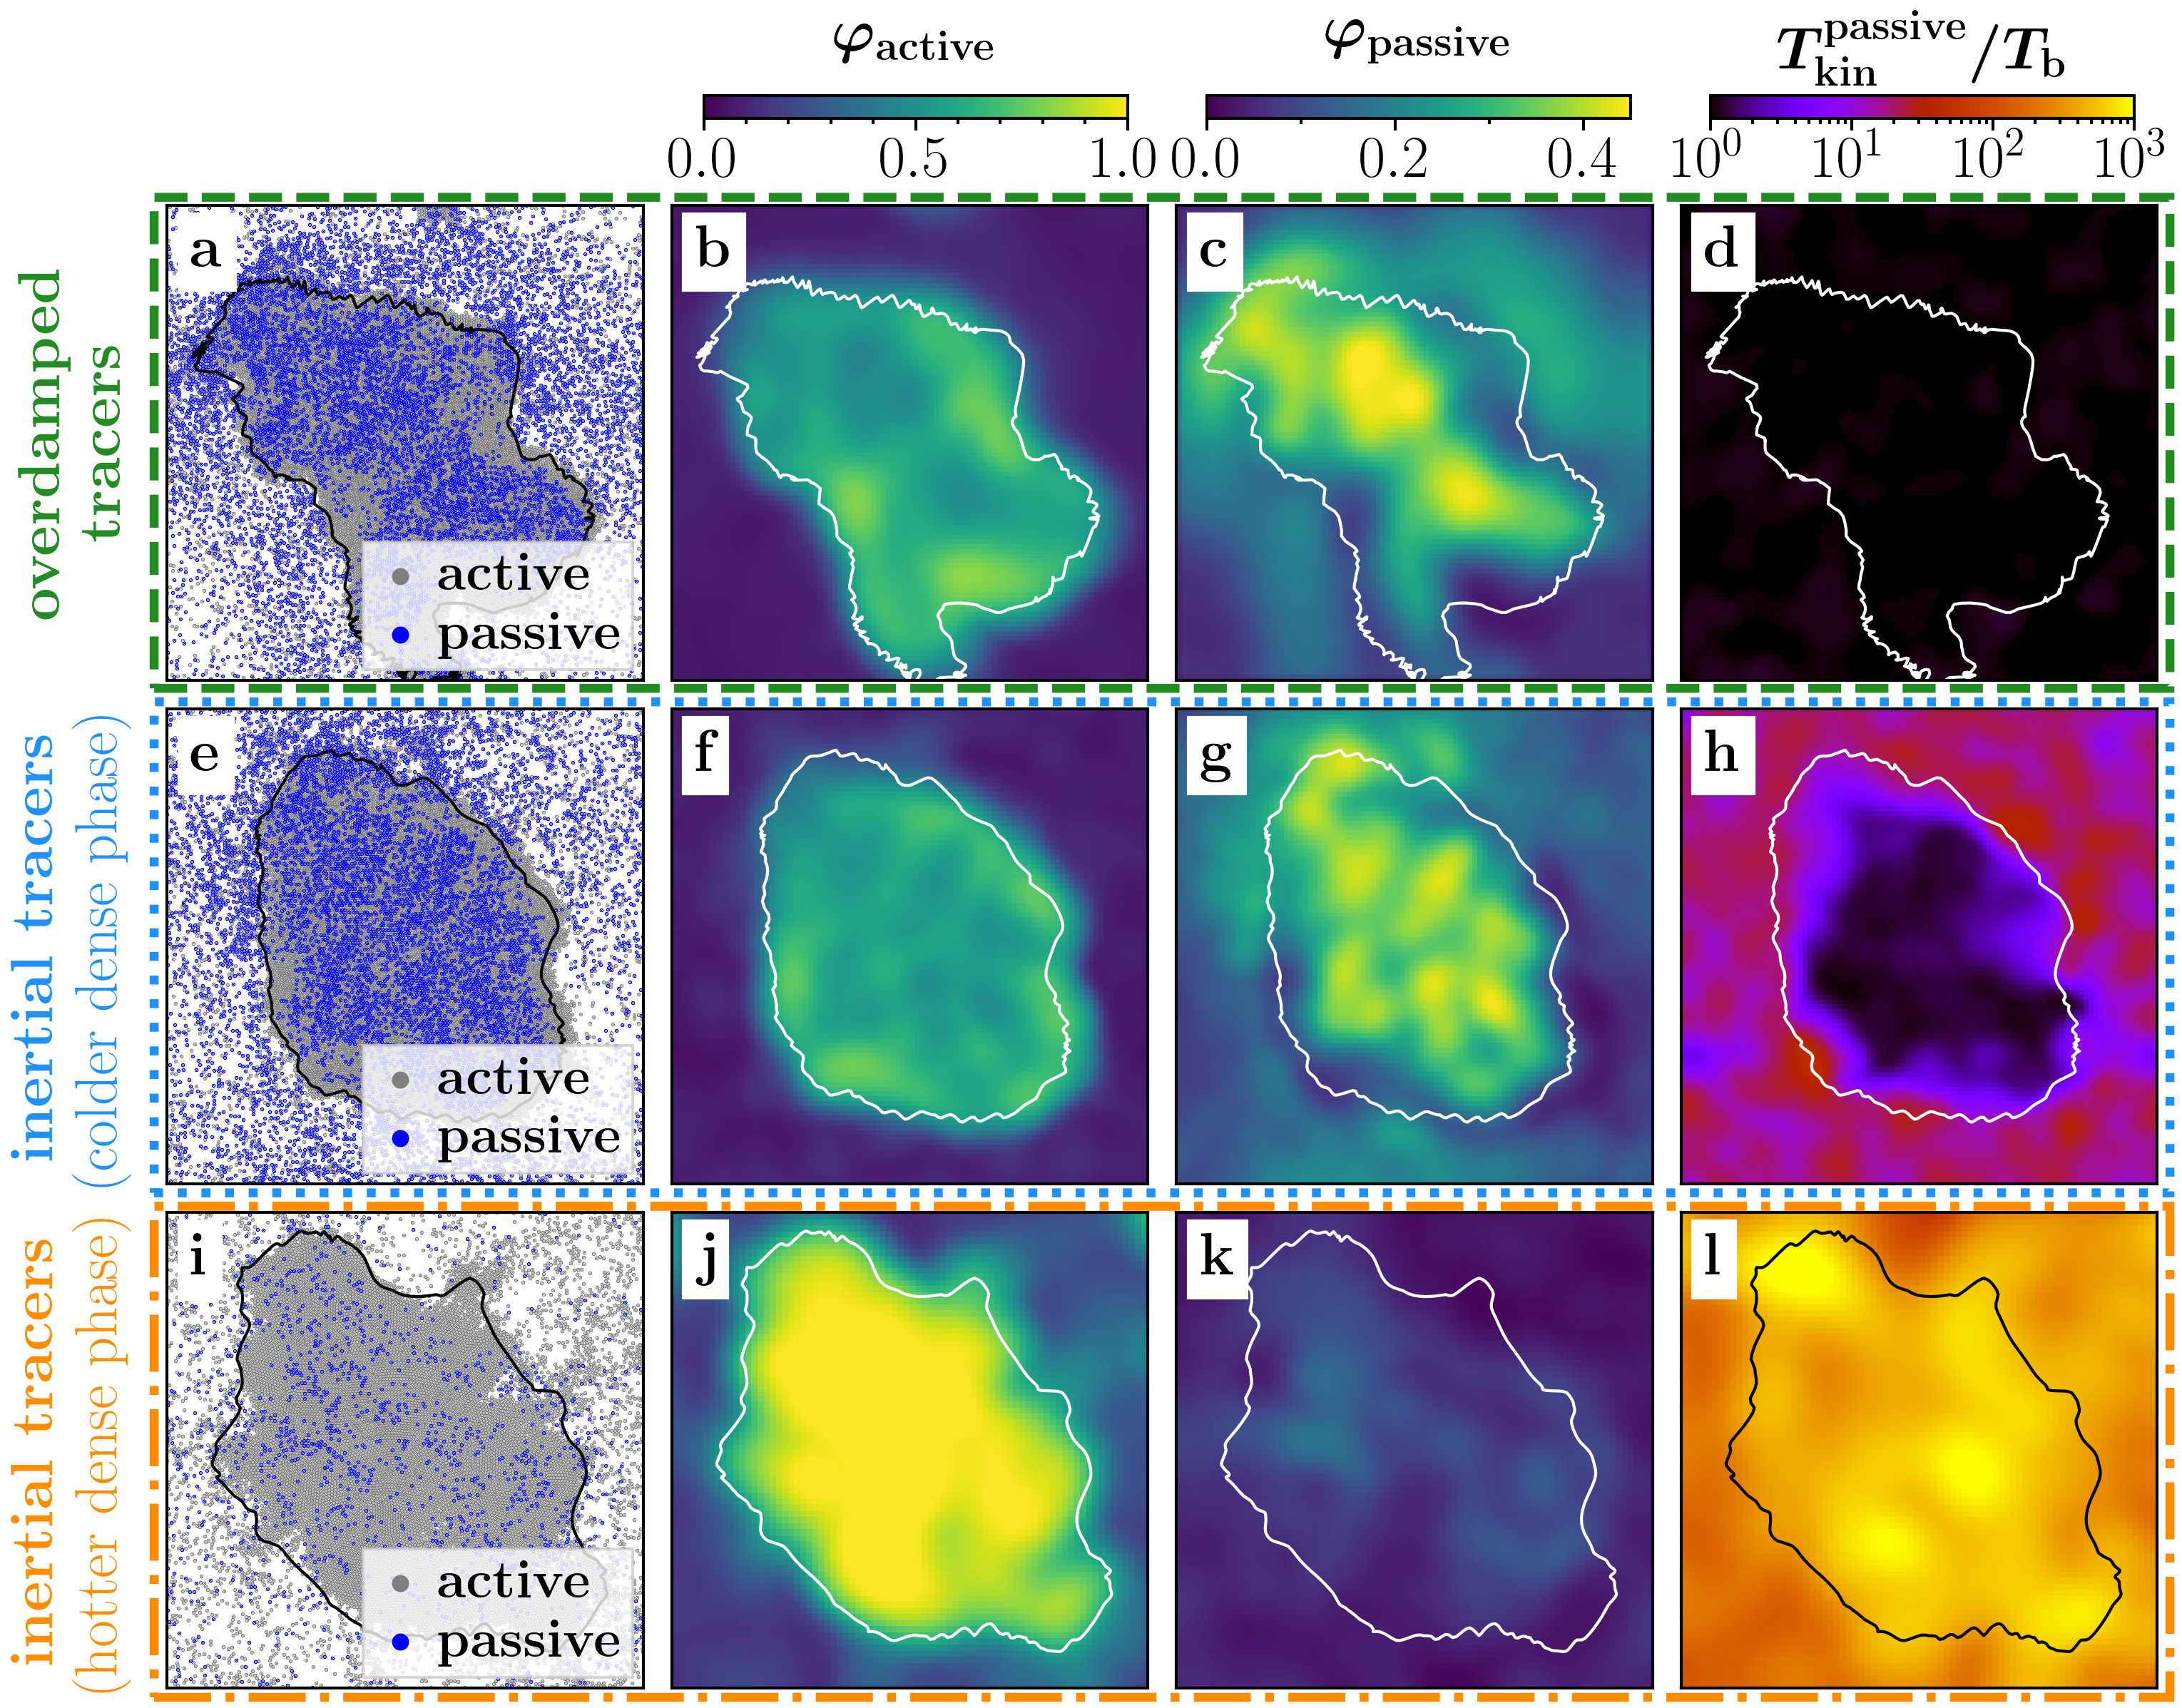
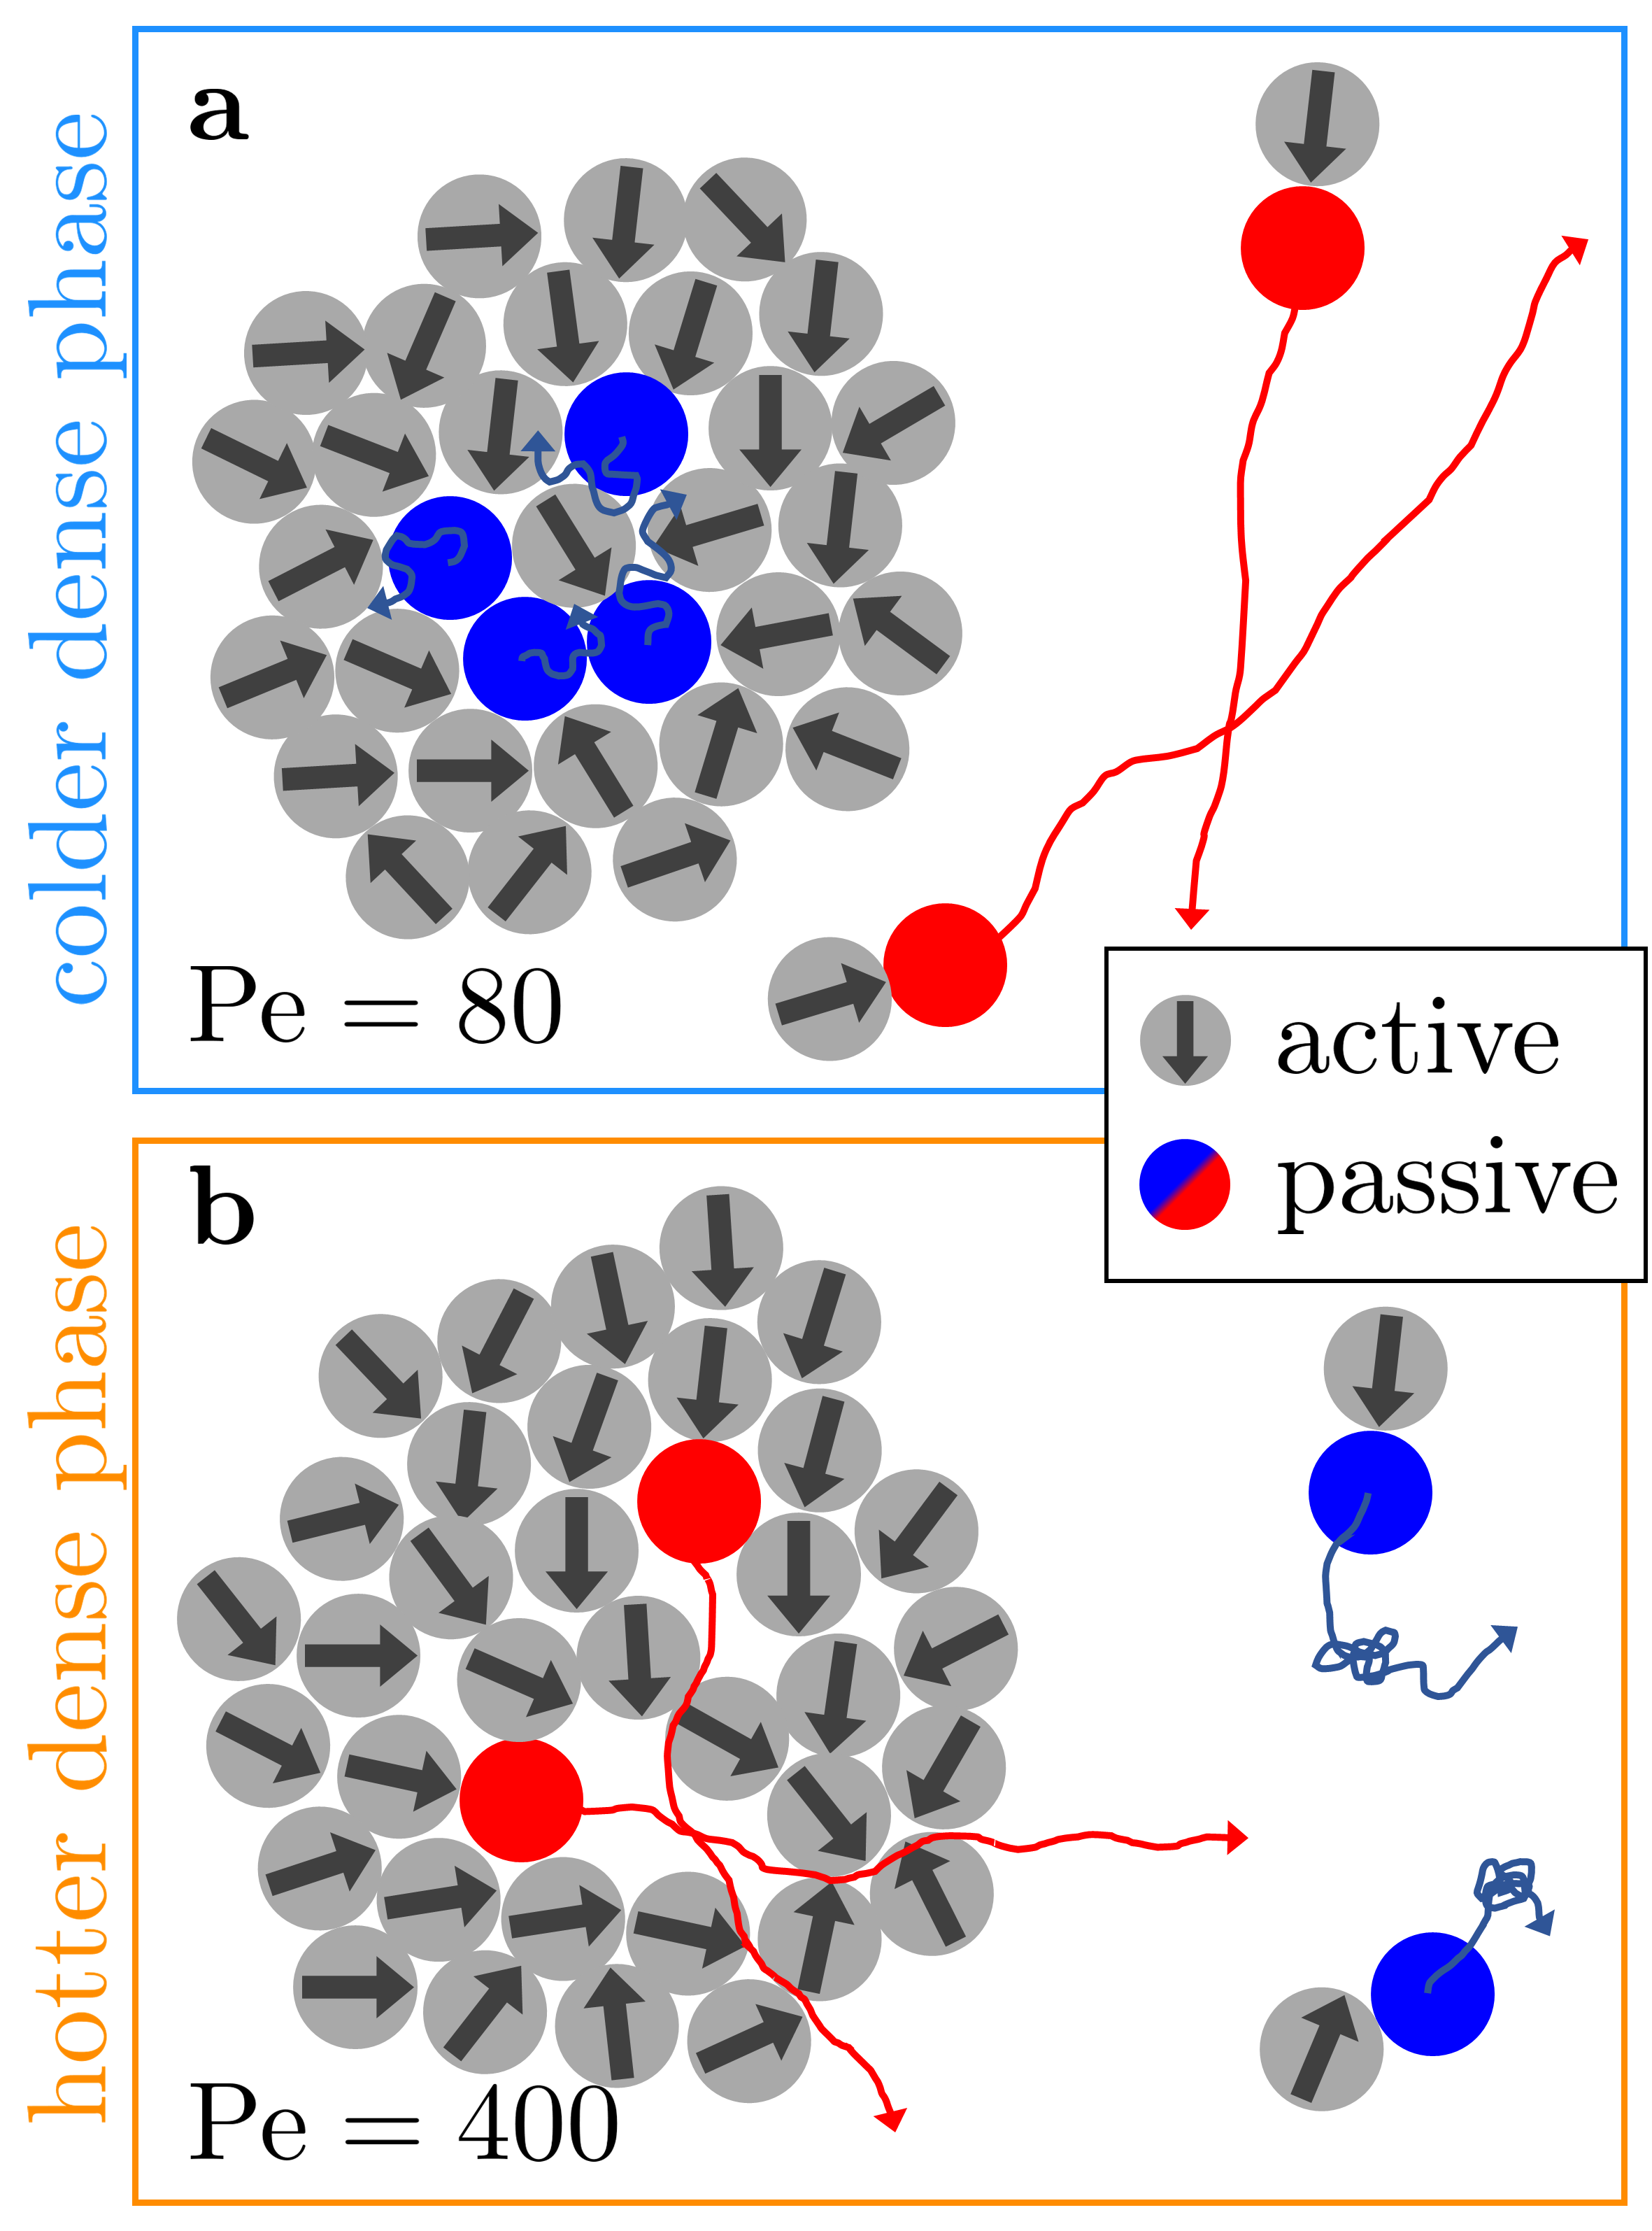
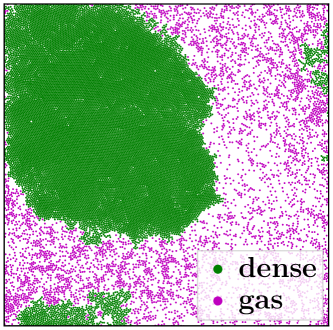
Let us first consider an initially uniform distribution of an overdamped mixture of active and passive particles [59, 57]. In our simulations, which we perform at and an area fraction of with a fraction of active particles, we observe that the active and passive particles aggregate and form persistent clusters despite the fact that they interact purely repulsively. These clusters are motility induced [18, 19, 20, 21, 7, 22, 23, 8, 24, 25, 26, 29, 30, 9] and continuously grow (coarsen), ultimately leading to a phase separated state comprising a dense liquid-like region that coexists with a dilute gas phase (Fig. 1a–d and Movie S1, Supplemental Material), which is in agreement with previous studies [59, 57]. As for systems of active overdamped particles alone [11], we find that the active and passive particles in both phases have the same kinetic temperature (shown in Fig. 1d for the passive particles). Let us now explore if this situation changes when replacing the overdamped tracers with (heavier) underdamped ones (Fig. 1e–h). Then, at the level of the structures that emerge, not much changes in our simulations: We still observe the formation of small clusters, which is followed by coarsening, ultimately leading to complete phase separation. However, when exploring the kinetic temperature of the passive particles within the steady state, we find that, remarkably, the dense phase is colder than the dilute phase. The temperature ratio of the two phases is highly significant and amounts to approximately 2.5 (Fig. 1h and Movie S2, Supplemental Material). While this temperature difference is similar to what has previously been seen in underdamped active particles [11, 15, 16] and driven granular particles [31, 32, 39, 40, 41, 42, 33, 34, 35, 36, 37, 38, 44], its emergence in the present setup is somewhat surprising since it is well known that neither the overdamped active particles [11] nor the underdamped tracers alone [60, 61] would result in a kinetic temperature difference across coexisting phases. Accordingly, the temperature difference must somehow arise from the interactions of the two species, as we will explore in more detail below. It is tempting to relate our observation of a temperature difference at the level of the particles to an enhanced energy dissipation in the dense phase which can occur either due to inelastic collisions (as for granular particles [39]) or due to multiple collisions that transfer energy from the particles to the surrounding liquid (as for active particles [11, 16]). Since the collisions are more frequent in the dense phase, the present scenario leads to the coexistence of a hot gas-like and cold liquid-like phase. In some more detail, intuitively, we could argue that in the dense phase, the motion of the PBPs is constricted by the surrounding clustered ABPs (see, e.g., Fig. 1e), which accumulate mostly at the border of the clusters, similarly as in completely overdamped mixtures [59, 57], and which cause an effective attraction between the passive tracers by pushing them together [62, 63]. Therefore, the PBPs cannot move much in the dense phase and have a lower kinetic energy there compared to the dilute phase where their motion is not restricted by active particles. This is also visible in the velocity distribution, which narrows for increasing in the dense phase (Fig. S1, Supplemental Material). To understand why inertia is required to observe a temperature difference across coexisting phases, we can intuitively argue that inertial PBPs can gain kinetic energy from collisions with ABPs in the dilute phase. Unlike overdamped tracers, they can ”store“ this energy resulting in a larger kinetic temperature in the dilute phase than in the dense phase where they have not much space to move and accelerate before frequent collisions with other particles slow them down again. In contrast, overdamped PBPs have the same kinetic temperature in both phases which is fully determined by diffusion [11]. While this may all appear plausible and is fully consistent with our simulation data and previous literature [31, 32, 39, 40, 41, 42, 11, 15, 16], it is only half the story, as we shall see in the next section.
Hot liquid-like droplets in a cold gas
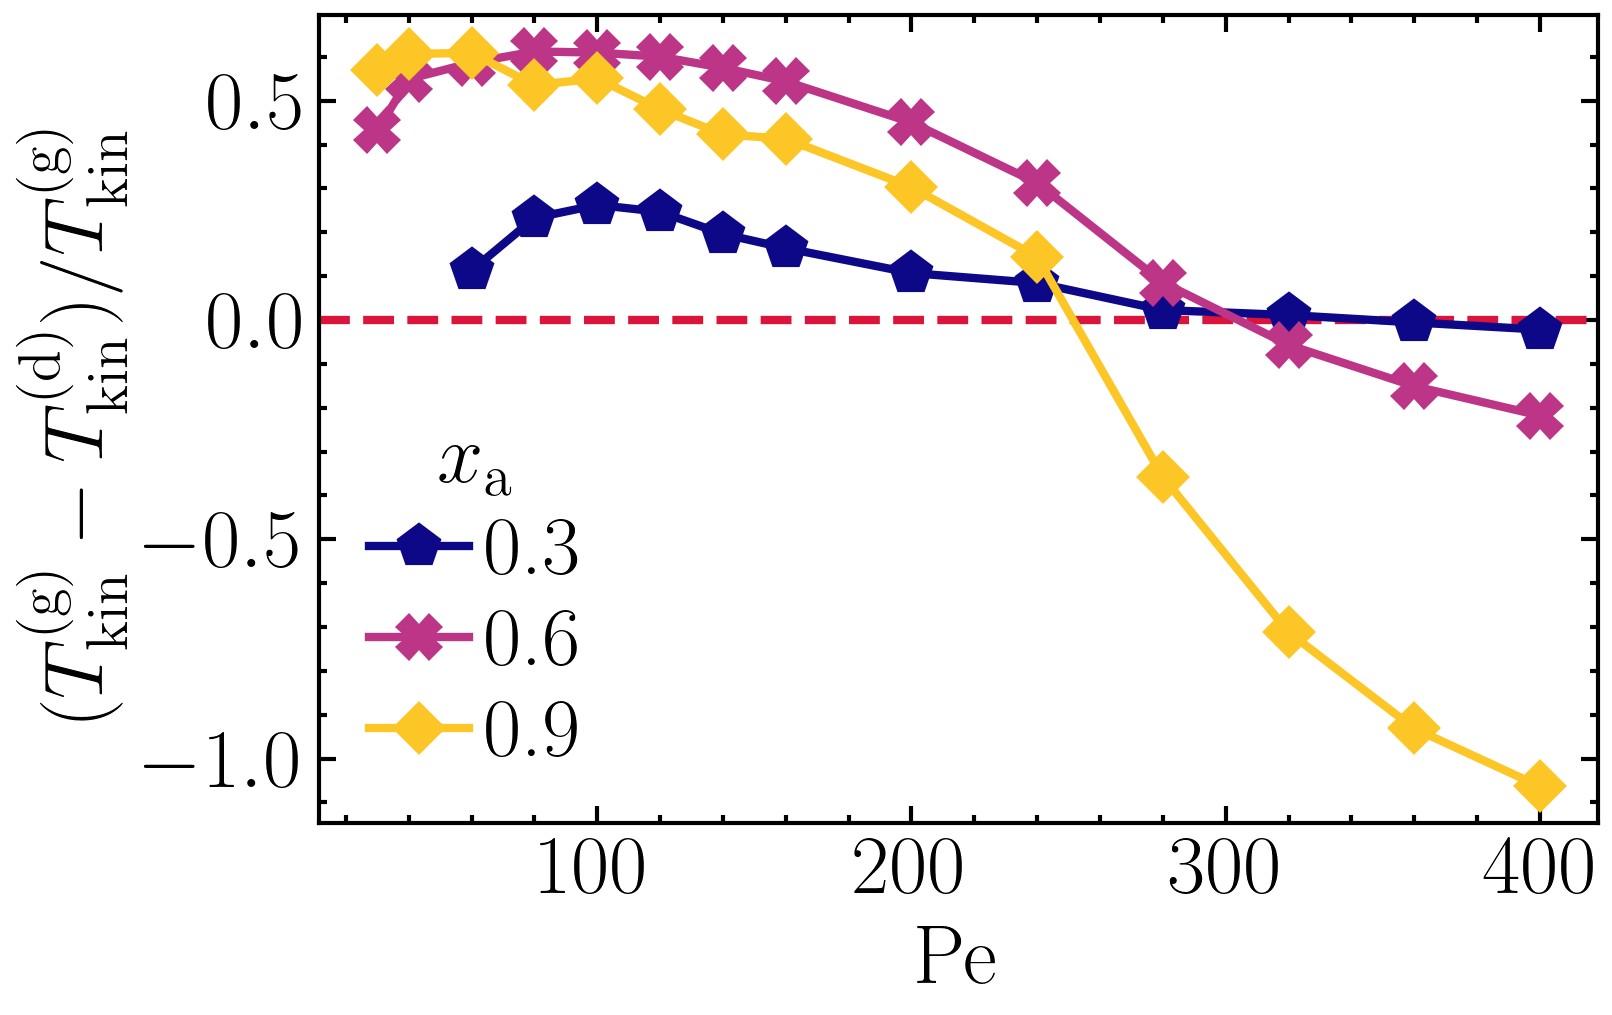
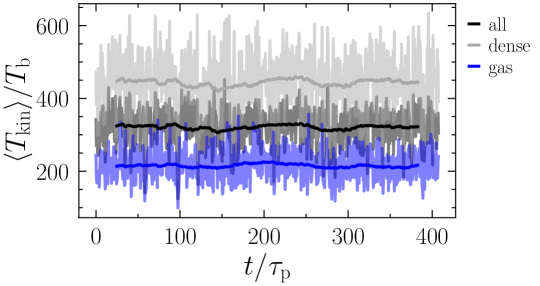
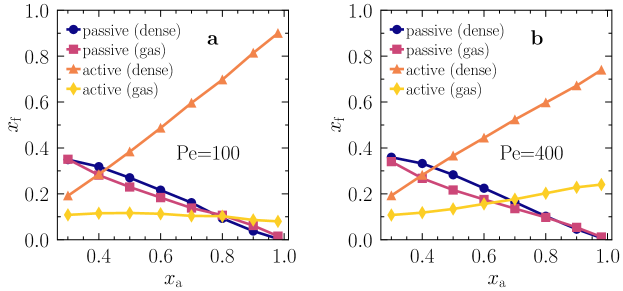
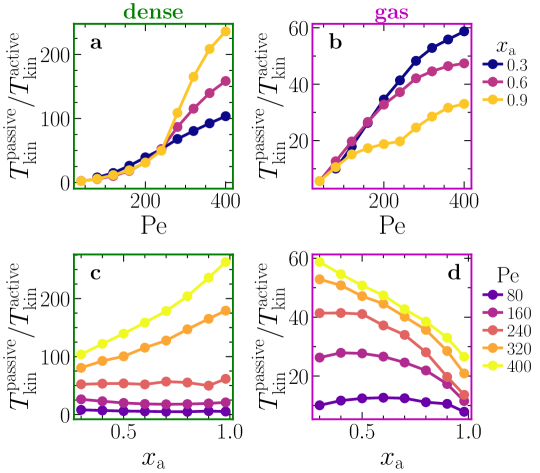
Since the observed temperature differences are activity induced, one might expect that the temperature gradient further increases when enhancing the self-propulsion speed of the active particles, i.e., when increasing Pe. Surprisingly, however, in many cases, the opposite is true. For example, for fractions , 0.6, or 0.9 of ABPs, we find that the kinetic temperature difference is largest for some intermediate Pe and then decreases essentially monotonously with increasing Pe (Fig. 2) before it even reverts and we obtain dense liquid-like droplets that are hotter than the surrounding gas. As time evolves, these droplets grow (coarsening) leading to larger and larger clusters, ultimately resulting in a single hot and dense cluster that persists over time. Exemplarily, we show typical snapshots for the case , in Fig. 1i–l (see also Movie S3 and Fig. S2, Supplemental Material). In panel l, one can clearly see that the liquid in the center of the figure is hotter than the surrounding gas. Such a coexistence of a hot liquid-like droplet and a cold gas – in terms of the kinetic temperature – is in stark contrast to what has been found for underdamped active particles [11, 16, 15] and for driven granular particles [39, 40, 41, 42, 32, 31]. Note that for very large liquid-like droplets containing significantly more than about particles, it may happen that not the entire droplet is hot but only a certain layer at their boundaries. The emergence of a hot dense droplet also contrasts with the intuitive picture given above that the temperature difference arises as a consequence of the interplay of activity and the fact that collisions are more frequent in dense regions. Therefore, the key question that guides our explorations in the following is: What is the mechanism allowing for a coexistence of hot liquid-like droplets and a colder gas? Panels j,k in Fig. 1 show that the majority of the active particles is within the dense region, whereas the passive particles are distributed almost uniformly over the entire system, which is an important observation for the understanding of the mechanism, as we shall see next.
Mechanism I: Tracer heating in the dense phase.
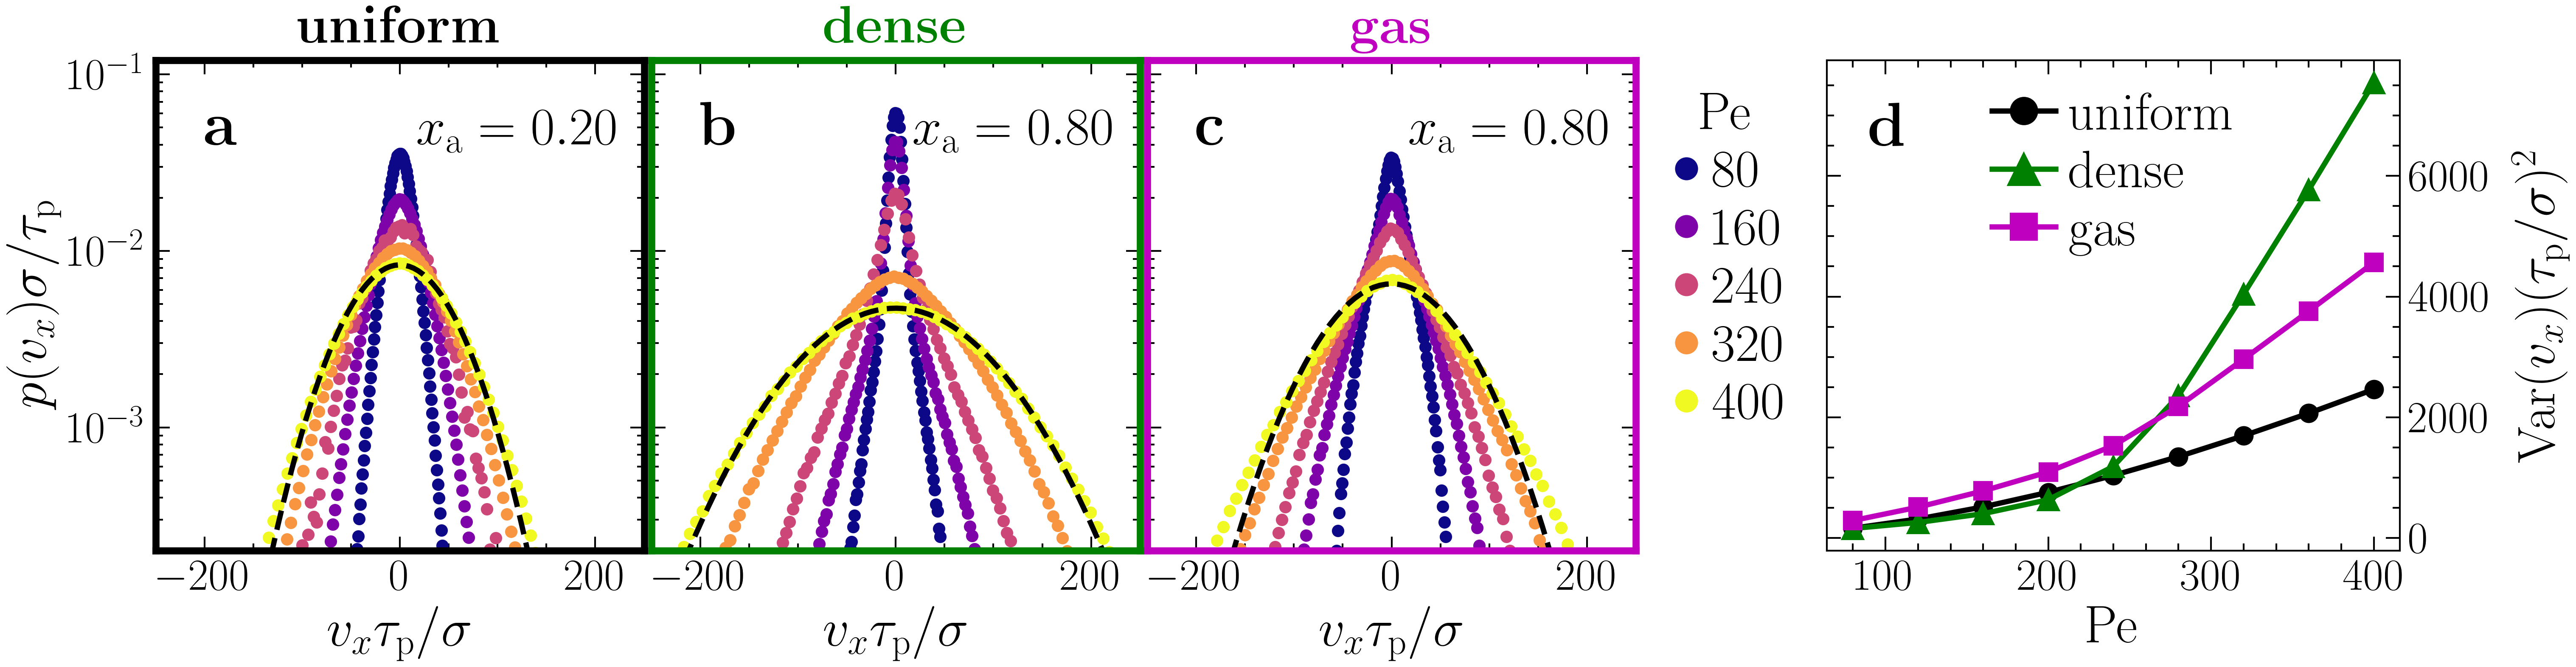
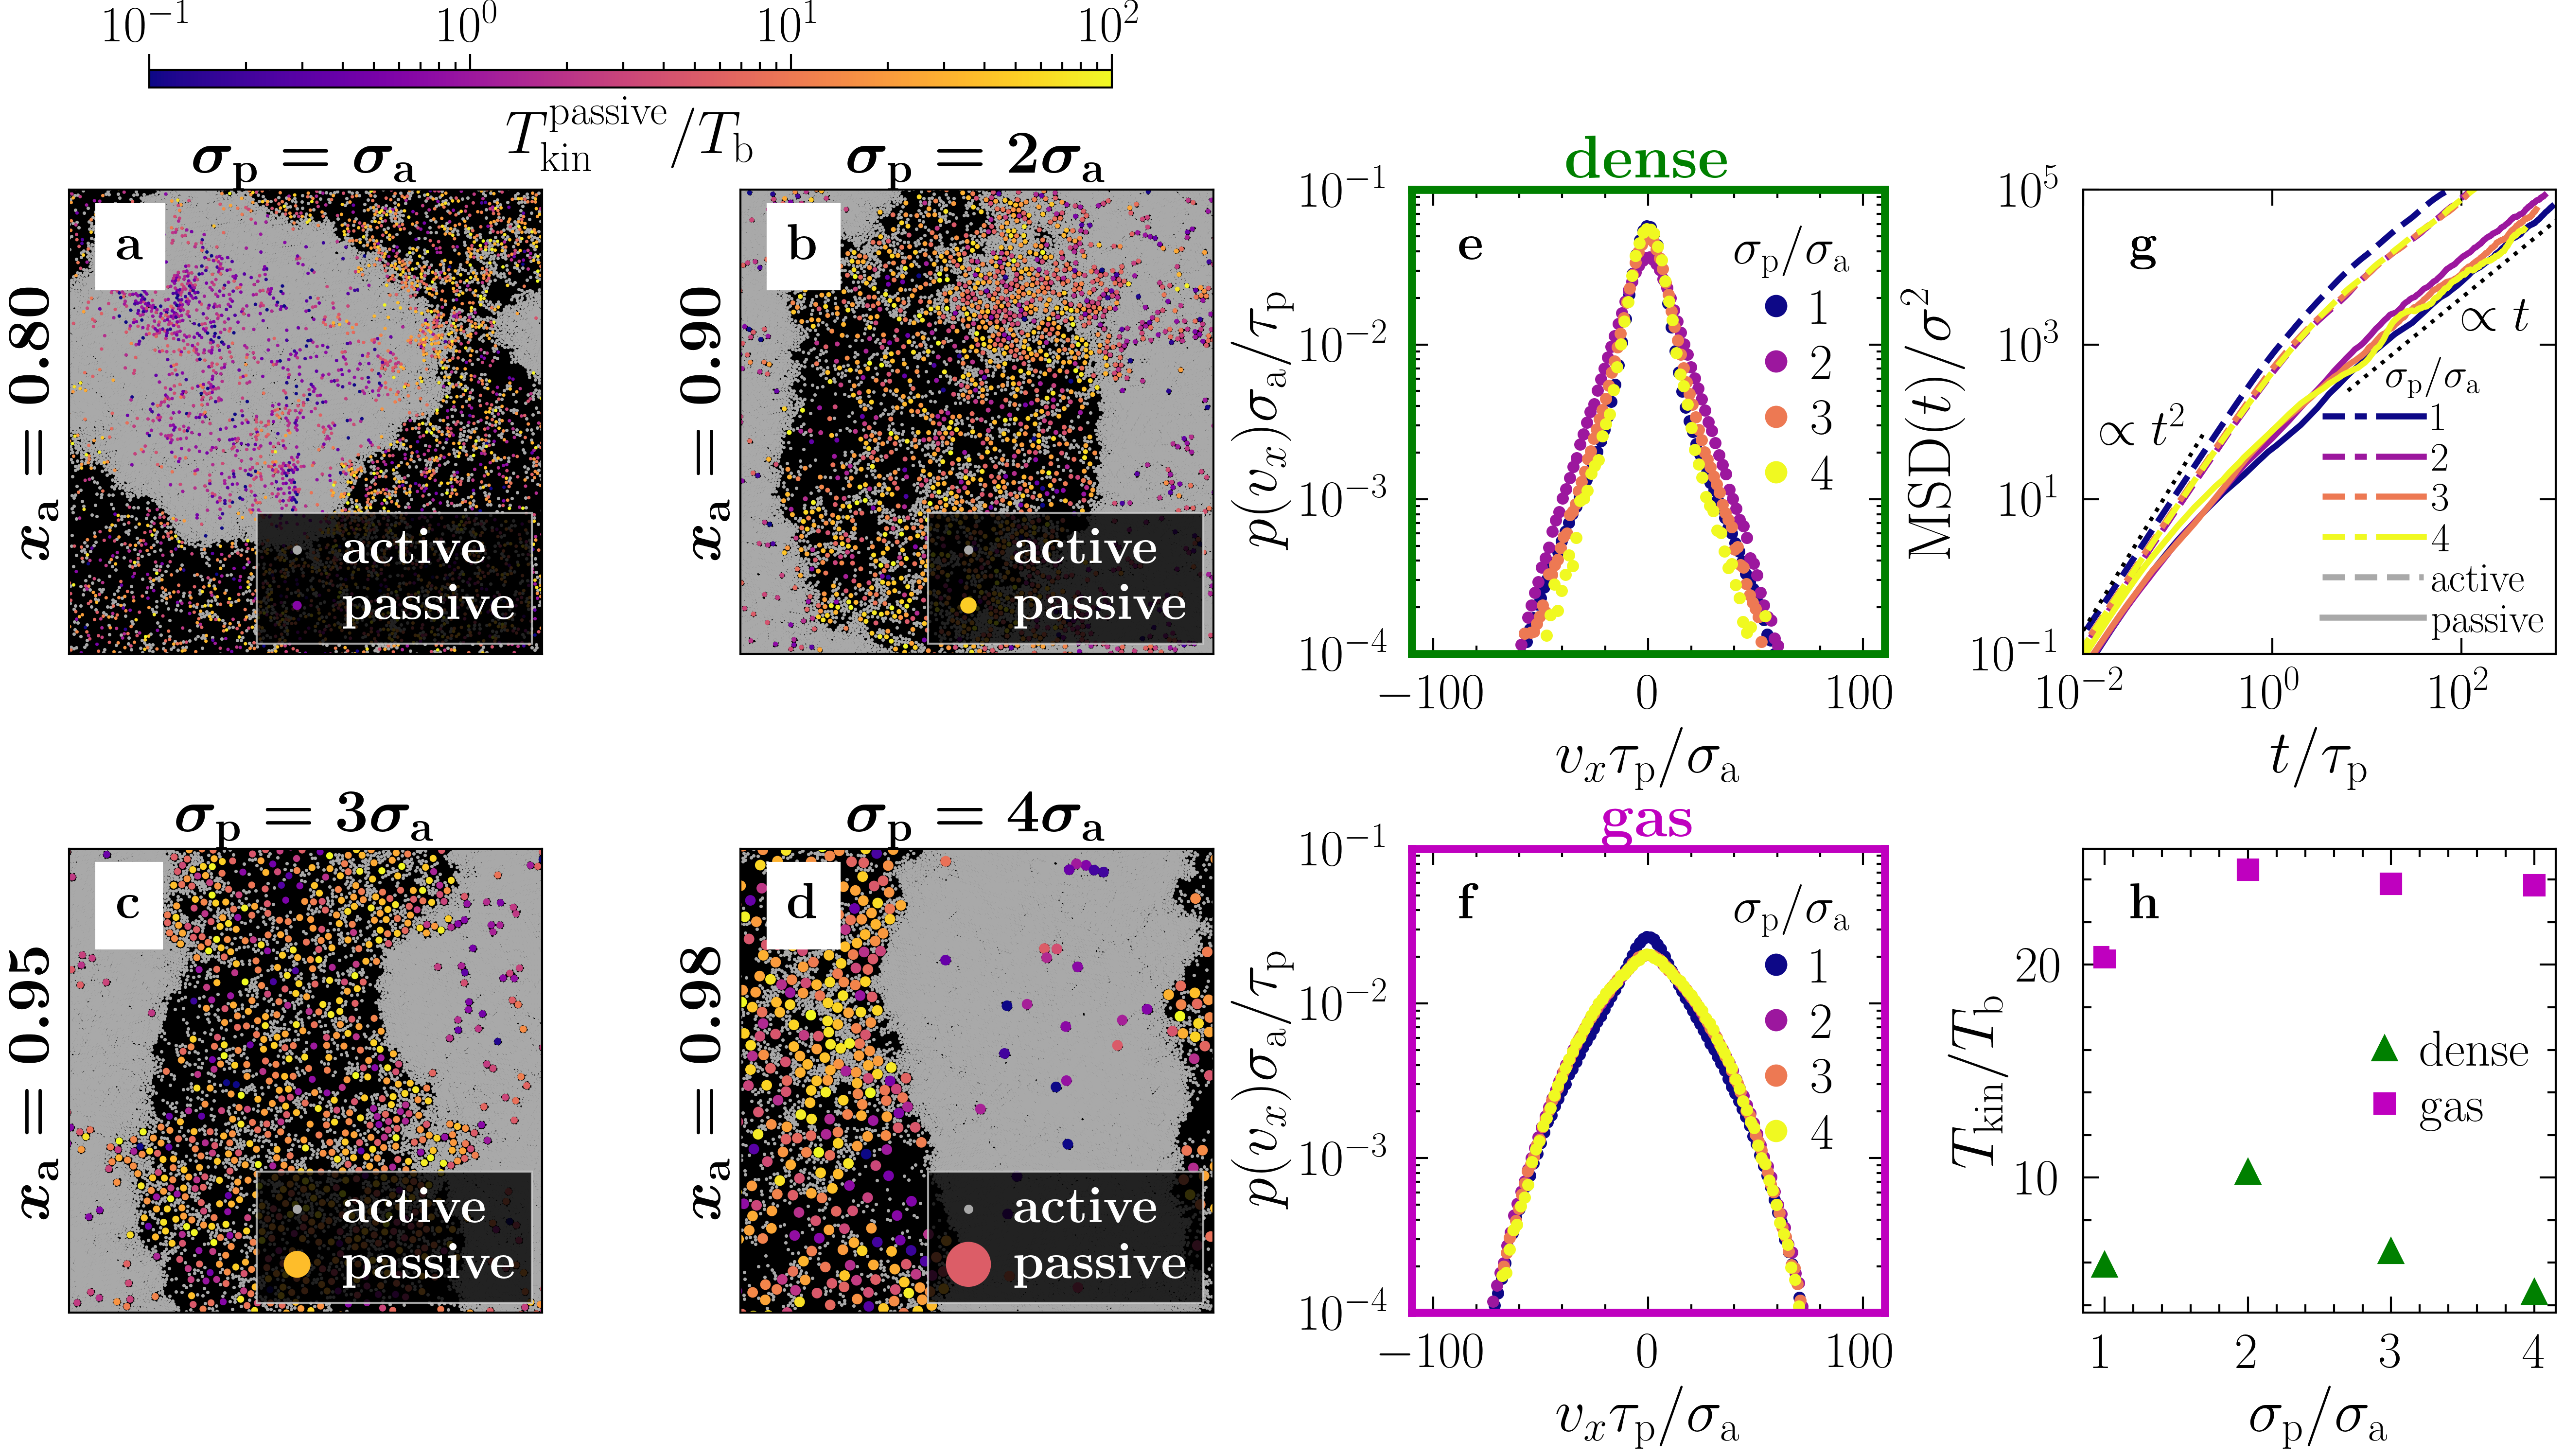
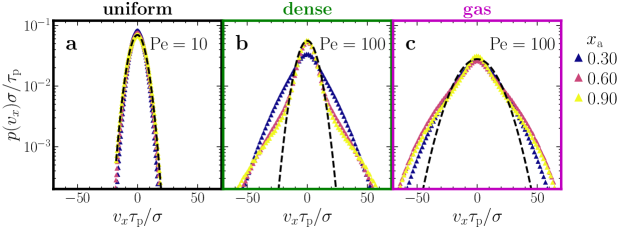
In single component systems made of inertial active Brownian particles, it has been shown that the frequent collisions that occur within the dense phase effectively slow down the active particles [11, 16]. Effectively, this is similar to the effect of inelastic collisions in driven granular particles [39] and fully consistent with our observations at moderate Péclet numbers. We now explore the mechanism underlying our previous observations, that in mixtures of overdamped ABPs and inertial PBPs the opposite can happen such that dense liquid-like droplets are persistently hotter than the surrounding gas. To this end, we now analyze the velocity distribution of the passive tracers in the uniform regime at and in the phases-separated regime at , which broadens as Pe increases (Fig. 3a–c). Strikingly, if and only if the active particles are sufficiently fast (), the velocity distribution broadens more in the dense phase than in the dilute phase (Fig. 3b–d). This means that increasing the speed of the active particles (i.e., increasing Pe) has a much stronger effect on the speed of the passive particles in the dense regime (where collisions are more frequent) than in the dilute regime, which ultimately leads to hot liquid-like droplets. What remains open at this stage is why the velocity distribution broadens faster for passive particles in the dense regime than in the dilute regime (only) if the Péclet number is large.
Mechanism II: Correlated active-passive dynamics.
To answer the question which remained open in the last section, we now explore the power balance of the passive particles in the dense and the dilute phase. As we will see, this power balance will point us to correlations between active and passive particles which lead to hot liquid-like droplets at large Pe. To obtain a power balance equation for the PBPs, we first multiply Eq. (7) by and take the ensemble average. With , this leads to
| (1) |
in the steady state, where is the total interaction force on particle and . If we now compare the power balance for particles in the dense and in the gas phase, we can express the kinetic temperature difference as
| (2) |
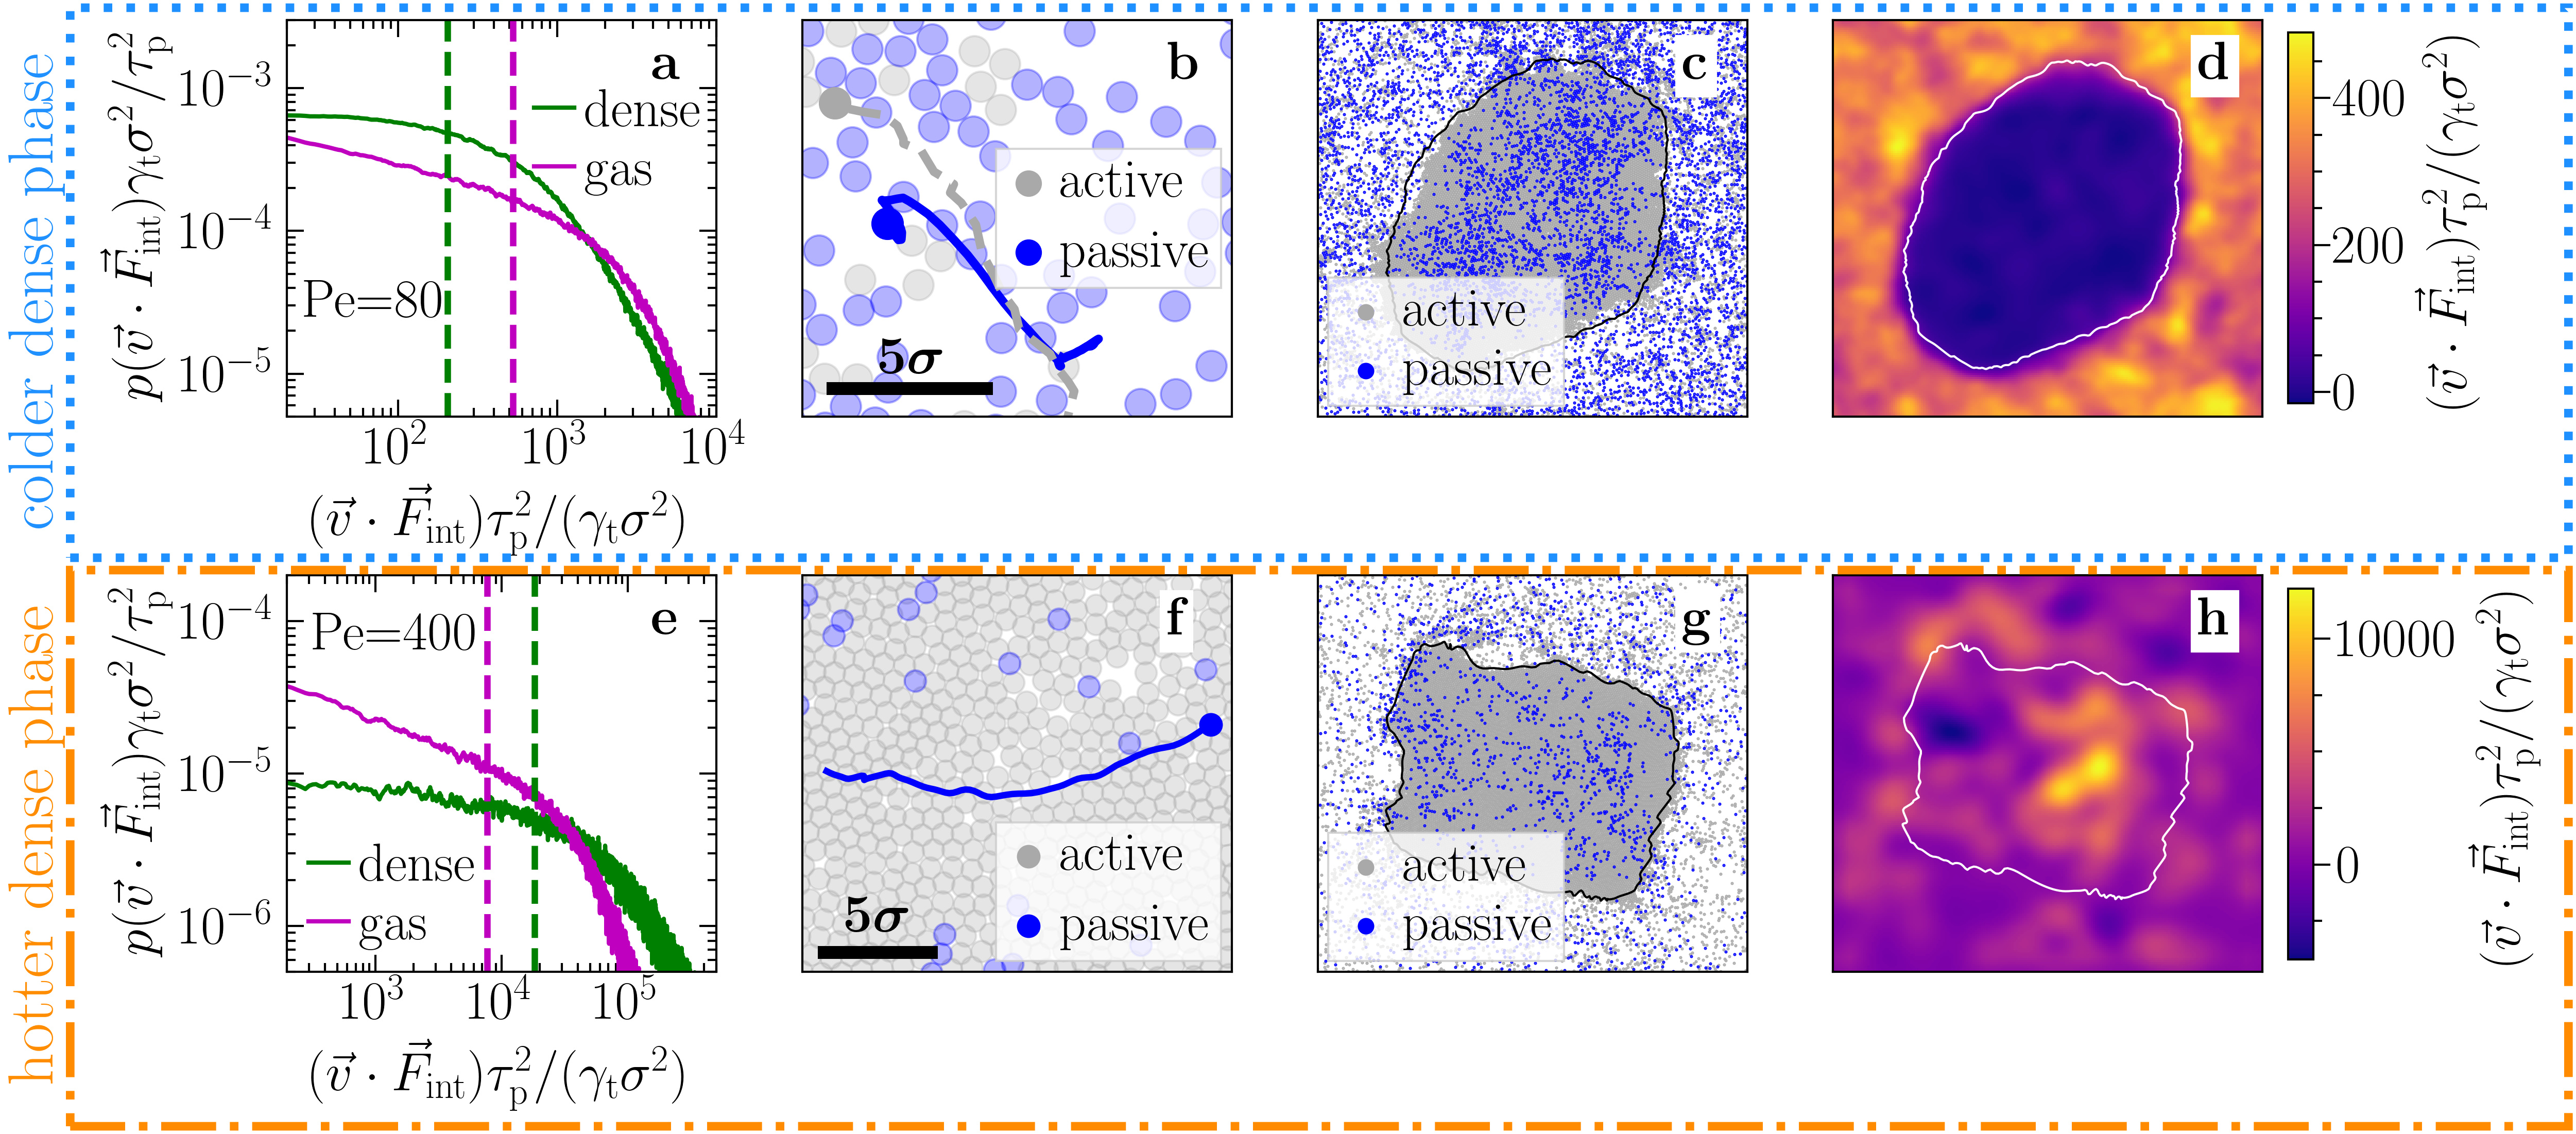
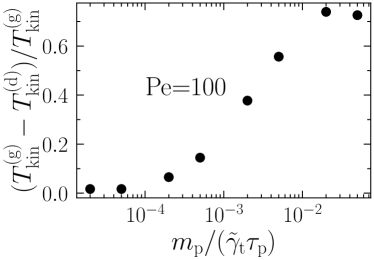
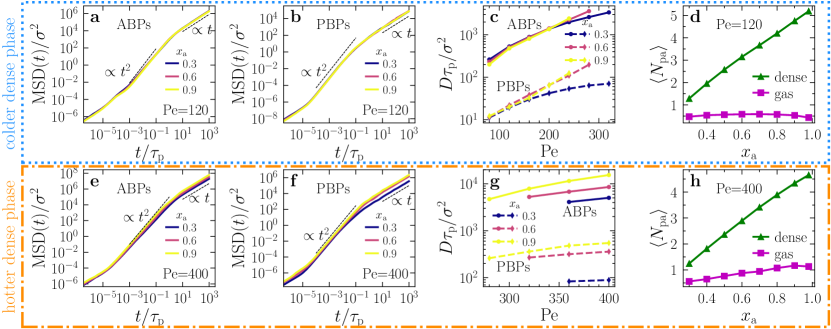
This central equation leads to two important conclusions: First, the kinetic temperature difference between the dense and the gas phase is proportional to , which vanishes if the PBPs are overdamped in accordance with our simulations (Figs. 1d and S3, Supplemental Material). Interestingly, the same proportionality has also been observed for a single-component system consisting of inertial ABPs, where it has been observed that the dense phase is always colder than the gas phase [11]. Second, the temperature difference depends on the interaction between the particles given by the term , which measures how strongly interactions push PBPs forward in their direction of motion. From the probability distribution of the individual values that contribute to the mean (Fig. 4a,e), we obtain significant differences between the dense and the gas phase at large values which determine the sign of the temperature difference: At intermediate Pe, e.g., (Fig. 4a), large values of are more frequent in the gas phase than in the dense phase (see also Fig. 4d). That is, events in which the interaction force and the velocity of the PBPs are aligned and large (e.g., if an ABP is pushing a PBP forward [64]) are more frequent in the gas phase than in the dense phase, in which the particles have significantly less space to move and accelerate. In contrast, at large Pe, such events are more frequent in the dense phase finally leading to the coexistence of hot liquid-like droplets with a colder gas (Fig. 4e,h). Intuitively, this is because at very large Pe, ABPs can (collectively) push PBPs forward over relatively long periods of time even in the dense phase without being stopped by collisions with other particles due to the strong effective self-propulsion force (cf. Movie S4, Supplemental Material). These correlated particle dynamics are exemplarily shown in Fig. 4b,f and schematically visualized in Fig. 5. The correlated dynamics of active and passive particles also lead to a long ballistic regime in the mean-square displacement of the PBPs at intermediate times (similar as for a completely overdamped mixture [59]) before the dynamics of the PBPs becomes diffusive again (Fig. S4f, Supplemental Material). Finally, we can ask why the temperature difference between the hot liquid-like droplets and the cold gas is larger at large . This is because at large , the active particles accumulate in the dense phase and induce stronger collective motions in that place when they are many (see also Fig. S5, Supplemental Material). Conversely, the fraction of active particles in the surrounding gas does not depend much on , and hence, the collision rate in the gas does not increase with .
Non-equilibrium state diagram
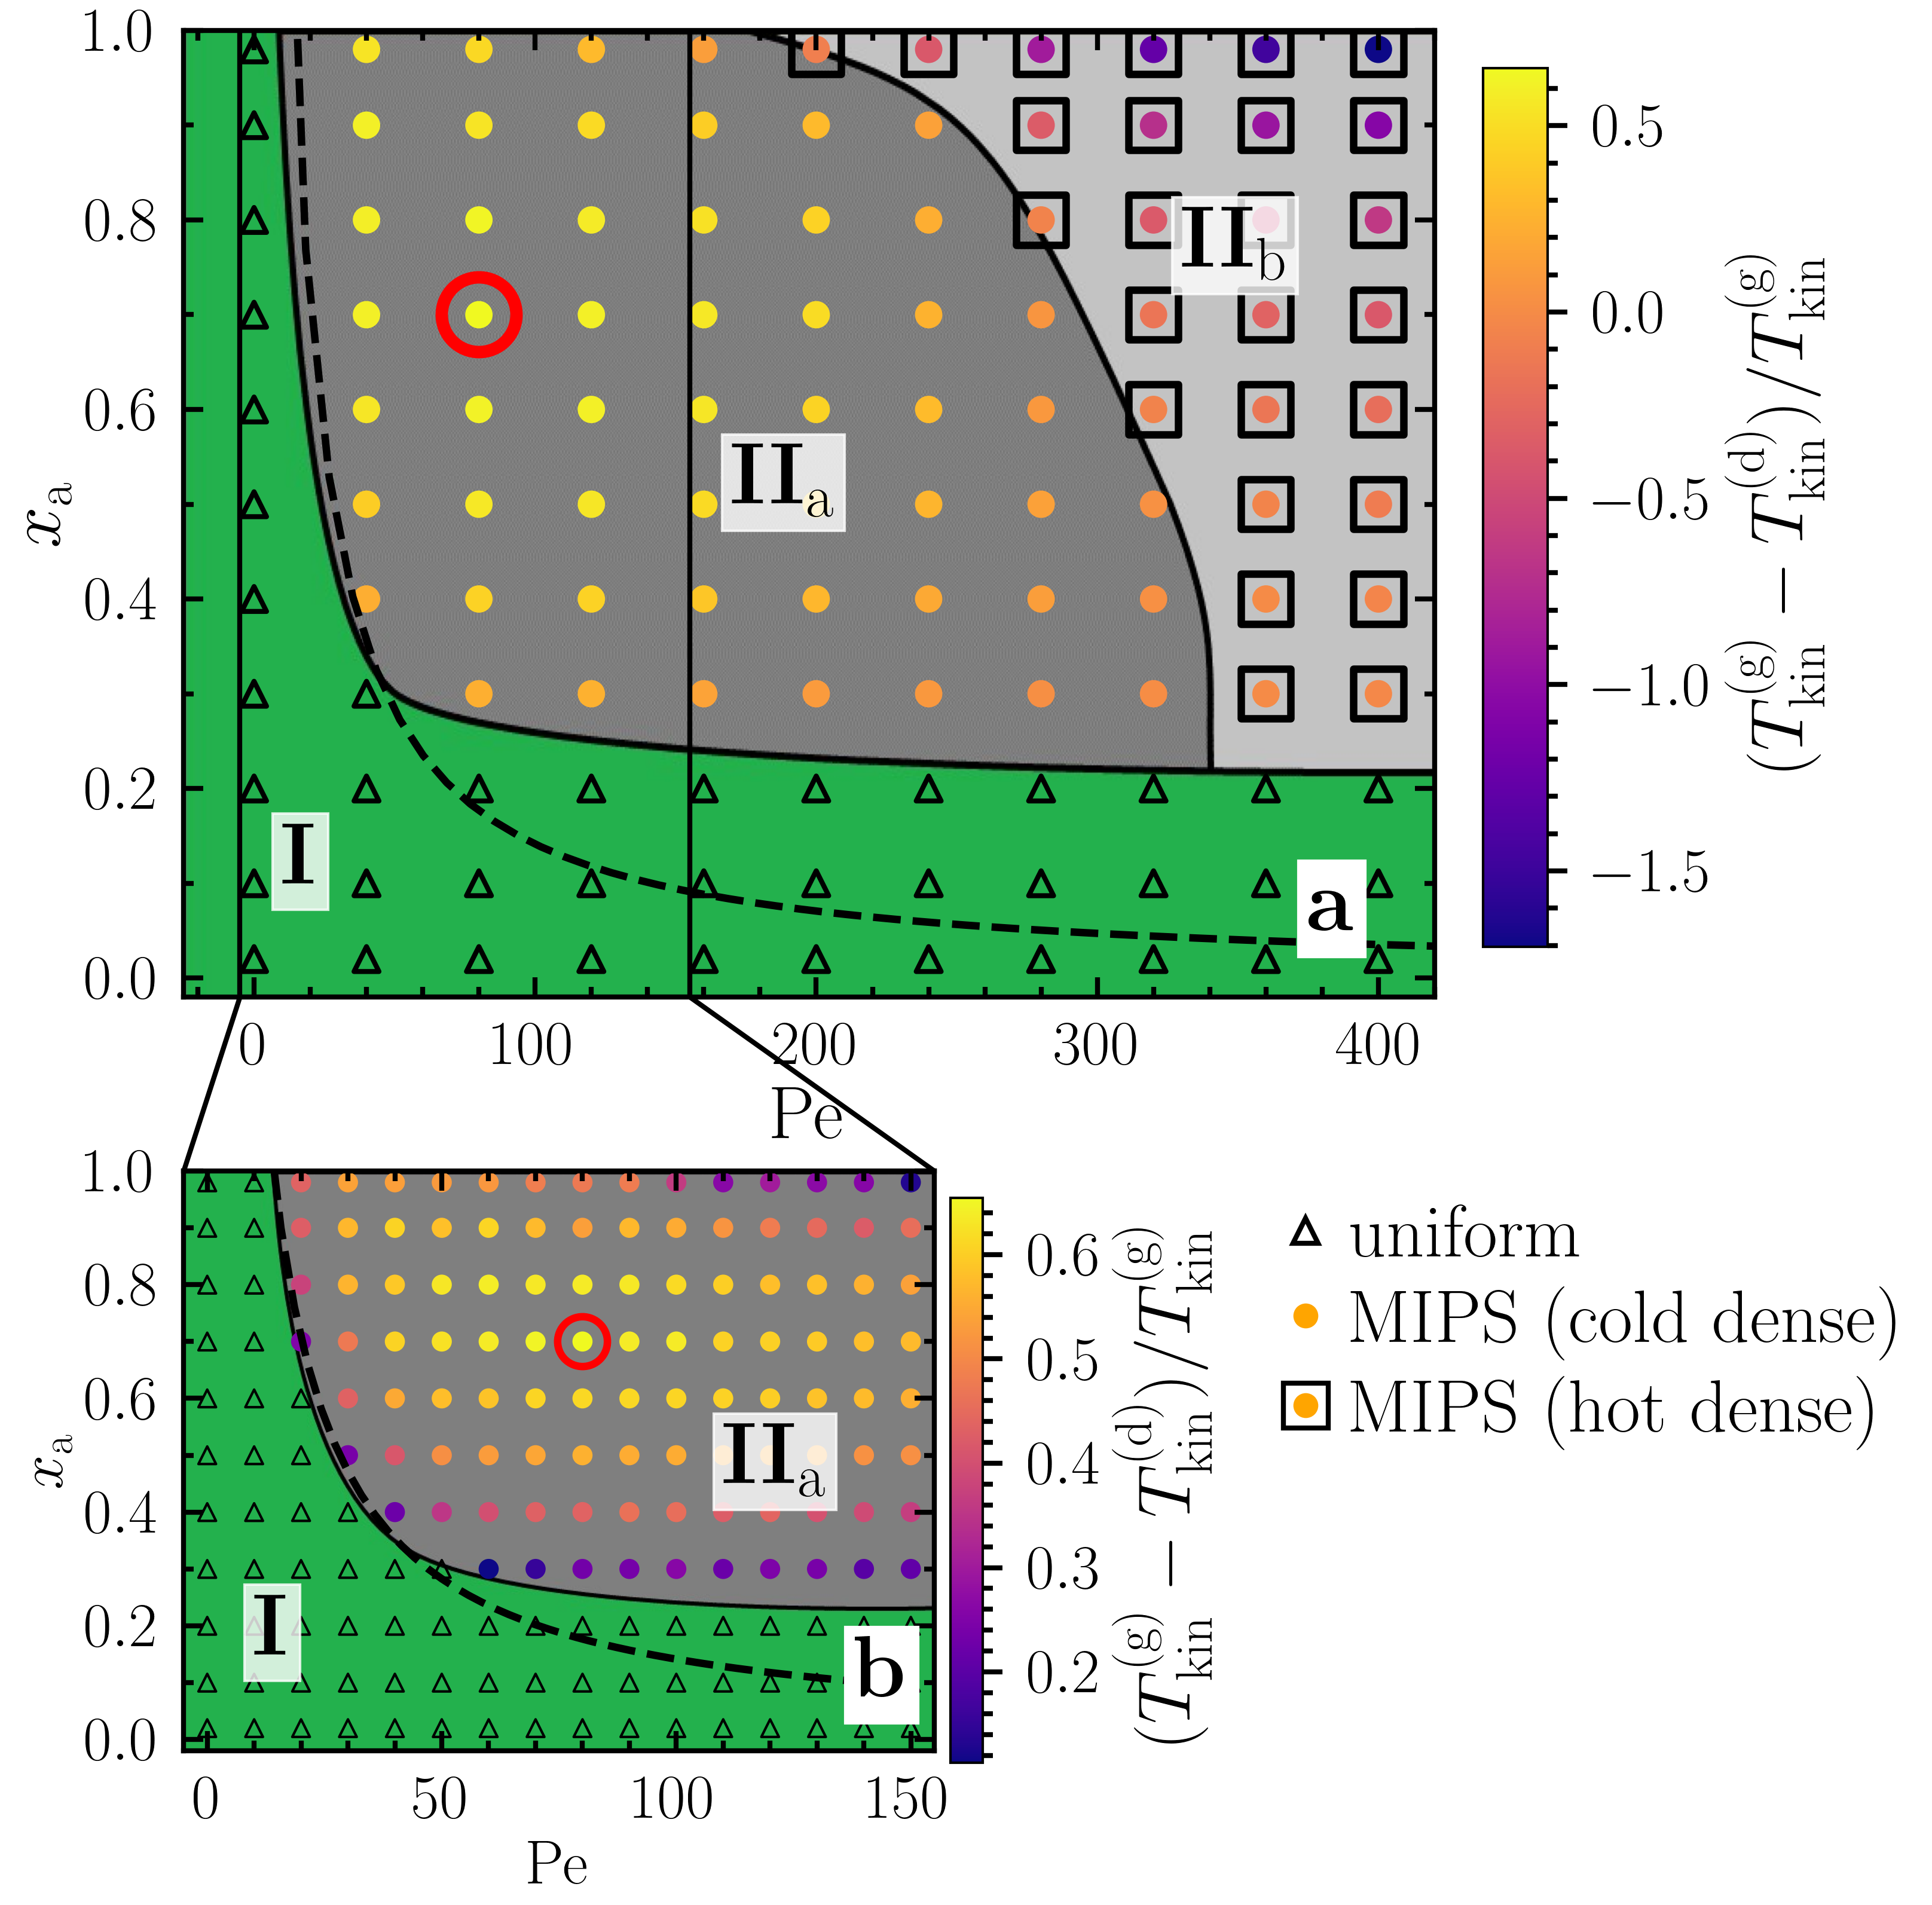
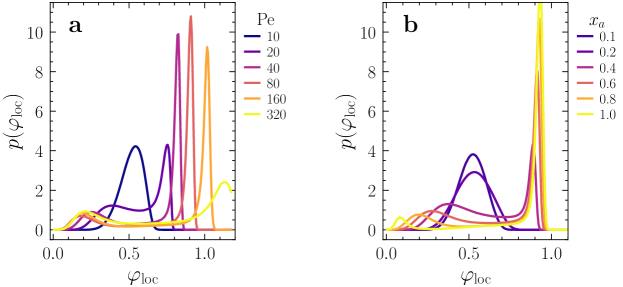
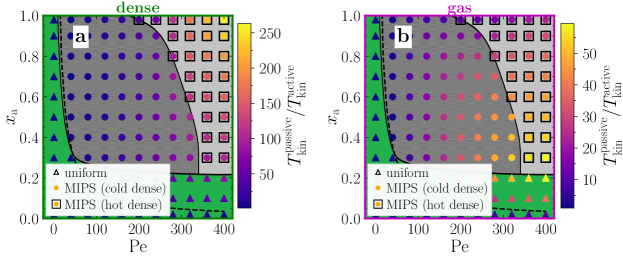
Having seen that the coexistence of hot liquid-like droplets and a cold gas requires sufficiently fast self propulsion of the active particles, i.e., large Pe, we now examine the parameter dependence more systematically. Therefore, we explore the non-equilibrium state diagram by varying and at a constant area fraction . The transition line between the uniform and the MIPS regime is obtained by analyzing the distribution of the local area fraction , which is unimodal in the uniform regime and bimodal in the coexistence regime [25, 30, 65, 66] (Fig. S6, Supplemental Material). We distinguish between the PBPs in the dense and the dilute phase in the steady state and calculate their mean kinetic temperature (see Methods and Fig. S7, Supplemental Material, for details). The system phase separates for large enough fraction of active particles and large enough Pe (Fig. 6). At small Pe, the transition line approximately follows the transition line of a purely overdamped mixture as obtained in Ref. [57], which reads . However, at large Pe, the partially underdamped system requires a larger fraction of active particles to undergo MIPS than the purely overdamped system, which can be understood as a consequence of inertial effects: At large Pe, passive particles are typically fast when they collide with an ABP. Due to their inertia, the passive particles slow down only gradually and sometimes even push aggregated ABPs apart, which can destroy small aggregations. This effect is particularly pronounced for large Pe and opposes the onset of MIPS. Hence, compared to a completely overdamped system, a larger fraction of active particles is required to initiate MIPS at large Pe.
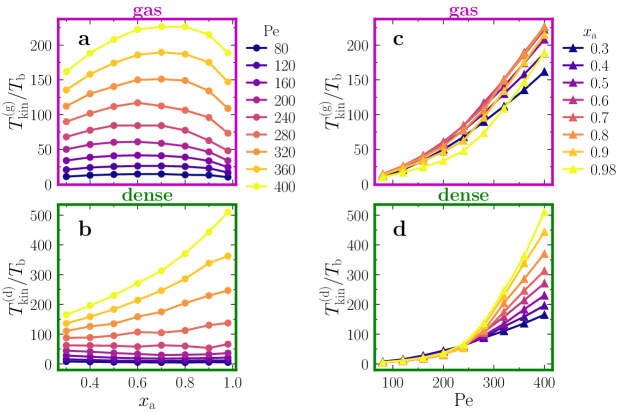
The different kinetic temperatures in the dense and the dilute phase are indicated by the colors in Fig. 6. It can be seen that the temperature difference between the dense and the dilute phase strongly depends on both and Pe: In accordance to the mechanism which we have discussed in the previous section, we find that for intermediate Pe, the dense phase shows a lower kinetic temperature than the dilute phase with a maximum temperature difference around (red circle in Fig. 6). For large Pe and large , the kinetic temperature difference changes its sign, indicated by the squares in Fig. 6a, i.e., hot liquid-like droplets coexist with a cold gas. The latter occurs at lower Pe for increasing because the overall energy transfer from the active to the passive particles is larger for large only in the dense phase, where the active particles increasingly accumulate as increases (see also Figs. 4 and S5, Supplemental Material). This can also be seen from the parameter dependence of the kinetic temperature of the passive particles (Fig. S8, Supplemental Material): The kinetic temperature increases with increasing (and increasing Pe) in the dense phase but shows a maximum at intermediate in the gas phase, where the fraction of active particles hardly increases when increasing beyond a certain point.
Role of inertia
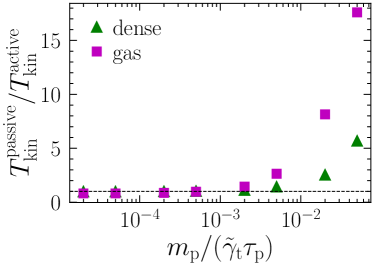
Inertia of the passive particles is a key ingredient to observe coexisting temperatures. This can be seen in Fig. S3 (Supplemental Material) and from Eq. (2): The temperature difference is proportional to the ratio . Thus, in the overdamped limit , the temperature difference vanishes (Fig. 1d) because the passive particles react instantaneously to acting forces. Thus, their motion, and hence, also their kinetic temperature, is dominated by diffusion. In contrast, sufficiently heavy (inertial) tracer particles can store the energy gained during collisions with active particles as kinetic energy such that their kinetic temperature is not determined by diffusion alone. Increasing inertia does also lead to a significant violation of the equipartition theorem both in the dense and the gas phase (Fig. S9, Supplemental Material), which indicates that the system is increasingly far away from equilibrium when increasing inertia of the PBPs.
Role of the particle size
For simplicity, we have considered active and passive particles with the same size and the same drag coefficients so far but with significantly different material density. Now, we show that persistent temperature differences also occur when the passive particles are significantly larger than the active ones. We have varied the ratio keeping as well as and fixed. For the drag coefficient of the passive particles, we choose . Our results are exemplarily shown in Fig. 7 for . Here, we observe a persistent kinetic temperature difference between the passive particles in the dense and the gas phase even for significantly different particle sizes (Fig. 7h).This temperature difference is also visible in the velocity distributions, which are broader in the gas phase compared to the dense phase (Fig. 7e,f).
How representative is the kinetic temperature?
So far, we have used the kinetic energy of the particles to define a kinetic temperature following Refs. [11, 16, 67, 68] as a measure for the temperature (see Methods for details). The kinetic temperature has frequently been used for granular systems [69, 31, 39, 40, 41, 42, 32, 70, 71] and is also well-defined in non-equilibrium systems [72]. In equilibrium, the kinetic temperature is equal to the thermodynamic temperature [60]. In the binary mixtures of active and passive particles studied in the present work, the kinetic temperature of the passive tracer particles, which measures the velocity fluctuations, has two contributions: one from the thermal Brownian motion and one originating from collisions with surrounding active and passive particles. From the previously discussed results, we know that the latter cause the kinetic temperature difference between passive particles in the dense and the gas phase. Additionally, we analyzed the velocity distribution of the passive particles in the dense and the gas phase. The variance of this distribution (Fig. 3d) exhibits the same behavior as the kinetic temperature. Remarkably, the velocity distributions are approximately Gaussian for sufficiently large Pe (Fig. 3a–c). We exploit this to define a Maxwell-Boltzmann temperature by fitting a Maxwell-Boltzmann distribution to the velocity distribution with one free fit parameter . For the data shown in Fig. 3b,c at we obtain (liquid-like droplets) and (gas). This shows that mixtures of inertial tracers and overdamped ABPs can lead to self-organized hot liquid-like droplets that coexist with a colder gas also in terms of the Maxwell-Boltzmann temperature.
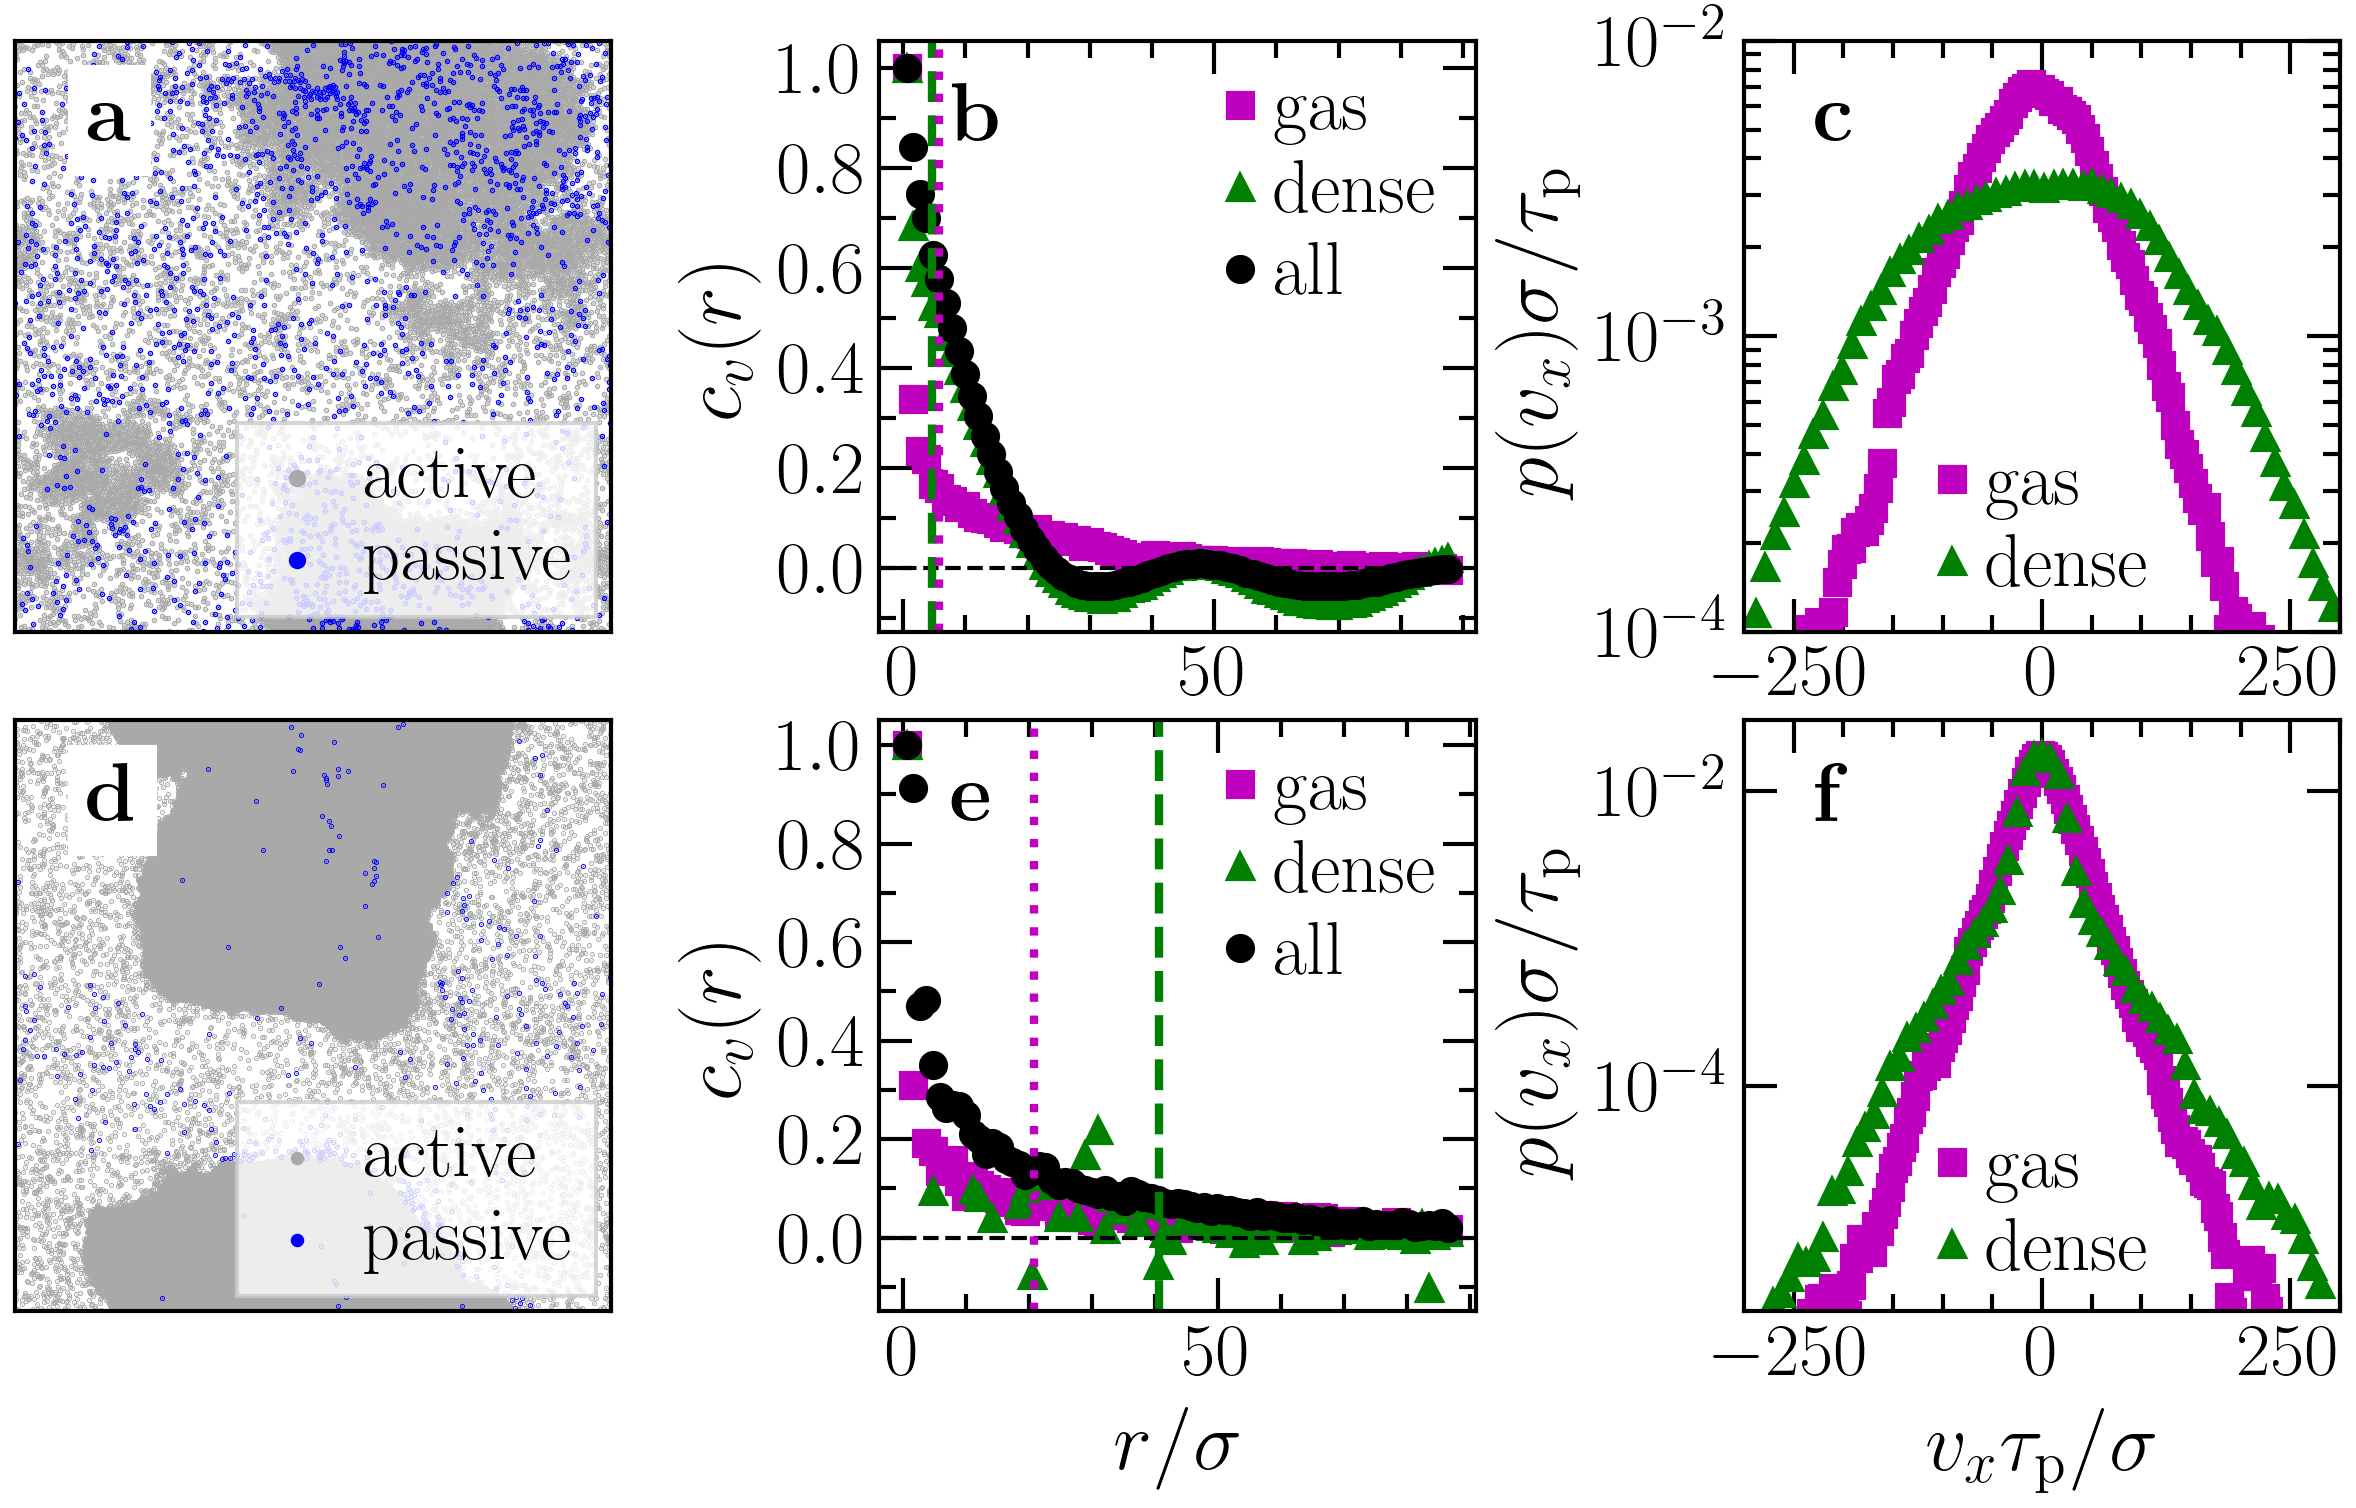
Since both the kinetic temperature and the Maxwell-Boltzmann temperature are sensitive to local collective motion patterns of the particles and a sensible measure for the temperature of the particles should measure their independent motion, we now explore if spatial velocity correlations of the passive tracer particles are crucial for the emergence of a temperature difference. For that we calculate the spatial velocity correlation function [73]
| (3) |
As shown in Fig. 8b (and Movie S4, Supplemental Material), velocity correlations are indeed present between the passive particles in the dense phase over a significant spatial range. The mean distance between the passive particles in the dense phase calculated from a Voronoi tessellation is given by approximately for the case shown in Fig. 8a–c and therefore, much smaller than the length scale of the velocity correlations. To see if these spatial correlations are crucial for the emergence of a temperature difference, we did a simulation with particles and at (Fig. 8d–f). Here, the correlations between PBPs are significantly reduced and the mean distance between passive particles in the dense phase is approximately . In this parameter regime, the temperature calculation is not much influenced by local collective motion of the PBPs. Remarkably, as demonstrated in Fig. 8f and as shown in Tab. S1 (Supplemental Material), the passive particles in the dense phase still have a higher temperature than the passive particles in the gas phase. This shows that the coexistence of hot liquid-like droplets with a colder gas is really induced by the interactions between the active and the passive particles in the dense phase and should also occur for other (fluctuation-based) temperature definitions that are not sensitive to collective motions of the passive particles.
To explicitly see this, we additionally calculated a relative kinetic temperature by using the relative velocity of each particle to the mean velocity of particles in the vicinity
| (4) |
where denotes the mean velocity of all particles in a circle of radius around the tagged particle. As shown exemplarily in Tab. S1 (Supplemental Material), the temperature difference is also visible for the relative kinetic temperature and thus, it is not only a consequence of the observed collective motion but rather a pure effect of the particle interactions. As a result, the key phenomenon of the present work – the coexistence of hot liquid-like droplets and a cold gas – is robust with respect to the choice of the definition of the particle temperature. For a discussion regarding the role of the solvent we refer the reader to Ref. [16].
Discussion
Mixing overdamped active Brownian particles and underdamped passive Brownian particles leads to a persistent kinetic temperature difference between the dense and the dilute phase when the system undergoes motility-induced phase separation. This temperature difference emerges despite the fact that each of the two components on their own would show a uniform temperature profile. Counterintuitively, the dilute gas-like phase is not always hotter than the dense liquid-like phase but at large Péclet number and fraction of active particles, hot liquid-like droplets can coexist with a cold gas. This temperature reversal results from the competition of two effects: The trapping of passive particles in the dense cluster provokes a cold liquid whereas the emergence of persistent correlated active-passive particle trajectories in the dense phase primarily heats up the liquid. While the latter effect has not been known in the literature so far, we have shown that it can even overcome the previously discussed trapping effect and lead to the coexistence of a cold gas and hot liquid-like droplets. This phenomenon is robust with respect to the choice of definition of particle temperature and particle-size effects. Besides their conceptual relevance, our results open a route to create a persistent temperature profile in systems like dusty plasmas or passive granulates by inserting generic active particles like bacteria, algae, or synthetic colloidal microswimmers.
Methods
Model
The active and passive Brownian particles (ABPs and PBPs) are represented by (slightly soft) spheres in two spatial dimensions. The dynamics of the active particles is made overdamped by choosing a very small mass and a small moment of inertia (corresponding to a rigid sphere). The active particles feature an effective self-propulsion force , where denote the (terminal) self-propulsion speed and the orientation of the -th active particle (), respectively. The position and the orientation angle of the -th active particle evolve according to and , respectively, where the velocity and the angular velocity evolve as
| (5) | ||||
| (6) |
where represents the bath temperature and , are the translational and rotational drag coefficients, respectively. The passive particles feature a comparatively large mass and their velocity evolves as
| (7) |
with particle index and drag coefficient . The interaction potential , is modeled by the Weeks-Chandler-Anderson (WCA) potential [74]
with particle diameter and strength . For the simulations with active and passive particles of different diameters, the effective diameter for the interaction between the active and passive particles is chosen as , where and denote the diameters of the active and passive particles, respectively. Finally, and denote Gaussian white noise with zero mean and unit variance.
Simulation details
In all simulations, we fix , to recover overdamped dynamics for the active particles [11]. For the passive particles, we fix with the persistence time . Furthermore, we set , , and (unless otherwise indicated), and we use systems with particles. We choose and vary Pe and the fraction of the active particles. The total area fraction is set to , where denotes the area of the quadratic simulation box. The Langevin equations [Eqs. (5)–(7)] are solved numerically in a quadratic box with periodic boundary conditions and with a time step using LAMMPS [58] first for a time of to reach a steady state and afterwards for a time of for computing time averages of observables in the steady state.
Kinetic temperature
Following Refs. [11, 67, 68, 16], we define the temperature of the active and passive particles based on their kinetic energy as
which is well-defined also in non-equilibrium systems [72].
To calculate the kinetic temperature of the dense and the dilute phase separately, we distinguish between passive particles in the dense and the gas phase by identifying the largest cluster in the system using the criterion that two particles belong to the same cluster if their distance to each other is smaller than the cutoff distance of the WCA potential. Then, all particles in the largest cluster are considered as the dense phase and all other particles as the gas phase (Fig. S7, Supplemental Material). Finally, the kinetic temperature of the passive particles in the dense and the gas phase is obtained by averaging over all passive particles in the dense phase and all passive particles in the gas phase, respectively.
References
- Dickinson [2011] H. W. Dickinson, A Short History of the Steam Engine (Cambridge University Press, Cambridge, 2011).
- Stichlmair et al. [2021] J. Stichlmair, H. Klein, and S. Rehfeldt, Distillation (Wiley, 2021).
- Lei et al. [2003] Z. Lei, C. Li, and B. Chen, Extractive Distillation: A Review, Sep. Purif. Rev. 32, 121 (2003).
- Rossnagel [2003] S. M. Rossnagel, Thin film deposition with physical vapor deposition and related technologies, J. Vac. Sci. Technol. A Vacuum, Surfaces, Film. 21, S74 (2003).
- Mattox [2010] D. M. Mattox, Handbook of Physical Vapor Deposition (PVD) Processing, second edition ed. (William Andrew Publishing, Boston, 2010).
- Hurwitz and Manga [2017] S. Hurwitz and M. Manga, The Fascinating and Complex Dynamics of Geyser Eruptions, Annu. Rev. Earth Planet. Sci. 45, 31 (2017).
- Redner et al. [2013] G. S. Redner, M. F. Hagan, and A. Baskaran, Structure and Dynamics of a Phase-Separating Active Colloidal Fluid, Phys. Rev. Lett. 110, 055701 (2013).
- Levis et al. [2017] D. Levis, J. Codina, and I. Pagonabarraga, Active Brownian equation of state: metastability and phase coexistence, Soft Matter 13, 8113 (2017).
- Turci and Wilding [2021] F. Turci and N. B. Wilding, Phase Separation and Multibody Effects in Three-Dimensional Active Brownian Particles, Phys. Rev. Lett. 126, 038002 (2021).
- O’Byrne and Tailleur [2020] J. O’Byrne and J. Tailleur, Lamellar to Micellar Phases and Beyond: When Tactic Active Systems Admit Free Energy Functionals, Phys. Rev. Lett. 125, 208003 (2020).
- Mandal et al. [2019] S. Mandal, B. Liebchen, and H. Löwen, Motility-Induced Temperature Difference in Coexisting Phases, Phys. Rev. Lett. 123, 228001 (2019).
- Bechinger et al. [2016] C. Bechinger, R. Di Leonardo, H. Löwen, C. Reichhardt, G. Volpe, and G. Volpe, Active Particles in Complex and Crowded Environments, Rev. Mod. Phys. 88, 045006 (2016).
- Menzel [2015] A. M. Menzel, Tuned, driven, and active soft matter, Phys. Rep. 554, 1 (2015).
- Marchetti et al. [2013] M. C. Marchetti, J. F. Joanny, S. Ramaswamy, T. B. Liverpool, J. Prost, M. Rao, and R. A. Simha, Hydrodynamics of soft active matter, Rev. Mod. Phys. 85, 1143 (2013).
- Petrelli et al. [2020] I. Petrelli, L. F. Cugliandolo, G. Gonnella, and A. Suma, Effective temperatures in inhomogeneous passive and active bidimensional Brownian particle systems, Phys. Rev. E 102, 012609 (2020).
- Hecht et al. [2022] L. Hecht, S. Mandal, H. Löwen, and B. Liebchen, Active Refrigerators Powered by Inertia, Phys. Rev. Lett. 129, 178001 (2022).
- Ye et al. [2020] S. Ye, P. Liu, F. Ye, K. Chen, and M. Yang, Active noise experienced by a passive particle trapped in an active bath, Soft Matter 16, 4655 (2020).
- Cates and Tailleur [2015] M. E. Cates and J. Tailleur, Motility-Induced Phase Separation, Annu. Rev. Condens. Matter Phys. 6, 219 (2015).
- Tailleur and Cates [2008] J. Tailleur and M. E. Cates, Statistical Mechanics of Interacting Run-and-Tumble Bacteria, Phys. Rev. Lett. 100, 218103 (2008).
- Buttinoni et al. [2013] I. Buttinoni, J. Bialké, F. Kümmel, H. Löwen, C. Bechinger, and T. Speck, Dynamical Clustering and Phase Separation in Suspensions of Self-Propelled Colloidal Particles, Phys. Rev. Lett. 110, 238301 (2013).
- Stenhammar et al. [2013] J. Stenhammar, A. Tiribocchi, R. J. Allen, D. Marenduzzo, and M. E. Cates, Continuum Theory of Phase Separation Kinetics for Active Brownian Particles, Phys. Rev. Lett. 111, 145702 (2013).
- Mokhtari et al. [2017] Z. Mokhtari, T. Aspelmeier, and A. Zippelius, Collective rotations of active particles interacting with obstacles, Europhys. Lett. 120, 14001 (2017).
- Patch et al. [2017] A. Patch, D. Yllanes, and M. C. Marchetti, Kinetics of motility-induced phase separation and swim pressure, Phys. Rev. E 95, 012601 (2017).
- Siebert et al. [2018] J. T. Siebert, F. Dittrich, F. Schmid, K. Binder, T. Speck, and P. Virnau, Critical behavior of active Brownian particles, Phys. Rev. E 98, 030601(R) (2018).
- Digregorio et al. [2018] P. Digregorio, D. Levis, A. Suma, L. F. Cugliandolo, G. Gonnella, and I. Pagonabarraga, Full Phase Diagram of Active Brownian Disks: From Melting to Motility-Induced Phase Separation, Phys. Rev. Lett. 121, 098003 (2018).
- Löwen [2020] H. Löwen, Inertial effects of self-propelled particles: From active Brownian to active Langevin motion, J. Chem. Phys. 152, 040901 (2020).
- Liao et al. [2020] G.-J. Liao, C. K. Hall, and S. H. L. Klapp, Dynamical self-assembly of dipolar active Brownian particles in two dimensions, Soft Matter 16, 2208 (2020).
- te Vrugt et al. [2023] M. te Vrugt, J. Bickmann, and R. Wittkowski, How to derive a predictive field theory for active Brownian particles: a step-by-step tutorial, J. Phys. Condens. Matter 35, 313001 (2023).
- Dai et al. [2020] C. Dai, I. R. Bruss, and S. C. Glotzer, Phase separation and state oscillation of active inertial particles, Soft Matter 16, 2847 (2020).
- Su et al. [2021] J. Su, H. Jiang, and Z. Hou, Inertia-induced nucleation-like motility-induced phase separation, New J. Phys. 23, 013005 (2021).
- Komatsu and Tanaka [2015] Y. Komatsu and H. Tanaka, Roles of Energy Dissipation in a Liquid-Solid Transition of Out-of-Equilibrium Systems, Phys. Rev. X 5, 031025 (2015).
- Roeller et al. [2011] K. Roeller, J. P. D. Clewett, R. M. Bowley, S. Herminghaus, and M. R. Swift, Liquid-Gas Phase Separation in Confined Vibrated Dry Granular Matter, Phys. Rev. Lett. 107, 048002 (2011).
- Schindler and Kapfer [2019] T. Schindler and S. C. Kapfer, Nonequilibrium steady states, coexistence, and criticality in driven quasi-two-dimensional granular matter, Phys. Rev. E 99, 022902 (2019).
- Goldhirsch and Zanetti [1993] I. Goldhirsch and G. Zanetti, Clustering instability in dissipative gases, Phys. Rev. Lett. 70, 1619 (1993).
- Paolotti et al. [2004] D. Paolotti, A. Barrat, U. Marini Bettolo Marconi, and A. Puglisi, Thermal convection in monodisperse and bidisperse granular gases: A simulation study, Phys. Rev. E 69, 061304 (2004).
- Garzó et al. [2018] V. Garzó, A. Santos, and G. M. Kremer, Impact of roughness on the instability of a free-cooling granular gas, Phys. Rev. E 97, 052901 (2018).
- Fullmer and Hrenya [2017] W. D. Fullmer and C. M. Hrenya, The Clustering Instability in Rapid Granular and Gas-Solid Flows, Annu. Rev. Fluid Mech. 49, 485 (2017).
- Puglisi et al. [1998] A. Puglisi, V. Loreto, U. M. B. Marconi, A. Petri, and A. Vulpiani, Clustering and Non-Gaussian Behavior in Granular Matter, Phys. Rev. Lett. 81, 3848 (1998).
- Prevost et al. [2004] A. Prevost, P. Melby, D. A. Egolf, and J. S. Urbach, Nonequilibrium two-phase coexistence in a confined granular layer, Phys. Rev. E 70, 050301 (2004).
- Lobkovsky et al. [2009] A. Lobkovsky, F. V. Reyes, and J. Urbach, The effects of forcing and dissipation on phase transitions in thin granular layers, Eur. Phys. J. Spec. Top. 179, 113 (2009).
- Melby et al. [2005] P. Melby, F. V. Reyes, A. Prevost, R. Robertson, P. Kumar, D. A. Egolf, and J. S. Urbach, The dynamics of thin vibrated granular layers, J. Phys. Condens. Matter 17, S2689 (2005).
- Reyes and Urbach [2008] F. V. Reyes and J. S. Urbach, Effect of inelasticity on the phase transitions of a thin vibrated granular layer, Phys. Rev. E 78, 051301 (2008).
- Scholz and Pöschel [2017] C. Scholz and T. Pöschel, Velocity Distribution of a Homogeneously Driven Two-Dimensional Granular Gas, Phys. Rev. Lett. 118, 198003 (2017).
- Pöschel and Luding [2001] T. Pöschel and S. Luding, Granular Gases, edited by T. Pöschel and S. Luding, Lecture Notes in Physics, Vol. 564 (Springer, Berlin, Heidelberg, 2001).
- Valeriani et al. [2011] C. Valeriani, M. Li, J. Novosel, J. Arlt, and D. Marenduzzo, Colloids in a bacterial bath: simulations and experiments, Soft Matter 7, 5228 (2011).
- Ramos et al. [2020] G. Ramos, M. L. Cordero, and R. Soto, Bacteria driving droplets, Soft Matter 16, 1359 (2020).
- Angelani et al. [2011] L. Angelani, C. Maggi, M. L. Bernardini, A. Rizzo, and R. Di Leonardo, Effective Interactions between Colloidal Particles Suspended in a Bath of Swimming Cells, Phys. Rev. Lett. 107, 138302 (2011).
- Elgeti et al. [2015] J. Elgeti, R. G. Winkler, and G. Gompper, Physics of microswimmers—single particle motion and collective behavior: a review, Rep. Prog. Phys. 78, 056601 (2015).
- Huang et al. [2021] M. Huang, W. Hu, S. Yang, Q.-X. Liu, and H. P. Zhang, Circular swimming motility and disordered hyperuniform state in an algae system., Proc. Natl. Acad. Sci. U. S. A. 118, 10.1073/pnas.2100493118 (2021).
- Ramamonjy et al. [2022] A. Ramamonjy, J. Dervaux, and P. Brunet, Nonlinear Phototaxis and Instabilities in Suspensions of Light-Seeking Algae, Phys. Rev. Lett. 128, 258101 (2022).
- Howse et al. [2007] J. R. Howse, R. A. L. Jones, A. J. Ryan, T. Gough, R. Vafabakhsh, and R. Golestanian, Self-Motile Colloidal Particles: From Directed Propulsion to Random Walk, Phys. Rev. Lett. 99, 048102 (2007).
- Auschra et al. [2021] S. Auschra, A. Bregulla, K. Kroy, and F. Cichos, Thermotaxis of Janus particles, Eur. Phys. J. E 44, 90 (2021).
- Kurzthaler et al. [2018] C. Kurzthaler, C. Devailly, J. Arlt, T. Franosch, W. C. Poon, V. A. Martinez, and A. T. Brown, Probing the Spatiotemporal Dynamics of Catalytic Janus Particles with Single-Particle Tracking and Differential Dynamic Microscopy, Phys. Rev. Lett. 121, 078001 (2018).
- Romanczuk et al. [2012] P. Romanczuk, M. Bär, W. Ebeling, B. Lindner, and L. Schimansky-Geier, Active Brownian particles, Eur. Phys. J. Spec. Top. 202, 1 (2012).
- Gutierrez-Martinez and Sandoval [2020] L. L. Gutierrez-Martinez and M. Sandoval, Inertial effects on trapped active matter, J. Chem. Phys. 153, 044906 (2020).
- Sandoval [2020] M. Sandoval, Pressure and diffusion of active matter with inertia, Phys. Rev. E 101, 012606 (2020).
- Stenhammar et al. [2015] J. Stenhammar, R. Wittkowski, D. Marenduzzo, and M. E. Cates, Activity-Induced Phase Separation and Self-Assembly in Mixtures of Active and Passive Particles, Phys. Rev. Lett. 114, 018301 (2015).
- Thompson et al. [2022] A. P. Thompson, H. M. Aktulga, R. Berger, D. S. Bolintineanu, W. M. Brown, P. S. Crozier, P. J. in ’t Veld, A. Kohlmeyer, S. G. Moore, T. D. Nguyen, et al., LAMMPS - a flexible simulation tool for particle-based materials modeling at the atomic, meso, and continuum scales, Comput. Phys. Commun. 271, 108171 (2022).
- Rogel Rodriguez et al. [2020] D. Rogel Rodriguez, F. Alarcon, R. Martinez, J. Ramírez, and C. Valeriani, Phase behaviour and dynamical features of a two-dimensional binary mixture of active/passive spherical particles, Soft Matter 16, 1162 (2020).
- Schroeder [2021] D. V. Schroeder, An Introduction to Thermal Physics (Oxford University Press, Oxford, 2021).
- Baus and Tejero [2021] M. Baus and C. F. Tejero, Equilibrium Statistical Physics (Springer International Publishing, Cham, 2021).
- Zaeifi Yamchi and Naji [2017] M. Zaeifi Yamchi and A. Naji, Effective interactions between inclusions in an active bath, J. Chem. Phys. 147, 194901 (2017).
- Dolai et al. [2018] P. Dolai, A. Simha, and S. Mishra, Phase separation in binary mixtures of active and passive particles, Soft Matter 14, 6137 (2018).
- Wang and Jiang [2020] C. Wang and H. Jiang, The inhibition of concentrated active baths, J. Chem. Phys. 152, 184907 (2020).
- Klamser et al. [2018] J. U. Klamser, S. C. Kapfer, and W. Krauth, Thermodynamic phases in two-dimensional active matter, Nat. Commun. 9, 5045 (2018).
- De Karmakar and Ganesh [2022] S. De Karmakar and R. Ganesh, Motility-induced phase separation of self-propelled soft inertial disks, Soft Matter 18, 7301 (2022).
- De Karmakar and Ganesh [2020] S. De Karmakar and R. Ganesh, Phase transition and emergence of active temperature in an active Brownian system in underdamped background, Phys. Rev. E 101, 032121 (2020).
- Caprini and Marini Bettolo Marconi [2020] L. Caprini and U. Marini Bettolo Marconi, Active matter at high density: Velocity distribution and kinetic temperature, J. Chem. Phys. 153, 184901 (2020).
- Grasselli et al. [2015] Y. Grasselli, G. Bossis, and R. Morini, Translational and rotational temperatures of a 2D vibrated granular gas in microgravity, Eur. Phys. J. E 38, 8 (2015).
- Feitosa and Menon [2002] K. Feitosa and N. Menon, Breakdown of Energy Equipartition in a 2D Binary Vibrated Granular Gas, Phys. Rev. Lett. 88, 198301 (2002).
- Campbell [2006] C. S. Campbell, Granular material flows – An overview, Powder Technol. 162, 208 (2006).
- Puglisi et al. [2017] A. Puglisi, A. Sarracino, and A. Vulpiani, Temperature in and out of equilibrium: A review of concepts, tools and attempts, Phys. Rep. 709-710, 1 (2017).
- Caprini and Marini Bettolo Marconi [2021] L. Caprini and U. Marini Bettolo Marconi, Spatial velocity correlations in inertial systems of active Brownian particles, Soft Matter 17, 4109 (2021).
- Weeks et al. [1971] J. D. Weeks, D. Chandler, and H. C. Andersen, Role of Repulsive Forces in Determining the Equilibrium Structure of Simple Liquids, J. Chem. Phys. 54, 5237 (1971).
- Mello and Rodríguez [2010] P. A. Mello and R. F. Rodríguez, The equipartition theorem revisited, Am. J. Phys. 78, 820 (2010).
Supplementary information
The Supplemental Material includes Movies S1–4, Figures S1–11, Table S1, and supplementary text about the violation of the equipartition theorem as well as Ref. [75].
Acknowledgments
L.H. gratefully acknowledges the support by the German Academic Scholarship Foundation (Studienstiftung des deutschen Volkes).
Author contributions
B.L. designed the research. L.H. and I.D. performed the research and analyzed the data. L.H. and B.L. discussed the results and wrote the manuscript.
Competing interests
The authors declare no competing interests.
Supplemental Material: Motility-induced coexistence of a hot liquid and a cold gas
Lukas Hecht,1 Iris Dong,1 and Benno Liebchen1
1Institut für Physik kondensierter Materie, Technische Universität Darmstadt, Hochschulstr. 8, D-64289 Darmstadt, Germany
Movie captions
Movie S1: Snapshot (left) and coarse-grained kinetic temperature field of the passive tracer particles (right) of a mixture of overdamped active Brownian particles with overdamped passive tracers (as in Fig. 1a–d in the main text). Parameters: , , , , , .
Movie S2: Snapshot (left) and coarse-grained kinetic temperature field of the passive tracer particles (right) of a mixture of overdamped active Brownian particles with inertial passive tracers showing coexistence of a hot gas-like and a cold liquid-like phase (as in Fig. 1e–h in the main text). Parameters: , , , , , .
Movie S3: Snapshot (left) and coarse-grained kinetic temperature field of the passive tracer particles (right) of a mixture of overdamped active Brownian particles with inertial passive tracers showing coexistence of a cold gas and a hot liquid-like droplet (as in Fig. 1i–l in the main text). Parameters: , , , , , .
Movie S4: Simulation of a mixture of overdamped active Brownian particles with inertial passive tracers showing coexistence of a cold gas and a hot liquid-like droplet (as in Fig. 1i–l in the main text). An exemplary trajectory of a passive tracer particle is marked in red demonstrating how a passive tracer particle is pushed forward in the dense phase as a result of correlated dynamics of the active particles. The right panel shows a zoomed version of the left panel. Parameters: , , , , , .
Violation of the equipartition theorem
The different persisting temperatures are accompanied by a violation of the equipartition theorem, which holds for systems in equilibrium. It states that each degree of freedom [which is quadratic in the (momentum) coordinates] contributes (on average) with to the total energy of the system [75, 60]. This would imply that the kinetic temperature of the active and passive particles are the same, which is in fact the case for a completely overdamped system (Fig. S9). Even for the case of overdamped active and underdamped passive particles, the equipartition theorem applies for small Pe, where the dynamics of the system is dominated by thermal diffusion and the system is near equilibrium (Figs. S10 and S11a,b). However, the ratio of the kinetic temperature of the passive and active particles increases significantly with increasing Pe both in the uniform regime and in the coexistence regime (Figs. S10 and S11a,b). Note that the ratio of is largest at large (and large Pe) in the dense phase (Figs. S10 and S11a,c), whereas in the dilute phase, it reaches its maximum at intermediate (small Pe) or small (large Pe) (Fig. S11d), which is in line with our analysis leading to the transition between the scenarios hot-liquid–cold-gas and hot-gas–cold-liquid.
| A (Fig. 8a–c) | dense | |||
|---|---|---|---|---|
| gas | ||||
| B (Fig. 8d–f) | dense | - | ||
| gas | - | |||