Spectrum of coherent VUV radiation generated by 5.7 MeV electrons in the periodic structure of a multilayer X-ray mirror
Abstract
Using a sample of a periodic structure [Mo/Si]50, known as a multilayer X-ray mirror, the spectral-angular properties of diffracted transition radiation and parametric radiation in the ultrasoft X-ray region generated by the periodic structure upon interaction with a beam of relativistic electrons with an energy of 5.7 MeV are numerically studied. Based on calculations, an experimental approach is proposed for separating and identifying the contributions of PXR and DTR. The ultrasoft X-ray radiation under study can be useful for eliminating coherent effects occurring in the optical range when diagnosing the size of submicron electron beams.
1 Introduction
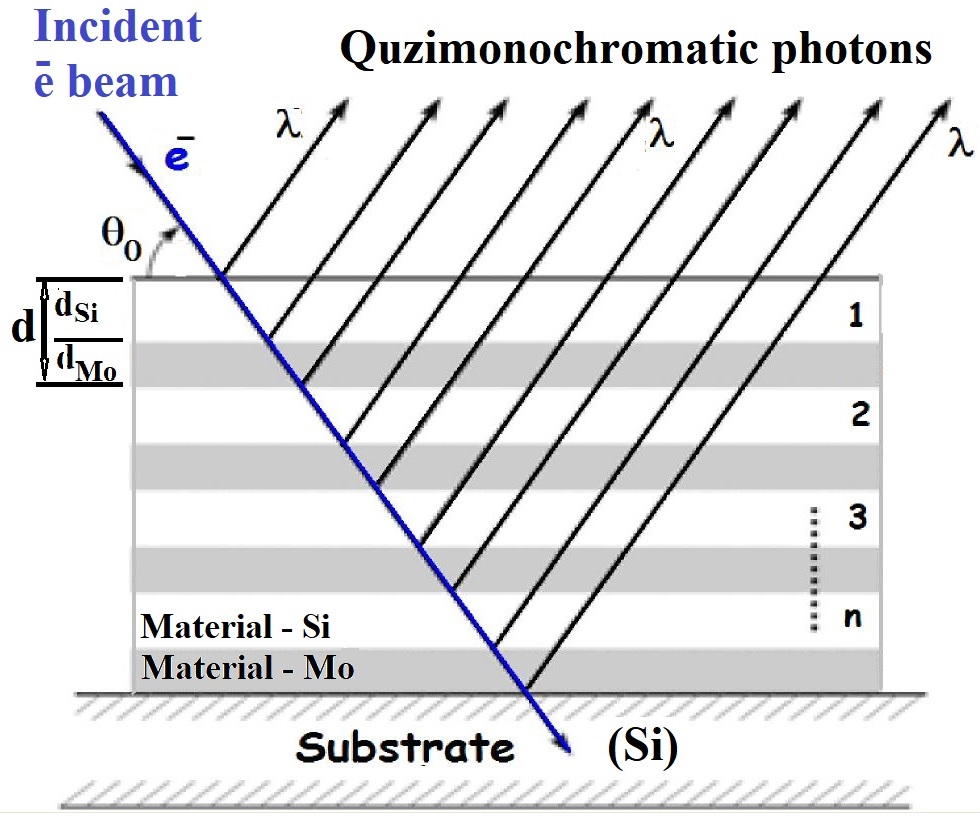
Structures such as multilayer X-ray mirrors can be effective sources of vacuum ultraviolet and ultra soft X-ray radiation with tunable radiation energy [1, 2, 3]. The emission band is determined by the period of the multilayer structure, the number of layers, and the tilt angle of the structure with respect to the direction of the electron beam. The main contribution to the radiation is made by the diffraction of transition radiation (DTR) and coherent radiation of the periodic structure of the target excited by an electron beam - an analog of parametric x-ray radiation in crystals (PXR). Another application of a short-wave vacuum ultraviolet source, which, due to the periodic structure of the target, has a quasi-monochromatic spectrum, can be associated with the development of methods for diagnosing and imaging electron beams of submicron sizes. The changerover to using shorter wavelength radiation will mitigate the influence of coherent effects that one characteristic of methods using the optical radiation [4, 5] and reduce the contribution to the imaging process of the fundamental diffraction limit [6]. In this paper, we present the numerical simulations of the properties of PXR DTR in the VUV region, based on the theoretical work [7, 8]. These studies were carried out using a periodic target consisting of 50 pairs of Mo/Si layers with a structure period d=11.32 nm interacting with an electron beam with a total electron energy of 5.7 MeV. In the first section, using model calculations as an example, we examine the formation of angular distributions depending on DTR and PXR contributions, as well as the spectral properties of each contribution. The second section discusses the possibility of experimentally studying the fine structure of the spectrum and estimating the widths of spectral lines.
2 General properties of DTR and PXR contributions
One of the fundamental parameters of a periodic target that determines the properties of DTR and PXR is the periodic dielectric susceptibility.
| (2.1) |
Here is the dielectric susceptibility of a periodic structure with period , where and are the thicknesses of alternative layers of the periodic structure made of light and heavy material, respectively. In our case, the ratio of the thickness of the light layer to the thickness of the heavy layer is parameter and , their corresponding susceptibilities (see figure 1). Further details are described in Appendix following [7, 8].
Let us consider the main spectral and angular properties of DTR and PXR presented in figure 2. The patterns in figure 2 demonstrate the dependence of the energy of emitted photons (shown in color) and the shape of the angular distribution on the target orientation over a range of target inclination angles from 30° to 90° (normal beam incidence on the target). Calculations were performed following [6,13].
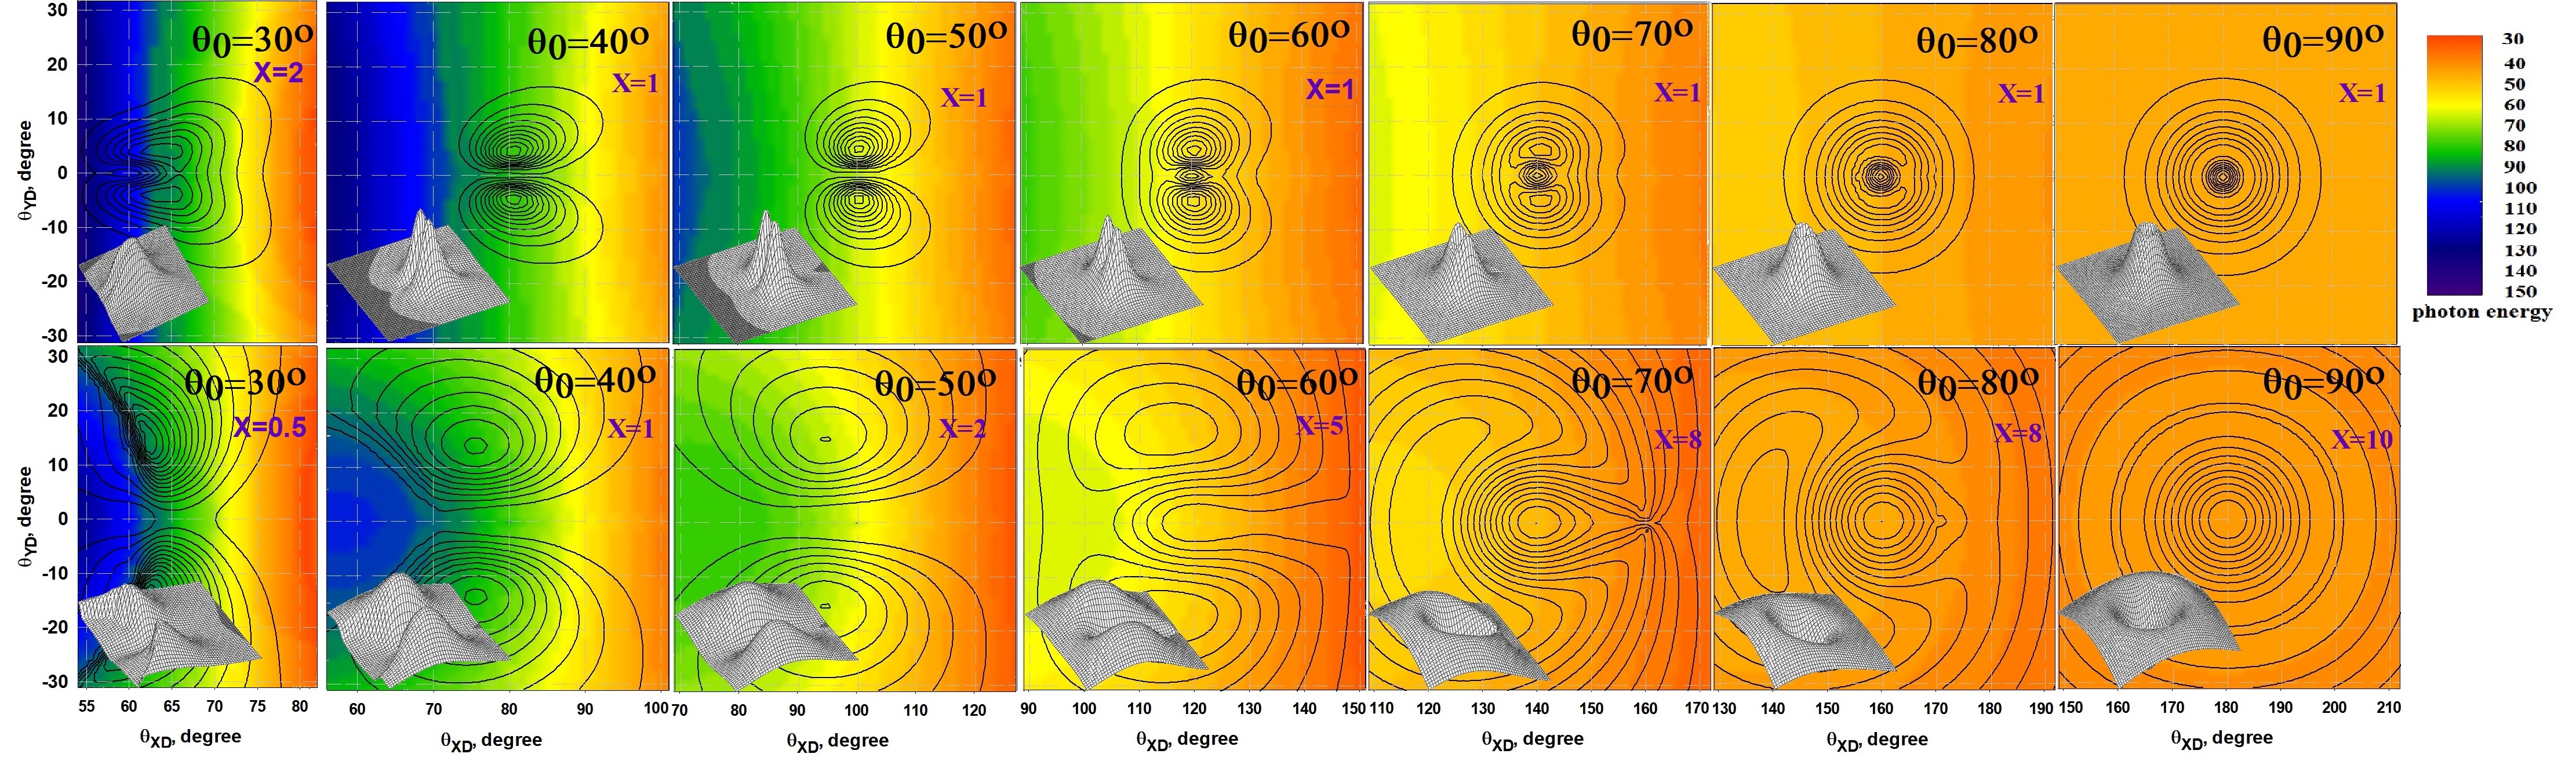
As we can see from the figures, the annular crater-like shape of DTR (upper row of patterns) and PXR (lower row of patterns) with a decrease in the angle of inclination turns into a two-humped shape. For DTR, the emission maximum is observed at the angle , while the PXR maximum depends on the energy of generated photons and is observed close to around
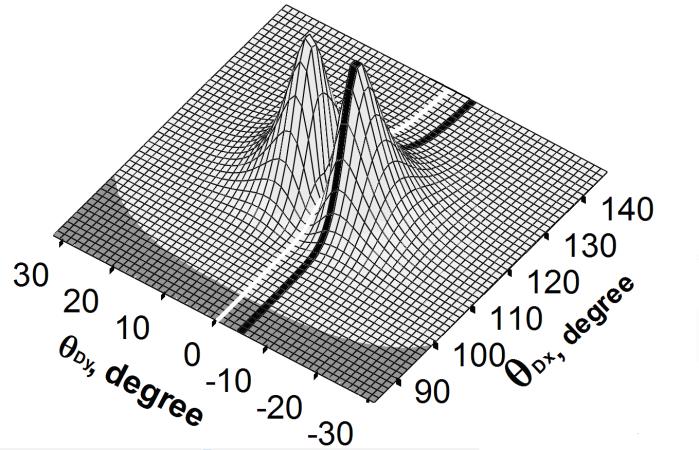
The change in shape is qualitatively explained by the dependence of the scattering coefficient of the component of the component of the electric field parallel to the plane (for a “symmetric” target || , where g is the reciprocal vector of the periodic structure, is the normal to the target surface) on the target inclination angle. The contribution of the mutually perpendicular and components, is determined by the factor , which for and - polarized components of the radiation are and , respectively. component dominates in the plane. The contribution of component dominates in the plane which is perpendicular to the plane and passes through the axis of radiation cone. Consequently, the factor can affect the dynamics of change of the angular distributions measured in the plane at changing the angle . For this reason, the experimental study of the spectral and angular properties of radiation from measurements carried out in the plane is not so clear. To simplify the interpretation of experimental results by means of suppressing the dependence of radiation on the factor , the measurements of angular distributions for different should be carried out at a certain angle to the plane, for example, at ( is the Lorentz factor of electron). In this case the path of detector scanning passes through the expected local maximum of the full angular distribution. This scan path is shown in the 3D-image of the full angular distribution in figure 3 by the black strip. Here, the intensity at the maximum of the angular distribution will consist only of the component with .
The color in figure 2 shows the value of the photon energy at the maximum angular density of radiation for a given direction of emission (). As can be seen from the figureures, a change in the tilt angle of the target leads to a change in the radiation spectrum, which manifests itself both in a change in the radiation energy at the maximum of the angular distribution and in an increase in the width of the emitted spectrum integrated over the entire radiation cone.
The width of the PXR and DTR spectral lines varies within the radiation cone from eV at to of several tens of electron volts at . The value of the radiation energy at the center of the angular distribution also varies depending on the tilt angle over a wide range from 54 eV to 120 eV in accordance with the Bragg diffraction law for “real” (DTR) and “virtual” (PXR) photons. The border of the color change from green to blue on the patterns corresponds to the radiation energy near the L absorption edge of radiation in Si at eV. For practical use and verification of existing theoretical concepts, it is important to take into account the dependence of the properties of the observed radiation on the spectral-angular features of the PXR and DTR contributions and on their mutual interference.
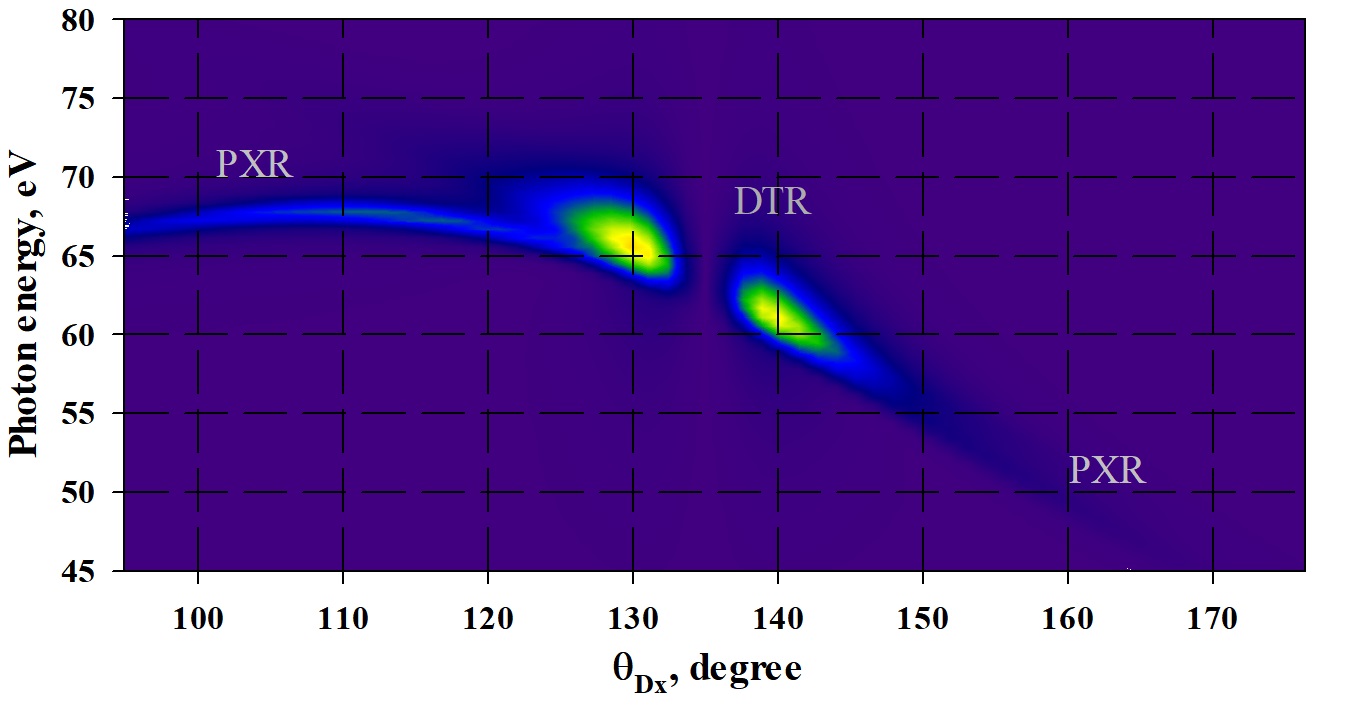
Figure 4 illustrates the spectral and angular features of the PXR and DTR contributions when the angle between the electron beam and the target surface is . The figureure shows the dependence of the PXR+DTR radiation intensity on the photon energy and the observation angle in the plane. The results presented in figure 4 show that the expected DTR contribution forms an angular distribution near its center, i.e., in the direction of mirror reflection of the electron velocity, while the PXR maxima are located on the periphery of the angular distribution. The maximum radiation intensity is observed . In addition, it can be seen from the figure that the width of the PXR spectral line is narrower than the width of the DTR spectral line.
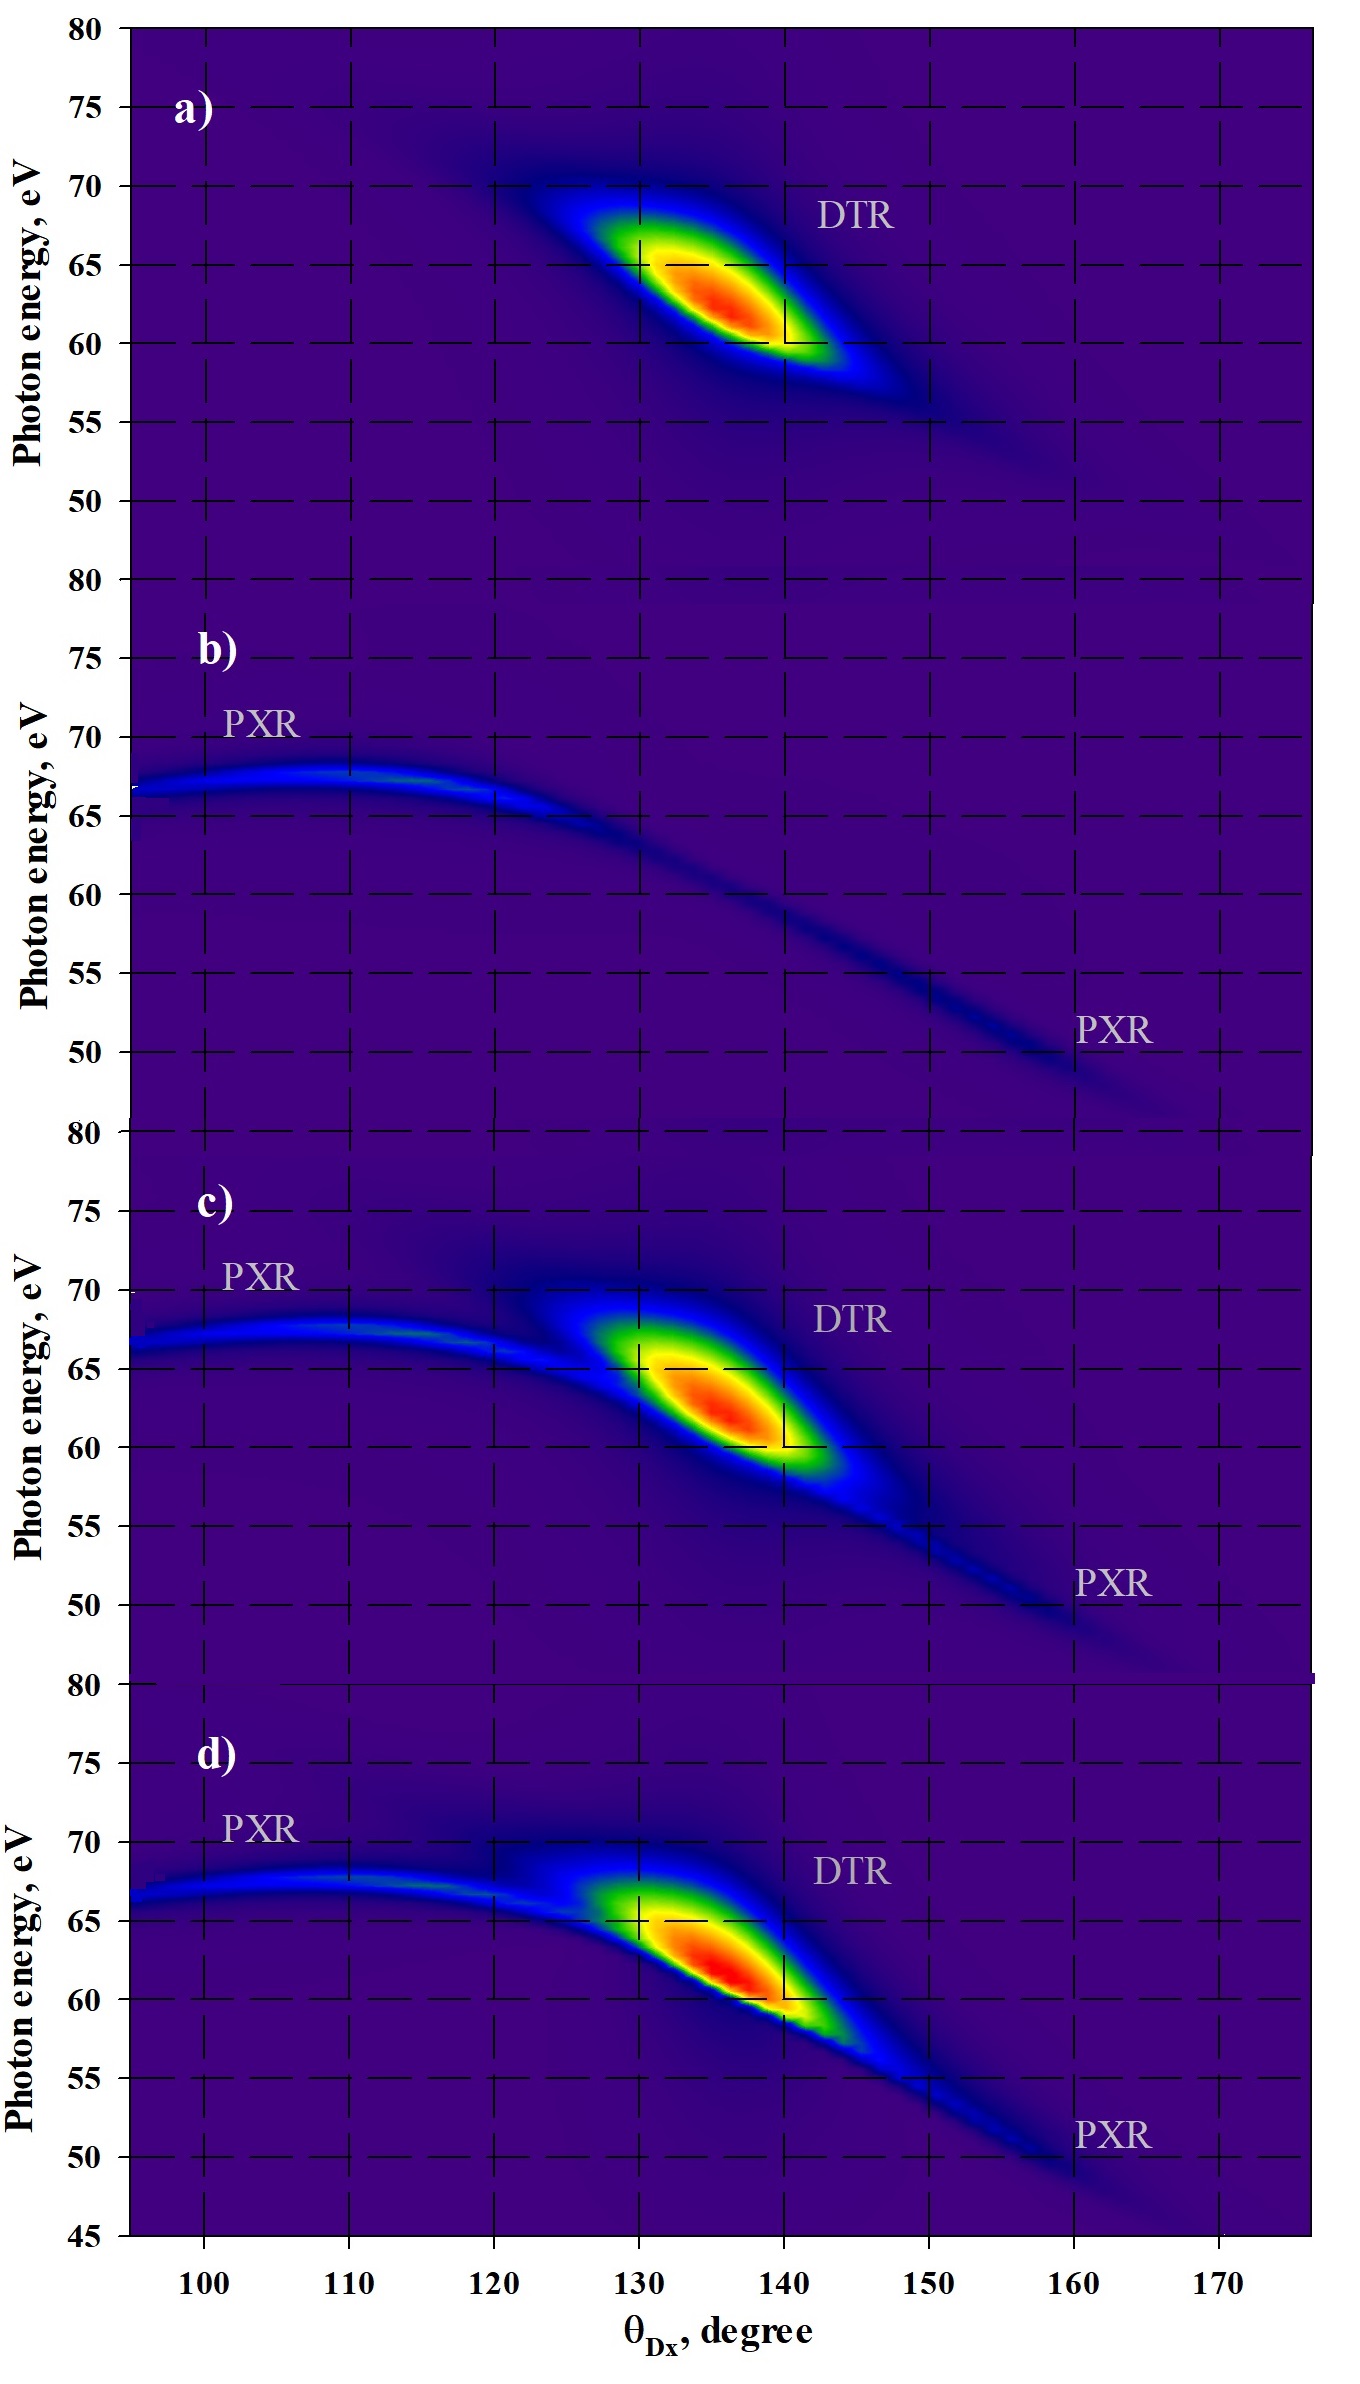
Figures 3 and 4 show that the maximum radiation intensity is observed at and . Let’s consider the spectral-angular properties of DTR and PXR in the vicinity of the maximum radiation density. Figure 5 shows the spectral-angular properties of the DTR and PXR contributions generated in the direction to the plane depending on the azimuth angle . For comparison, in figure 5a, figure 5b the contributions of PXR and DTR are presented separately. In figure 5d, figure 5c as their contributions are shown with and without interference, respectively. It can be seen from the figures that the maximum intensity corresponds to the DTR contribution. The PXR contribution is presented as a long whisker, which has a narrower spectral linewidth eV compared to the spectral linewidth for eV. The smaller width of the spectral line at PXR than DTR is due to the fact that more layers of the periodic structure are involved in PXR generation than in DTR generation. The patterns of DTR+PXR with take in to account the mutual interference are shown in figure 5d. From the comparison of figures 4c and 4d, it can be seen that the influence of interference somewhat reduces the width of the spectral line, this is especially noticeable near and .
In this paper, we did not consider the impact of multiple scattering on DTR and PXR. However, in general, it should be noted that, unlike DTR, the process of multiple scattering is expected to influence the properties of PXR.
3 On the experimental observation of the fine structure of the spectrum
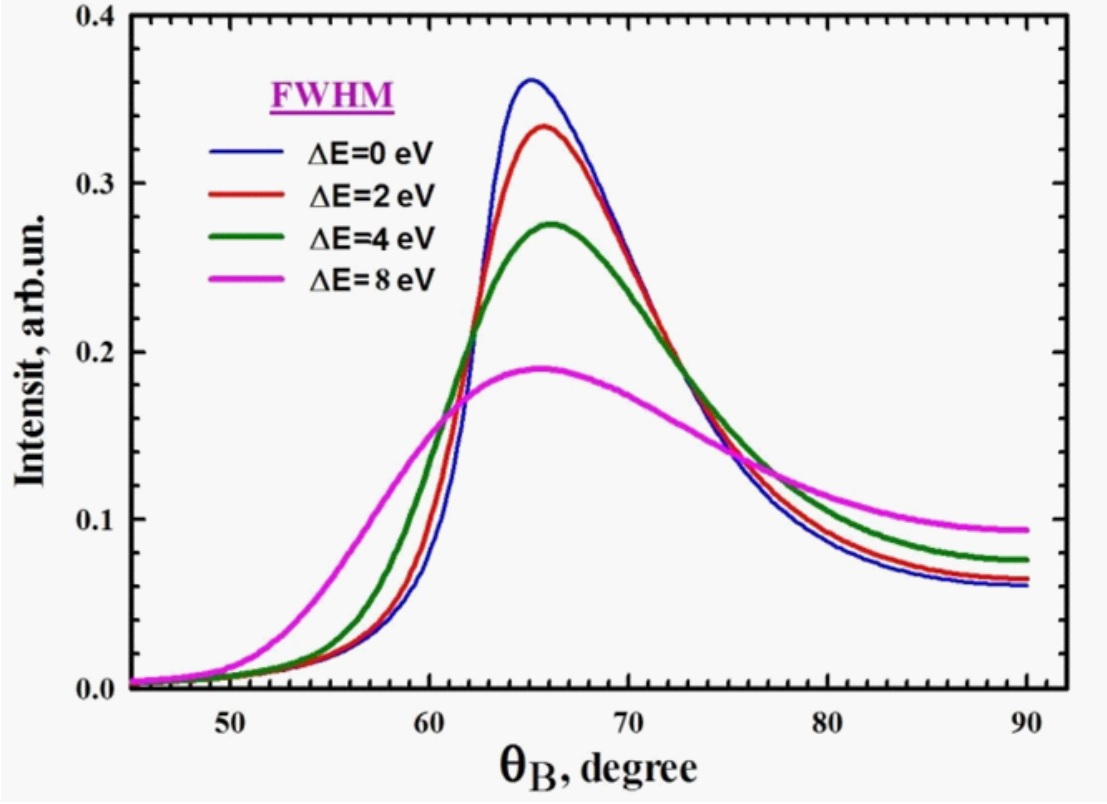
As can be seen from the figures, the maxima of the PXR and DTR contributions are separated by significant angular distances. The large distance between the PXR and DTR maxima makes it possible to confidently separate these contributions in the experiment and study their spectral properties. One of the main experimental evidence of the separate observation of the PXR and DTR contributions can be the measured width of the spectral line, since, as can be seen from figures 3 and 4, the width of the PXR spectral line should be several times narrower than that of the DTR. The DTR and PXR spectra can be measured using another multilayer mirror as a spectrometer. Figure 6 shows the rocking curves calculated for several spectral lines with different spectral widths as an example of the possibility of using a multilayer X-ray mirror to analyze the radiation spectrum with E = 65 eV. The calculations were performed for an X-ray mirror with parameters similar to those of a multilayer target structure using the IMD-5 application [10].
4 Conclusion
The presented results show that the main contribution of the radiation generated in a multilayer mirror by electrons with an energy of several MeV comes from the DTR. The DTR has the size of the emission opening cone about around the direction . At the same time, the maximum angular density of PXR is concentrated on the periphery of the total angular distribution of DTR+PXR with the size of the radiation opening cone about .The results also show that the natural spectral linewidth of PXR is several times narrower than that of DTR.The difference in the width of the spectral lines can be used in the experiment to identify the contributions of PXR and DTR.
Acknowledgments
The work was supported by the Russian Science Foundation, grant No. 23-22-00187.
Appendix A Basic Formulas
Basic Formulas Spectral and angular characteristics of radiation generated by electrons in layered periodic nanostructures – “X-ray mirrors” – were numerically studied using the theory [7, 8] developed by N. Nasonov. The following formulas were used to calculate spectral and angular intensity of PXR and DTR:
| (A.1) |
where
| (A.2) |
The first addend in square brackets corresponds to DTR, while the second and third addends correspond to PXR. Here, and are the energy and wave vector of the observed radiation, , are the polarization coefficients, is the angle between the electron velocity vector and the target surface, is the normal to the target surface;
| (A.3) |
are the projections of the velocity vector on the target surface and on the direction of the reciprocal lattice vector ; ; and are the thicknesses of alternating layers in the periodic structure – substances of high and low density, respectively;
| (A.4) |
| (A.5) |
| (A.6) |
| (A.7) |
| (A.8) |
| (A.9) |
| (A.10) |
where is the diffraction order; are the real and imaginary parts of the atomic scattering factor for photons.
References
- [1] S.R. Uglov, V.V. Kaplin, L.G. Sukhikh, A.V. Vukolov, JETP Letters 100, No.8 503 (2014).
- [2] S.R. Uglov, V.V. Kaplin, A.P. Potylitsyn, L.G. Sukhikh, A.V. Vukolov and G. Kube, Jour. of Phys.: Conf. Ser. 517, 012009 (2014).
- [3] S R Uglov, V V Kaplin, A S Kubankin, J-M Andre, K Le Guen, Ph Jonnard, S de Rossi, E Meltchakov and F Delmotte, Journal of Physics: Conference Series 732 012017 (2016).
- [4] H. Loos, R. Akre, A. Brachmann, F.-J. Decker, Y. T. Ding,D. Dowell, P. Emma, J. C. Frisch, A. Gilevich, G. R. Hays,P. Hering, Z. Huang, R. H. Iverson, C. Limborg-Deprey, A.Miahnahri, S. Molloy, and H.-D. Nuhn, Proceedings ofthe Thirtieth Free Electron Laser Conference, Gyeongjuouth Korea (JACoW, Gyeongju, 2008), THBAU01, p.485.
- [5] S. Wesch, C. Behrens, B. Schmidt and P. Schmüser, Proceedings of the 31st International Free Electron LaserConference (FEL 09), Liverpool, UK (STFC DaresburyLaboratory, Warrington, 2009), p.619.
- [6] L. G. Sukhikh, G. Kube, S. Bajt, W. Lauth, Yu. A. Popov, and A. P. Potylitsyn, Phys. Rev. ST Accel. Beams 17, 112805 (2014).
- [7] N.N. Nasonov, V.V. Kaplin, S.R. Uglov, M.A. Piestrup, C.K. Gary, Phys. Rev. E 68,036504 (2003).
- [8] N. Nasonov, V. Kaplin, S. Uglov, V. Zabaev, M. Piestrup, C. Gary, Nucl. Instrum. and Meth. B 227, 41 (2005).
- [9] B.L. Henke and E.M. Gullikson and J.C. Davis, Atomic Data and Nuclear Data Tables 54,181 (1993).
- [10] www.esrf.eu/Instrumentation/software/data-analysis/xop2.3.