[a,b,c,d,e]Maria Giovanna Dainotti
The two-dimensional and three-dimensional relations in the plateau emission in multi-wavelengths
Abstract
Abstract
Gamma-Ray Bursts (GRBs) are interesting objects for testing the emission models in highly energetic regimes and are very promising standardizable candles, given their observability at high redshift (up to ) that allows the extension of the Hubble diagram much further the limit of Supernovae Ia (SNe Ia), the most distant one being at . In this study, we demonstrate that the fundamental plane relation involving the prompt peak luminosity in X-rays, the X-rays plateau-end luminosity, and the plateau-end rest-frame time is not only a robust benchmark for testing GRB emission models like the magnetar but also a promising avenue for high- cosmology exploration. First, we discuss the connection between the magnetar model and the GRB afterglow correlations.
Second, through the simulation of GRBs, we count how many years are needed to achieve the same precision of modern SNe Ia samples in the estimation of .
1 Introduction
GRBs are very energetic flashes of cosmological origin photons distributed isotropically in the sky, ranging from -ray and X-rays in the prompt emission to the X-rays, optical, and sometimes radio in the afterglow phase. They have been observed up to redshift [6], much further than the SNe Ia at [1] and quasars (QSO, [2, 3, 4]) with the furthest being at [5]. In the 42 of GRBs observed by the Swift-XRT telescope (Swift mission, 2004-ongoing), it is possible to observe the plateau phase, namely, a flattening of the light curve after the prompt emission and before the late afterglow of the light curve. This feature is of significant astrophysical interest, given that it can be powered by magnetars. However, it’s also an important instrument to achieve the standardization of GRBs since the afterglow properties have proven to be more regular than the prompt ones from a morphological point of view. GRBs require unbiased and intrinsic correlations among their parameters to be used as cosmological tools, and among all the proposed correlations for GRB standardization, an outstanding candidate is the fundamental plane relation, also called the 3D Dainotti relation, among the X-ray at the end of plateau emission (), the plateau emission end-time in the rest-frame (), and the 1-second peak prompt X-ray luminosity () [14, 15, 22, 23]. This relation combines the 2D Dainotti relation () [10, 12, 22, 23, 25, 18] and [11, 13]. Notably, it exhibits the smallest intrinsic scatter () among multidimensional correlations involving GRB plateaus [40]. The two-dimensional relation has also been discovered in optical [22] and radio [41]. In addition, [23] discovered that, similarly to the X-ray emission, it is possible to extend the optical relation in three dimensions. It is important to note that these relations show compatibility in their parameters.
Crucially, the fundamental plane fitting parameters remain independent of cosmological models, confirming the reliability of GRBs as cosmological probes. The fundamental plane relation is expressed as follows:
| (1) |
where are the plane parameters and is the normalization of the plane. This correlation can be corrected for selection biases and redshift evolution effects through the Efron and Petrosian (EP, [27]) method formulation. After applying the EP method, the fundamental plane relation expressed in Equation 1 becomes:
| (2) |
where are the evolutionary coefficients computed with the EP method that allow to correct the parameters for selection biases or evolution effects with .
The current proceeding is organized as follows. First, in Section 2, we introduce the magnetar model and its connection with the plateau emission of GRBs. Second, in Section 3, we estimate the required number of GRBs with plateau emission to reach the same precision as SNe Ia in constraining the parameter.
2 The magnetar model for GRBs and the plateau emission
GRBs are traditionally classified through a bimodal scheme [28]: (1) Long GRBs (LGRBs), with a prompt duration , a soft spectrum, and are associated with the core-collapse of massive stars; (2) Short GRBs (SGRBs), having and a harder spectrum, generated by the merging of compact objects, such as two neutron stars (NS-NS) or a NS with a black hole (BH). The situation becomes more complicated when more subclasses are included, such as the Short GRBs with extended emission (SEE) that show a hard spectrum typical of SGRBs, but with a duration . The existence of these events challenges the traditional LGRB-SGRB division. Consequently, a more robust classification scheme necessitates identifying common features among different GRB classes, and one such characteristic is the plateau emission. The mechanism that powers the plateau can be explained by the fallback of materials onto a newly formed BH or the spin-down emission of an ultra-magnetized newborn millisecond NS, the so-called magnetar. The debate about the most reliable model is still ongoing in the literature. However, the magnetar model has captured further attention since a magnetar can be either formed in the case of massive stars that undergo core-collapse or in the case of NS binaries merging [29]: this implies that the magnetar model is a valid interpretation for the GRB emission both in the cases of LGRBs and SGRBs, thus paving the way to overcome the traditional LGRB-SGRB classification scheme. In the magnetar scenario, the rotational energy is released very quickly in the first hours through the spin-down of the magnetic dipole, which naturally implies the presence of a long-lived central engine. In [30], the authors show how the 2D Dainotti relation [10, 12, 22, 23, 25, 18] can be explained by the magnetar central engine. This correlation can be written in the following form:
| (3) |
where is the rest-frame plateau-end time (in ) and is the plateau-end luminosity (in ). In linear form, this correlation can be written as . The newly formed magnetar can release its energy by dipole radiation, and, for simplicity, it is possible to ignore the transfer mechanism from the magnetar to the observed emission. There is an intrinsic association between the bolometric plateau-end luminosity and duration and, according to [31], these can be written as:
| (4) | |||
where and are the theoretical plateau-end luminosity and time, in and , respectively, is the moment of inertia (), is the magnetic field intensity (), is the neutron star radius (), and is the initial rotational period (). Through Equations 4 a relation can be written as follows:
| (5) |
Therefore, a correlation exists between and that can be roughly represented as , denoted as based on predictions from Equation 3. In a study by [12], we derived the parameter value by fitting the 2D Dainotti relation to 101 Swift-XRT GRBs featuring plateau emission. This dataset spans observations from January 2005 to May 2011, with the Dainotti relation parameters adjusted for astrophysical biases using the EP method. The expected normalization of the relation, denoted by the parameter and anticipated to be according to the magnetar model, aligns well with the observed value from the normalization given by the bolometric rest-frame energy band for Swift-XRT. This outcome strongly suggests that the magnetar model is a highly reliable framework for explaining the plateau emission observed in the early afterglow of GRBs.
Another step forward in the connection of the and with the magnetar scenario has been done in [32]. In the formulation of this work, the NS spinning down is capable of releasing a luminosity , where is the spin rate and the moment of inertia. For NSs, it holds the relation , where is the braking index for the ideal magnetohydrodynamical conditions, while is considered in the non-ideal case.
In the ideal scenario, the spin-down luminosity relation is the following:
| (6) |
where is the magnetic dipole moment and , being the magnetic field, and the angle between the rotation axes and the magnetic field direction. This expression can be generalized to the non-ideal case, writing it as
| (7) |
where is the initial value, means non-ideal, and considering . In [33], the energy budget in the relativistic external shock is given by the balance of injected energy from the magnetar spinning down and the loss of radiative energy according to
| (8) |
where as the observer frame time and the coefficient depends on the electron energy fraction and the shock evolution with time. For simplicity, the has been considered as a constant.
In [32], a sample of 40 GRBs with plateau emission observed by Swift-XRT has been fitted through the phenomenological Willingale model [34] to estimate the properties . The sample, called golden sample, was selected according to the following criteria also adopted in [14]:
-
•
The presence of a minimum 5 data points in the plateau;
-
•
The steepness of the plateau ;
-
•
The fit should follow the Avni 1978 prescription [35] for the fit.
This sample of GRBs, containing LGRBs and SEE, leads to the following fitting of the spin period-magnetic field () relation:
| (9) |
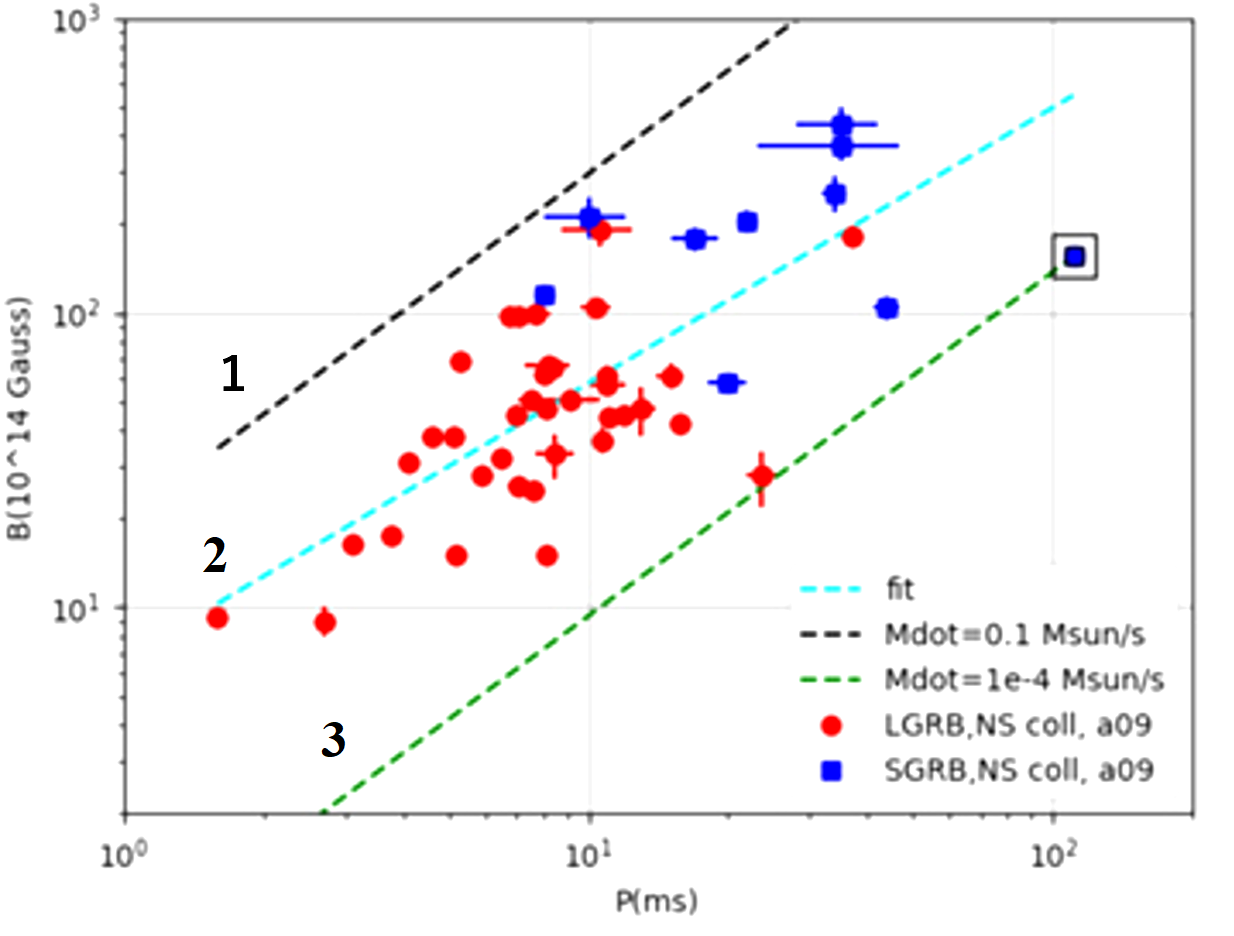
where the uncertainty on the slope has been symmetrized. The fitting results are depicted as line 2 in Figure 1. The correlation is anticipated based on the physics of spin-up lines observed in accreting neutron stars (NS) within Galactic binary systems. In this dataset, all data points fall between two boundary lines determined by the mass accretion rate, : . These boundaries are illustrated as lines 1 and 3 in Figure 1. Notably, these values align with observations in the prompt emission of gamma-ray bursts (GRBs), as can be considered a proxy for .
The relation potentially indicates a connection to the relation since both links stem from magnetar properties. Furthermore, the inclusion of in the fundamental plane relation, expressed in Equation 1, alongside the plateau properties, facilitates linking prompt luminosity to plateau luminosity and time within the magnetar model framework.
An additional key insight from this analysis is the distinct clustering of SEE and LGRBs in different regions of the diagram. SEE events tend to cluster in the longer-duration end of the diagram, while LGRBs are concentrated in the region characterized by shorter periods and lower intensities, as illustrated in Figure 1. This observation suggests that the fundamental plane relation serves as a discriminant tool among various GRB classes. This conclusion aligns with findings in [21], where the different classes of LGRBs associated with supernovae (SGRB-SNe), GRBs associated with kilonovae (SGRB-KNe), and the standalone SGRBs exhibit statistically distinct distances from the fundamental plane fitting for each class.
The fundamental plane relation has proven to be a reliable astrophysical instrument for discriminating among different GRB classes and GRB emission mechanism models, but it also has important implications in cosmology, as summarized in the next Sections.
3 The application of GRBs as standalone cosmological probes
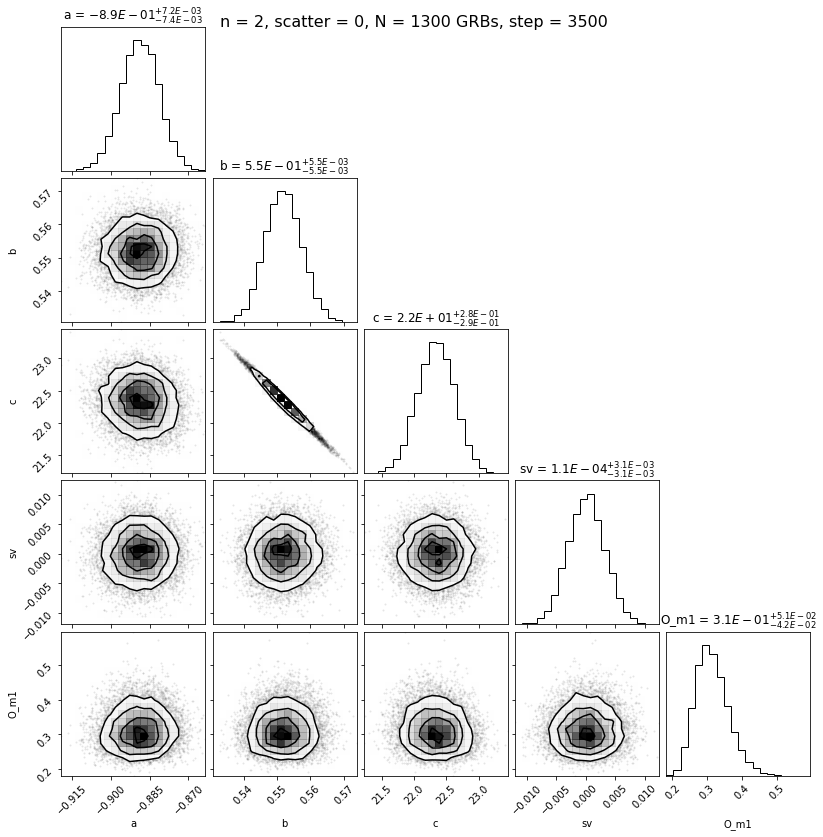
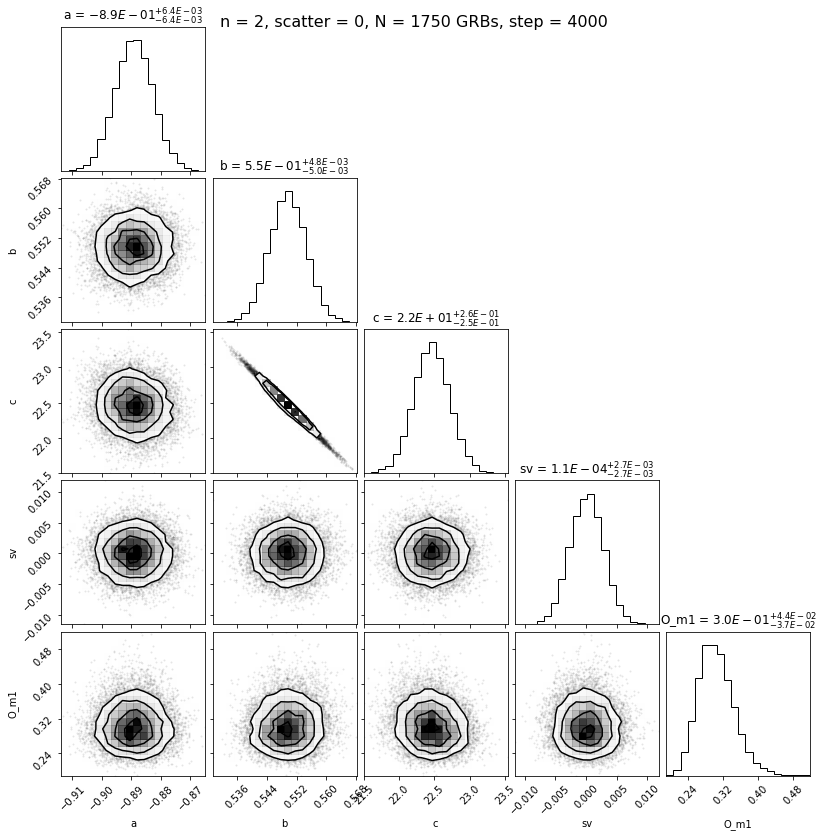
We discuss how many GRBs are required to achieve the same precision as SNe Ia on the parameter [25]. For the GRBs to be used as standardizable candles, it is crucial to leverage the fundamental plane relation: we here stress that this relation has the smallest intrinsic scatter among the multidimensional GRB correlations that involve the afterglow emission, namely, . Both the platinum sample [21] of 50 X-ray GRBs [21] and the 45 optical GRBs fundamental plane sample [23] are tested as cosmological tools in combination with SNe Ia. The platinum sample is an improvement of the golden sample because it considers only plateaus with no flares, and with a duration sec. The results in [25] show that both lead to the same level of precision on the estimation of the parameter, namely, and , respectively. The same applies when (1) the platinum and the optical sample are trimmed, namely, are reduced to samples of 20 X-ray and 25 optical GRBs that are the closest to their fundamental plane fitting, and (2) the GRB parameters are corrected for astrophysical biases or -evolution effects through the EP method. These results shows how the fundamental planes in both wavelength regimes are promising cosmological tools. The simulations of GRBs that follow the same properties of the 50 GRBs X-ray platinum sample and the 45 optical GRBs are performed with the emcee package [47]. According to the preliminary simulations, only 150 X-ray GRBs are needed to achieve a reasonable value of ; nevertheless, this 1 precision level is not satisfying since it is comparable with the central value. Thus, further hypotheses must be applied before the GRB simulations to achieve the same precision level of SNe Ia standalone samples. To this end, as the basis for comparison, the following precision level is considered: from Betoule et al. 2014 (B14) [49]. The forthcoming research in the field of machine learning (ML) techniques will have a beneficial effect on the observation of GRBs. First, the light curve reconstruction approaches applied to GRBs [51] can halve the errors on GRB parameters. If the errors halving () is taken into account, it is possible to obtain , thus reducing the uncertainty on by 63 with respect to the case of the unhalved errors (). Second, the ML methods that can be used to infer the redshift of GRBs will double the sample of GRBs with , allowing the cosmological analysis of a more extensive collection of events. In this perspective, a key role is also played by the forthcoming missions dedicated to the GRBs observations, like the space mission THESEUS with a tentative launch date in 2037 and an expected rate of observed GRBs between 300 and 700 per year [52]. In this work, we simulated 1300 and 1750 GRBs that mimic the platinum sample properties in the case of . The results of the posterior distributions are reported in Figure 2. For 1300 GRBs, , while for the 1750 GRBs, we find (both with symmetrized uncertainties). In both cases, the precision on is comparable with the level reached in B14. Considering these results and the ratio of X-ray GRBs with platinum sample properties over the total number of observed GRBs (50/1064), we expect to obtain a sample of GRBs with such characteristics by 2044 if we include the contribution of LCR techniques to halve the errors and the application of ML approaches to double the sample of GRBs with redshift. The X-ray platinum sample is not the only one that can be used as a standard candle sample. Indeed, through the use of the optical fundamental plane correlation with the aid of the light curve reconstruction approach applied to GRBs [51] and a sample of GRBs doubled thanks to the ML techniques to infer the redshift values, we can reach the same precision of B14 in less than ten years from now (2032) [25].
4 Summary and conclusions
We used the platinum sample of GRBs [21] as a cosmological tool. The fundamental plane correlation, which finds its interpretation in the magnetar model, shows a small intrinsic scatter when fitted on the platinum sample of GRBs. Thus, the fundamental plan proves to be a reliable cosmological tool in the case of GRBs as standalone cosmological probes. Indeed, through the simulation of 1300 and 1750 GRBs, we can see how the same precision as the SNe Ia analyzed in [49] can be reached in less than a decade from today. The forthcoming use of GRBs as standard candles will allow us to cast more light on the open problems of modern cosmology, in particular, the Hubble constant () tension for what concerns the standard CDM cosmology [53, 54, 55, 56, 57].
References
- [1] S. A. Rodney et al. 2015, Two SNe Ia at Redshift 2: Improved Classification and Redshift Determination with Medium-band Infrared Imaging, ApJ, 150 5 156
- [2] E. Colgain et al. 2022, Revealing intrinsic flat CDM biases with standardizable candles, Phys. Rev. D, 106 L041301
- [3] M. G. Dainotti et al. 2022, Quasar Standardization: Overcoming Selection Biases and Redshift Evolution, ApJ, 931 106 6
- [4] M. G. Dainotti et al. 2023, Quasars: Standard Candles up to z = 7.5 with the Precision of Supernovae Ia, ApJ, 950 45
- [5] F. Wang et al. 2021, A Luminous Quasar at Redshift 7.642, ApJL, 907 L1
- [6] A. Cucchiara et al. 2011, A photometric redshift of for GRB 090429B, ApJ, 736 7
- [7] M. G. Dainotti et al. 2016, A Fundamental Plane for Long Gamma-Ray Bursts with X-Ray Plateaus, ApJL, 825 L20
- [8] M. G. Dainotti et al. 2017, A study of gamma ray bursts with afterglow plateau phases associated with supernovae, A&A, 600 A98 11
- [9] M. G. Dainotti et al. 2020, The Optical Luminosity–Time Correlation for More than 100 Gamma-Ray Burst Afterglows, ApJL, 905 L26
- [10] M. G. Dainotti et al. 2008, A time–luminosity correlation for -ray bursts in the X-rays, MNRAS, 391 1 79-83
- [11] M. G. Dainotti et al. 2011, Towards a standard gamma-ray burst: tight correlations between the prompt and the afterglow plateau phase emission, ApJ, 730 135
- [12] M. G. Dainotti et al. 2013, Determination of the intrinsic Luminosity Time Correlation in the X-ray Afterglows of GRBs, ApJ, 774 157
- [13] M. G. Dainotti et al. 2015, Luminosity-time and luminosity-luminosity correlations for GRB prompt and afterglow plateau emissions, MNRAS, 4514 3898-3908
- [14] M. G. Dainotti et al. 2016, A Fundamental Plane for Long Gamma-Ray Bursts with X-Ray Plateaus, ApJL, 825 L20
- [15] M. G. Dainotti et al. 2017, A study of gamma ray bursts with afterglow plateau phases associated with supernovae, A&A, 600 A98 11
- [16] M. G. Dainotti et al. 2022, The Optical Two- and Three-dimensional Fundamental Plane Correlations for Nearly 180 Gamma-Ray Burst Afterglows with Swift/UVOT, RATIR, and the Subaru Telescope, ApJS, 261 25
- [17] M. G. Dainotti et al. 2022, Optical and X-ray GRB Fundamental Planes as cosmological distance indicators, MNRAS, 514 2 1828-1856
- [18] M. G. Dainotti et al. 2022, Gamma-ray bursts, supernovae Ia, and baryon acoustic oscillations: A binned cosmological analysis, PASJ, 74 5 1095-1113
- [19] M. G. Dainotti et al. 2021, On the Hubble Constant Tension in the SNe Ia Pantheon Sample, ApJ, 912 150
- [20] S. Cao et al. 2022, Gamma-ray burst data strongly favour the three-parameter fundamental plane (Dainotti) correlation over the two-parameter one, MNRAS, 516 1 1386-1405
- [21] M. G. Dainotti et al. 2020, The X-Ray Fundamental Plane of the Platinum Sample, the Kilonovae, and the SNe Ib/c Associated with GRBs, ApJ, 904, 97
- [22] M. G. Dainotti et al. 2020, The Optical Luminosity–Time Correlation for More than 100 Gamma-Ray Burst Afterglows, ApJL, 905 L26
- [23] M. G. Dainotti et al. 2022, The Optical Two- and Three-dimensional Fundamental Plane Correlations for Nearly 180 Gamma-Ray Burst Afterglows with Swift/UVOT, RATIR, and the Subaru Telescope, ApJS, 261 25
- [24] Planck Collaboration: N. Aghanim et al. 2020, Planck 2018 results. VI. Cosmological parameters , A&A, 641 A6
- [25] M. G. Dainotti et al. 2022, Optical and X-ray GRB Fundamental Planes as cosmological distance indicators, MNRAS, 514 2 1828-1856
- [26] M. G. Dainotti et al. 2022, Gamma-Ray Bursts, Supernovae Ia and Baryon Acoustic Oscillations: a binned cosmological analysis, PASJ, 74 5 1095-1113
- [27] B. Efron & V. Petrosian 1992, A Simple Test of Independence for Truncated Data with Applications to Redshift Surveys, ApJ, 1 2 345-352
- [28] C. Kouveliotou et al. 1993, Identification of Two Classes of Gamma-Ray Bursts, ApJL, 413 L101
- [29] M. G. Bernardini 2015, Gamma-ray bursts and magnetars: Observational signatures and predictions, JHEAp, 7 64-72
- [30] A. Rowlinson et al. 2014, Constraining properties of GRB magnetar central engines using the observed plateau luminosity and duration correlation, MNRAS, 443 2 1779–1787
- [31] B. Zhang & P. Mészáros 2001, Gamma-Ray Burst Afterglow with Continuous Energy Injection: Signature of a Highly Magnetized Millisecond Pulsar, ApJ, 552 L35
- [32] G. Stratta et al. 2018, On the Magnetar Origin of the GRBs Presenting X-Ray Afterglow Plateaus, ApJ, 869 155
- [33] S. Dall’Osso et al. 2011, Gamma-ray bursts afterglows with energy injection from a spinning down neutron star, A&A, 526 A121
- [34] R. Willingale et al. 2007, Testing the Standard Fireball Model of Gamma-Ray Bursts Using Late X-Ray Afterglows Measured by Swift, ApJ, 662 2 1093-1110
- [35] Y. Avni, 1978, Parameter estimation for X-ray sources: positions, A&A, 66 307-309
- [36] G. Bargiacchi et al. 2023, Gamma-ray bursts, quasars, baryonic acoustic oscillations, and supernovae Ia: new statistical insights and cosmological constraints, MNRAS, 521 3 3909-3924
- [37] D. Scolnic et al. 2022, The Pantheon+ Analysis: The Full Data Set and Light-curve Release, ApJ, 938 2 113 15
- [38] G. Risaliti & E. Lusso 2015, A Hubble Diagram for Quasars, ApJ, 815 1 33 16
- [39] M. G. Dainotti et al. 2023, Reduced uncertainties up to 43% on the Hubble constant and the matter density with the SNe Ia with a new statistical analysis, under consideration of ApJ, arXiv:2303.06974
- [40] M. G. Dainotti et al. 2023, The gamma-ray bursts fundamental plane correlation as a cosmological tool, MNRAS, 518 2 2201-2240
- [41] D. Levine et al. 2022, Examining Two-Dimensional Luminosity-time Correlations for Gamma Ray Burst Radio Afterglows with VLA and ALMA, ApJ, 925 15
- [42] S. Cao et al. 2022, Standardizing Platinum Dainotti-correlated gamma-ray bursts, and using them with standardized Amati-correlated gamma-ray bursts to constrain cosmological model parameters, MNRAS, 512 1 439–454
- [43] J. Ryan et al. 2018, Constraints on dark energy dynamics and spatial curvature from Hubble parameter and baryon acoustic oscillation data, MNRAS, 480 759
- [44] S. Cao et al. 2021, Using Pantheon and DES supernova, baryon acoustic oscillation, and Hubble parameter data to constrain the Hubble constant, dark energy dynamics, and spatial curvature, MNRAS, 504 300
- [45] N. Khadka et al. 2021, Do gamma-ray burst measurements provide a useful test of cosmological models?, JCAP 09 042
- [46] L. Amati et al. 2002, Intrinsic spectra and energetics of BeppoSAX Gamma–Ray Bursts with known redshifts, A&A, 390 81-89
- [47] D. Foreman-Mackey et al. 2013, emcee: The MCMC Hammer, PASP, 125 306
- [48] A. Conley et al. 2011, Supernova Constraints and Systematic Uncertainties from the First 3 Years of the Supernova Legacy Survey, ApJS, 192 1
- [49] M. Betoule et al. 2014, Improved cosmological constraints from a joint analysis of the SDSS-II and SNLS supernova samples, A&A, 568 A22 32
- [50] D. M. Scolnic et al. 2018, The Complete Light-curve Sample of Spectroscopically Confirmed SNe Ia from Pan-STARRS1 and Cosmological Constraints from the Combined Pantheon Sample, ApJ, 859 2 101
- [51] M. G. Dainotti et al. 2023, A Stochastic Approach to Reconstruct Gamma-Ray-burst Light Curves, ApJS, 267 42
- [52] L. Amati et al. 2018, The THESEUS space mission concept: science case, design and expected performances, Adv. Space Res., 62 191
- [53] M. G. Dainotti et al. 2021, On the Hubble Constant Tension in the SNe Ia Pantheon Sample, ApJ, 912 150
- [54] M. G. Dainotti et al. 2022, On the evolution of the Hubble constant with the SNe Ia Pantheon Sample and Baryon Acoustic Oscillations: a feasibility study for GRB-cosmology in 2030, Galaxies, 10(1) 24
- [55] G. Bargiacchi et al. 2023, Gamma-Ray Bursts, Quasars, Baryonic Acoustic Oscillations, and Supernovae Ia: new statistical insights and cosmological constraints, MNRAS, 521 3 3909–3924
- [56] M. G. Dainotti et al. 2023, Reduced uncertainties up to 43% on the Hubble constant and the matter density with the SNe Ia with a new statistical analysis, submitted to ApJ
- [57] A. Lenart et al. 2023, A bias-free cosmological analysis with quasars alleviating H0 tension, ApJS, 264 46
DISCUSSION
ANDREA ROSSI: Why in the platinum sample you removed the GRBs with plateau duration ?
Answer: The removal of the GRBs with plateau allows to consider all cases with plateus well-defined. In some cases infact some large time gaps happen in the lightcurve at that time and small plateau duration are not well-sampled. This then may lead to a non-optimal estimation of the plateau features, namely, the end-of-plateau time and luminosity.