Discovery of a young, highly scattered pulsar PSR J10325804 with the Australian SKA Pathfinder
Abstract
We report the discovery of a young, highly scattered pulsar in a search for highly circularly polarized radio sources as part of the Australian Square Kilometre Array Pathfinder (ASKAP) Variables and Slow Transients (VAST) survey. In follow-up observations with Murriyang/Parkes, we identified PSR J10325804 and measured a period of 78.7 ms, dispersion measure (DM) of pc cm-3, rotation measure of rad m-2, and a characteristic age of 34.6 kyr. We found a pulse scattering timescale at 3 GHz of 22 ms, implying a timescale at 1 GHz of 3845 ms, which is the third most scattered pulsar known and explains its non-detection in previous pulsar surveys. We discuss the identification of a possible pulsar wind nebula and supernova remnant in the pulsar’s local environment by analyzing the pulsar spectral energy distribution and the surrounding extended emission from multiwavelength images. Our result highlights the possibility of identifying extremely scattered pulsars from radio continuum images. Ongoing and future large-scale radio continuum surveys will offer us an unprecedented opportunity to find more extreme pulsars (e.g., highly scattered, highly intermittent, highly accelerated), which will enhance our understanding of the characteristics of pulsars and the interstellar medium.
1 Introduction
When radio pulses from pulsars traverse the turbulent interstellar medium, multi-path propagation leads to temporal and spatial scattering, which in turn smears out the pulse profile. Despite extensive pulsar searching surveys spanning decades (e.g., Lyne et al., 1998; Manchester et al., 2001; Lorimer & Kramer, 2004; Keith et al., 2010; Stovall et al., 2014; Keane et al., 2018), some highly scattered pulsars remain challenging to detect with traditional time-domain techniques. These pulsars are especially hard to detect at frequencies GHz where the majority of pulsar surveys take place. The periodic signal is difficult (or impossible) to detect when the observed pulse profile width is comparable to the pulsar spin period. For a Kolmogorov distribution of interstellar medium inhomogeneities, the scattering timescale scales with frequency as (e.g., Romani et al., 1986). Most of the pulsar searching surveys are not sensitive to highly scattered pulsars as they are performed at a relatively low frequency, such as the High Time Resolution Universe Pulsar Survey (Keith et al., 2010) at 1.4 GHz, the Green Bank Northern Celestial Cap Pulsar Survey (Stovall et al., 2014) at 350 MHz, and the MPIfR-MeerKAT Galactic Plane survey (MMGPS; Padmanabh et al., 2023) currently at GHz (from 856 MHz to 1712 MHz).
As a concrete example, the most scattered pulsar found to date, PSR J18131749 (catalog PSR J1813-1749), was first identified as a pulsar candidate as a TeV source (Aharonian et al., 2005, 2006), an X-ray source (Brogan et al., 2005; Ubertini et al., 2005), and a supernova remnant association (Brogan et al., 2005). Gotthelf & Halpern (2009) measured the pulse period ms in X-rays, while no radio pulsations were detected with the Green Bank Telescope (GBT) at 1.4 GHz and 2 GHz (Halpern et al., 2012) or the Effelsberg Telescope at 1.4 GHz (Dzib et al., 2018), though radio interferometric observations did detect a variable point source at the pulsar position (Dzib et al., 2010, 2018). Radio pulsations were finally detected with the GBT at frequencies of 4.4–10.2 GHz (Camilo et al., 2021). The pulsar was detected with a high scattering timescale s at 2 GHz, which explains the non-detection in the previous pulsar searches.
The special properties of pulsars can help in identifying pulsar candidates in radio continuum images (e.g., Sett et al., 2023). Pulsars typically have steeper spectra than most other radio source types, with spectral indices , where (e.g., Bates et al., 2013; Posselt et al., 2023). Selecting steep-spectrum radio sources has long been used to find new pulsar candidates, and has successfully identified new pulsars including the first detected millisecond pulsar (Backer et al., 1982).
Pulsars are also one of a few astronomical sources measured to be strongly polarized (e.g., Lorimer & Kramer, 2004; Johnston & Kerr, 2018), and in particular circularly polarized. This means searches in circular polarisation are another method that can be used to find them in the image domain (e.g., Gaensler et al., 1998). For example, Lenc et al. (2018) conducted an all-sky circular polarization survey at 200 MHz with the Murchison Widefield Array (MWA; Bowman et al., 2013) and identified 33 known pulsars. Pritchard et al. (2021) performed a circular polarization survey with the Australian Square Kilometre Array Pathfinder (ASKAP; Johnston et al., 2008; Hotan et al., 2021) on the Rapid ASKAP Continuum Survey (RACS; McConnell et al., 2020) data and identified 37 known pulsars. In a similar search, Kaplan et al. (2019) serendipitously discovered a new millisecond pulsar, PSR J1431–6328, by identifying circularly polarized sources with the ASKAP data. Recently, Sobey et al. (2022) discovered two new pulsars, PSR J1049+5822 and PSR J1602+3901, with the Low-Frequency Array (LOFAR) Two-metre Sky Survey (LoTSS) as part of the Targeted search using LoTSS images for polarized pulsars (TULIPP) survey.
Finally, pulsars can show flux density variability due to, for example, pulse nulling (e.g., Backer, 1970), pulse intermittency (e.g., Kramer et al., 2006), interstellar scintillation (e.g., Rickett, 1970), and/or eclipsing by the companion (e.g., Broderick et al., 2016). Finding highly variable sources is another way to select pulsar candidates, but additional criteria (e.g., radio spectrum, polarization, multi-wavelength counterparts association) are often applied to make the sample size manageable. For example, Wang et al. (2022) identified 27 highly variable point sources towards the Magellanic Clouds with ASKAP, including a new pulsar. The new pulsar was the only source that was circularly polarized but which did not have a multi-wavelength counterpart. Dai et al. (2016) discussed the prospect of identifying pulsars in variance images. These image domain techniques can help us discover pulsars located in previously poorly explored parameter spaces, such as pulsars with high dispersion measure (DM), extreme nulling behaviors, and/or highly scattered pulses.
In this paper, we present the discovery of a young, highly scattered pulsar with the circular polarization search technique based on the data from two ASKAP projects: the Variable and Slow Transients (VAST; Murphy et al., 2013, 2021) survey and the Evolutionary Map of the Universe (EMU; Norris et al., 2011, 2021) survey. We confirmed the nature of the source in a dedicated search with the Parkes radio telescope, Murriyang. In Section 2, we summarise the discovery observations for the new pulsar. Analysis of archival observations and follow-up observations are discussed in Section 3. In Section 4, we discuss the properties and the local environment of the pulsar. We also discuss the prospects for identifying new pulsars, especially highly scattered ones, through image domain techniques. Conclusions of this work are presented in Section 5
2 Source Discovery
2.1 ASKAP Discovery
As part of the VAST survey, we have been conducting ASKAP observations of the southern Galactic plane. VAST observed 41 Galactic fields covering and totaling , repeating each field, on average, every two weeks 111ASKAP uses dynamic scheduling so we cannot give an exact cadence since 2022 November. Each observation had 12 mins integration at a central frequency of 888 MHz with a bandwidth of 288 MHz, achieving a typical sensitivity of 0.4 mJy beam-1 for the fields covering the Galactic plane. All four instrumental polarization products (XX, XY, YX, and YY) were recorded to allow images to be made in four Stokes parameters (I, Q, U, and V). The data were processed offline using the ASKAPSoft pipeline (Cornwell et al., 2011), from which we can get Stokes I/V images and catalogs. PKS B1934–638 (catalog PKS B1934-638) was used for the flux scale and bandpass calibration, and self-calibration was applied to correct for phase variations during the observation. A detailed description of data reduction is given by Murphy et al. (2021).
We conducted a search for highly circularly polarized sources in the VAST Galactic plane observations to identify interesting sources (also see Pritchard et al., 2021; Rose et al., 2023, for the results of other circular polarization searches with ASKAP data). Most of the detected sources were matched to known pulsars or stellar objects. We selected VAST J103250.4–580434 for further investigation because no clear multi-wavelength association was found. VAST J103250.4–580434 was first detected in a VAST observation on 2022 November 19 (Schedule Block 45739) with a Stokes I peak flux density of mJy beam-1, and a fractional circular polarization of : a higher magnitude than average for pulsars, but consistent with the population (Anumarlapudi et al., 2023). The broader search results will be presented in future work.
2.2 Murriyang Discovery
Motivated by the detection of circular polarization and lack of multiwavelength association, we conducted a follow-up observation of VAST J103250.4–580434 with the 64-m Parkes telescope, Murriyang, on 2023 February 24 (project code PX103) with the Ultra-Wideband Low (UWL) receiver (Hobbs et al., 2020), which provides a wide frequency coverage spanning 704 to 4032 MHz and has been pivotal in confirming pulsar candidates that are scarcely detectable below 1.4 GHz (Sengar et al., 2023). The data were recorded in 1-bit pulsar searching mode (total intensity) with the MEDUSA backend. The observation was 2500 seconds with a 32 s time resolution and 62.5 kHz frequency resolution (2048 channels per 128 MHz subband).
The periodic search was carried out with pulsar_miner 222https://github.com/alex88ridolfi/PULSAR_MINER(Ridolfi et al., 2021), an automated pulsar searching pipeline based on presto333https://github.com/scottransom/presto (Ransom, 2001). To run the search more efficiently, we divided the data into two segments (1250 s each) and only selected two groups of subbands (bottom band group from 832 to 1216 MHz considering the steep spectral indices for the normal pulsar population, and high band group from 2624 to 3008 MHz considering the potential high scattering and/or dispersion). The dispersion measure (DM) range that we searched was 2–1500 pc cm-3 with harmonic summing of 8 and no acceleration search applied. We only folded the candidates with a signal to noise ratio threshold of 8. We identified a strong pulsar candidate, now called PSR J10325804, with a period of 78.72 ms and a DM of 867.8 pc cm-3 in the high band group data. There is no previously published pulsar at this position in the ATNF pulsar catalog (Manchester et al., 2005), nor is there any unpublished discovery in the Pulsar Survey Scraper444https://pulsar.cgca-hub.org (Kaplan, 2022).
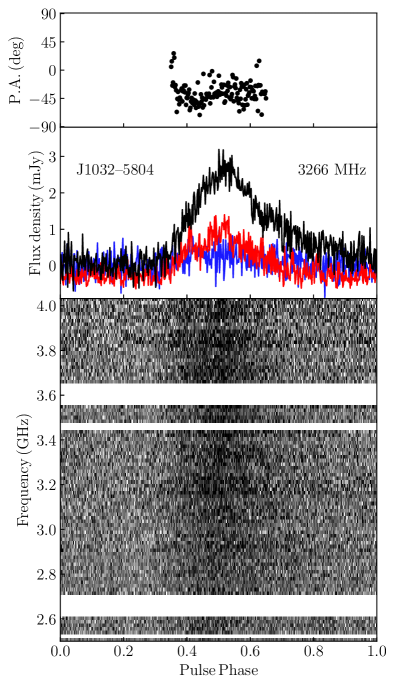
PSR J10325804 was measured to have a wide pulse profile, with a duty cycle 30% at 2.8 GHz (using the pulse width at 50% maximum). After the initial discovery, we also folded the data at frequencies ranging from 1216 to 1600 MHz (centered at 1408 MHz) and from 3648 to 4032 MHz (centered at 3840 MHz) respectively. We saw a clear periodic signal (25.5) from the data centered at 3.8 GHz, but no signal from the data centered at 1.4 GHz.
3 Follow-up Observations and Source Properties
3.1 Timing and Polarization
All timing observations were conducted at the Murriyang radio telescope using the UWL receiver and MEDUSA backend. Each observation was recorded in both fold and search mode with full Stokes parameters along with a noise diode observation. All data were coherently de-dispersed at the best DM value we could measure at the time of the observation (pc cm-3). The time resolution for each observation was 128 , with a bandwidth of 0.5 MHz per channel. Prior to the timing analysis, observations were first cleaned using clfd555https://github.com/v-morello/clfd. We also excised each observation affected by narrowband and impulsive radio-frequency interference (RFI) using pazi of the PSRCHIVE package. Using the highest SNR observation we created a standard profile using pas from the PSRCHIVE package (Hotan et al., 2004). Note that the pulsar is not visible below 2.5 GHz, therefore the UWL frequency band from 704–2500 MHz was removed from the analysis. All observations of the pulsar taken on 11 epochs were frequency scrunched to one sub-band and polarization scrunched to total intensity for timing (polarization analysis was performed separately). We divided the data into 1 to 4 sub-integrations depending on their signal to noise ratio. To generate the TOAs we used pat from PSRCHIVE, and employed the Fourier domain with Markov Chain Monte Carlo (FDM) algorithm. In total 26 TOAs were obtained over 11 epochs, and each TOA had signal to noise ratio greater than 15.
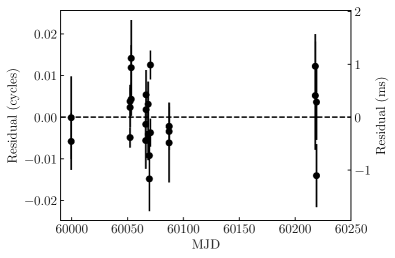
We fit the TOAs derived from the Parkes/Murriyang data in PINT (Luo et al., 2021), using only frequencies above 2.5 GHz. We were able to obtain a good timing solution connecting back to our discovery observation, as shown in Figure 1 and given in Table 1, without rejecting any TOAs from the solution. We initially fit only for the rotation frequency , but then added the frequency derivative once it was warranted by the residuals; the position was held fixed at the position from ATCA imaging. We verified that this solution was robust and unique using Algorithmic Pulsar Timing for Binaries (APTB; Taylor et al., 2023), which identified the same solution as we did by hand as the only solution. This solution has a reduced of 1.97, suggesting that the uncertainties may be slightly underestimated or that there is some timing noise present. Regardless, we leave the uncertainties in Table 1 as the unscaled values reported by PINT but note that they too may be slightly underestimated. There is also a contribution to the uncertainties on and from our uncertainties in the ATCA imaging position, which is not taken into account by PINT. Using Appendix A of Hartman et al. (2008), we find uncertainties of Hz and on and from the position uncertainties, comparable to those from the timing analysis. In the future, once the data span exceeds 1 yr, we will be able to fit for a more precise timing position and reduce those uncertainties further.
We find that the pulsar is young, with a characteristic age of only 34.6 kyr. Given the modest timespan of the current data, we cannot determine useful constraints on any higher timing derivatives. Allowing a fit for the second frequency derivative finds , consistent with 0, and implying a 3 upper limit on the braking index of . The distance to the pulsar is highly uncertain, with values from 4.3 kpc (YMW16 model, Yao et al., 2017) to kpc (NE2001 model, Cordes & Lazio, 2002) depending on the Galactic electron density model.
| Parameter | Value |
|---|---|
| Right Ascension (J2000)aaDerived from ATCA imaging. | |
| Declination (J2000)aaDerived from ATCA imaging. | |
| Start (MJD) | 59999.6 |
| End (MJD) | 60219.1 |
| Frequency (Hz) | 12.6998621581(4) |
| Frequency Derivative (Hz s-1) | |
| Epoch of Period (MJD) | 60100 |
| /DOF | 45.5/23 |
| RMS residual (s) | 504.7 |
| Dispersion Measure (pc cm-3) | 8194 |
| Rotation Measure (rad m-2) | 1 |
| Galactic Longitude (deg) | 285.436 |
| Galactic Latitude (deg) | +0.008 |
| Period (s) | 0.078741012111(2) |
| Period Derivative (s s-1) | |
| Characteristic Age (kyr) | 34.6 |
| Surface Magnetic Field (G) | |
| Spin-down Luminosity (erg s-1) | |
| Distance (kpc) | 4.3bbFrom the Yao et al. (2017) electron density model. |
| ccFrom the Cordes & Lazio (2002) electron density model. |
Note. — Quantities in parentheses are 1 uncertainties on the last digit, without any additional scaling. The JPL DE405 solar system ephemeris has been used and times refer to TDB (using TT = TAI+32.184 s).
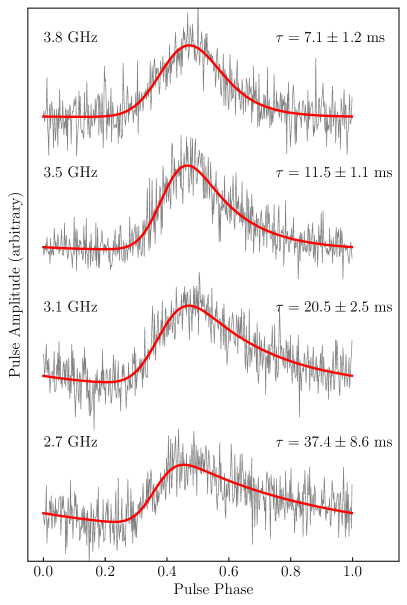
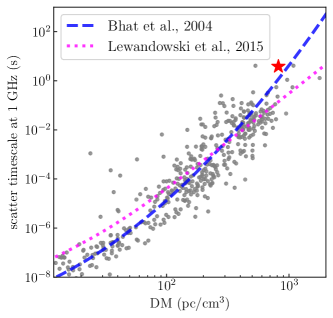
Once we had a timing solution, we co-added all of the available Parkes/Murriyang data into a single high-S/N dataset. We then fit for an exponential scattering model (e.g., Lorimer & Kramer, 2012). We assumed that the underlying profile model was a Gaussian, and that scattering convolved this with a frequency-dependent exponential. Dividing up the data above GHz into 4 sub-bands, we obtained the fits in Figure 2. The scattering timescale for each sub-band was fit independently: when we fit for a power-law frequency dependence we obtain a spectral index (with ), consistent with expectations from Kolmogorov turbulence (Cordes et al., 1986; Romani et al., 1986; Cordes & Rickett, 1998; Bhat et al., 2004), and a scattering timescale at 3 GHz of ms. The implied scattering timescale at 1 GHz was 3845 ms ( the pulse period), a factor of 3 greater than that predicted by Bhat et al. (2004) based on the DM, a factor of 27 greater than that predicted by Lewandowski et al. (2015a), and a factor of 28 greater than that predicted by Yao et al. (2017)666The model of Cordes & Lazio (2002) is not sensible along this line-of-sight for DM 620 pc cm-3.. However, the scattering timescale of PSR J10325804 is still largely consistent with the whole pulsar population (see Figure 3) considering the large internal uncertainties of these models.
Using the full Stokes fold mode (coherently dedispered) UWL observations we also conducted flux and polarization calibration. For polarization calibration, we used a short 2-min observation of a linearly polarized noise diode, which was obtained at the start of each observing session. We used the radio Galaxy PKS B0407–658 as a flux density reference, which is a more reliable calibration source for the UWL. Prior to performing any analysis all observations were manually cleaned from RFI. For both polarimetric and flux calibration of pulsar observations, we used PSRCHIVE’s pac pulsar archive calibration program which was first used to generate a calibrator database. This database file was then used to obtain a flux and polarization calibrated file. This methodology of flux and polarization calibration is similar to the one outlined in Lower et al. (2020) and references therein.
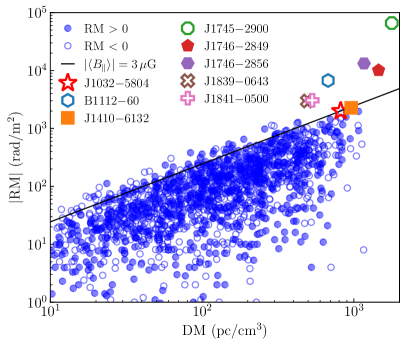
We then used the rmfit tool of PSRCHIVE to fit for the rotation measure (RM) in one of the highest signal-to-noise ratio observations. We find a strong detection777We used an RM search range between to 3000 rad m-2 to obtain the best rmfit value. with . Though the RM measurement of PSR J10325804 is almost three times the most extreme of known pulsars within 5 degrees of PSR J10325804, the average interstellar magnetic field along the line-of-sight G is consistent with the Galactic magnetic field model fitted by Han et al. (2018), and also with the Galactic pulsar distribution (see Figure 4). Based on the pulse profiles (see Figure 5), we find a circular polarization fraction of 10% at a frequency of 3 GHz, which is not consistent with the value of 25% found from ASKAP imaging at 843 MHz. We also check the polarization evolution at three UWL frequencies (2.7, 3.2, 3 8 GHz) and find that the circular polarization fraction remains similar across these three UWL bands. However, we caution that the very broad pulse profile makes establishing a reliable pulse baseline – and therefore the total-intensity pulsed flux density – difficult. We also find that there is very little position-angle change across the pulse, likely due to the long scattering timescale even at these frequencies (e.g., Li & Han, 2003; Noutsos et al., 2015).
Apart from examining the highest S/N observation, we also examined other observations taken at different epochs and found discrepancies in the RM values of up to 50 rad m-2 between them. These variations might resemble the changes in the magneto-ionic conditions observed in pulsars within the Galactic Center (albeit on a smaller scale; Desvignes et al., 2018; Abbate et al., 2023) or elsewhere (Johnston et al., 2021). They could also be due to instrumental effects. Furthermore, different levels of RFI excision and changing SNRs coupled with the highly scattered pulse profiles can potentially cause these discrepancies. Our ongoing investigation aims to ascertain whether these fluctuations stem from instrumental factors, determine the time frame of these variations, and establish any potential correlations with changes in DM. This comprehensive analysis is the subject of future work.
3.2 Radio Continuum
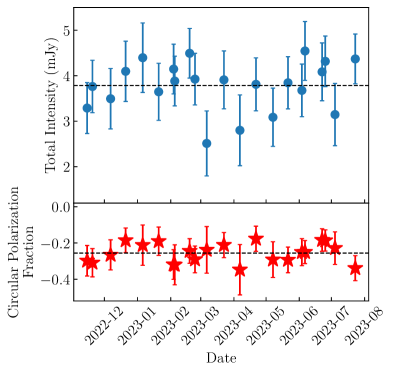
We looked at all available epochs of ASKAP data from VAST (22 observations so far) to probe the flux variability of PSR J10325804 (see Figure 6). We used forced flux measurements888We performed the fitting at the source position with the synthesized beam of that epoch. to deal with non-detections. Both the flux density and circular polarization fraction are consistent with no variability, with of for the flux density and for the polarization fraction, both for 21 degrees-of-freedom.
We also checked other ASKAP surveys from the CSIRO ASKAP Science Data Archive (CASDA). PSR J10325804 was detected in the RACS-mid survey (Duchesne et al., 2023) with a peak flux density of mJy beam-1 at 1367.5 MHz. It was also detected in the Evolutionary Map of the Universe (EMU; Norris et al. 2011, 2021) project with a peak flux density of mJy beam-1 and mJy beam-1 in the EMU fields 101760 (Schedule Block 46953) and 102955 (Schedule Block 46915) at 943.5 MHz, respectively999The EMU observations are typically 10 hrs, and the high flux uncertainties are mainly from the extended emission nearby..
We also checked the GaLactic and Extragalactic All-sky Murchison Widefield Array (GLEAM; Wayth et al., 2015; Hurley-Walker et al., 2017) survey data. There were no detections of the pulsar in any GLEAM bands, with a 3 upper limit of 1.62 Jy beam-1, 0.78 Jy beam-1, 0.28 Jy beam-1, and 0.14 Jy beam-1 at 88 MHz, 118 MHz, 154 MHz, and 200 MHz, respectively. The elliptical structure in the ASKAP images is visible, albeit at low resolution and significance.
Unlike most pulsars whose radio spectra can be modeled by a simple power law (e.g., Bates et al., 2013), the spectrum of PSR J10325804 may peak at 1 GHz and decline at higher and lower frequencies. To obtain the spectral energy distribution over a wide frequency range, we observed PSR J10325804 with the Australian Telescope Compact Array (ATCA) on 2023 Aug 21 (project code C3363) with 6D configuration in L (1–3 GHz) and C/X (5–7 GHz and 8–10 GHz) bands for three hours each. The observations were calibrated using PKS B1934–638 (catalog PKS B1934-638) for the flux density scale and the instrumental bandpass. PMN J1047–6217 (catalog PMN J1047-6217) was used for phase calibration. We used Casa to perform both the data calibration and the continuum imaging. We split each band into two parts to image the data. We detected a compact radio source at the pulsar position in all six subbands (see Table 2). The best-fit position of PSR J10325804 from the ATCA observation (based on the X-band data) is RA , Dec , which is within the ASKAP positional error circle.
| Frequency Range | ||
|---|---|---|
| (MHz) | (mJy/beam) | (mJy/beam) |
| 1076–2100 | ||
| 2100–3124 | ||
| 4476–5500 | ||
| 5500–6524 | ||
| 7976–9000 | ||
| 9000–10024 |
3.3 Swift X-ray Observations
Motivated by the fact that PSR J10325804 seems to be young and energetic, we looked for available X-ray data but there were no observations with Chandra or XMM-Newton that covered this location. There was one short observation with the Neil Gehrels Swift Observatory (Gehrels et al., 2004), but the duration was only 400 s. Therefore we requested a longer Director’s Discretionary Time observation. We observed PSR J10325804 using the Swift X-ray Telescope (XRT; Burrows et al. 2005) for a total of 2242 s in two exposures on 2023 May 22 and 2023 May 26. We retrieved the merged data-set created with the online analysis tools101010https://www.swift.ac.uk/user_objects/.. We find 0 events within of PSR J10325804, and derive a 95% upper limit on the count-rate of .
To interpret the X-ray upper limit, we first convert the DM into a hydrogen column density using the relationship of He et al. (2013), and find . We assume a power-law X-ray spectrum with index , typical of young pulsars like PSR J10325804 (Helfand et al., 2007; Kargaltsev & Pavlov, 2008; Kargaltsev et al., 2012, although Gotthelf 2003 would predict a flatter spectrum for this ). This then gives an upper limit to the unabsorbed flux (0.5–8 keV) of , or an upper limit to the luminosity of , where the distance is kpc. We can compare this with the spin-down luminosity and find . This is lower than many young pulsars but not inconsistent with the tail of the population (Kargaltsev & Pavlov, 2008; Kargaltsev et al., 2012). A deeper X-ray observation may be able to more robustly constrain any X-ray emission, although the highly-uncertain distance will make any constraints somewhat weak.
4 Discussion
PSR J10325804 was detected as a point source in all ASKAP and ATCA observations. Despite the large scattering timescale, the angular broadening effect is small compared to the synthesized beam of all images. For a source at a distance scattered by a single thin screen at a distance , the expected full width at half maximum of angular broadening follows
where is the scattering timescale and is the speed of light (Cordes & Lazio, 1997). Assuming kpc, and , the expected angular broadening is . All synthesized beam sizes are much larger than the expected value at corresponding frequencies (e.g., , while the ATCA synthesized beam at 2.1 GHz is ). The large scattering timescale also leads to low-level time variability in the image domain. Assuming a Kolmogorov spectrum (e.g., Rickett, 1977), we calculated a diffractive scintillation bandwidth of kHz and a scintillation timescale of s at 888 MHz. Both the scintillation bandwidth and the timescale are much smaller than those for typical VAST observations (288 MHz and 12 mins), which could explain the non-variability of the source in the VAST survey.
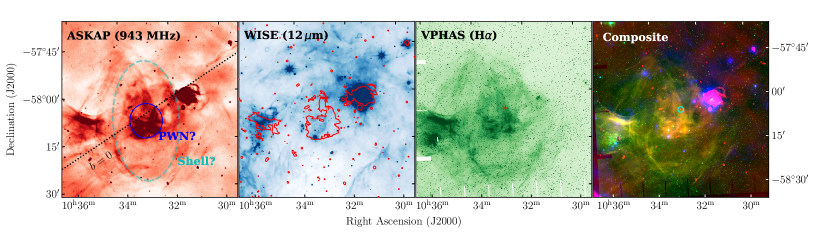
Motivated by the youth of PSR J10325804, we searched for an associated supernova remnant (SNR). There are no cataloged SNRs coincident with the pulsar, with the closest away (Green, 2019, 2022 December version). We therefore examined deeper radio images from the EMU project111111The ATCA images from Section 3.2 were not useful in searching for extended emission because of limited coverage.. The 10-hour EMU observation reaches a sensitivity of 28 Jy beam-1 with a resolution of 15′′. We retrieved EMU field 101760 from CASDA. Figure 7 shows a cutout of the region around PSR J10325804. There is a considerable amount of extended emission around the position of PSR J10325804 in the EMU image, with a potential SNR shell outlined in cyan and a more compact emission region (potentially a pulsar wind nebula or PWN) outlined in blue. However, we caution that there is a lot of other extended emission in this region and it is not confined to only the area around PSR J10325804, suggesting that there could be contributions from Galactic H II regions or unrelated synchrotron emission. Unfortunately, difficulties in robustly deconvolving the complex extended emission in this region prevent us from establishing a reliable in-band spectral index that might help discriminate between these sources of emission. Nor can we identify a radio image at another wavelength to do the same. Instead we examined the 12 m image from ALLWISE (Cutri et al., 2013). We also assembled an H mosaic from 6 individual exposures from the VST Photometric H Survey (VPHAS; Drew et al. 2014), which we mosaiced together with swarp (Bertin et al., 2002) to remove the gaps between the individual detectors. These images are shown in Figure 7. Plotting the EMU contours on the ALLWISE image, we see that most of the radio emission is roughly traced by the 12 m emission as expected for thermal bremsstrahlung emission from H II regions (e.g., Condon et al., 1999; Condon & Ransom, 2016; Khan et al., 2022). However, the central emission closest to PSR J10325804, the putative PWN, does not show any emission at 12 m. That region is bright in H, and there is also a good correspondence between the diffuse radio emission (putative PWN) surrounding PSR J10325804 and the diffuse H emission, including narrow filaments (putative shell). Other regions that are bright at 12 m are seen at radio and optical wavelengths, suggesting thermal emission, but the region surrounding the pulsar generally lacks mid-infrared emission. This suggests that it may in fact be non-thermal emission associated with PSR J10325804, but we will need better multi-wavelength imaging (including potentially deeper X-ray images) or optical spectroscopy to confirm this.
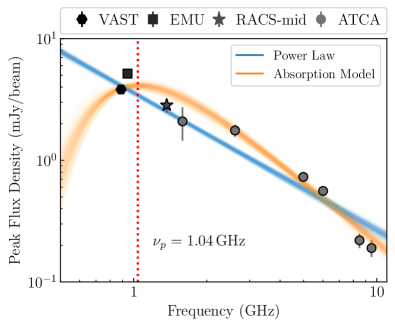
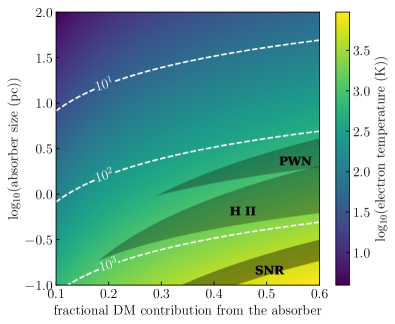
The SED of PSR J10325804 is shown in Figure 8 (we excluded GLEAM data points here as they are not constraining). The SED is ambiguous and noisy: it may continue as a typical pulsar power-law, but it also may peak at a frequency GHz. This may be evidence of gigahertz-peaked spectrum (GPS) behavior. Previous studies have suggested that the origin of the gigahertz spectral turnover is likely caused by the absorption from the pulsar ambient environment, such as supernova remnants (SNRs), pulsar wind nebula (PWNe), and H II regions (e.g., Kijak et al., 2011; Rajwade et al., 2016). In Figure 8, we fit the SED of PSR J10325804 with a simple power-law and the thermal free-free absorption model described by Lewandowski et al. (2015b)
where is the pulsar’s intrinsic flux density at 1 GHz, is the pulsar’s intrinsic spectral index, and (emission measure ; , , and are the absorbing material electron density, size, and electron temperature, respectively). For the power-law model, we found a spectral index of . For the absorption model we estimated , , and , and found the peak frequency GHz. The peak frequency for PSR J10325804 is consistent with the known GPS pulsar population (see Figure 7 in Kijak et al. 2021). We also note that there are deviations from both the free-free absorption model and the power-law model. We compared these two models using the -statistic (e.g., Weisberg, 2005). The distribution of the -statistic follows an -distribution with , degrees of freedom. We calculated an -statistic of 6.80 with a corresponding -value of 0.04, which means that the free-free absorption model fits significantly better than the power law model.
In Figure 9, we show the constraints on the electron density and temperature of the absorber based on the fitted parameters and considered three scenarios: a dense SNR filament (with pc), a PWN (with pc), and a cold H II region (with pc). The results are broadly consistent with either the SNR filament or the PWN scenario (see Kijak et al. 2021, and references therein), which agrees with the EMU extended emission analysis above. For both scenarios, the expected fractional DM contribution from the local environment is around 50%, which could potentially break the inferences we made in previous discussions regarding the correlations between DM, RM, and scattering timescale. For example, with a large DM contribution, the magnetic field of the local environment could dominate the RM value we measured, which could lead to a wrong estimation of the average interstellar magnetic field along the line of sight. The relation between scattering timescales and DMs could also be significantly affected if there are additional screens near the pulsar (e.g., Cordes et al., 2016).
Besides free-free absorption, synchrotron self-absorption in the pulsar magnetosphere (Sieber, 1973) or flux dilution caused by anomalous scattering (Cordes & Lazio, 2001; Dembska et al., 2014) can also lead to a decrease in the flux density at lower frequencies. Given that the data we have are all above 0.8 GHz, it is hard to get a robust constraint on the surrounding environment for PSR J10325804 without low-frequency observations. Further deep radio continuum observations (especially at lower frequencies) of the pulsar itself and the surrounding extended emission and/or deeper X-ray images may be helpful in understanding the nature of the pulsar spectrum and probing the interstellar medium in the pulsar’s local environment (e.g., potential SNR association).
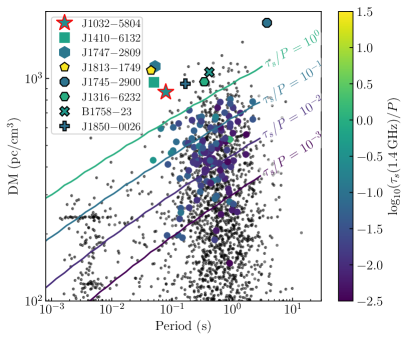
PSR J10325804 is the third most scattered pulsar known, which makes it hard to detect in periodicity searches. In Figure 10 we plot the DM vs. period for the pulsars in the ATNF pulsar catalog (Manchester et al., 2005). In general, as DM increases so does the scattering (Cordes & Lazio, 2002; Bhat et al., 2004; Lewandowski et al., 2015a; Yao et al., 2017). Those sources with the highest DMs and the shortest periods will then be the hardest to detect in a pulsation search. This is illustrated not only by the case of PSR J10325804, but by other similar sources such as PSR J18131749 (Camilo et al., 2021; Gotthelf & Halpern, 2009; Halpern et al., 2012; Dzib et al., 2010). While PSR J18131749 is even more scattered than PSR J10325804, both of them are undetectable as pulsed sources at the normal search frequency of 1.4 GHz. This is consistent with the fact that the location of PSR J10325804 was searched as part of the Parkes multi-beam pulsar survey (Manchester et al., 2001) and the deeper High Time Resolution Universe mid-latitude survey (Keith et al., 2010; Bates et al., 2011a), both centered at 1.4 GHz, but it was not identified.
Many previous pulsar surveys are not sensitive to the highly scattered short-period pulsars as most of them were conducted at lower frequencies (ranging from 300 to 1400 MHz). Searching for pulsars at high frequency is one of the ways to detect more new pulsars of this kind. However, only a few new pulsars have been discovered in previous very high frequency (GHz) pulsar surveys (e.g., Bates et al., 2011b; Eatough et al., 2021; Torne et al., 2021; Suresh et al., 2022), which is possibly due to the limited sensitivity (flux densities of pulsars will be low at high frequencies due to their steep radio spectra) and insufficient sky coverage (small beam size at high frequency makes it hard to tile the sky efficiently). With new high-frequency pulsar surveys, such as MMGPS at S-band (1.7–3.5 GHz), more scattered pulsars are expected to be discovered (Padmanabh et al., 2023). To roughly quantify this, we used PsrPopPy (Bates et al., 2014) 121212https://github.com/samb8s/PsrPopPy to model the millisecond pulsar (MSP) and normal pulsar populations. We found that 20% (5%) of MSPs (normal pulsars) could be missed in pulsar surveys at 1.4 GHz (assuming the sensitivity to be 0.1 mJy) due to scattering (i.e., scattering timescale longer than the period). When we change the central frequency to GHz, 70% of pulsars will be undetectable due to the lower flux density (assuming that the sensitivities for 1.4 GHz and 3 GHz surveys are both 0.1 mJy), but 70% (90%) of previously undiscovered MSPs (normal pulsars) will be visible to the 3 GHz survey, though the computational cost could be prohibitively expensive due to the need to search for a large number of pointings.
The prospects for new pulsar discovery in imaging domain are promising with the development of new radio continuum surveys, including the GaLactic and Extragalactic All-Sky MWA Extended Survey ((GLEAM-X Hurley-Walker et al., 2022), the LOFAR Two-metre Sky Survey (LoTSS; Shimwell et al., 2017), the ASKAP Rapid Continuum Survey (RACS; McConnell et al. 2020; Duchesne et al. 2023), the Evolutionary Map of the Universe survey with ASKAP(EMU; Norris et al., 2011, 2021), the Karl G. Jansky Very Large Array (VLA) Sky Survey (VLASS; Lacy et al., 2020), and The HUNt for Dynamic and Explosive Radio transients with MeerKAT (THUNDERKAT; Fender et al., 2016) survey. For ASKAP surveys, we considered shallow surveys ( with 12 mins integration time achieving a typical detection threshold of 1.5 mJy) and deep surveys (with 10 hrs integration time achieving a typical detection threshold of 50 Jy), and quantified the potential new detections with PsrPopPy (Bates et al., 2014). We expected to detect 4 (8) highly scattered 131313Here we only considered the pulsars that are undetectable with a 1.4 GHz pulsar survey. Some of the pulsars discussed below are expected to be detected in a 3 GHz pulsar survey as well. MSPs (normal pulsars) in shallow surveys, and 483 (600) in deep surveys. Assuming 10% of pulsars are detected with circularly polarized emission (e.g., Johnston & Kerr, 2018), the number of highly scattered MSPs (normal pulsars) that can be detected via circular polarization searches alone with ASKAP is expected to be 1 (1) for shallow surveys and 48 (60) for deep surveys. It is unlikely for shallow surveys to discover a large number of highly scattered pulsars with circular polarization searches, but using deep surveys or stacking several shallow surveys can potentially discover a handful of new scattered pulsars. Besides circular polarization searches, other image domain techniques, such as searching for steep spectrum sources, high energy sources (e.g., X-ray, -ray) associations, and potential SNRs (candidate) associations, can also be used in discovering extremely scattered pulsars.
5 Conclusions
We discovered a young, highly scattered pulsar PSR J10325804 in the Galactic plane in a search for circularly polarized sources as part of the ongoing ASKAP-VAST survey. The pulsar has a period of 78.7 ms and a DM of pc cm-3. The long scattering timescale s makes it the third most scattered pulsar known and also explains the non-detection in previous pulsar surveys despite its high flux density. Besides circular polarization, linear polarization emission was also detected in the follow-up observations with Murriyang/Parkes. The pulsar has an RM of rad m-2. Though the measured RM is among the highest RM detected, it is consistent with the general RM–DM trend, and also the Galactic large-scale magnetic field model (e.g., Han et al., 2018).
PSR J10325804 is young, with a characteristic age of kyr. No X-ray emission was detected in Swift observations, which gives an upper limit to the 0.5-8 keV X-ray luminosity of erg s-1. The ratio of the X-ray luminosity to the spin-down luminosity is lower than many young pulsars, but is still consistent with the tail of the population. Further deeper X-ray observation may be able to constrain any X-ray emission from the pulsar itself, the PWN, or the SNR shell. ATCA observations combined with the archival ASKAP observations revealed that PSR J10325804 is a potential GPS source, which suggested strong absorption along the line-of-sight. A preliminary analysis in this work based on the surrounding extended radio emission and the pulsar radio spectrum may infer the existence of the PWN or SNR. Further observations to measure the spectral energy distribution of the pulsar itself and the spectral map of the extended emission are useful to understand its local environment, and hence probe the properties of the interstellar medium in the vicinity of the pulsar.
This discovery highlights the possibility of discovering new pulsars (especially extreme ones) from continuum images. We can identify more highly scattered pulsars like PSR J10325804 with the high sensitivity and good resolution data from the ongoing ASKAP surveys. In the future, with the construction of next-generation radio telescopes such as the Square Kilometre Array, the Deep Synoptic Array, and the Next Generation Very Large Array, imaging domain searches will become a more powerful tool for discovering extreme pulsars (e.g., highly accelerated, highly scattered, and highly intermittent) that are hard to find via traditional surveys.
References
- Abbate et al. (2023) Abbate, F., Noutsos, A., Desvignes, G., et al. 2023, MNRAS, 524, 2966, doi: 10.1093/mnras/stad2047
- Aharonian et al. (2005) Aharonian, F., Akhperjanian, A. G., Aye, K. M., et al. 2005, Science, 307, 1938, doi: 10.1126/science.1108643
- Aharonian et al. (2006) Aharonian, F., Akhperjanian, A. G., Bazer-Bachi, A. R., et al. 2006, ApJ, 636, 777, doi: 10.1086/498013
- Anumarlapudi et al. (2023) Anumarlapudi, A., Ehlke, A., Jones, M. L., et al. 2023, ApJ, 956, 28, doi: 10.3847/1538-4357/aceb5d
- Astropy Collaboration et al. (2013) Astropy Collaboration, Robitaille, T. P., Tollerud, E. J., et al. 2013, A&A, 558, A33, doi: 10.1051/0004-6361/201322068
- Astropy Collaboration et al. (2018) Astropy Collaboration, Price-Whelan, A. M., Sipőcz, B. M., et al. 2018, AJ, 156, 123, doi: 10.3847/1538-3881/aabc4f
- Backer (1970) Backer, D. C. 1970, Nature, 228, 42, doi: 10.1038/228042a0
- Backer et al. (1982) Backer, D. C., Kulkarni, S. R., Heiles, C., Davis, M. M., & Goss, W. M. 1982, Nature, 300, 615, doi: 10.1038/300615a0
- Bates et al. (2014) Bates, S. D., Lorimer, D. R., Rane, A., & Swiggum, J. 2014, MNRAS, 439, 2893, doi: 10.1093/mnras/stu157
- Bates et al. (2013) Bates, S. D., Lorimer, D. R., & Verbiest, J. P. W. 2013, MNRAS, 431, 1352, doi: 10.1093/mnras/stt257
- Bates et al. (2011a) Bates, S. D., Bailes, M., Bhat, N. D. R., et al. 2011a, MNRAS, 416, 2455, doi: 10.1111/j.1365-2966.2011.18416.x
- Bates et al. (2011b) Bates, S. D., Johnston, S., Lorimer, D. R., et al. 2011b, MNRAS, 411, 1575, doi: 10.1111/j.1365-2966.2010.17790.x
- Bertin et al. (2002) Bertin, E., Mellier, Y., Radovich, M., et al. 2002, in Astronomical Society of the Pacific Conference Series, Vol. 281, Astronomical Data Analysis Software and Systems XI, ed. D. A. Bohlender, D. Durand, & T. H. Handley, 228
- Bhat et al. (2004) Bhat, N. D. R., Cordes, J. M., Camilo, F., Nice, D. J., & Lorimer, D. R. 2004, ApJ, 605, 759, doi: 10.1086/382680
- Bowman et al. (2013) Bowman, J. D., Cairns, I., Kaplan, D. L., et al. 2013, PASA, 30, e031, doi: 10.1017/pas.2013.009
- Broderick et al. (2016) Broderick, J. W., Fender, R. P., Breton, R. P., et al. 2016, MNRAS, 459, 2681, doi: 10.1093/mnras/stw794
- Brogan et al. (2005) Brogan, C. L., Gaensler, B. M., Gelfand, J. D., et al. 2005, ApJ, 629, L105, doi: 10.1086/491471
- Burrows et al. (2005) Burrows, D. N., Hill, J. E., Nousek, J. A., et al. 2005, Space Sci. Rev., 120, 165, doi: 10.1007/s11214-005-5097-2
- Camilo et al. (2009) Camilo, F., Ransom, S. M., Gaensler, B. M., & Lorimer, D. R. 2009, ApJ, 700, L34, doi: 10.1088/0004-637X/700/1/L34
- Camilo et al. (2021) Camilo, F., Ransom, S. M., Halpern, J. P., & Roshi, D. A. 2021, ApJ, 917, 67, doi: 10.3847/1538-4357/ac0720
- Condon et al. (1999) Condon, J. J., Kaplan, D. L., & Terzian, Y. 1999, ApJS, 123, 219, doi: 10.1086/313236
- Condon & Ransom (2016) Condon, J. J., & Ransom, S. M. 2016, Essential Radio Astronomy
- Cordes & Lazio (1997) Cordes, J. M., & Lazio, T. J. W. 1997, ApJ, 475, 557, doi: 10.1086/303569
- Cordes & Lazio (2001) —. 2001, ApJ, 549, 997, doi: 10.1086/319442
- Cordes & Lazio (2002) Cordes, J. M., & Lazio, T. J. W. 2002, arXiv e-prints, astro, doi: 10.48550/arXiv.astro-ph/0207156
- Cordes et al. (1986) Cordes, J. M., Pidwerbetsky, A., & Lovelace, R. V. E. 1986, ApJ, 310, 737, doi: 10.1086/164728
- Cordes & Rickett (1998) Cordes, J. M., & Rickett, B. J. 1998, ApJ, 507, 846, doi: 10.1086/306358
- Cordes et al. (2016) Cordes, J. M., Shannon, R. M., & Stinebring, D. R. 2016, ApJ, 817, 16, doi: 10.3847/0004-637X/817/1/16
- Cornwell et al. (2011) Cornwell, T., Humphreys, B., Lenc, E., et al. 2011, ASKAP science processing
- Cutri et al. (2013) Cutri, R. M., Wright, E. L., Conrow, T., et al. 2013, Explanatory Supplement to the AllWISE Data Release Products, Explanatory Supplement to the AllWISE Data Release Products, by R. M. Cutri et al.
- Dai et al. (2016) Dai, S., Johnston, S., Bell, M. E., et al. 2016, MNRAS, 462, 3115, doi: 10.1093/mnras/stw1871
- Dembska et al. (2014) Dembska, M., Kijak, J., Jessner, A., et al. 2014, MNRAS, 445, 3105, doi: 10.1093/mnras/stu1905
- Desvignes et al. (2018) Desvignes, G., Eatough, R. P., Pen, U. L., et al. 2018, ApJ, 852, L12, doi: 10.3847/2041-8213/aaa2f8
- Drew et al. (2014) Drew, J. E., Gonzalez-Solares, E., Greimel, R., et al. 2014, MNRAS, 440, 2036, doi: 10.1093/mnras/stu394
- Duchesne et al. (2023) Duchesne, S. W., Thomson, A. J. M., Pritchard, J., et al. 2023, PASA, 40, e034, doi: 10.1017/pasa.2023.31
- Dzib et al. (2010) Dzib, S., Loinard, L., & Rodríguez, L. F. 2010, Rev. Mexicana Astron. Astrofis., 46, 153
- Dzib et al. (2018) Dzib, S. A., Rodríguez, L. F., Karuppusamy, R., Loinard, L., & Medina, S.-N. X. 2018, ApJ, 866, 100, doi: 10.3847/1538-4357/aada07
- Eatough et al. (2021) Eatough, R. P., Torne, P., Desvignes, G., et al. 2021, MNRAS, 507, 5053, doi: 10.1093/mnras/stab2344
- Fender et al. (2016) Fender, R., Woudt, P. A., Corbel, S., et al. 2016, in MeerKAT Science: On the Pathway to the SKA, 13, doi: 10.22323/1.277.0013
- Gaensler et al. (1998) Gaensler, B. M., Manchester, R. N., & Green, A. J. 1998, MNRAS, 296, 813, doi: 10.1046/j.1365-8711.1998.01387.x
- Gaensler & Slane (2006) Gaensler, B. M., & Slane, P. O. 2006, ARA&A, 44, 17, doi: 10.1146/annurev.astro.44.051905.092528
- Gehrels et al. (2004) Gehrels, N., Chincarini, G., Giommi, P., et al. 2004, ApJ, 611, 1005, doi: 10.1086/422091
- Gotthelf (2003) Gotthelf, E. V. 2003, ApJ, 591, 361, doi: 10.1086/375124
- Gotthelf & Halpern (2009) Gotthelf, E. V., & Halpern, J. P. 2009, ApJ, 700, L158, doi: 10.1088/0004-637X/700/2/L158
- Green (2019) Green, D. A. 2019, Journal of Astrophysics and Astronomy, 40, 36, doi: 10.1007/s12036-019-9601-6
- Halpern et al. (2012) Halpern, J. P., Gotthelf, E. V., & Camilo, F. 2012, Spin-down Measurement of PSR J1813-1749: The Energetic Pulsar Powering HESS J1813-178, doi: 10.1088/2041-8205/753/1/L14
- Han et al. (2018) Han, J. L., Manchester, R. N., van Straten, W., & Demorest, P. 2018, ApJS, 234, 11, doi: 10.3847/1538-4365/aa9c45
- Hartman et al. (2008) Hartman, J. M., Patruno, A., Chakrabarty, D., et al. 2008, ApJ, 675, 1468, doi: 10.1086/527461
- He et al. (2013) He, C., Ng, C. Y., & Kaspi, V. M. 2013, ApJ, 768, 64, doi: 10.1088/0004-637X/768/1/64
- Helfand et al. (2007) Helfand, D. J., Gotthelf, E. V., Halpern, J. P., et al. 2007, ApJ, 665, 1297, doi: 10.1086/519734
- Hobbs et al. (2020) Hobbs, G., Manchester, R. N., Dunning, A., et al. 2020, PASA, 37, e012, doi: 10.1017/pasa.2020.2
- Hotan et al. (2004) Hotan, A. W., van Straten, W., & Manchester, R. N. 2004, PASA, 21, 302, doi: 10.1071/AS04022
- Hotan et al. (2021) Hotan, A. W., Bunton, J. D., Chippendale, A. P., et al. 2021, PASA, 38, e009, doi: 10.1017/pasa.2021.1
- Hurley-Walker et al. (2017) Hurley-Walker, N., Callingham, J. R., Hancock, P. J., et al. 2017, MNRAS, 464, 1146, doi: 10.1093/mnras/stw2337
- Hurley-Walker et al. (2022) Hurley-Walker, N., Galvin, T. J., Duchesne, S. W., et al. 2022, PASA, 39, e035, doi: 10.1017/pasa.2022.17
- Johnston & Kerr (2018) Johnston, S., & Kerr, M. 2018, MNRAS, 474, 4629, doi: 10.1093/mnras/stx3095
- Johnston et al. (2008) Johnston, S., Taylor, R., Bailes, M., et al. 2008, Experimental Astronomy, 22, 151, doi: 10.1007/s10686-008-9124-7
- Johnston et al. (2021) Johnston, S., Sobey, C., Dai, S., et al. 2021, MNRAS, 502, 1253, doi: 10.1093/mnras/stab095
- Kaplan (2022) Kaplan, D. L. 2022, PSS: Pulsar Survey Scraper, Astrophysics Source Code Library, record ascl:2210.001. http://ascl.net/2210.001
- Kaplan et al. (2019) Kaplan, D. L., Dai, S., Lenc, E., et al. 2019, ApJ, 884, 96, doi: 10.3847/1538-4357/ab397f
- Kargaltsev et al. (2012) Kargaltsev, O., Durant, M., Pavlov, G. G., & Garmire, G. 2012, ApJS, 201, 37, doi: 10.1088/0067-0049/201/2/37
- Kargaltsev & Pavlov (2008) Kargaltsev, O., & Pavlov, G. G. 2008, in American Institute of Physics Conference Series, Vol. 983, 40 Years of Pulsars: Millisecond Pulsars, Magnetars and More, ed. C. Bassa, Z. Wang, A. Cumming, & V. M. Kaspi, 171–185, doi: 10.1063/1.2900138
- Keane et al. (2018) Keane, E. F., Barr, E. D., Jameson, A., et al. 2018, MNRAS, 473, 116, doi: 10.1093/mnras/stx2126
- Keith et al. (2010) Keith, M. J., Jameson, A., van Straten, W., et al. 2010, MNRAS, 409, 619, doi: 10.1111/j.1365-2966.2010.17325.x
- Khan et al. (2022) Khan, S., Pandian, J. D., Lal, D. V., et al. 2022, A&A, 664, A140, doi: 10.1051/0004-6361/202140914
- Kijak et al. (2021) Kijak, J., Basu, R., Lewandowski, W., & Rożko, K. 2021, ApJ, 923, 211, doi: 10.3847/1538-4357/ac3082
- Kijak et al. (2011) Kijak, J., Lewandowski, W., Maron, O., Gupta, Y., & Jessner, A. 2011, A&A, 531, A16, doi: 10.1051/0004-6361/201014274
- Kramer et al. (2006) Kramer, M., Lyne, A. G., O’Brien, J. T., Jordan, C. A., & Lorimer, D. R. 2006, Science, 312, 549, doi: 10.1126/science.1124060
- Lacy et al. (2020) Lacy, M., Baum, S. A., Chandler, C. J., et al. 2020, PASP, 132, 035001, doi: 10.1088/1538-3873/ab63eb
- Lee et al. (2013) Lee, H.-G., Moon, D.-S., Koo, B.-C., et al. 2013, ApJ, 770, 143, doi: 10.1088/0004-637X/770/2/143
- Lenc et al. (2018) Lenc, E., Murphy, T., Lynch, C. R., Kaplan, D. L., & Zhang, S. N. 2018, MNRAS, 478, 2835, doi: 10.1093/mnras/sty1304
- Lewandowski et al. (2015a) Lewandowski, W., Kowalińska, M., & Kijak, J. 2015a, MNRAS, 449, 1570, doi: 10.1093/mnras/stv385
- Lewandowski et al. (2015b) Lewandowski, W., Rożko, K., Kijak, J., & Melikidze, G. I. 2015b, ApJ, 808, 18, doi: 10.1088/0004-637X/808/1/18
- Li & Han (2003) Li, X. H., & Han, J. L. 2003, A&A, 410, 253, doi: 10.1051/0004-6361:20031190
- Lorimer & Kramer (2004) Lorimer, D. R., & Kramer, M. 2004, Handbook of Pulsar Astronomy, Vol. 4
- Lorimer & Kramer (2012) —. 2012, Handbook of Pulsar Astronomy
- Lower et al. (2020) Lower, M. E., Shannon, R. M., Johnston, S., & Bailes, M. 2020, ApJ, 896, L37, doi: 10.3847/2041-8213/ab9898
- Luo et al. (2021) Luo, J., Ransom, S., Demorest, P., et al. 2021, ApJ, 911, 45, doi: 10.3847/1538-4357/abe62f
- Lyne et al. (1998) Lyne, A. G., Manchester, R. N., Lorimer, D. R., et al. 1998, MNRAS, 295, 743, doi: 10.1046/j.1365-8711.1998.01144.x
- Manchester et al. (2005) Manchester, R. N., Hobbs, G. B., Teoh, A., & Hobbs, M. 2005, AJ, 129, 1993, doi: 10.1086/428488
- Manchester et al. (2001) Manchester, R. N., Lyne, A. G., Camilo, F., et al. 2001, MNRAS, 328, 17, doi: 10.1046/j.1365-8711.2001.04751.x
- McConnell et al. (2020) McConnell, D., Hale, C. L., Lenc, E., et al. 2020, PASA, 37, e048, doi: 10.1017/pasa.2020.41
- Murphy et al. (2013) Murphy, T., Chatterjee, S., Kaplan, D. L., et al. 2013, PASA, 30, e006, doi: 10.1017/pasa.2012.006
- Murphy et al. (2021) Murphy, T., Kaplan, D. L., Stewart, A. J., et al. 2021, PASA, 38, e054, doi: 10.1017/pasa.2021.44
- Norris et al. (2011) Norris, R. P., Hopkins, A. M., Afonso, J., et al. 2011, PASA, 28, 215, doi: 10.1071/AS11021
- Norris et al. (2021) Norris, R. P., Marvil, J., Collier, J. D., et al. 2021, PASA, 38, e046, doi: 10.1017/pasa.2021.42
- Noutsos et al. (2015) Noutsos, A., Sobey, C., Kondratiev, V. I., et al. 2015, A&A, 576, A62, doi: 10.1051/0004-6361/201425186
- O’Brien et al. (2008) O’Brien, J. T., Johnston, S., Kramer, M., et al. 2008, MNRAS, 388, L1, doi: 10.1111/j.1745-3933.2008.00481.x
- Padmanabh et al. (2023) Padmanabh, P. V., Barr, E. D., Sridhar, S. S., et al. 2023, MNRAS, 524, 1291, doi: 10.1093/mnras/stad1900
- Posselt et al. (2023) Posselt, B., Karastergiou, A., Johnston, S., et al. 2023, MNRAS, 520, 4582, doi: 10.1093/mnras/stac3383
- Price et al. (2021) Price, D. C., Flynn, C., & Deller, A. 2021, PASA, 38, e038, doi: 10.1017/pasa.2021.33
- Pritchard et al. (2021) Pritchard, J., Murphy, T., Zic, A., et al. 2021, MNRAS, 502, 5438, doi: 10.1093/mnras/stab299
- Rajwade et al. (2016) Rajwade, K., Lorimer, D. R., & Anderson, L. D. 2016, MNRAS, 455, 493, doi: 10.1093/mnras/stv2334
- Ransom (2001) Ransom, S. M. 2001, PhD thesis, Harvard University, Massachusetts
- Rickett (1970) Rickett, B. J. 1970, MNRAS, 150, 67, doi: 10.1093/mnras/150.1.67
- Rickett (1977) —. 1977, ARA&A, 15, 479, doi: 10.1146/annurev.aa.15.090177.002403
- Ridolfi et al. (2021) Ridolfi, A., Gautam, T., Freire, P. C. C., et al. 2021, MNRAS, 504, 1407, doi: 10.1093/mnras/stab790
- Robitaille et al. (2020) Robitaille, T., Deil, C., & Ginsburg, A. 2020, reproject: Python-based astronomical image reprojection, Astrophysics Source Code Library, record ascl:2011.023. http://ascl.net/2011.023
- Romani et al. (1986) Romani, R. W., Narayan, R., & Blandford, R. 1986, MNRAS, 220, 19, doi: 10.1093/mnras/220.1.19
- Rose et al. (2023) Rose, K., Pritchard, J., Murphy, T., et al. 2023, ApJ, 951, L43, doi: 10.3847/2041-8213/ace188
- Sengar et al. (2023) Sengar, R., Bailes, M., Balakrishnan, V., et al. 2023, MNRAS, 522, 1071, doi: 10.1093/mnras/stad508
- Sett et al. (2023) Sett, S., Bhat, N. D. R., Sokolowski, M., & Lenc, E. 2023, PASA, 40, e003, doi: 10.1017/pasa.2022.59
- Shabala et al. (2006) Shabala, S. S., Ellingsen, S. P., Kurtz, S. E., & Forbes, L. K. 2006, MNRAS, 372, 457, doi: 10.1111/j.1365-2966.2006.10883.x
- Shimwell et al. (2017) Shimwell, T. W., Röttgering, H. J. A., Best, P. N., et al. 2017, A&A, 598, A104, doi: 10.1051/0004-6361/201629313
- Sieber (1973) Sieber, W. 1973, A&A, 28, 237
- Sobey et al. (2022) Sobey, C., Bassa, C. G., O’Sullivan, S. P., et al. 2022, A&A, 661, A87, doi: 10.1051/0004-6361/202142636
- Stovall et al. (2014) Stovall, K., Lynch, R. S., Ransom, S. M., et al. 2014, ApJ, 791, 67, doi: 10.1088/0004-637X/791/1/67
- Suresh et al. (2022) Suresh, A., Cordes, J. M., Chatterjee, S., et al. 2022, ApJ, 933, 121, doi: 10.3847/1538-4357/ac74c0
- Taylor et al. (2023) Taylor, J., Ransom, S., & Padmanabh, P. V. 2023, MNRAS, submitted, arXiv:2310.10800, doi: 10.48550/arXiv.2310.10800
- Torne et al. (2021) Torne, P., Desvignes, G., Eatough, R. P., et al. 2021, A&A, 650, A95, doi: 10.1051/0004-6361/202140775
- Ubertini et al. (2005) Ubertini, P., Bassani, L., Malizia, A., et al. 2005, ApJ, 629, L109, doi: 10.1086/447766
- Wang et al. (2022) Wang, Y., Murphy, T., Kaplan, D. L., et al. 2022, ApJ, 930, 38, doi: 10.3847/1538-4357/ac61dc
- Wayth et al. (2015) Wayth, R. B., Lenc, E., Bell, M. E., et al. 2015, PASA, 32, e025, doi: 10.1017/pasa.2015.26
- Weisberg (2005) Weisberg, S. 2005, Applied Linear Regression, Wiley Series in Probability and Statistics (Wiley). https://books.google.com.au/books?id=xd0tNdFOOjcC
- Yao et al. (2017) Yao, J. M., Manchester, R. N., & Wang, N. 2017, ApJ, 835, 29, doi: 10.3847/1538-4357/835/1/29