JWST and ALMA discern the assembly of structural and obscured components in a high-redshift starburst galaxy
Abstract
We present observations and analysis of the starburst, PACS-819, at ( M⊙), using high-resolution (; 0.8 kpc) ALMA and multi-wavelength JWST images from the COSMOS-Web program. Dissimilar to HST/ACS images in the rest-frame UV, the redder NIRCam and MIRI images reveal a smooth central mass concentration and spiral-like features, atypical for such an intense starburst. Through dynamical modeling of the CO J=5–4 emission with ALMA, PACS-819 is rotation-dominated thus has a disk-like nature. However, kinematic anomalies in CO and asymmetric features in the bluer JWST bands (e.g., F150W) support a more disturbed nature likely due to interactions. The JWST imaging further enables us to map the distribution of stellar mass and dust attenuation, thus clarifying the relationships between different structural components, not discernable in the previous HST images. The CO J = 5 – 4 and FIR dust continuum emission are co-spatial with a heavily-obscured starbursting core ( kpc) which is partially surrounded by much less obscured star-forming structures including a prominent arc, possibly a tidally-distorted dwarf galaxy, and a clump, either a sign of an ongoing violent disk instability or a recently accreted low-mass satellite. With spatially-resolved maps, we find a high molecular gas fraction in the central area reaching (/) and short depletion times ( 120 Myrs) across the entire system. These observations provide insights into the complex nature of starbursts in the distant universe and underscore the wealth of complementary information from high-resolution observations with both ALMA and JWST.
1 Introduction
What triggers a starburst galaxy? Outliers (i.e., starburst galaxies) are known to exist that are highly elevated above the typical star-forming population. The correlation between stellar mass () and star formation rate (SFR) defines the main sequence (MS) of star-forming galaxies which is our reference for identifying these outliers. Even though their contribution to the global SFR density is believed to be subdominant, even in the distant Universe (10%; Rodighiero et al. 2011), starbursts still deserve investigation of their physical properties and triggering mechanisms since they represent a crucial phase in the evolution of massive galaxies (e.g., Lotz et al., 2008; Lackner et al., 2014).
In the local Universe, these starbursts are the ultra-luminous infrared galaxies (ULIRGs) triggered by major-mergers (Solomon et al., 1997; Sanders et al., 1988). They typical exhibit high specific star formation rates (sSFR = SFR/), compact molecular gas reservoirs and short gas depletion times ( = ).
However, in the distant Universe, whether the physical condition of a starburst is consistent with is still being investigated. According to simulations and related theoretical analysis (Moreno et al., 2021; Dekel et al., 2009b; Hernquist, 1989; Barnes & Hernquist, 1996; Mihos & Hernquist, 1994), the distant starbursts could be triggered by mergers and also by (violent) disk instabilities ultimately due to the high gas fraction in galaxies in the early universe (e.g., Tacconi et al., 2020). In a focused investigation of high-redshift starbursts with ALMA (Silverman et al., 2015a, 2018a, 2018b), a higher efficiency of converting gas to stars is found in distant starbursts at 1.6 (see also Tacconi et al., 2018, 2020). On the other hand, the elevated SFRs of distant starbursts may be due to their enhanced gas fractions, not solely driven by a higher efficiency (Scoville et al., 2016, 2023).
In addition, some starbursts remain hidden within the Main Sequence (MS), displaying short depletion times (Elbaz et al., 2018; Magdis et al., 2012). Notably, the submillimeter compactness of some star-forming galaxies might characterize these concealed MS starbursts (Puglisi et al., 2019, 2021). These studies hint that a resolved study associating the stellar and gas is needed. However, a challenge in earlier studies was combining the properties of the ISM with those of stars at spatially resolved scales. This was largely due to the significant obscuration caused by dust, making it difficult to derive spatially resolved attributes from instruments like HST and ground-based telescopes.
With the advent of JWST, it is possible to shed light on the stellar populations hidden behind the dust veil in the distant universe. Recent JWST research (Le Bail et al., 2023) indicates that starbursts within the MS feature a compact starburst core and a surrounding massive disk with a reduced sSFR. Given these advancements, it’s imperative to reexamine off-MS starbursts using more in-depth, high-resolution multi-wavelength observations to understand better the mechanisms driving their starburst activity and departure from the MS.
In this study, we present an extreme starburst event (11 above the MS), PACS-819, utilizing high-resolution observations with JWST/NIRCam+MIRI images from COSMOS-Web (Casey et al., 2023) and ALMA Band 6. With a spatial resolution of approximately and high signal-to-noise emission with ALMA, we successfully resolve the CO (J=5–4) and dust continuum emissions, enabling us to delve into the intricate morphology and kinematics of its compact center. Additionally, we identify a clump through its presence in CO emission and its impact on disk kinematics. The JWST observations enable us to produce stellar mass and extinction maps which are important in unveiling the nature of PACS-819, particularly the heavily obscured central region. By investigating this galaxy in such detail, we aim to advance our understanding of the trigger of the distant starbursts.
Throughout this work, we follow the standard model by assuming . We use a Chabrier (2003) IMF for estimating the stellar masses and SFRs.
2 Target, data and analysis
2.1 PACS-819: a starburst galaxy at
PACS-819 is a distant starburst galaxy at = 1.445, detected by Herschel/PACS (Rodighiero et al., 2011) and included in our FMOS-COSMOS near-infrared spectroscopic survey of star-forming galaxies with the Subaru Telescope (Kashino et al., 2019). Its stellar mass is estimated to be from a comprehensive SED fitting conducted by Liu et al. (2021). The SFR is estimated to be 533 M⊙ yr-1, derived from (Silverman et al., 2018a). These measurements place PACS-819 just over 10 times above the MS (Speagle et al., 2014), given t = 4.32 Gyr (z = 1.45). Its starburst-like qualities (i.e., high gas fraction and star-forming efficiency) are based on CO (J=2–1) detections with S/N 5 using ALMA (Silverman et al., 2015b). Notably, PACS-819 exhibits signs of a merger in HST F814W, with multiple UV/optical emission regions as depicted in Figure 1a. Along with these properties, the high S/N CO (J=2–1) detection prompted our request for a higher-resolution observation with ALMA.
In the proximity of PACS-819, there are other two galaxies within a 2′′ radius. According to the COSMOS2020 catalog (Weaver et al., 2022), they are likely foreground galaxies with photometric redshifts as and estimated with EAZY (Brammer et al., 2008) and and with LePhare (Arnouts et al., 2002; Ilbert et al., 2006), using comprehensive photometric data set available in COSMOS. The former galaxy is reported to have a spectroscopic redshift of 1.445 based on a slit spectrum acquired with Keck/DEIMOS (Masters et al., 2019) and labeled as a serendipitous detection. With the absence of further spectroscopy, we cannot rule out the possibility that PACS-819 has a couple of close neighbors or resides with a galaxy group.
2.2 JWST (+HST) imaging from COSMOS-Web
PACS-819 was observed with JWST/NIRCam on April 9th, 2023 as part of the large COSMOS-Web program (PIs: Casey & Kartaltepe; Casey et al. 2023; GO #1727) of JWST Cycle 1. Images with four NIRCam filters (F115W, F150W, F277W, and F444W) are available. Additionally, on April 10th, PACS-819 was observed with MIRI/F770W. The 5 depths of these observations are 27.13, 27.35, 27.99, 27.83, and 25.70 magnitudes, respectively. The data used in this study is recalibrated by the COSMOS-Web team and reduced to a spatial scale of 30 mas/pixel (Franco in prep.).
To supplement the rest-frame optical filters, we also include previous observations conducted with HST/ACS. PACS-819 was observed in F606W and F814W as a part of the HST Cycle 19 (PI: A. Riess; Program #12461). It was also covered by the COSMOS project (Scoville et al., 2007) in F814W (Koekemoer et al., 2007). We utilized the F606W image at 40 mas/pixel, as reduced using the grizli software (Brammer, 2023), and the F814W image at 30 mas/pixel by the COSMOS-Web team following the approaches first described in Koekemoer et al. (2011). Together, this multi-wavelength data set from HST and JWST provides a comprehensive view, crucial for dissecting the complex morphology of this dusty starburst galaxy, particularly in the rest-frame UV and optical.
2.2.1 SED fitting
To address the source complexity and make full use of the high-resolution images, we employ spatially resolved spectral energy distribution (SED) fitting on a pixel-by-pixel basis using two different software packages: pixedfit (Abdurro’uf et al., 2021) and bagpipes (Carnall et al., 2018). The tool pixedfit provides us with a workflow for pixel-to-pixel SED fitting which consists of several individual modules. We utilize piXedfit_images to handle the image processing, downgrading all images to match the PSF (point spread function) of F444W and the pixel scale of F606W at 40 mas/pixel. For convolving the images, HST PSFs were generated by averaging the profiles of field stars. The JWST PSFs were generated using PSFEx (Bertin, 2011). The re-sampled images physically probe the scale of a single resolved component with 4 pixels at 40 mas/pixel resolution. After correcting for galactic extinction, the photometric data cube, including the use of a segmentation map generated by the image module, was passed to the binning module to increase the signal-to-noise of some spatial elements. piXedfit_bin (Abdurro’uf et al., 2021) bins pixels with similar SED shapes to meet the S/N requirements and can smooth the data. When binning, we requested all bins to have an S/N 10 in F150W, F277W and F444W while the smallest bin size is 1 pixel, i.e., no binning, to not sacrifice the number of pixels in the central bright regions for comparison with the ALMA images having a similar resolution. We did not include the dust continuum because it is hard to derive an accurate FIR model with only one band.
We then passed the rebinned photometric cubes to bagpipes for SED fitting, implementing a simple model due to the limited number of bands. We introduced 10% systematic uncertainty, as suggested by Abdurro’uf & Akiyama (2017). Since only six bands are available, we fixed the metallicity to solar metallicity (Z=0.02). We first applied a delayed-exponential star-formation history with varying. Dust modeling follows the method of Calzetti et al. (2000), with varying between 0 and 4 magnitudes since the range in attenuation is likely large, as suggested by the color map of PACS-819 (Figure 3). Additionally, we fixed the nebular emission ionization parameter U as as default. We constructed the UVJ color map with the best-fit SEDs of each bin to confirm the whole region is star-forming with the classification in Whitaker et al. (2012). Then, we further simplified the model to a constant SFH, with a variable turning-on time from 100 Myr to the age of the Universe and a turning-off time at 1 Myr, keeping other priors the same.
2.3 ALMA observations
With our ALMA Cycle 4 program (Proposal #2016.1.01426.S; PI J. Silverman), we acquired high- and low-resolution ALMA observations of three starbursts well above the MS: PACS-819, PACS-830, and PACS-787 (Silverman et al., 2018b). Here, we focus on PACS-819 which was observed with 1.46 hrs of total on-source integration time with 45/40 12 m antennas in three sessions thus resulting in high-resolution observations having a beam size of in Band 6 to resolve the CO (J=5–4) emission line ( = 576.27 GHz) and the underlying continuum ( = 1.3 mm). In the low-resolution configuration, PACS-819 was observed with 22.2 minutes with 42/43 12 m antennas in sessions to capture the total flux of the CO (J=5–4) and underlying continuum. The resulting beam size is . The summary of the ALMA observations is provided in Table 1.
We use the Common Astronomy Software Applications (CASA 4.7.2) to carry out the reduction and recalibration of the raw data. Our measurements and analysis are processed by CASA 6.2.1 and python package spectral _cube, described in the following subsections.
2.3.1 CO (J=5–4)
When constructing the high-resolution image cube, we applied a Briggs (Briggs, 1995) weighting factor of 0.5 to achieve a higher resolution and optimize the sensitivity for substructures in the gas distribution. The cube was subsequently rebinned to 20 (4 times the native resolution) to enhance the signal-to-noise ratio. We then collapse our high-resolution CO (J=5–4) detection over its full spectral range, as listed in Table 2. For the low-resolution cube, we rebinned it to 35 (7 times the native resolution) to detect internal structures.
To perform flux measurements, we used the imfit task to generate a disk model based on an elliptical Gaussian function. A point-source component is added to model a potential unresolved central component; however, only 5% of the emission is associated with this component at the 3 significant level. The fit results, excluding the point source component, are listed in Table 2.
2.3.2 Continuum
To identify and exclude emission lines in the continuum analysis, we initially flagged the frequency range of 4FWHM (Full Width at Half Maximum) centered at the line centroid in the dirty cubes, based on the ALMA data release products. Subsequently, we employed the tclean algorithm in multifrequency synthesis (mfs, Conway et al. 1990) mode, covering all channels without emission lines. We also used multiscale deconvolver to detect the extended emission. For high-resolution images, we utilized the auto-multithresh (Cornwell, 2008) mask and opted for natural weighting to maximize the signal-to-noise ratio and a 0.5 Briggs weighting for a higher resolution. The resulting restored beams are 0′′.16 0′′.11 and 0′′.13 0′′.09 respectively. For the low-resolution observation, we only applied the 0.5 Briggs weighting for its high signal-to-noise ratio. The restored beam size is 0′′.83 0′′.69.
To derive morphological information and far-infrared flux, we utilized the imfit task in CASA, employing multiple 2D Gaussian models to fit the disk-like (see below) galaxies with the natural weighted image. A Gaussian model combined with a point source yielded a satisfactory result to describe its compact core.
3 Results: I. The structural nature of PACS-819
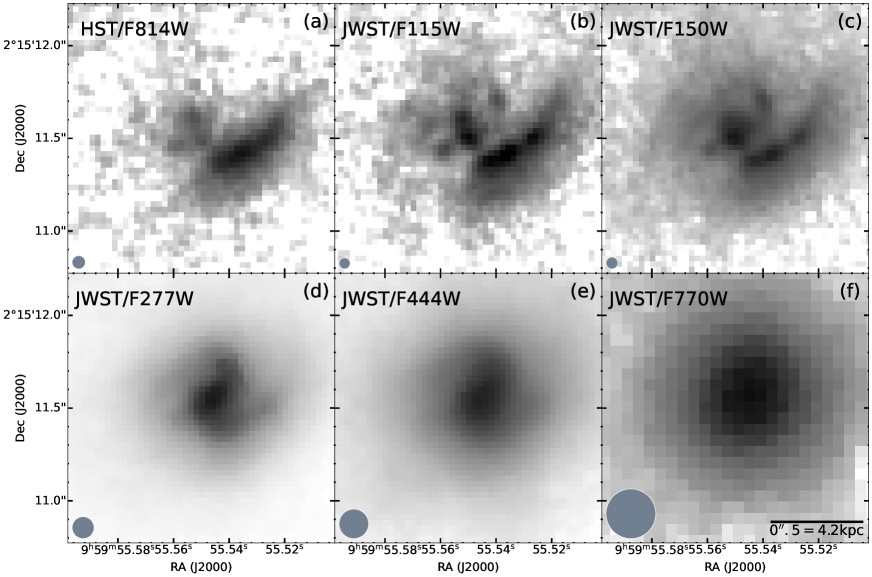
The mode (i.e., major merger or secular process) through which starburst activity at high redshift () occurs has been previously hampered by the lack of rest-frame optical and near-infrared imaging at sufficient spatial resolution. The smooth nature of the gas and dust in high-redshift galaxies (e.g., Tadaki et al., 2020) imaged by ALMA, has been at odds with rest-frame UV imaging from HST as is the case for PACS-819 (Figure 1). Here, we present results combining the capabilities of both JWST and ALMA on spatially-resolved scales, required to discern its intrinsic nature.
3.1 Unveiling the stellar components with JWST
In Figure 1, we present the JWST NIRCam and MIRI images of PACS-819 as provided by the COSMOS-Web survey (Casey et al., 2023). PACS-819 was first described in Silverman et al. (2015a) as a galaxy merger based on multiple rest-frame UV components seen in the HST/ACS F814W image, shown in Figure 1a. With JWST, the images clearly show the morphology changing significantly with wavelengths from appearing to be a merger at bluer wavelengths (panels b–c, rest-frame optical), to displaying normal galaxy features at redder wavelengths (rest-frame near-IR), particularly the F277W (panel d) and F444W (panel e) filters. The longer wavelength images include a central mass concentration and symmetric spiral-like features. Such features are similar to local Sa galaxies as opposed to disturbed tidal tails as expected in a major merger, especially for a starburst at above the MS as determined from broad-band photometry in COSMOS including .
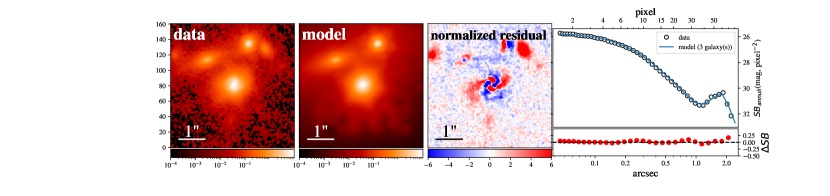
To further discern the structures seen in the F444W image, we fit the galaxy with a single Sérsic profile using Galight (Ding et al., 2021) to remove the smooth, symmetric, and dominant component to the emission. In Figure 2, we show the results from this exercise. The main galaxy has a Sérsic index of 1.5 and a half-light radius of 1.52 kpc. The residual map demonstrates that the remaining structure is dominated by spiral-like features. Therefore, we conclude that the structures seen in the redder JWST images are indicative of a typical star-forming galaxy with no strong signatures of being in an ongoing major merger. We note that the wider field-of-view, compared to Figure 1, shows nearby neighbors which may have had some interaction with PACS-819.
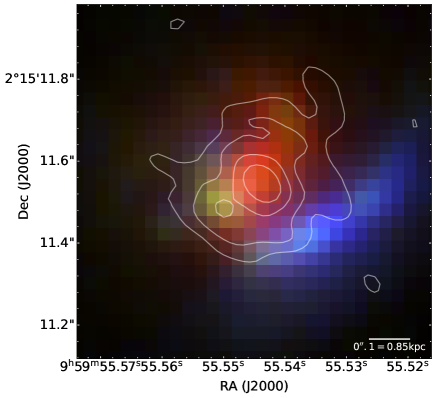
As expected for star-forming galaxies at , the galaxy morphology is wavelength-dependent and highly affected by dust obscuration. To illustrate the obscured nature of PACS-819, we combine the F814W, F150W, and F277W filters into an RGB image to represent the blue (rest-frame UV, 3300Å, tracing the unobscured stars), green (rest-frame optical, 6100Å), and red (rest-frame near-infrared, 11000Å, tracing the obscured stellar population) components. As shown in Figure 3, we identify three primary components: a central highly obscured galaxy/nucleus in red, a bright blue arc (i.e., a disrupted galaxy or, less likely, a spiral arm or tidal tail) to the southwest, and a faint secondary feature to the southwest displayed in green. This structure may be a clump which is present as a consequence of a violent disk instability, or a faint accreted satellite.
3.1.1 Spatially-resolved SED fitting and stellar masses of each structure
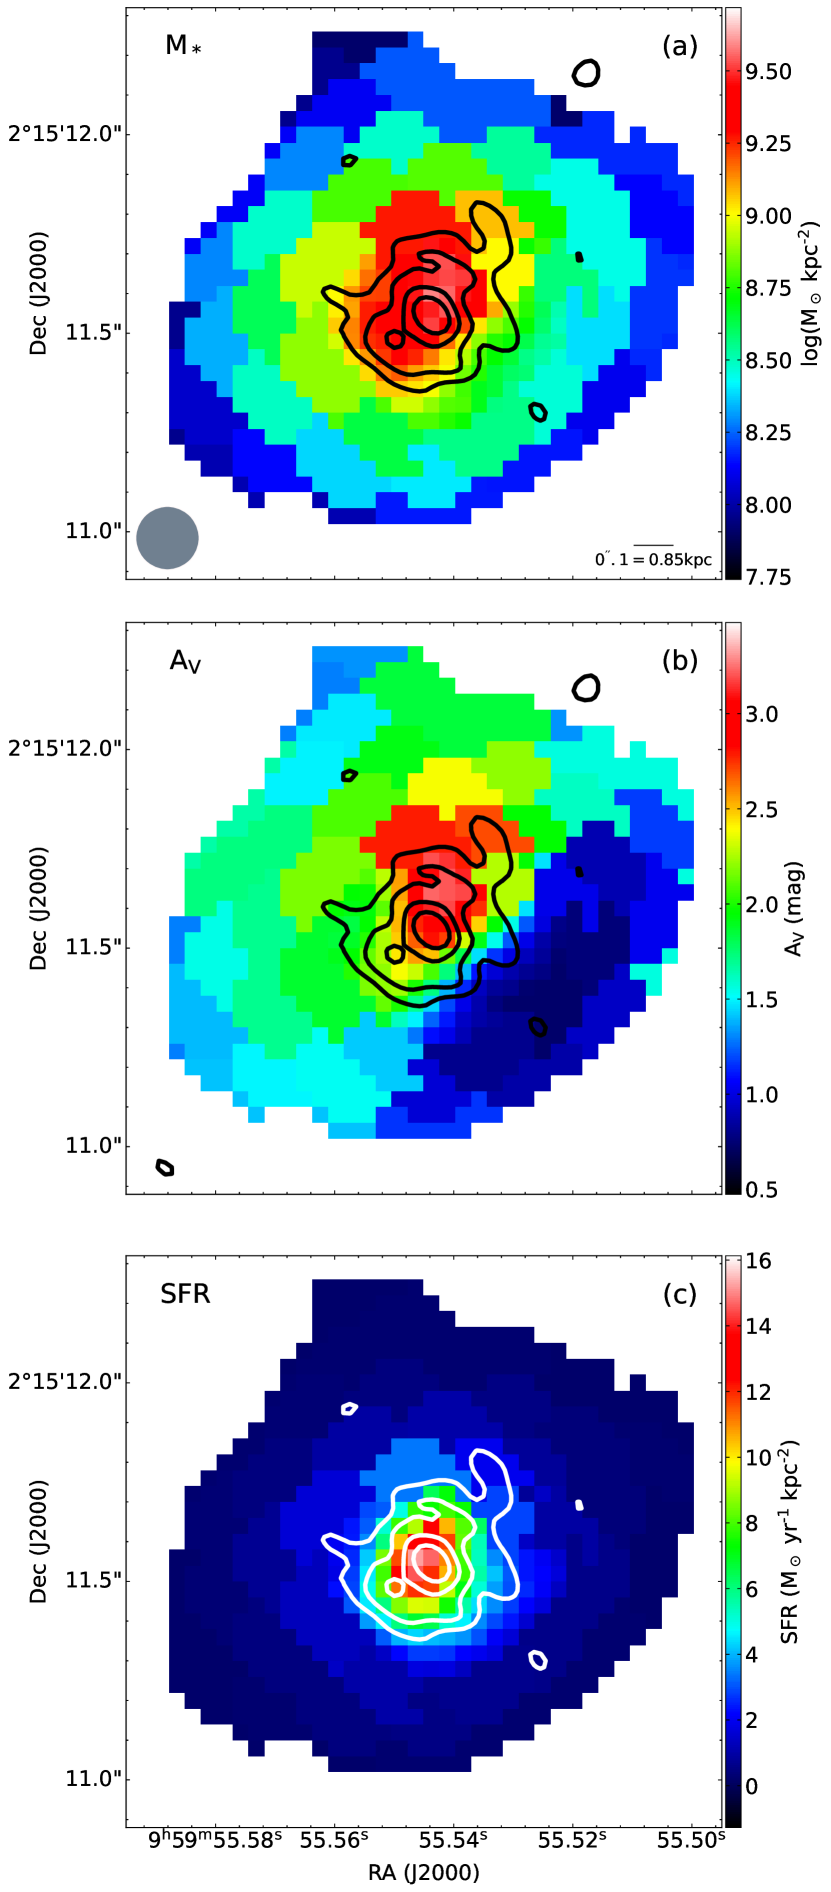
The nature of the three distinct components, seen in Figure 3 is revealed through spatially-resolved SED fitting as described in Sec. 2.2.1. In Figure 4, we present the spatially-resolved maps of (a) stellar mass (), (b) , (c) and SFR. The spatial resolution (0.16 arcsec) is comparable to the ALMA data. In contrast to the images at shorter wavelengths (e.g., HST-ACS/F814W, JWST-NIRCam/F115W; rest-frame 3300–4500Å) that are clumpy and peak at the southwest arc, the stellar mass distribution is fairly smooth, uniform, and peaks ( M⊙ kpc-2) in the central region which is devoid of emission in the HST images. The sum of the stellar mass map is in agreement with that reported previously (; Liu et al. 2021). The SFR and extinction () are both highest at the center of the mass map. As a result, the primary galaxy is a central starburst enshrouded in dust (and gas; see Sec. 4) which encompasses the majority of the stellar mass.
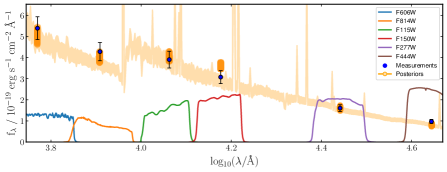
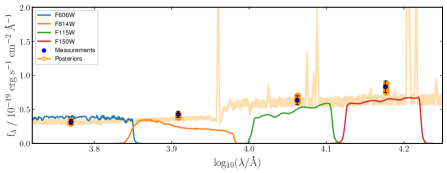
We gauge the importance of the blue and green features by assessing their total stellar mass separately. We repeat SED fitting (Sec. 2.2.1), now with the photometry from a larger aperture encompassing the majority of the emission, for each structure and employ a constant SFH model. In Figure 5, we show the SEDs for the blue and red features with best-fit stellar population models. First, the blue arc (to the southwest) is less massive (), hardly noticeable in the mass map (Fig. 4), and has relatively lower obscuration (). Given its mass, this structure may be a tidally-distorted dwarf galaxy which does not significantly alter the morphology of the central massive galaxy. Since the ’green’ component (seen in Figure 3) stands out only in the UV and optical bands and the large PSF of the IR bands may smooth out the feature, we only consider the clear detections in the bluer HST and JWST bands for SED fitting based on aperture photometry. We use a 0.08′′ (equivalent to two times the PSF size of F814W) aperture with images convolved to the PSF of F814W at the position of the green component. The stellar mass of this ’green’ feature is estimated to be . However, the photometry likely includes emission from the central component and other surrounding clumpy features, thus leading to an overestimate of the mass. For our purpose, a precise mass estimate is not required for this analysis. Therefore, we deduce that the green feature constitutes at most 6% of the total mass. Each of these three components, spatially offset and differing in color, is fully explored below in the context of the co-spatial gas and dust emission from ALMA.
3.2 Galaxy kinematics with ALMA using CO J=5–4
In the distant universe, typical star-forming galaxies exhibit disk rotation (see Förster Schreiber & Wuyts, 2020, for a review). However, in the case of extreme starbursts, the kinematic features may differ due to factors such as strong turbulence or merging events that can disrupt ordered disk rotation. To investigate the existence of potential disk features and identify any subcomponents contributing to the enhanced star formation, we began with an analysis of the kinematics by examining the CO (J=5–4) spectrum and producing maps of the emission, both blue- and red-shifted from the line centroid. Following this, we use the 3D-Based Analysis of Rotating Objects via Line Observations (3DBAROLO, Teodoro & Fraternali 2015) package to exploit the high spectral resolution (20 ) ALMA CO (J=5–4) observations at high signal-to-noise.
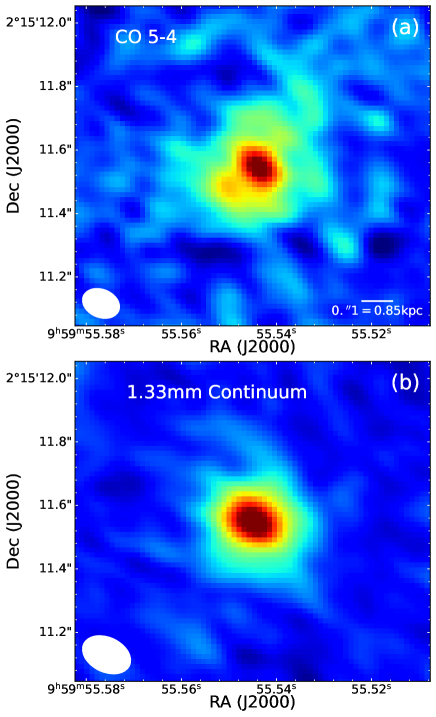
First, we display in Figure 6 the ALMA image (panel a) of the full CO (J=5–4) spatial profile, along with the continuum (panel b). The CO emission is detected at high significance and evidently spatially-extended. The peak of the CO emission is centered on the heavily obscured nucleus as shown in the top panel of Figure 3 while a weaker secondary peak is co-spatial with the fainter ’green’ component in the RGB image.
We then employ a non-parametric approach to study the kinematics. For spectral analysis, we utilized the specflux task in CASA to extract spectra centered on the CO (J=5–4) emission line, as depicted in Figure 7. The spectrum exhibits a double-peak profile, indicative of a rotating disk, which is well-fit with a Gaussian model. The FWHMs of the double-peak profiles for PACS-819 are 190.0 and 189.2 for the low- and high-frequency wings, respectively. The FWHM of the entire line region was calculated by haggis and found to be 417.7 . When fitting the profile, we used the mean, amplitude, and standard deviation as initial estimates from CASA viewer, and employed the models function in the astropy package to fit the Gaussian models, allowing all parameters to vary.
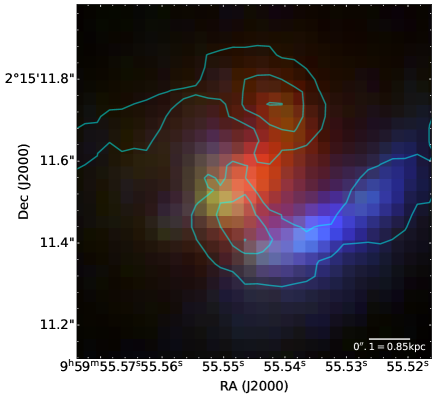
We use the spectral-cube python package to produce two moment 0 maps by collapsing data over both redward and blueward narrow intervals, as depicted as the shaded area in Figure 7(a). These intervals were set to be 1.6 the standard deviation (80.3 and 80.6 , respectively) to minimize manual errors. The contours of these collapsed maps, plotted at several levels, are shown in Figure 7(b) on the F277W image, allowing for a side-by-side comparison of different component profiles.
The CO kinematics may be indicative of a rotating disk (Figure 7b) as shown by the spatially offset red and blue velocity components. These components are symmetric around the central stellar mass concentration as indicated by the JWST F277W image. There appears to be faint extensions to the CO emission associated with the spiral features; these are seen in the lowest levels of the red contours to the southwest and in the blue contours to the north. Both blue and red contours have considerable extent along the minor axis (northeast to southwest direction), pointing to the possibility of disturbances within the disk.
3.2.1 Model kinematic fitting
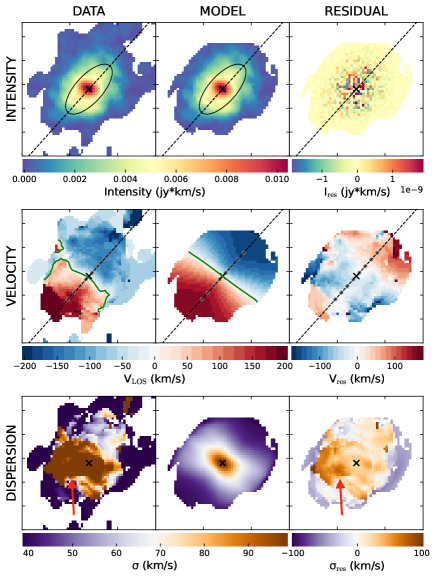
To determine whether the observed gas kinematics is truly characteristic of a typical rotating disk, we conduct a parametric kinematic analysis of the data cube with the software, 3DBAROLO. This software fits the gas with a tilted ring model in 3D, allowing for a better interpretation of the kinematics of the gas, even with just a few resolved components. We successfully build a 3D disk model, as shown in Figure 8 with the CO intensity, velocity an dispersion given in each column. The rows provide the science data, best-fit model and residual image.
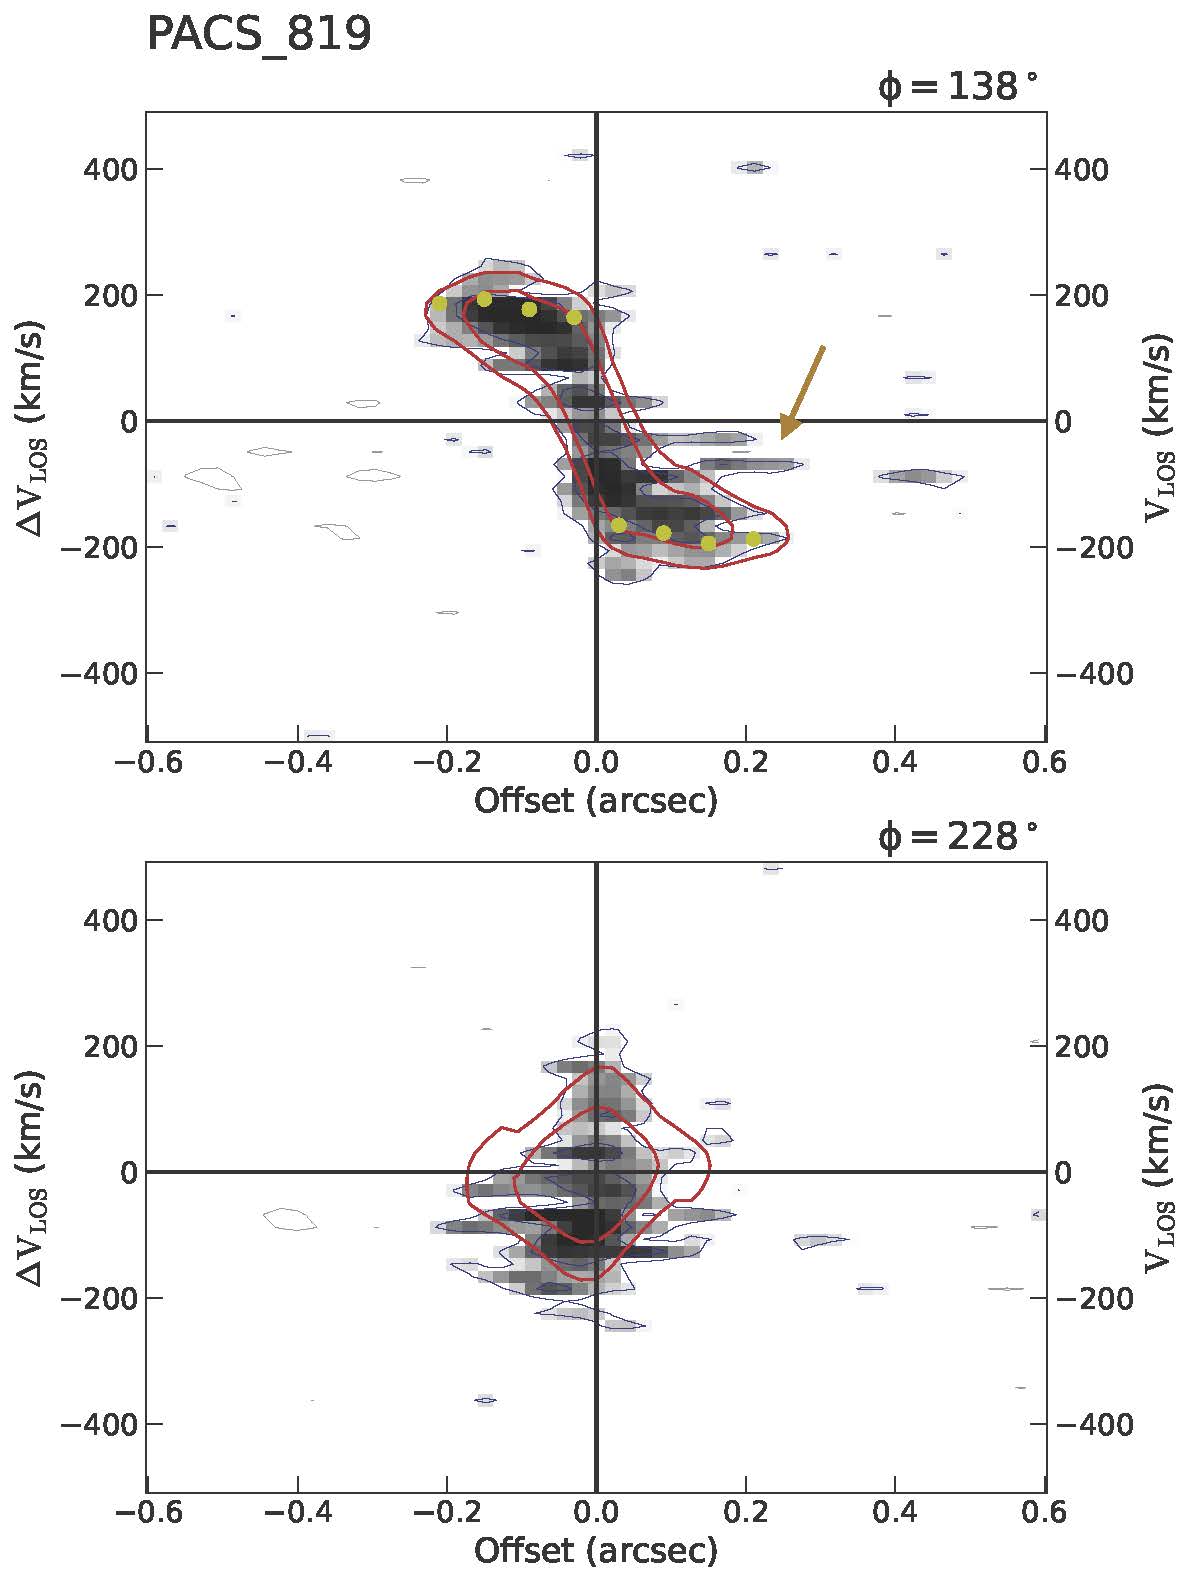
Specifically, we used the SEARCH method to mask our cube and set the normalization as LOCAL to set up an asymmetry model for our clumpy case. We fixed the system velocity as 0 and input the redshift and rest-frame frequency of our emission line. Due to our S/N limitations, we fixed the RA and Dec of the model and set the initial guess of inclination (INC) and position angle (PA). Then, we employed grid searching in the parameter spaces of INC and PA, with each INC varying by 5 degrees and each PA varying by 15 degrees. We fixed PA as 128 degrees, as it was easier to judge from the velocity field, and searched for the best INC, ultimately fixing it as 45 degrees. We set the rotation velocity as completely free and constrained the dispersion to be higher than 20 , which is our frequency channel width. 3DBAROLO successfully modeled the intensity and velocity field, while dispersion was modeled with less precision due to the challenging nature of modeling it accurately. The position-velocity maps (Figure 9) are generated by the software, showing a ’S’-shape indicating a rotating disk along the major axis. We also indicate the clump feature as shown by the arrow.
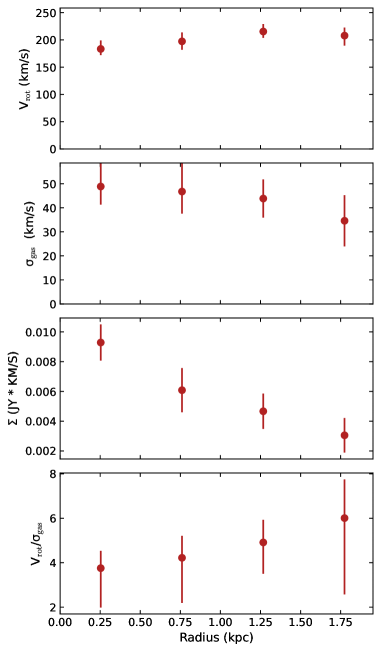
We report the measurements of the disk parameters for PACS-819 in Figure 10. The rotation velocity is about 200 and the velocity dispersion is around 40 , giving a of around 5, which is rotation-dominated. In agreement with our assessment given above, PACS-819 has kinematic properties consistent with a rotating disk which is typical for high-z star-forming galaxies (Wisnioski et al., 2019; Übler et al., 2018; Johnson et al., 2018; Schreiber et al., 2018). Our conclusions align with the results presented by Rizzo et al. (2023), which characterize this galaxy as rotation-dominated () and with notable non-circular rotation in the blueshifted channels.
4 Results: II. spatially-resolved properties of the ISM and obscured stellar populations
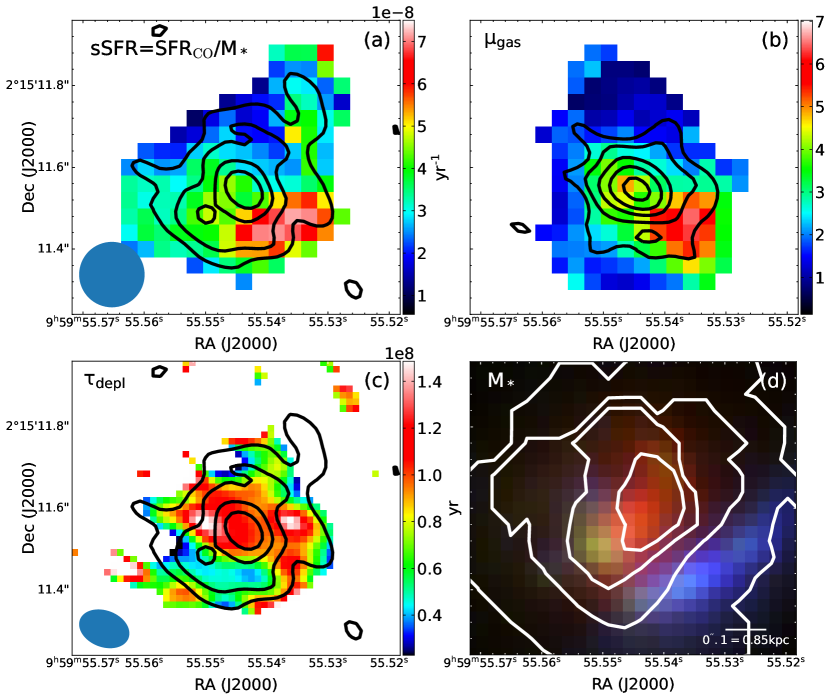
Here, we integrate the JWST and ALMA images to generate maps of physical properties as follows: (1) sSFR () using the CO (J=5–4) emission as a tracer for star formation, (2) gas fraction () with the dust continuum as a proxy for the gas mass, and (3) the gas depletion time (). The stellar mass map produced by the JWST and HST images is used for the first two of these. In Figure 11, the maps of these physical properties are shown along with the RGB image and overlaid contours of stellar mass to aid in the visualization. In addition, we examine the location of spatial regions of PACS-819 on the resolved Schmidt-Kennicutt relation (Figure 12).
4.1 sSFR
The CO 5–4 map is used to infer the two-dimensional distribution of SFR based on the relation between CO (J=5–4) luminosity and the total infrared luminosity (Greve et al., 2014; Daddi et al., 2015; Liu et al., 2015; Valentino et al., 2020). The CO (J=5–4) luminosity is calculated for each pixel as follows:
| (1) |
and are the flux and velocity range of the CO (J=5–4) line. is the redshifted frequency of CO (J=5–4) line. is the luminosity distance. We then convert the CO luminosity to TIR luminosity by the linear relation in Daddi et al. (2015):
| (2) |
We note that there is a scatter of 0.2 dex in this relation that we need to take into account here. Using the relation in Kennicutt (1998b), we derive a total SFR of 626 142 with the TIR luminosity as the tracer based on the following calibration by Hao et al. (2011) and Murphy et al. (2011):
| (3) |
Our derived SFR confirms that PACS-819 is a starburst with an SFR elevated by a factor of 11 above the MS (Speagle et al., 2014), given t = 4.32 Gyr (z = 1.45), which agrees with the previous result as 533 . We note that some CO emission on larger scales may be unaccounted for given the ALMA beam. We mask regions with emission at low S/N ().
Prior to merging the SFR and stellar mass maps, the SFR image is convolved with a Gaussian function having a FWHM based on an empirical PSF model for the JWST/F444W filter using stars within the JWST image. The SFR map is then reprojected to the grid of the stellar mass map. Finally, the resolved sSFR map is simply derived from the division of the SFR map by the stellar mass map. As evident in Fig 11a, the sSFR map has values around 2–6, a timescale typical for starbursts and shorter than MS galaxies (Gyr-1). There are variations across the CO-emitting region such as the emission to the southwest which exhibits an enhancement primarily due to the lower stellar mass in that region.
4.2 Gas fraction
To deduce the dust and gas attributes of the starburst, we apply a straightforward blackbody model complemented by conversion factors from existing research. We adopt the black body emission model to infer the dust mass . Utilizing the mass-weighted, average mass-to-light ratio and =30 estimated by the SED fitting from Liu et al. (2021), we subsequently translate this to a dust temperature of 33 K, assuming as in Magdis et al. (2012). The dust mass is then estimated using the following:
| (4) |
where represents the continuum flux, is the blackbody function at rest-frame frequency and temperature T, and the empirical dust mass absorption coefficient at 500 is 0.051 , as estimated by the Herschel Reference Survey (Clark et al., 2016).
Given the gas-to-dust ratio of 35 estimated from the study of another starburst of similar redshift (z=1.5) in our survey (Silverman et al., 2018b), the integrated gas mass is approximated at 4.6 0.3 . This is comparable to the gas mass of assessed using CO (J=2–1) in Silverman et al. (2018a), based on a conversion factor .
As with the SFR map, we regrid and smooth the gas map to match the F444W image and then simply divide the gas and stellar maps to produce an image of the gas fraction (). As depicted in Figure 11b, the core region exhibits a high gas fraction peaking at 3, supportive of a large reservoir of gas supplying the central starburst. The pronounced sSFR, in tandem with the elevated gas fraction, hints at an accelerated stellar mass accumulation in the center. In addition, the peak to the southwest is likely due to the lower stellar mass in that region as also seen in the sSFR map.
4.3 Resolved KS relation
With our resolved CO (J=5–4) map serving as the SFR map and the continuum map as a gas mass tracer, we investigate the Schmidt-Kennicutt (KS) law from the inner dense region to the outer regions, generating a resolved KS relation map. The KS law, first introduced by Schmidt (1959) and later refined by Kennicutt (1998a), describes a power-law relation between the surface densities of SFR and gas mass, providing insights into the efficiency of star formation from gas. In order to reduce the influence of beam size, we use the same weighting factor (0.5) when generating the continuum and CO (J=5–4) maps. Thus, after masking the emission under 2 and converting the CO (J=5–4) and continuum map into the SFR and gas mass map using the method introduced in Section 4, we derive the resolved map of the gas depletion time (Mgas/SFR; Figure 11c).
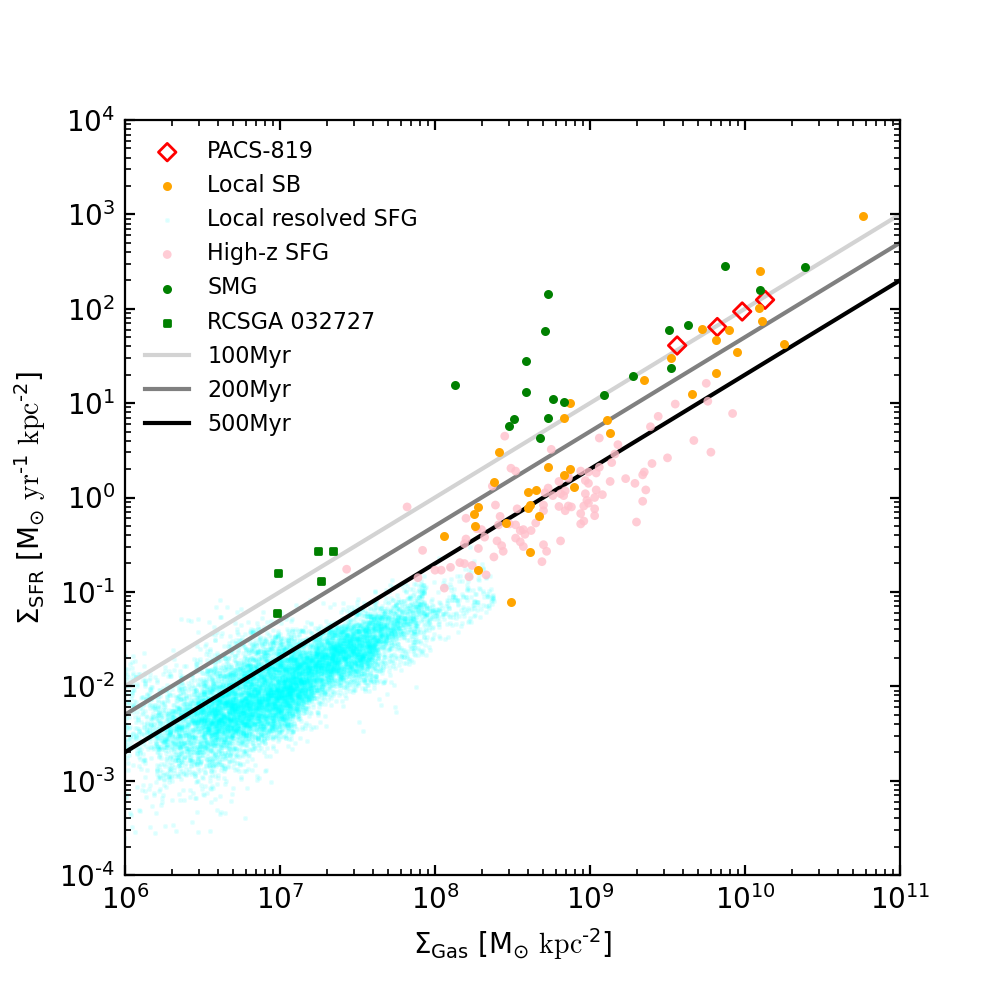
From the map, we can see various features with slightly differing depletion times. A central elongated region, running almost East to West, of the disk looks uniform at about 120 Myr with two clumps having longer depletion times over 150 Myr. Since CO (J=5–4) traces instantaneous (ongoing) star formation and the dust continuum traces the SFR averaged over 30-100 Myr, the short depletion time denotes a steeply rising SFR.
To display these results on the KS relation (Figure 12), we employ apertures of one beam size on each subfeature and circular annuli with radii initially set to 1-4 times half of the major axis of the synthesized beam’s FWHM. In agreement with the above mentioned depletion times, all our aperture measurements indicate a depletion time around 120 Myr. Therefore, PACS-819 has spatially-resolved depletion times similar with local starbursts and some high-z star-forming galaxies. We observe no significant variation within each annulus, indicating that the disk is forming stars with similar efficiency from the inner to the outer region on average.
5 Conclusions
In this paper, we present JWST and ALMA observations of the distant starburst system PACS-819 (z=1.445), located 11 above the star-forming MS from photometry. A unique aspect of our study is the joint use of high-resolution JWST and ALMA observations (approximately 0′′.1 or 0.8 kpc), allowing us to delve into the intricacies of the mass, morphology, star formation, dust content, gas properties, and kinematics to address the mechanisms responsible for starburst activity in the gas-rich high-z universe.
Unexpectedly, we find that PACS-819 has characteristics resembling a more typical star-forming galaxy which is not undergoing a major merger. This is based on the following three observations.
-
•
Morphology: JWST NIRCam and MIRI images reveal PACS-819 as having a smooth central mass concentration and spiral-like morphology in the redder bands (e.g., F277W), inconsistent with the emission seen in the bluer bands with JWST and HST.
-
•
Kinematics: Analysis with ALMA using CO J = 5 – 4 exhibits a large rotationally supported disk with .
-
•
Disk substructure: A distinct feature (i.e., clump), within the disk, is detected by HST, JWST and ALMA. It’s moderately-obscured and has a stellar mass of (at most of the total; see Sec. 3.1.1). There is no conclusive evidence for this structure significantly affecting the global kinematics of the rotating disk (see further below).
Taken together, the galaxy morphology, disk rotation, and low mass of the clump do not support a major or minor merger scenario for triggering the starburst in PACS-819. Therefore, a secular process, such as a violent disk instability (VDI; Dekel & Burkert 2014; Dekel et al. 2023) is worth considering. An in-falling gas stream could introduce a gravitational instability within the disk that can drive gas efficiently to the nuclear region and sustain nuclear starburst activity while keeping the rotating disk configuration intact (Dekel et al., 2009a, b). Such a scenario may explain the significant increase in the velocity dispersion at the location of the ’green’ feature suggestive of turbulence possibly related to gravitational instabilities.
However, there are spatial and kinematic features that may favor the merger scenario as listed here.
-
•
The emission seen in the bluer JWST bands (e.g., J150W; rest-frame Å) is highly asymmetric, has multiple peaks, and includes a prominant blue arc-like feature, as mentioned above, possibly a tidally-distorted dwarf galaxy also undergoing a starburst.
-
•
There are kinematic residuals in the CO J=5–4 velocity and dispersion maps which indicate a disturbed disk, possibly induced by neighboring galaxies. The increase in the dispersion near the location of the ’green’ structure may be evidence of an impact by a low-mass satellite galaxy.
In addition, we have constructed maps of physical properties (specific star formation rate, gas fraction, depletion time) which further elucidate the nature of the distinct structures present in PACS-819 and show that starburst characteristics (i.e, high gas fraction, short depletion times) persist on smaller physical scales.
-
•
Three major components within the starburst system: A composite color (RGB) image - encompassing UV, optical, and near-infrared filters, coupled with CO J = 5 – 4 and FIR observations - uncovers three components: (1) the primary galaxy: massive, dusty, invisible to HST, yet exhibiting strong CO and continuum emission, (2) a secondary clump (as mentioned above): less dusty, of lower mass, aligning with the secondary peak in CO J = 5 – 4, and dominant in the blue JWST bands, and (3) a UV-bright arc likely representing a tidally-disturbed galaxy.
-
•
Spatial distribution of the obscured gas, dust and star formation: The gas and dust distribution are centrally-concentrated mainly within the central kpc ( kpc) based on the FIR continuum image. This is supported by the CO J=5—4 emissions ( kpc), which is known to correlate well with total infrared luminosity and thus ongoing star formation.
-
•
Differential distribution in resolved sSFR and gas fraction maps: With pixel-to-pixel SED fitting tools and JWST imaging, we construct a resolved stellar mass map to produce that of gas fraction and sSFR. The gas fraction is also centrally concentrated, with a significantly high value (over 3), thus indicating the stellar buildup of the core on rapid timescales (high sSFR), while the integrated gas fraction is , compatible to normal star-forming galaxies at similar redshifts. There is a further enhancement in the gas fraction and sSFR associated with the blue arc (i.e., a tidally-disturbed dwarf galaxy).
-
•
High and uneven distributed SFE: Based on our resolved analysis, the whole system has a short depletion time of Myr, aligning with local starbursts and high-z star-forming galaxies. Within the resolved SFE map, there are variations to be further explored.
To conclude, PACS-819 is clearly undergoing a nuclear starburst that is likely to be rapidly growing its bulge. Whether such a compact and highly starforming nucleus can occur without a merger is still an open question. If realized, secular processes would alter our view of the physical drivers of starburst phenomenon in the gas-rich universe at . Also, interactions with neighboring galaxies may be responsible for destabilizing a disk and driving gas to the center thus powering a starburst. In any case, our study underscores the importance of high-resolution multi-wavelength data to further understand the nature and evolution of distant star-forming galaxies.
| Configuration | Obs. Date | Band | Central Frequency | Band Width | On-source Time | Beam SizebbThe first and second rows are read from the reconstructed continuum and cube with Briggs 0.5 weighting, respectively. | b,cb,cfootnotemark: |
|---|---|---|---|---|---|---|---|
| (UT) | (GHz) | (GHz) | (minutes) | (′′) | (mJy beam-1) | ||
| Compact | 2016 Dec 16 & | 6 | 217.99, 220.99 | 2.000, 2.000 | 11.1 + 11.1 | 0.83 0.69 | 0.02 |
| Apr 13 | 6 | 233.60, 235.60aaThe central frequency in bold indicates the spectral window where the CO line falls. | 2.000, 1.875 | 0.84 0.70 | 0.54 | ||
| Extended | 2017 Aug 24 & | 6 | 217.99, 220.99 | 2.000, 2.000 | 35.4 + 16.9 + 35.4 | 0.13 0.09 | 0.01 |
| Sep 02 | 6 | 233.60, 235.60aaThe central frequency in bold indicates the spectral window where the CO line falls. | 2.000, 1.875 | 0.12 0.09 | 0.41 |
| Quantity | PACS-819 | Units | Notes |
|---|---|---|---|
| 0.639 0.048 | total flux of the underlying continuum | ||
| 1.21 0.11 | kpc | Effective radius of CO (5-4); circularized | |
| 1.08 0.11 | kpc | Effective radius of continuum; circularized | |
| degrees | Disk inclination (CO) | ||
| degrees | Disk inclination (Continuum) | ||
| 2.92 0.31 | CO (5-4) intensity | ||
| 920.0 | Velocity range over which is measured | ||
| 417.7 | CO velocity FWHM | ||
| From 1.3mm continuum | |||
| 1.0 0.1 | |||
| CO (5-4) luminosity | |||
| SFR | 626 142 | From CO (5-4) | |
| 73 10 | Myr |
References
- Abdurro’uf & Akiyama (2017) Abdurro’uf, & Akiyama, M. 2017, Monthly Notices of the Royal Astronomical Society, 469, 2806, doi: 10.1093/mnras/stx936
- Abdurro’uf et al. (2021) Abdurro’uf, Lin, Y.-T., Wu, P.-F., & Akiyama, M. 2021, ApJS, 254, 15, doi: 10.3847/1538-4365/abebe2
- Arnouts et al. (2002) Arnouts, S., Moscardini, L., Vanzella, E., et al. 2002, Monthly Notices of the Royal Astronomical Society, 329, 355, doi: 10.1046/j.1365-8711.2002.04988.x
- Barnes & Hernquist (1996) Barnes, J. E., & Hernquist, L. 1996, ApJ, 471, 115, doi: 10.1086/177957
- Bertin (2011) Bertin, E. 2011, in Astronomical Society of the Pacific Conference Series, Vol. 442, Astronomical Data Analysis Software and Systems XX, ed. I. N. Evans, A. Accomazzi, D. J. Mink, & A. H. Rots, 435
- Bothwell et al. (2010) Bothwell, M. S., Chapman, S. C., Tacconi, L., et al. 2010, Monthly Notices of the Royal Astronomical Society, 405, 219, doi: 10.1111/j.1365-2966.2010.16480.x
- Brammer (2023) Brammer, G. 2023, grizli, 1.8.2, Zenodo, Zenodo, doi: 10.5281/zenodo.7712834
- Brammer et al. (2008) Brammer, G. B., Dokkum, P. G. v., & Coppi, P. 2008, ApJ, 686, 1503, doi: 10.1086/591786
- Briggs (1995) Briggs, D. S. 1995, in American Astronomical Society Meeting Abstracts, Vol. 187, 112.02
- Calzetti et al. (2000) Calzetti, D., Armus, L., Bohlin, R. C., et al. 2000, ApJ, 533, 682, doi: 10.1086/308692
- Carilli et al. (2010) Carilli, C. L., Daddi, E., Riechers, D., et al. 2010, ApJ, 714, 1407, doi: 10.1088/0004-637X/714/2/1407
- Carnall et al. (2018) Carnall, A. C., McLure, R. J., Dunlop, J. S., & Davé, R. 2018, Monthly Notices of the Royal Astronomical Society, 480, 4379, doi: 10.1093/mnras/sty2169
- Casey et al. (2023) Casey, C. M., Kartaltepe, J. S., Drakos, N. E., et al. 2023, ApJ, 954, 31, doi: 10.3847/1538-4357/acc2bc
- Chabrier (2003) Chabrier, G. 2003, PASP, 115, 763, doi: 10.1086/376392
- Clark et al. (2016) Clark, C. J. R., Schofield, S. P., Gomez, H. L., & Davies, J. I. 2016, Monthly Notices of the Royal Astronomical Society, 459, 1646, doi: 10.1093/mnras/stw647
- Conway et al. (1990) Conway, J. E., Cornwell, T. J., & Wilkinson, P. N. 1990, MNRAS, 246, 490
- Cornwell (2008) Cornwell, T. J. 2008, IEEE J. Sel. Top. Signal Process., 2, 793, doi: 10.1109/JSTSP.2008.2006388
- Daddi et al. (2015) Daddi, E., Dannerbauer, H., Liu, D., et al. 2015, A&A, 577, A46, doi: 10.1051/0004-6361/201425043
- Dekel & Burkert (2014) Dekel, A., & Burkert, A. 2014, Monthly Notices of the Royal Astronomical Society, 438, 1870, doi: 10.1093/mnras/stt2331
- Dekel et al. (2009a) Dekel, A., Sari, R., & Ceverino, D. 2009a, ApJ, 703, 785, doi: 10.1088/0004-637X/703/1/785
- Dekel et al. (2023) Dekel, A., Tziperman, O., Sarkar, K. C., et al. 2023, Monthly Notices of the Royal Astronomical Society, 521, 4299, doi: 10.1093/mnras/stad855
- Dekel et al. (2009b) Dekel, A., Birnboim, Y., Engel, G., et al. 2009b, Nature, 457, 451, doi: 10.1038/nature07648
- Ding et al. (2021) Ding, X., Birrer, S., Treu, T., & Silverman, J. D. 2021, arXiv e-prints, arXiv:2111.08721, doi: 10.48550/arXiv.2111.08721
- Elbaz et al. (2018) Elbaz, D., Leiton, R., Nagar, N., et al. 2018, A&A, 616, A110, doi: 10.1051/0004-6361/201732370
- Freundlich et al. (2013) Freundlich, J., Combes, F., Tacconi, L. J., et al. 2013, A&A, 553, A130, doi: 10.1051/0004-6361/201220981
- Förster Schreiber & Wuyts (2020) Förster Schreiber, N. M., & Wuyts, S. 2020, ARA&A, 58, 661, doi: 10.1146/annurev-astro-032620-021910
- Genzel et al. (2010) Genzel, R., Tacconi, L. J., Gracia-Carpio, J., et al. 2010, Monthly Notices of the Royal Astronomical Society, 407, 2091, doi: 10.1111/j.1365-2966.2010.16969.x
- González-López et al. (2017) González-López, J., Bauer, F. E., Aravena, M., et al. 2017, A&A, 608, A138, doi: 10.1051/0004-6361/201730961
- Greve et al. (2014) Greve, T. R., Leonidaki, I., Xilouris, E. M., et al. 2014, The Astrophysical Journal, 794, 142, doi: 10.1088/0004-637X/794/2/142
- Hao et al. (2011) Hao, C.-N., Kennicutt, R. C., Johnson, B. D., et al. 2011, ApJ, 741, 124, doi: 10.1088/0004-637X/741/2/124
- Hernquist (1989) Hernquist, L. 1989, Nature, 340, 687, doi: 10.1038/340687a0
- Ilbert et al. (2006) Ilbert, O., Arnouts, S., McCracken, H. J., et al. 2006, A&A, 457, 841, doi: 10.1051/0004-6361:20065138
- Johnson et al. (2018) Johnson, H. L., Harrison, C. M., Swinbank, A. M., et al. 2018, Monthly Notices of the Royal Astronomical Society, 474, 5076, doi: 10.1093/mnras/stx3016
- Kashino et al. (2019) Kashino, D., Silverman, J. D., Sanders, D., et al. 2019, ApJS, 241, 10, doi: 10.3847/1538-4365/ab06c4
- Kennicutt (1998a) Kennicutt. 1998a, ApJ, 498, 541, doi: 10.1086/305588
- Kennicutt (1998b) Kennicutt, R. C. 1998b, ARA&A, 36, 189, doi: 10.1146/annurev.astro.36.1.189
- Koekemoer et al. (2007) Koekemoer, A. M., Aussel, H., Calzetti, D., et al. 2007, ApJS, 172, 196, doi: 10.1086/520086
- Koekemoer et al. (2011) Koekemoer, A. M., Faber, S. M., Ferguson, H. C., et al. 2011, ApJS, 197, 36, doi: 10.1088/0067-0049/197/2/36
- Lackner et al. (2014) Lackner, C. N., Silverman, J. D., Salvato, M., et al. 2014, ApJ, 148, 137, doi: 10.1088/0004-6256/148/6/137
- Le Bail et al. (2023) Le Bail, A., Daddi, E., Elbaz, D., et al. 2023, arXiv e-prints, arXiv:2307.07599, doi: 10.48550/arXiv.2307.07599
- Lin et al. (2022) Lin, L., Ellison, S. L., Pan, H.-A., et al. 2022, ApJ, 926, 175, doi: 10.3847/1538-4357/ac4ccc
- Liu et al. (2015) Liu, D., Gao, Y., Isaak, K., et al. 2015, ApJL, 810, L14, doi: 10.1088/2041-8205/810/2/L14
- Liu et al. (2021) Liu, D., Daddi, E., Schinnerer, E., et al. 2021, ApJ, 909, 56, doi: 10.3847/1538-4357/abd801
- Lotz et al. (2008) Lotz, J. M., Davis, M., Faber, S. M., et al. 2008, ApJ, 672, 177, doi: 10.1086/523659
- Magdis et al. (2012) Magdis, G. E., Daddi, E., Béthermin, M., et al. 2012, ApJ, 760, 6, doi: 10.1088/0004-637X/760/1/6
- Masters et al. (2019) Masters, D. C., Stern, D. K., Cohen, J. G., et al. 2019, ApJ, 877, 81, doi: 10.3847/1538-4357/ab184d
- Mihos & Hernquist (1994) Mihos, J. C., & Hernquist, L. 1994, ApJL, 431, L9, doi: 10.1086/187460
- Moreno et al. (2021) Moreno, J., Torrey, P., Ellison, S. L., et al. 2021, MNRAS, 503, 3113, doi: 10.1093/mnras/staa2952
- Murphy et al. (2011) Murphy, E. J., Condon, J. J., Schinnerer, E., et al. 2011, ApJ, 737, 67, doi: 10.1088/0004-637X/737/2/67
- Puglisi et al. (2019) Puglisi, A., Daddi, E., Liu, D., et al. 2019, ApJL, 877, L23, doi: 10.3847/2041-8213/ab1f92
- Puglisi et al. (2021) Puglisi, A., Daddi, E., Valentino, F., et al. 2021, MNRAS, 508, 5217, doi: 10.1093/mnras/stab2914
- Rizzo et al. (2023) Rizzo, F., Roman-Oliveira, F., Fraternali, F., et al. 2023, The ALMA-ALPAKA survey I: high-resolution CO and [CI] kinematics of star-forming galaxies at z = 0.5-3.5, arXiv. http://arxiv.org/abs/2303.16227
- Rodighiero et al. (2011) Rodighiero, G., Daddi, E., Baronchelli, I., et al. 2011, ApJL, 739, L40, doi: 10.1088/2041-8205/739/2/L40
- Sanders et al. (1988) Sanders, D. B., Soifer, B. T., Elias, J. H., et al. 1988, ApJ, 325, 74, doi: 10.1086/165983
- Schmidt (1959) Schmidt, M. 1959, ApJ, 129, 243, doi: 10.1086/146614
- Schreiber et al. (2018) Schreiber, N. M. F., Renzini, A., Mancini, C., et al. 2018, ApJS, 238, 21, doi: 10.3847/1538-4365/aadd49
- Scoville et al. (2007) Scoville, N., Abraham, R. G., Aussel, H., et al. 2007, ApJS, 172, 38, doi: 10.1086/516580
- Scoville et al. (2016) Scoville, N., Sheth, K., Aussel, H., et al. 2016, ApJ, 820, 83, doi: 10.3847/0004-637X/820/2/83
- Scoville et al. (2023) Scoville, N., Faisst, A., Weaver, J., et al. 2023, ApJ, 943, 82, doi: 10.3847/1538-4357/aca1bc
- Silverman et al. (2015a) Silverman, J. D., Daddi, E., Rodighiero, G., et al. 2015a, ApJL, 812, L23, doi: 10.1088/2041-8205/812/2/L23
- Silverman et al. (2015b) Silverman, J. D., Kashino, D., Sanders, D., et al. 2015b, ApJS, 220, 12, doi: 10.1088/0067-0049/220/1/12
- Silverman et al. (2018a) Silverman, J. D., Rujopakarn, W., Daddi, E., et al. 2018a, ApJ, 867, 92, doi: 10.3847/1538-4357/aae25e
- Silverman et al. (2018b) Silverman, J. D., Daddi, E., Rujopakarn, W., et al. 2018b, ApJ, 868, 75, doi: 10.3847/1538-4357/aae64b
- Solomon et al. (1997) Solomon, P. M., Downes, D., Radford, S. J. E., & Barrett, J. W. 1997, ApJ, 478, 144, doi: 10.1086/303765
- Speagle et al. (2014) Speagle, J. S., Steinhardt, C. L., Capak, P. L., & Silverman, J. D. 2014, ApJS, 214, 15, doi: 10.1088/0067-0049/214/2/15
- Tacconi et al. (2020) Tacconi, L. J., Genzel, R., & Sternberg, A. 2020, Annual Review of Astronomy and Astrophysics, 58, 157, doi: 10.1146/annurev-astro-082812-141034
- Tacconi et al. (2013) Tacconi, L. J., Neri, R., Genzel, R., et al. 2013, ApJ, 768, 74, doi: 10.1088/0004-637X/768/1/74
- Tacconi et al. (2018) Tacconi, L. J., Genzel, R., Saintonge, A., et al. 2018, ApJ, 853, 179, doi: 10.3847/1538-4357/aaa4b4
- Tadaki et al. (2020) Tadaki, K.-i., Belli, S., Burkert, A., et al. 2020, ApJ, 901, 74, doi: 10.3847/1538-4357/abaf4a
- Teodoro & Fraternali (2015) Teodoro, E. M. D., & Fraternali, F. 2015, MNRAS, 451, 3021, doi: 10.1093/mnras/stv1213
- Valentino et al. (2020) Valentino, F., Daddi, E., Puglisi, A., et al. 2020, A&A, 641, A155, doi: 10.1051/0004-6361/202038322
- Weaver et al. (2022) Weaver, J. R., Kauffmann, O. B., Ilbert, O., et al. 2022, ApJS, 258, 11, doi: 10.3847/1538-4365/ac3078
- Whitaker et al. (2012) Whitaker, K. E., Dokkum, P. G. v., Brammer, G., & Franx, M. 2012, ApJL, 754, L29, doi: 10.1088/2041-8205/754/2/L29
- Wisnioski et al. (2019) Wisnioski, E., Schreiber, N. M. F., Fossati, M., et al. 2019, ApJ, 886, 124, doi: 10.3847/1538-4357/ab4db8
- Übler et al. (2018) Übler, H., Genzel, R., Tacconi, L. J., et al. 2018, ApJL, 854, L24, doi: 10.3847/2041-8213/aaacfa